SUPPORTING REPORT (1)
ANNEX 7 : OUTFALL TREATMENT

i
THE STUDY ON STORM WATER DRAINAGE PLAN FOR THE COLOMBO METROPOLITAN REGION
INTHE DEMOCRATIC SOCIALIST REPUBLIC OF SRI LANKA
FINAL REPORT
VOLUME III : SUPPORTING REPORT (1)
ANNEX 7 : OUTFALL TREATMENT
TABLE OF CONTENTS
Page
CHAPTER 1 NATURAL CONDITIONS
1.1 Sea Conditions.................................................................................................A7-1 1.1.1 General Condition of Southwest Coast..............................................A7-1 1.1.2 Tide Level..........................................................................................A7-1 1.1.3 Principal Tidal Constituents...............................................................A7-2 1.1.4 Currents .............................................................................................A7-3 1.1.5 Wave..................................................................................................A7-3 1.1.6 Littoral Drift.......................................................................................A7-4 1.1.7 Sediment Supply ................................................................................A7-5 1.1.8 Coastal Jurisdiction............................................................................A7-6
1.2 Discharge in Wellawatta Canal .......................................................................A7-6 1.2.1 Water Level Duration Curve .............................................................A7-6 1.2.2 Discharge Occurrence........................................................................A7-7
CHAPTER 2 OUTFALLS IN THE STUDY AREA
2.1 General ............................................................................................................A7-9 2.2 Present Condition of Outfalls ..........................................................................A7-9
2.2.1 Negombo Lagoon Outfall ..................................................................A7-9 2.2.2 Kelani Ganga Outfall ......................................................................... A7-10 2.2.3 Beira Lake Outfall ............................................................................. A7-10 2.2.4 Unity Place Outfall ............................................................................ A7-11 2.2.5 Wellawatta Outfall............................................................................. A7-11 2.2.6 Dehiwala Outfall................................................................................ A7-13 2.2.7 Lunawa Lake Outfall......................................................................... A7-13 2.2.8 Panadure River Outfall ...................................................................... A7-14 2.2.9 Talpitiya Outfall................................................................................. A7-14
CHAPTER 3 PREVIOUS STUDIES ............................................................... A7-16

ii
CHAPTER 4 RELATION BETWEEN DISCHARGE AND CLOGGING.... A7-23
CHAPTER 5 POSSIBLE COUNTERMEASURES......................................... A7-24
CHAPTER 6 RECOMMENDATIONS
6.1 Wellawatta Outfall .......................................................................................... A7-26 6.2 Dehiwala Outfall.............................................................................................. A7-26 6.3 Lunawa Lake Outfall....................................................................................... A7-26
REFERENCES ........................................................................................................A7-27
iii
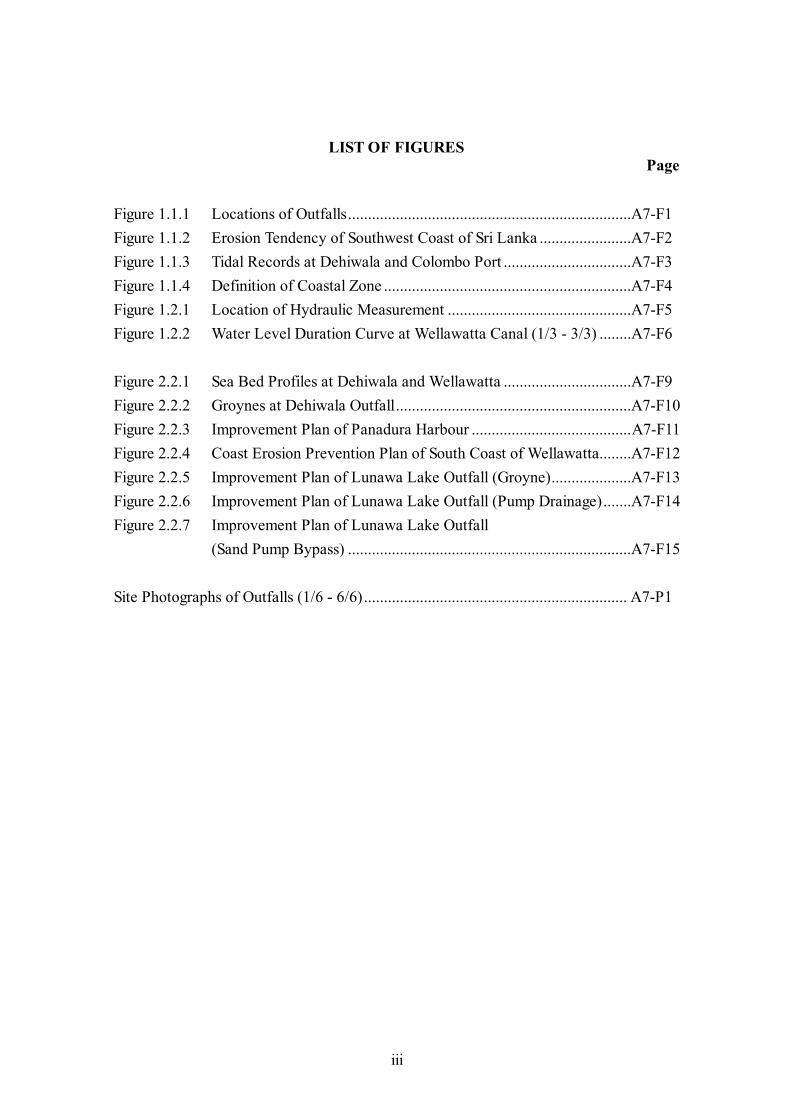
LIST OF FIGURES Page
Figure 1.1.1 Locations of Outfalls.......................................................................A7-F1
Figure 1.1.2 Erosion Tendency of Southwest Coast of Sri Lanka .......................A7-F2
Figure 1.1.3 Tidal Records at Dehiwala and Colombo Port ................................A7-F3
Figure 1.1.4 Definition of Coastal Zone ..............................................................A7-F4
Figure 1.2.1 Location of Hydraulic Measurement ..............................................A7-F5
Figure 1.2.2 Water Level Duration Curve at Wellawatta Canal (1/3 - 3/3) ........A7-F6
Figure 2.2.1 Sea Bed Profiles at Dehiwala and Wellawatta ................................A7-F9
Figure 2.2.2 Groynes at Dehiwala Outfall...........................................................A7-F10
Figure 2.2.3 Improvement Plan of Panadura Harbour ........................................A7-F11
Figure 2.2.4 Coast Erosion Prevention Plan of South Coast of Wellawatta........A7-F12
Figure 2.2.5 Improvement Plan of Lunawa Lake Outfall (Groyne)....................A7-F13
Figure 2.2.6 Improvement Plan of Lunawa Lake Outfall (Pump Drainage).......A7-F14
Figure 2.2.7 Improvement Plan of Lunawa Lake Outfall
(Sand Pump Bypass) .......................................................................A7-F15
Site Photographs of Outfalls (1/6 - 6/6).................................................................. A7-P1

Final Report, Volume III Master Plan
Supporting Report (1) Annex 7, Chapter 1
Nippon Koei Co., Ltd. The Study on Storm Water Drainage Plan
for the Colombo Metropolitan RegionA7 - 1
CHAPTER 1 NATURAL CONDITIONS
1.1 Sea Conditions
The coastline of the study area extends from Negombo in the north to Kalutara in the
south as shown in Figure 1.1.1. The natural conditions of the outfalls in southwest
coast are described as follows.
1.1.1 General Condition of Southwest Coast
The climate of Sri Lanka is classified as tropical monsoon, which is characterized by
northeast monsoons from Bengal Bay and southwest monsoons from the equator. In
the study area, the northeast monsoon brings the dry season, while the southwest
monsoon brings the rainy season.
As for the wave condition, the southwest monsoon from May to September causes
wind waves with a short wave period, while the northeast monsoon causes swell with
a long wave period. Because of this, seasonal change of coastal beach profile is
observed.
Figure 1.1.2, made by the Coast Conservation Department (CCD) in 1988, shows the
coastal erosion tendency on the southwest coast of Sri Lanka. The severe erosion is
observed north of Kelani Ganga, between the stretch of Talpityia - Kalu Ganga and
south of Galle. The littoral drift is northward throughout year.
1.1.2 Tide Level
Tide level has been recorded for the last 100 years at Colombo Port. The tide levels
measured at Colombo Port can be applicable for the study area.
A port datum of low water ordinary spring tides (LWOST) is used for the
hydrographic surveys by Sri Lanka Ports Authority (SLPA) and tide measurements
by Hydrographic Division of SLPA and the National Hydrographic Office (NHO) of
Sri Lanka (e.g. sea chart No.101). The port datum of LWOST is also referred to
Mean Sea Level (MSL) and is defined as a level of 0.4328 m (1.42 ft) below MSL,
the national datum. (0.42 m below MSL according to NHO chart No.101). (Ref /12/,
2000)
An example of offshore tide level was measured at Dehiwala as shown in Figure
1.1.3. (Ref /9/, 2000)
(1) Indian and British Tide Tables
Tidal variations are given in Indian and British Tide Tables (1993) related to LWOST
as follows.

Final Report, Volume III Master Plan
Supporting Report (1) Annex 7, Chapter 1
Nippon Koei Co., Ltd. The Study on Storm Water Drainage Plan
for the Colombo Metropolitan RegionA7 - 2
1) Mean High Water Springs (MHWS) : 0.72 m above MSL
2) Mean High Water Neaps (MHWN) : 0.48 m above MSL
3) Mean Sea Level (MSL) : 0.38 m above MSL
4) Mean Low Water Neaps (MLWN) : 0.30 m above MSL
5) Mean Low Water Springs (MLWS) : 0.06 m above MSL
6) Mean Lower Low Water Springs (MLLWS) : 0.02 m above MSL
(2) Long Term Tendency
Regarding the seasonal sea level change, the maximum storm causes a high level of
about 0.3 m above MSL during a northeast monsoon and a low level of about 0.2 m
below MSL during a southwest monsoon (Figure 1.1.3, Ref/6/, 1997). And
regarding the long term tendency, the present average annual mean sea level is
+0.53m LWOST. That indicates a sea level rise of about 10cm for the last 100 years.
(Ref/12/, 2000)
(3) Lowest and Highest Tides
According to the study on the actual reported tides, the minimum water level is
+0.020 m LWOST and the highest water level is +1.155 m LWOST, and it is
recommended to use a lowest possible water level of -0.1 m and highest possible
water level of +1.2 m LWOST. Consequently, the lowest possible water level
corresponds to 0.53 m below MSL and the highest possible water level to 0.77 m
above MSL.
(4) Revised Tidal Water Levels
The study also relates the important tidal water levels referred to LWOST as follows.
1) Highest Astronomical Tide (HAT) : 0.9 m above MSL
2) Mean High Water Springs (MHWS) : 0.7 m above MSL
3) Mean High Water Neaps (MHWN) : 0.5 m above MSL
4) Mean Low Water Neaps (MLWN) : 0.3 m above MSL
5) Mean Low Water Springs (MLWS) : 0.1 m above MSL
6) Lowest Astronomical Tide (LAT) : 0.1 m below MSL
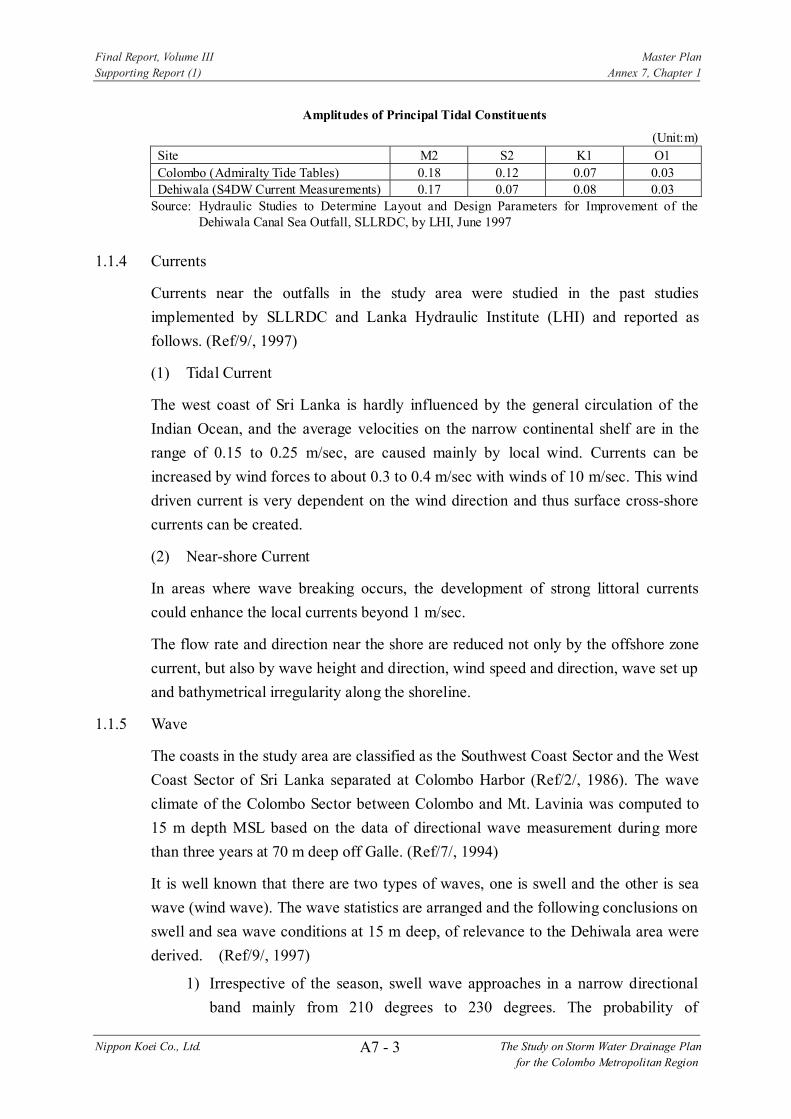
1.1.3 Principal Tidal Constituents
In addition to the main tidal constituents at Colombo Port by Admiralty Tide Tables,
the S4DQ current meter recording yielded the water level variation of Dehiwala
behind the reef (Ref/9/, 1997). The water level range at spring tide is found to be 70
cm and at neap tide about 18 cm. The derived main tidal constituents and Admiralty
Tide Tables for Colombo Port are indicated in the table below. There is not much
variation in tidal constituent amplitudes.
Final Report, Volume III Master Plan
Supporting Report (1) Annex 7, Chapter 1
Nippon Koei Co., Ltd. The Study on Storm Water Drainage Plan
for the Colombo Metropolitan RegionA7 - 3
Amplitudes of Principal Tidal Constituents
(Unit:m)
Site M2 S2 K1 O1
Colombo (Admiralty Tide Tables) 0.18 0.12 0.07 0.03 Dehiwala (S4DW Current Measurements) 0.17 0.07 0.08 0.03
Source: Hydraulic Studies to Determine Layout and Design Parameters for Improvement of the Dehiwala Canal Sea Outfall, SLLRDC, by LHI, June 1997
1.1.4 Currents
Currents near the outfalls in the study area were studied in the past studies
implemented by SLLRDC and Lanka Hydraulic Institute (LHI) and reported as
follows. (Ref/9/, 1997)
(1) Tidal Current
The west coast of Sri Lanka is hardly influenced by the general circulation of the
Indian Ocean, and the average velocities on the narrow continental shelf are in the
range of 0.15 to 0.25 m/sec, are caused mainly by local wind. Currents can be
increased by wind forces to about 0.3 to 0.4 m/sec with winds of 10 m/sec. This wind
driven current is very dependent on the wind direction and thus surface cross-shore
currents can be created.
(2) Near-shore Current
In areas where wave breaking occurs, the development of strong littoral currents
could enhance the local currents beyond 1 m/sec.
The flow rate and direction near the shore are reduced not only by the offshore zone
current, but also by wave height and direction, wind speed and direction, wave set up
and bathymetrical irregularity along the shoreline.
1.1.5 Wave
The coasts in the study area are classified as the Southwest Coast Sector and the West
Coast Sector of Sri Lanka separated at Colombo Harbor (Ref/2/, 1986). The wave
climate of the Colombo Sector between Colombo and Mt. Lavinia was computed to
15 m depth MSL based on the data of directional wave measurement during more
than three years at 70 m deep off Galle. (Ref/7/, 1994)
It is well known that there are two types of waves, one is swell and the other is sea
wave (wind wave). The wave statistics are arranged and the following conclusions on
swell and sea wave conditions at 15 m deep, of relevance to the Dehiwala area were
derived. (Ref/9/, 1997)
1) Irrespective of the season, swell wave approaches in a narrow directional
band mainly from 210 degrees to 230 degrees. The probability of
Final Report, Volume III Master Plan
Supporting Report (1) Annex 7, Chapter 1
Nippon Koei Co., Ltd. The Study on Storm Water Drainage Plan
for the Colombo Metropolitan RegionA7 - 4
occurrence of wave direction is 95% in the Southwest (SW) monsoon (May
to September) and 93% in the off-SW monsoon (October to April).
2) Swell wave height during the SW monsoon is somewhat higher than that
occurring during off-SW monsoon. The average swell wave height is 0.92
m in the SW monsoon and 0.50 m in the off-SW monsoon.
3) About 85% of wind waves come from the direction sector 230 degrees to
280 degrees in the SW monsoon.
4) The wave in the SW monsoon is much higher than that of off-SW monsoon.
The average wind wave height during the SW monsoon is 1.48 m. On the
other hand, nearly 51% of the sea wave heights are below 0.1 m during the
off-SW monsoon.
The analysis of directional wave measurement data from a program conducted at
Chilaw, 80 km north of Colombo, at 11 m water depth during 1995-96, indicated a
considerable percentage of wind waves approaching from the west and northwest
direction. However, these recorded wind waves are quite moderate and it was
concluded that they would have negligible influence on the extreme wave conditions
at Dehiwala (Ref/9/, 1997).
There are near-shore reefs about 150 to 200 m away from the shoreline in front of
most outfalls in the study area. Consequently, the near-shore wave condition is
expected to be heavily influenced and the reef will cause high waves to break on it
and reduce their wave energy. The wave breaking condition is also affected by water
level. The wave height will show a direct dependence on the water level, with the
wave height increasing with the water level. Broken waves stir up sand and littoral
drift is very active in the surf zone.
1.1.6 Littoral Drift
The Master Plan for Coastal Erosion Management reported that the littoral drift was
between 15,000 m3/year and 50,000 m3/year and most likely around 25,000 m3/year
(Ref./2/, 1986).
Also, the CCD study reported the sediment transport rate along the Southwest Coast
of Sri Lanka (Ref./6/, 1992) on the basis of the study of directional wave
measurement at Galle in 1989 to 1992. The wave condition was calculated for every
unit area. The Southwest Coast of Sri Lanka was divided into 13 unit areas. By using
five formulas the northward net littoral drift between Colombo and Mt.Lavinia was
calculated as follows.

Final Report, Volume III Master Plan
Supporting Report (1) Annex 7, Chapter 1
Nippon Koei Co., Ltd. The Study on Storm Water Drainage Plan
for the Colombo Metropolitan RegionA7 - 5
Northward Net Littoral Drift
(Unit: million m3)
Formula Net Transport Engelund /Hansen 0.877 Van. Rijn 0.940 Bijker 0.339 Bailard 0.267 The CERC Method (a=0.014) 0.830
Source: Sediment Transport Study for the Southwest Coast of Sri Lanka, Coast Conservation Project, CCD, by GTZ, May 1992
The CERC (Coastal Engineering Research Center) Method made by
Bagnold/Inman/Komer (1977) is based on field and model measurements and relates
the volumetric sand transport rate along the coast in the breaker zone. This method is
very commonly used.
It was concluded that the most dominant factor is swell. Although the coastline is
eroded frequently by rough sea conditions during the SW monsoon, the change of
coastal profile across the shoreline is temporary and localized. The along shore
transport of material is basically caused by the incessant swell which is considerably
high in the SW monsoon period.
The SLLRDC study reported sediment transport rate at the coastal stretch between
the Wellawatta Outfall and the Dehiwala Outfall (Ref./11/, 1998). Although the
sediment transport rate estimated by numerical model LITPACK module of MIKE 21
is 15,000 m3/year, the report suggested 10,000m3/year.
Regarding the rate of littoral drift, it is very difficult to estimate the actual rate,
although many coastal researchers and engineers have studied it. The most reliable
and standard way to evaluate the rate may be the CERC Method.
1.1.7 Sediment Supply
The Central Environmental Authority carried out the National Sand Study for Sri
Lanka - Phase One (Ref./5/, 1992). Sediment balance of yield and mine was studied
for the Maha Oya basin, the Kelani Ganga, the Kalu Ganga and the adjacent coasts.
Sediment supply to the sea is estimated as follows.
Sediment Supply to the Sea
(Unit: million m3/year)
River Maha Oya Kelani Ganga Kalu Ganga Sediment Yield from the basin 0.2 0.4 0.55 Sand Mining 1.9 0.8 0.3 Sediment Supply to the Coast 0.09 0.16 0.41
Source: National Sand Study for Sri Lanka - Phase One -, Ministry of Foreign Affairs, by NEI, January 1992

Final Report, Volume III Master Plan
Supporting Report (1) Annex 7, Chapter 1
Nippon Koei Co., Ltd. The Study on Storm Water Drainage Plan
for the Colombo Metropolitan RegionA7 - 6
It is reported that the abstraction of sand far exceeds the production in the basin of
the Maho Oya and Kelani Ganga. The situation is less serious in the Kalu Ganga.
Mining on the beach is reported as 0.1 million m3/year and the whole mining
operations are estimated at 2.75 million m3 in total during the past 20 years.
1.1.8 Coastal Jurisdiction
For the purpose of coast conservation, CCD has defined the coastal zone. All
activities in the coastal zone should have permission of CCD. The definition of
coastal zone is shown in Figure 1.1.4 (Ref./10/, 1997).
1.2 Discharge in Wellawatta Canal
1.2.1 Water Level Duration Curve
(1) Available Data
After the construction of groynes and removal of clogging at Dehiwala Outfall early
in 2001, Wellawatta Outfall was reversely clogged during dry season. This may be
because most of the discharge through the Wellawatta Outfall flew into the Dehiwala
canal.
Water level has been measured at the Wellawatta Canal and the flow velocity was
measured for some floods. However, these measurement locations are obviously in
the tidal reaches. The data obtained should be treated carefully, especially during low
discharge or the dry season.
There are some other water level gauging stations and rainfall gauging stations
around the Dehiwala Canal and Wellawatta Canal. The water level gauging stations
and the rainfall gauging stations are listed below and their locations are shown in
Figure 1.2.1.
1) Water Level Gauging Stations
Serpentine Canal - Lesley Ramagala Mwatha Bridge
Kotte North Canal - Sri Jayawardenapura Mawatha Bridge
Kirillapone Canal - Near Open University Bridge
Torrington Canal - Railway Bridge
Wellawatta Canal - Galle Road Bridge
Dehiwala Canal - Galle Road Bridge
Heen Ela - Kirimandala Mawatha Road Bridge
Kirillapone Canal - Nawala Road Bridge

Final Report, Volume III Master Plan
Supporting Report (1) Annex 7, Chapter 1
Nippon Koei Co., Ltd. The Study on Storm Water Drainage Plan
for the Colombo Metropolitan RegionA7 - 7
2) Rainfall Gauging Stations
Meteorological Observatory in CMC
Ratmalana Station
(2) Water Level Duration Curve
The water level of Wellawatta Canal and daily rainfall at the Meteorological
Observatory in CMC are shown in Figure 1.2.2. Though the water level records are
not complete, a general relation between rainfall and water level can be known.
Most of the flow may have been discharged through the Wellawatta Outfall to the sea
and sometimes through Dehiwala Outfall in heavy storm conditions.
1.2.2 Discharge Occurrence
(1) Correlation Coefficient
To examine applicability of other station’s data to supplement the missing data of the
Wellawatta Canal, correlation coefficients between each hydrological data and water
level of Wellawatta Canal were calculated. The results are shown in the following
table.
Hydrological Correlation
No Location Data Correlation Equation Correlation Coefficient
Rank
1 Serpentine Canal WL Y = 0.5293 X + 0.0868 0.611 4 2 Kotte North Canal WL Y = 0.5360 X + 0.0756 0.654 3 3 Kirillapone Can WL Y = 0.7214 X + 0.0194 0.717 2 4 Torrington Canal WL Y = 0.3701 X + 0.1860 0.531 7 5 Dehiwala Canal WL Y = 0.6343 X + 0.0791 0.600 5 6 Heen Ela WL Y = 0.4378 X + 0.1951 0.534 6 7 Kirillapone (Nawala) WL Y = 0.6087 X + 0.0652 0.845 1 8 CMC Rainfall Y = 0.0015 X + 0.3338 0.146 8 9 Ratmalana Station Rainfall Y = 0.0010 X + 0.3368 0.105 9
Note: WL: Water Level (MSL) Rainfall: Daily Rain (mm) X: Hydrological Data of Each Station Y: Water Level of Wellawatta (MSL)
From this table, it is seen that the best correlation for Wellawatta is Kirillapone
(Nawala) and Kirillapone, and there is no correlation with daily rainfall data.
Kirillapone Canal is located just upstream of Wellawatta Canal. When heavy flood
occurred, the flow of Kirillapone Canal was occasionally diverted to Dehiwala
Canal.
(2) Substitution of Missing Data
Measurement of the water level at Wellawatta Canal was started in June 1995. As the
data are interrupted, it is necessary to substitute from other data with the best

Final Report, Volume III Master Plan
Supporting Report (1) Annex 7, Chapter 1
Nippon Koei Co., Ltd. The Study on Storm Water Drainage Plan
for the Colombo Metropolitan RegionA7 - 8
correlation. The best correlative station with Wellawatta Canal is Kirillapone
(Nawala), but the measurement there was started in March 2000. The other available
data are those of Kirillapone where the measurement was started in June 1995.
(3) Discharge Frequency
Although a stage-discharge curve in this tidal reach canal is difficult to usecorrectly,
the following discharge occurrence was presumed from the annual duration curve of
water level.
Discharge Frequency
(Unit: m3/sec)
Year 1996 1997 1998 1999 75-day discharge 17.16 8.49 8.96 5.33 185-day discharge 10.44 5.76 5.76 3.72 275-day discharge 5.76 2.61 3.34 1.93 355-day discharge 0.00 0.00 0.00 0.00
The flow pattern in 1999 may be the most probable pattern of actual flow considering
the accuracy of the stage-discharge curve in the tidal reach. The base flow during dry
season may be less than 1 m3/sec and the discharge may range from almost zero to
hundreds of liters/sec.
Final Report, Volume III Master Plan
Supporting Report (1) Annex 7, Chapter 2
Nippon Koei Co., Ltd. The Study on Storm Water Drainage Plan
for the Colombo Metropolitan RegionA7 - 9
CHAPTER 2 OUTFALLS IN THE STUDY AREA
2.1 General
The study area is divided into four basins, namely Ja Ela basin, Kalu Oya basin,
Greater Colombo basin and Bolgoda basin. There have been flood inundation
problems mainly because of insufficient flow capacity and partial clogging of outfalls
by sand bars.
The outfalls into the sea in the study area are shown in Figure 1.1.1. The following
nine outfalls facing to the sea are subjects of the Study.
1) Negombo Lagoon Outfall (Ja Ela basin)
2) Kelani Ganga Outfall (Kelani River basin)
3) Beila Lake Outfall (Greater Colombo basin)
4) Unity Place Outfall (Greater Colombo basin)
5) Wellawatta Outfall (Greater Colombo basin)
6) Dehiwala Outfall (Greater Colombo basin)
7) Lunawa Lake Outfall (Independent basin)
8) Panadura River Outfall (Bolgoda basin)
9) Talpitiya Outfall (Bolgoda basin)
2.2 Present Condition of Outfalls
2.2.1 Negombo Lagoon Outfall
Negombo Lagoon Outfall has sufficient width and depth of outfall and is not clogged.
This lagoon is formed by an extension of the sand bar, and will not be clogged
rapidly in the future considering the present condition. There is a development plan
around the lagoon, but Negombo Lagoon itself will be held as the Muthurajawela
Conservation Area by Central Environmental Authority. Photo 1 and Photo 2 show
Negombo Lagoon Outfall and its southern beach.
As the outfall faces to the north, the forces to clog the outfall such as wind, tide flow
and wave are not strong and therefore the outfall is not clogged.

Final Report, Volume III Master Plan
Supporting Report (1) Annex 7, Chapter 2
Nippon Koei Co., Ltd. The Study on Storm Water Drainage Plan
for the Colombo Metropolitan RegionA7 - 10
Possible growth stages of Negombo Lagoon are delineated as follows.
Possible growth stages of Negombo Lagoon
Source: Geological Evolution of the Coastal Zone of Sri Lanka, P.G. Cooray and J. Katupotha , Institute of Fundamental Studies, Kandy, Sri Lanka
2.2.2 Kelani Ganga Outfall
As shown in Photo 3, Kelani Ganga outfall is not clogged. One of the reasons why
Kelani Ganga outfall is not clogged is that flow discharges to flush out the sand bar
at the outfall. Another reason is the location of the outfall, which is situated in the
erosive coastal zone. The existence of Colombo harbor may stop almost all the
littoral drift from the south coast to the north coast.
The north beach of Kelani Ganga is very erosive. At Pegasus beach located about 2.5
km north of Kelani Ganga outfall, detached breakwaters and groynes protect the
beach. The main sediment source may be Kelani Ganga although the sediment from
Kelani Ganga has decreased lately because of sand mining at Kelani River (Ref/4/,
1985, Ref/5/, 1992).
2.2.3 Beira Lake Outfall
There are two outfalls from Beira Lake. One is led to Colombo Harbor by a culvert
and the other to the sea directly. The outfall to Colombo harbor has no clogging
problem.
Growth of sand spit northwards from
Mutwal and formation of Muthurajawela
Closing up of cuspate forelands and
formation of Muthurajawela ‘lake’ and
northward extension of the barrier spit
Filling up of the lake to form
Muthurajawela swamp and northward
extension of spit forming Negombo
Lagoon
I
II
III
Final Report, Volume III Master Plan
Supporting Report (1) Annex 7, Chapter 2
Nippon Koei Co., Ltd. The Study on Storm Water Drainage Plan
for the Colombo Metropolitan RegionA7 - 11
Another outfall to the sea is called the Beira Lake outfall. The water level of Beira
Lake is kept high by a weir and sluice gate. The overflow water is discharged into the
sea under the Galle Face road. The outfall is not clogged. The outfall would not
easily become clogged as long as the water level of the outfall is higher than the sand
built-up by wave force. The Beira Lake outfall is shown in Photo 4 and Photo 5.
2.2.4 Unity Place Outfall
There are many coastal protections of stone masonry or boulders at the west stretch
of Colombo. Big boulders are placed on the coast along the railway.
Photo 6 shows Unity Place outfall, which is a concrete flume of 4 m wide with an L
shape. The outfall is not clogged. This is because the coast from Wellawatta outfall to
Colombo harbor is erosive so that the beach face is very narrow or of almost no
width at all.
As the seabed profile is steep on the northward coast of Wellawatta outfall, as shown
in Figure 2.2.1, the littoral drift from the south may have dropped into the sea so that
the littoral drift is not strong enough to clog the outfall.
2.2.5 Wellawatta Outfall
Before construction of the groynes at Dehiwala outfall, the Wellawatta outfall had
been opened throughout the year. However, the Wellawatta outfall has been clogged
during the dry season since the construction of the groynes. Photos 7-9 show the
Wellawatta outfall in November 2001.
Two groynes about 30 m long and up to depth of about 1.0 m below MSL have been
constructed at Wellawatta outfall as shown in Photo 7. After the construction of
Dehiwala outfall, the groyne at Wellawatta was modified to an L-shape (Photo 20).
(1) Coast around the Outfall
Sand beach is seen at the south coast of the outfall as shown in Photo 8. Though the
coast of this area may be erosive according to past studies, the coast could retain the
beaches because of the protection offered by the groynes at Wellawatta outfall.
The coast is protected by boulders north of Wellawatta outfall, and the sand beach
can not be seen as shown in Photo 9.
The depth of the outfall is about 0.5 to 1.0 m and the predominant size of the
riverbed material is about 1 mm.
As for the sea conditions south of Wellawatta outfall, the surf zone is seen more than
100 m offshore from the coastline, and there is a shipwreck.

Final Report, Volume III Master Plan
Supporting Report (1) Annex 7, Chapter 2
Nippon Koei Co., Ltd. The Study on Storm Water Drainage Plan
for the Colombo Metropolitan RegionA7 - 12
On the other hand, the surf zone is not seen at the northern beach in December and
waves break at a point very near shoreline. However, during the SW monsoon, the
waves are high and a surf zone is seen offshore. The condition of surf zone is
different between the northern and southern coasts of Wellawatta outfall.
(2) No Clogging Condition
Before the construction of groyne at Dehiwala outfall in December 2001, the outfall
at Wellawatta had not been clogged for a long time. It is said, generally in Japan, that
a training jetty at the outfall should be extended so as to cross over the width of the
littoral drift and the depth should be more than 3 m to allow river flow throughout the
year. From this, the front depth of groyne at Wellawatta outfall is much too shallow
and might have been clogged sometimes.
Although the explanation of the mechanism that has prevented the outfall from
becoming clogged is very difficult, it is conceivable it is as follows.
1) Morphological condition
One of the reasons for no clogging may be the morphological characteristic of
the outfall. The beach, including the outfall, was originally located in the
erosive zone.
Predominant direction of the littoral drift is northward, and the beach profile is
steeper at the northern beach of Wellawatta outfall as shown in Figure 2.2.1.
The offshore surf zone that is seen off the south beach is not seen off the north
beach in December. The width of littoral drift is not as wide off the northern
beach. During the off-SW monsoon, the littoral drift from the south might be
shifted to the deep sea off the northern coast and there may be almost no
sediment deposited along the northern coast. During the SW monsoon, the
littoral drift will be able to transport solids to the northern coast and a small
sand beach will be formed and the coast line will be maintained to a certain
extent.
2) Flow condition
Another reason may be the existence of a certain quantity of river flow. The
catchment area of Wellawatta canal is a part of the Greater Colombo basin and
most of the runoff from the Greater Colombo basin is discharged from
Wellawatta outfall. According to the discharge measurement carried out on 27
and 28 May 1993 by SLLRDC and LHI, the flow discharge was 2.8 m3/sec near
the Dehiwala outfall and 16.0 m3/sec to 16.3 m3/sec near the Wellawatta outfall.
The ratio of discharge of Wellawatta canal is about 85% of total discharge.

Final Report, Volume III Master Plan
Supporting Report (1) Annex 7, Chapter 2
Nippon Koei Co., Ltd. The Study on Storm Water Drainage Plan
for the Colombo Metropolitan RegionA7 - 13
(3) Present Condition
After the construction of the groyne at Dehiwala outfall the Wellawatta outfall was
clogged during the dry season. The obvious fact is that the flow quantities of both
Wellawatta Canal and the Dehiwala Canal are not sufficient.
2.2.6 Dehiwala Outfall
(1) Sea Condition
In the off-SW monsoon in November, the offshore surf zone is not seen at the
southward coast of the outfall, but is seen at the northward coast in the offshore more
than 100 m from shoreline and the offshore surf continues up to Wellawatta outfall.
In the SW monsoon, when the waves are high the offshore breaker zone is seen along
the whole coastal stretch around the Dehiwala and the Wellawatta outfalls. The
sediment transportation is very active and the sand bar at the outfall is easily formed.
(2) Conditions before Construction of the Groyne
Dehiwala outfall has been clogged by the sand bar throughout the year before the
construction of the groyne. This is because the activity of the waves is very active
and also the quantity of river flow is inadequate to flush out the sand bar. The
condition may be similar for the other outfalls in the study area .
Photo 11 shows the beach north of Dehiwala Outfall in November 2001. As shown in
the photograph there was a beach but it was narrow.
(3) Construction of the Groyne
The construction of the groyne at Dehiwala outfall was proposed in the study of 1988.
(Ref./3/, 1988) After various studies and discussions the present groyne was
constructed and the sand bar formed at the outfall was breached in early 2002. The
shape of the groyne is shown in Figure 2.2.2. The groyne extends to a depth of about
1.0 m below MSL. Photos 10 and 21 show the groyne at Dehiwala outfall.
The groyne size was planned so as to minimize the coastal impact. The coastal
revetment was also constructed to protect the beach north of the outfall.
2.2.7 Lunawa Lake Outfall
Lunawa Lake outfall is characterized by continuous clogging due to sand bar
formation. The outfall must now be opened regularly by human power. There exists a
sand beach across the outfall.
Because of the small catchment area of 10.26 km2, the ordinary flow through the
outfall is low and the wave action to form sand bar is very active. The outfall is

Final Report, Volume III Master Plan
Supporting Report (1) Annex 7, Chapter 2
Nippon Koei Co., Ltd. The Study on Storm Water Drainage Plan
for the Colombo Metropolitan RegionA7 - 14
always exposed to the menace of clogging due to strong wave activity to form a sand
bar and the insufficiency of flow.
When the water level of Lunawa Lake rises to 1.2 m above MSL, the sand bar is
excavated by manpower. After the sand bar is excavated, the lake water level drops
to mean sea level within 24 hours, and a few days later, the outfall is clogged again.
The situation after the excavation is shown in Photos 13 to 15.
During the off-SW monsoon, the surf zone is restricted to the shoreline vicinities and
the offshore surf zone is not seen along either the north or south coasts. This means
that a major part of the activity of the littoral drift may be restricted to the shoreline
vicinities.
In the SW monsoon, the surf zone near shore is wider than that in the off-SW
monsoon due to high waves.
2.2.8 Panadura River Outfall
For small fishing boats, there is an anchorage at the Panadura outfall. The waterway
of Panadura River has not been clogged due to the groyne and is kept open by
dredging.
According to the staff of the fishery harbor, the situation was as follows.
Panadura outfall was completely covered with sand until the Irrigation Department
constructed a rubble mound structure on the southern side of the outfall in 1982.
Under the harbor construction project this structure was extended and a groyne was
constructed at the harbor entrance of 80 m. The depth at the entrance is around 4 m
below MSL.
Though the northern beach of the Panadura outfall is erosive, there exists a sand
beach. The source of sedimentation may be Panadura River. Photo 18 shows the
northern beach of the Panadure outfall.
A large part of the littoral drift near the shoreline from the south might be trapped at
the groyne.
Photos 16 and 17 show the Panadura outfall. The present condition of Panadura
anchorage is shown in Figure 2.2.3. (Ref./8/, 1997)
2.2.9 Talpitiya Outfall
The Talpitiya outfall is usually clogged. Residents living around the outfall stated
that they have not been affected by floods resulting from clogging since 1994. Also
Final Report, Volume III Master Plan
Supporting Report (1) Annex 7, Chapter 2
Nippon Koei Co., Ltd. The Study on Storm Water Drainage Plan
for the Colombo Metropolitan RegionA7 - 15
they stated that people breach the sand bar by manpower during severe flood. The
clogging of Talpitiya outfall is not serious.
The littoral drift passes to north across the outfall. Photo 19 shows the Talpitiya
outfall.
South Bolgoda Lake is connected to the sea through the Kalu Ganga and does not
have a clogging problem.

Final Report, Volume III Master Plan
Supporting Report (1) Annex 7, Chapter3
Nippon Koei Co., Ltd. The Study on Storm Water Drainage Plan
for the Colombo Metropolitan RegionA7 - 16
CHAPTER 3 PREVIOUS STUDIES
Because of the importance of the sea outfalls, detailed investigations and studies
were carried out by authorities concerned in the past. Among them, the following
studies are related to the present Study.
(1) Master Plan - Coast Erosion Management - Volume 4 (South West Coast),
Coast Conservation Department and DANIDA/Danish Hydraulic Institute,
August 1986
1) Outline
In this master plan the erosion tendencies of the west and southwest coasts of
Sri Lanka are shown in Figure 1.1.2. The stretch north from Kelani Ganga is
defined as West Coast sector. On the other hand, the stretch south from Kelani
Ganga up to Galle is defined as the Southwest Coast Sector. This figure is made
based on interviews and not by actual measurement. The report pointed out that
further detailed study was necessary.
2) Results
a) Colombo District
Medium Term Recommendation
Early implementation of the coastal conservation plan proposed by
CCD was recommended.
Long Term Recommendation
The future needs depend to a large extent on hinterland requirements;
Colombo North: Development plan for Crow Island.
Colombo - Mt. Lavinia: The construction of a third railway track or
coastal road on the seaside is proposed.
b) Kalutara District
Medium Term Recommendation
Construction and maintenance of groyne systems were recommended
north and south of the Kalutara Barriers. Further work would have to
be done in cooperation with the Irrigation Department with Fishery
Harbors Cooperation.
Long Term Recommendation
The investigation on chronological change of the beach between
Moganna Heads and Panadura River is proposed.

Final Report, Volume III Master Plan
Supporting Report (1) Annex 7, Chapter3
Nippon Koei Co., Ltd. The Study on Storm Water Drainage Plan
for the Colombo Metropolitan RegionA7 - 17
(2) Study of The Canal and Drainage System in Colombo, SLLRDC and WS
Atkins International in association with GKW Consult and RDC Limited,
December 1988
1) Outline
Improvement of canals and drainage systems in Colombo.
2) Results
The following proposal was made on the outfall clogging of Dehiwala Canal
and Wellawatta Canal.
The following Option-a) or Option-b) is recommended and CCD will issue a
permit to extend or construct groynes only if:
Option-a) the effect of groynes have to be thoroughly studied utilizing an
outfall model and proven not to cause erosion problems or
Option-b) a guarantee is given that coastal conservation measures such as sea
shore protection walls are carried out, if coastal erosion occurred
after construction of groynes.
Option-a) will be best from the engineering point of view, but it requires
considerable time and cost. The Option-b) is estimated at Rs. 15 million and
would be easily accepted. The Option a) will not exceed Rs. 30 million.
Consequently, the following recommendations were made.
Clearing of the sand banks by manpower or machine at Wellawatta
Canal, Dehiwala Canal and Mutwal Tunnel outfalls and observation of
the time of re-clogging and a study on methods to keep the required
opening for outfall discharge.
Determination of the required extension/construction of groynes at
Dehiwala and Wellawatta Canal outfalls on the basis of the above data.
Early decision whether outfall modeling (Option-a) or eventual
conservation measures (Option-b) should be adopted. If the outfall
modeling is preferred, it should be made at least one year before
construction of groynes.
Repair and extension of the existing groynes at Wellawatta Canal
outfall.
Construction of new groynes at Dehiwala Canal outfall.
Implementation of maintenance programs for continuous opening of all
three outfalls.

Final Report, Volume III Master Plan
Supporting Report (1) Annex 7, Chapter3
Nippon Koei Co., Ltd. The Study on Storm Water Drainage Plan
for the Colombo Metropolitan RegionA7 - 18
(3) Beach Protection Investigations - Pegasus Reef Hotel, Carson Cumberbatch &
Co., Ltd. and LHI, July 1985
1) Outline
Beach profile survey, sand sampling and analysis of grain size distribution and
float tracking were conducted to protect the erosive beach, which is located 2.5
km north of Kelani Ganga outfall and is 200m long.
2) Results
The following remedial measures were proposed.
To restore the old rubble mound groyne and construct a new curved
groyne,
To fill in an artificial beach between the two groynes,
To measure the wave run-up line and the water line every second month.
(4) Directional wave climate study, Southwest Coast of Sri Lanka, CCD-GTZ
Coast Conservation Project, May 1994
1) Outline
A buoy for wave measuring was installed 8 km south off Galle Harbor in about
70 m of water depth in February 1989. The measurements were carried out for
three and a half years despite of some failure of the data transfer. The
directional wave buoy had a total weight of 700 kg and diameter of 2.5 m.
2) Results
Based on directional wave measurement, wave statistics have been computed at
15 m below MSL for 13 different coastal stretches between Colombo and
Matara including Wellawatta and Dehiwala outfall. These data were used as
wave conditions in the studies on the outfalls.
(5) Investigations for Panadura Anchorage, ADB Fisheries Sector Development
Project Implementation Unit Ceylon Fishery Harbors Corporation and LHI,
July 1997
1) Outline
Panadura anchorage is located at the outfall of Panadura River. The objective of
the study was to improve the performance as an anchorage for small fishing
boats. A field measurement program, one-dimensional hydrodynamic tidal
modeling and near-shore wave propagation modeling were conducted.

Final Report, Volume III Master Plan
Supporting Report (1) Annex 7, Chapter3
Nippon Koei Co., Ltd. The Study on Storm Water Drainage Plan
for the Colombo Metropolitan RegionA7 - 19
2) Results
The following staged improvement was proposed as shown in Figure 2.2.3.
Existing Level: Depth at entrance is 1.5 m. The anchorage is
accessible 61 days in the SW monsoon period without
wave breaking.
Stage-1: Comprised of option-1, rock blasting at the outfall,
dredging to a depth at the entrance of 2.0 m and
construction of breakwaters. Estimated cost is Rs. 67
million. This is expected to yield 83 accessible days.
Stage-2: Comprised of option-2 and dredging. The depth at
entrance is 2.5 m. Estimated cost is Rs. 50 million and
would allow access 112 days.
Stage-3: Comprised of option-3 and dredging. The depth at
entrance is 3.0 m. Estimated cost is Rs. 55 million and
would allow access 129 days.
For the most optimum solution would be rock blasting at the entrance, the
construction of breakwaters in option-1 and dredging the harbor basin and river
channel. Based on the observation of Stage - 1 work, option-2 could be initiated
with suitable modifications as stage - 2. The implementation of Stage-3, i.e.
option-3, would not be feasible because of the following reasons.
Severe impact on the northern coastline of the harbor;
Heavy expenditure that would be required;
Marginal gain in the number of accessible days.
(6) Hydraulic Studies to Determine Layout and Design Parameters for
Improvement of the Dehiwala Canal Sea Outfall, SLLRDC and LHI, July 1997
1) Outline
There were detailed descriptions about the model of tide flow, wave
propagation and sand drift. The results of field survey were also taken into the
models. As for the facility arrangement obtained from modeling, coastal
impacts were investigated and mitigation measures were recommended.
Alternatives, indicative costs and coastal impacts were also discussed.
2) Results
The recommended and alternative plans were proposed. Also, periodical sand
replenishment every two years utilizing the sand to be trapped at the south of
Dehiwala was recommended for the possible erosion after the construction of

Final Report, Volume III Master Plan
Supporting Report (1) Annex 7, Chapter3
Nippon Koei Co., Ltd. The Study on Storm Water Drainage Plan
for the Colombo Metropolitan RegionA7 - 20
groyne. Monitoring of the coast should be considered necessary and the sand
replenishment plan should be made according to the results of the monitoring.
a) Recommended Plan
The recommended plan is to bend the groyne to northward at right
angle to the shoreline after extension of 86 m offshore.
The volume of sedimentation supposed to be trapped south of Dehiwala
was estimated at about 100,000 m3. It would take about ten years until
the sand drift starts bypassing across the Dehiwala outfall from south to
north. The riverbed should be excavated and maintained at 1.2 m below
MSL to allow access of small boats.
b) Alternative Plan
An alternative plan was also suggested to mitigate the coastal impact.
The length of the alternate groyne is 30 m shorter than the
recommended one. The volume of the sediment deposit at the south of
Dehiwala would be about 52,000 m3. It would take three to five years
before the sand drift starts bypassing. The access of small boats
throughout the year would not be possible due to insufficient water
depth.
c) Cost Evaluation
The costs for the recommended plan were estimated at Rs. 16.6 million
for the construction of the groyne, Rs. 3 million for a coastal revetment
100 m long and Rs. 35 million for sand by-passing every two years for
about ten years.
The costs for the alternative plan were also estimated at Rs. 12 million
for the construction of the groyne, Rs. 3 million for the coastal
revetment and Rs. 35 million for sand by-passing every two years for
five to six years.
d) Conclusion
After a meeting with SLLRDC, it was decided to adopt the alternative
plan and take mitigation measures against the coastal impact. The
layout of the alternative plan is shown in Figure 2.2.2.
(7) Dehiwala Outfall Study, Coastal Impact Mitigatory Measures, SLLRDC and
LHI, June 1998
1) Outline
For the alternative plan suggested in June 1997, further analysis was conducted
and mitigation measures for coastal impact between Wellawatta and Dehiwala
were studied.

Final Report, Volume III Master Plan
Supporting Report (1) Annex 7, Chapter3
Nippon Koei Co., Ltd. The Study on Storm Water Drainage Plan
for the Colombo Metropolitan RegionA7 - 21
2) Results
To protect the Kinross Beach located south of Dehiwala, alternative plans were
studied.
a) Alternative-1 (Sand replenishment south of Dehiwala outfall)
Sand replenishment was proposed along the north coast of Dehiwala
with 50,000 m3 of sand that would be trapped before or during the
construction of the groyne south of Dehiwala. A coast revetment of
about 120 m was also proposed.
b) Alternative-2 (Beach protection of Kinross Beach)
This alternative is to protect Kinross Beach south of Wellawatta by
stone or gabion revetment along the beach. In addition, the revetment
between Dehiwala and Wellawatta outfall would have to be
rehabilitated.
c) Alternative-3 (Detached breakwater and extension of the groyne with
sand replenishment)
This alternative expects formation of a tombolo of sand by a 50 m
extension of the groyne and construction of a detached breakwater of
55 m.
Before or during the construction of the groyne at Dehiwala, 30,000 m3
of sand would be trapped there and 80,000 m3 in total would be used
for sand replenishment. This would also improve the drainage
condition of Wellawatta outfall.
d) Alternative-4 (Extension of the groyne in an L-shape with sand
replenishment)
This alternative is to extend the existing groyne about 70 m with an
L-shape as shown in Figure 2.2.4 and the volume of sand deposit was
estimated at about 15,000 m3. A total sand volume of 60,000 m3 is
necessary. This alternative is also useful not only to protect the coast
but also to maintain drainage of Wellawatta outfall.
e) Cost Evaluation
Alternative-1 costs Rs. 19 million, Alternative-2 Rs. 17.5 million,
Alternative-3 Rs. 41 million and Alternative-4 Rs. 29.5 million.
f) Conclusion
After a discussion between SLLRDC and LHI, alternative-4 was
adopted as a suitable option considering both functional and
economical reasons.

Final Report, Volume III Master Plan
Supporting Report (1) Annex 7, Chapter3
Nippon Koei Co., Ltd. The Study on Storm Water Drainage Plan
for the Colombo Metropolitan RegionA7 - 22
(8) Improvement to Lunawa Sea Outfall-Final Report, SLLRDC and LHI, January
2001
1) Outline
For further improvement of Lunawa Lake outfall in addition to excavation by
manpower, field surveys such as topography and sounding surveys were
conducted and four plans were proposed.
2) Results
The outfall of Lunawa Lake is excavated by manpower every four to five days.
The following four alternatives were proposed for improvement.
Periodical excavation by machine.
Construction of a groyne Figure 2.2.5
Pump drainage Figure 2.2.6
Sand by-pass by sand pump Figure 2.2.7
It was concluded that more detailed study would be necessary to select the best
alternative.

Final Report, Volume III Master Plan
Supporting Report (1) Annex 7, Chapter 4
Nippon Koei Co., Ltd. The Study on Storm Water Drainage Plan
for the Colombo Metropolitan RegionA7 - 23
CHAPTER 4 RELATION BETWEEN DISCHARGE AND CLOGGING
Generally, factors to determine minimum discharge needed to keep an outfall open
may be the tidal range, tidal prism, width of the river, the length of the sand bar along
the flow, the elevation of the sand bar, grain size, etc. As the mechanism of clogging
has not been clear yet, a method to calculate the minimum discharge has not been
established so far.
Two examples in Japan on the minimum discharge to keep the outfall open are
reported as follows. (Ref./1/, 1978)
(1) Kobe River
The outfall of Kobe River is located in the Hyogo Prefecture. The bed material is
sand. Mean diameter is 0.06 to 0.1 cm. The width of the outfall is about 300 m to
400m.
When the flow discharge is more than 10 m3/sec the outfall is not clogged
irrespective of sea condition. Therefore a minimum unit flow of 25 to 30 liters/sec/m
is necessary to keep the outfall open irrespective of sea condition.
(2) Syokotsu River
The outfall of Syokotsu River is located in Hokkaido. The bed material is sand. Mean
diameter is 0.1 cm mixed with gravel under 50 mm size. The length of the sand bar
measured along the flow is about 100 m to 130 m. It is said that the flow discharge
necessary to keep the outfall open irrespective of sea condition is more than 10 to 14
m3/sec. Minimum unit flow of 20 liters/sec/m is necessary to keep the outfall open
irrespective of sea condition.
Based on these reports, it can be said that the unit flow of 20 to 30 liters/sec/m is
necessary to keep the outfall with a bed material size of 0.05 to 0.1 cm in diameter
open irrespective of sea condition.
If this relation is adopted to the Wellawatta Canal, the minimum flow discharge to
keep the outfall open is 0.5 m3/sec to 0.75 m3/sec. As for the Dehiwala Canal, it is
0.30 m3/sec to 0.45 m3/sec. These values seem to be larger than the actual flow of the
Wellawatta Canal and Dehiwala Canal.
This indicates that it may be difficult to keep both outfalls of the Wellawatta Canal
and Dehiwala Canal open under the present condition.

Final Report, Volume III Master Plan
Supporting Report (1) Annex 7, Chapter 5
Nippon Koei Co., Ltd. The Study on Storm Water Drainage Plan
for the Colombo Metropolitan RegionA7 - 24
CHAPTER 5 POSSIBLE COUNTERMEASURES
The conceivable countermeasures to keep the outfall open are listed as follows.
(1) Jetty
The construction of a jetty is the most common method and there are many examples.
It is constructed with one or two jetties at approximately right angles to the coastline.
1) Characteristics
The objectives of jetties are a) to fix the location of river mouth, b) to stabilize
the watercourse, and c) to maintain the water depth at the river mouth.
In planning the jetty, it is necessary to carefully consider the purpose of the
structure. The river mouth can be kept open by flushing out the sand bar with
sufficient tractive force.
2) Remarks
It makes it easy for waves to intrude into the river and erosion at the
downstream side of the littoral drift will occur. If the water depth at the top of
the jetty is insufficient, the river mouth may become clogged.
(2) Box Culvert
A box culvert is sometimes constructed at the river mouth of a small basin.
1) Characteristics
The box culvert is placed at the river mouth under the sand bar, and it is
necessary to keep the flow irrespective of the sand bar. Generally, the box
culvert is planned when the planned discharge is small and the river water level
is relatively high compared with the sea level.
2) Remarks
It is necessary to pay attention to local wave scouring at the top of the box
culvert and also to clogging by the littoral drift.
(3) Excavation
Unnatural excavation is of two types. One is to excavate the river mouth on a large
scale to maintain the flow and cross-sectional area of river semi permanently. The
other is to partly excavate the sand bar to make it easy to flush and flow over it in
flood time.

Final Report, Volume III Master Plan
Supporting Report (1) Annex 7, Chapter 5
Nippon Koei Co., Ltd. The Study on Storm Water Drainage Plan
for the Colombo Metropolitan RegionA7 - 25
1) Characteristics
It is necessary to monitor whether the river section is maintained or not,
because it will be easily re-clogged by waves and sand from upstream of the
river.
In small rivers the river is often clogged and the water level rises up to the
elevation of the sand bar, and sometimes higher than the flood level. It is
necessary to breach the sand bar by manpower or machine according to the
condition of the river mouth.
2) Remarks
It is not recommended to adopt this method for a large river, because before the
flood season comes the excavated river mouth will be re-clogged with a sand
bar formed by the big waves. This example is seen in Japan facing the Pacific
Ocean, which is often attacked by Typhoons.
(4) Sluice Gate
A sluice gate should be planned referring to practices in similar rivers where the
basin scale sand bar and sand size are similar to the outfall to be treated.
1) Characteristics
There are two purposes for sluice gate construction. One is to store the water in
the river channel and to flush out the sand bar at the river mouth. The other is to
flush out the sand bar by gate operation expecting local scour by wave action in
front of the gate. Further, the gate sometimes has other purposes such as to
prevent the intrusion of salt water, waves and high tide, and to maintain the
water level in the river.
2) Remarks
Hydraulic model tests and actual operation tests after the construction are
necessary. If a big sand bar is formed on the upper or lower sides of the gate, it
should be removed.
(5) Other methods
Besides the above, the following measures are conceivable for outfall treatment; a)
raising the river bank, b) construction of a tailrace, c) pump drainage, and d)
construction of a dam. Those measures are to be adopted at the river mouth according
to the characteristics and purpose of each basin and river mouth.

Final Report, Volume III Master Plan
Supporting Report (1) Annex 7, Chapter 6
Nippon Koei Co., Ltd. The Study on Storm Water Drainage Plan
for the Colombo Metropolitan RegionA7 - 26
CHAPTER 6 RECOMMENDATIONS
From the viewpoint of outfall treatment for storm water drainage in the present Study,
the followings are recommended for the Wellawatta, Dehiwala and Lunawa Lake
outfalls, which are important for storm water drainage in their own basins.
6.1 Wellawatta Outfall
At Wellawatta outfall, the outfall had been kept open throughout the year and there
was no serious problem of clogging. However, since July 2002, after construction of
the groynes for of Dehiwala outfall, clogging of the Wellawatta outfall has been
observed. It is thought that the natural discharge is not sufficient to keep the outfall
open throughout the year. In November, the sand bar formed during the dry season
was flushed out and the Wellawatta outfall is being kept open during rainy season.
From this fact, the clogging of the outfall during the dry season may be automatically
removed by the flow during the rainy season. It is recommended to continue
monitoring the behavior of the Wellawatta and Dehiwala outfalls.
If the sand bar formulation is excessively large, removal before the rainy season is
recommended.
6.2 Dehiwala Outfall
The groynes were constructed at Dehiwala Outfall in June 2002. According to the
report (Ref./11/, 1998), the sizes of the groynes are minimized to avoid coastal
impact as much as possible. As of October 2002, the Dehiwala outfall has been kept
open even during dry season because the flow discharge at the outfall after
construction of the groynes was increased and made stable although the flow
discharge at the Wellawatta outfall was decreased and resulted in clogging of that
outfall.
However, the long-term tendency of both outfalls and the coastal impacts by
construction of the groynes cannot be clearly recognized as the groynes were just
completed in June 2002. Therefore, it is necessary to continue monitoring of the
behavior of the outfalls and surrounding coasts.
6.3 Lunawa Lake Outfall
At Lunawa Lake outfall, the sand bar formed has been periodically removed by
manpower. It will not be so troublesome to continue this method. If it is preferable to
adopt natural measures such as a groyne, further study will be necessary, referring to
the conceivable plans suggested in the Study of Improvement to the Lunawa Sea
Outfall of January 2001 (Ref /13/, 2001).

Final Report, Volume III Master Plan
Supporting Report (1) Annex 7, Chapter 6
Nippon Koei Co., Ltd. The Study on Storm Water Drainage Plan
for the Colombo Metropolitan RegionA7 - 27
REFERENCES
(1) Estuary Treatment [1], Report No.1394, the Public Works Research Institute
(PWRI; Japan), May 1978
(2) Master Plan – Coastal Erosion Management (Volume 4: Southwest Coast), by
the Coast Conservation Department and Dania-Danish Hydraulic Institute,
February 1986
(3) Study of the Canal and Drainage System in Colombo, SLLRDC, by WS Atkins
International in association with GKW Consult and RDC Limited, December
1988,
(4) Beach Protection Investigation - Pegasus Reef Hotel, Carson Cumberbatch &
Co. LTD, by LHI, July 1985
(5) National Sand Study for Sri Lanka - Phase One -, Ministry of Foreign Affairs,
by NEI, January 1992
(6) Sediment Transport Study for The Southwest Coast of Sri Lanka, Coast
Conservation Project, CCD, by GTZ, May 1992
(7) Directional Wave Climate Study, Southwest Coast of Sri Lanka, CCD-GTZ
Coast Conservation Project, May 1994
(8) Investigation for Panadura Anchorage, ADB Fisheries Sector Project, Project
Implementation Unit, Ceylon Fishery Harbours Corporation, by LHI, April
1997
(9) Hydraulic Studies to Determine Layout and Design Parameters for
Improvement of the Dehiwala Canal Sea Outfall, SLLRDC, by LHI, June 1997
(10) Revised Coastal Zone Management Plan, Coast Conservation Department,
October 1997
(11) Dehiwala Outfall Study - Coastal Impact Mitigatory Measures, SLLRDC, by
LHI, June 1998
(12) Colombo Port South Harbour Development Project, Feasibility Study,
Preliminary Engineering Study, Sri Lanka Ports Authority, by Maunsell
McIntyre Pty Ltd etc., November 2000
(13) Improvement to Lunawa Sea Outfall, SLLRDC, by LHI, January 2001
(14) Action Plan For the Control of Pollution in the Greater Colombo Canal System,
Greater Colombo Flood Control and Environment Improvement Project –
Phase 2 -, Volume , Data Book, SLLRDC, February 2001

Figures


Source: Master-Plan - Coast Erosion Management - Volume 4 (South West Coast), Coast Conservation Department and Denida-Denish Hydraulic Institute, February 1986
South
-West C
oast S
ecto
r
The Study on Storm Water Drainage Planfor the Colombo Metropolitan Region
in the Democratic Socialist Republic of Sri LankaJAPAN INTERNATIONAL COOPERATION AGENCY
Figure 1.1.2 Erosion Tendency of Southwest Coast of Sri Lanka
N
0 10 20 30 40 50 kmScale
A7 - F2

A7 - F3
JAPAN INTERNATIONAL COOPERATION AGENCY
Figure 1.1.3 Tidal Records at Dehiwala and Colombo Port
The Study on Storm Water Drainage Plan for the Colombo Metropolitan Region
in the Democratic Socialist Republic of Sri Lanka
Tidal Record at Offshore of Dehiwala
Source: Hydraulic Studies to Determine Layout and Design Parameters for Improvement of the Dehiwala
Canal Sea Outfall, SLLRDC, June 1997)
Tidal Record at Colombo Port
Source: Sediment Transport Study for The Southwest Coast of Sri Lanka, CCD, May 1992)

A7 - F4
JAPAN INTERNATIONAL COOPERATION AGENCY
Figure 1.1.4 Definition of Coastal Zone
The Study on Storm Water Drainage Plan for the Colombo Metropolitan Region
in the Democratic Socialist Republic of Sri Lanka
Source: Sediment Revised Coastal Zone Management Plan, CCD, October 1997

A7 - F5
JAPAN INTERNATIONAL COOPERATION AGENCY
Figure 1.2.1 Location of Hydraulic Measurement
The Study on Storm Water Drainage Plan for the Colombo Metropolitan Region
in the Democratic Socialist Republic of Sri Lanka
Source: Action Plan For the Control of Pollution in the Greater Colombo Canal System., Greater Colombo Flood Control and Environment Improvement Project – Phase 2 -, Volume , Data Book, SLLRDC, February 2001

Daily rain and water level at Wellawatta (1995)
Daily rain and water level at Wellawatta (1996)
Figure 1.2.2Water Level Duration Curve at Wellawatta Canal (1/3) (1995 and 1996)
JAPAN INTERNATIONAL COOPERATION AGENCY
The Study on Storm Water Drainage Plan
for the Colombo Metropolitan Region
in the Democratic Socialist Republic of Sri Lanka
A7 - F6

Daily rain and water level at Wellawatta (1997)
Daily rain and water level at Wellawatta (1998)
Figure 1.2.2
Water Level Duration Curve at Wellawatta Canal
(2/3) (1997 and 1998)JAPAN INTERNATIONAL COOPERATION AGENCY
The Study on Storm Water Drainage Planfor the Colombo Metropolitan Region
in the Democratic Socialist Republic of Sri Lanka
A7 - F7

Daily rain and water level at Wellawatta (1999)
Daily rain and water level at Wellawatta (2000)
Figure 1.2.2Water Level Duration Curve at Wellawatta Canal (3/3) (1999 and 2000)
JAPAN INTERNATIONAL COOPERATION AGENCY
The Study on Storm Water Drainage Plan
for the Colombo Metropolitan Region
in the Democratic Socialist Republic of Sri Lanka
A7 - F8

Source: Dehiw
ala Outfall Study, C
oastal Impact M
itigatory Measures, SL
LR
DC
, June 1998
The Study on Storm
Water D
rainage Plan
for the Colom
bo Metropolitan R
egionin the D
emocratic Socialist R
epublic of Sri Lanka
JAPA
N IN
TE
RN
AT
ION
AL
CO
OP
ER
AT
ION
AG
EN
CYA7 - F
9
Figure 2.2.1
Sea B
ed Profiles at D
ehiwala and W
ellawatta

Source: H
ydraulic Studies to Im
prove Dehiw
ala Canal O
utfall, Lanka H
ydraulic Institute Ltd., A
ugust 1997
N
The Study on Storm
Water D
rainage Plan
for the Colom
bo Metropolitan R
egionin the D
emocratic Socialist R
epublic of Sri Lanka
JAPA
N IN
TE
RN
AT
ION
AL
CO
OP
ER
AT
ION
AG
EN
CYA7 - F
10
Figure 2.2.2
Groynes at D
ehiwala O
utfall

(not
yet
)(d
isca
rded
)
Source: Investigations for Panadura Anchorage, April 1997, ADB Fisheries Sector Development Project Implementation Unit Ceylon Fishery Harbours Corporation, by LHI
The Study on Storm Water Drainage Planfor the Colombo Metropolitan Region
in the Democratic Socialist Republic of Sri LankaJAPAN INTERNATIONAL COOPERATION AGENCY
A7 - F11
Figure 2.2.3Improvement Plan of Panadura Harbour
Recommended