1
SUPPLY- AND DEMAND-SIDE EFFECTS IN PERFORMANCE APPRAISALS:
THE ROLE OF GENDER AND RACE*
Iris Bohnet
Oliver P. Hauser
Ariella Kristal
Abstract:
Performance reviews in firms are common but controversial. Managers’ subjective
appraisals of their employees’ performance and employees’ self-evaluations might be affected by
demographic characteristics, interact with each other as self-evaluations are typically shared with
managers before they decide (“anchoring”), and these supply-side and demand-side dynamics
may contribute to gender or race differences in performance ratings. Analyzing the data of a
multi-national financial services firm, we find that supply-side effects were mostly driven by
gender: women (particularly, women of color) gave themselves lower self-ratings. Demand-side
effects were shaped by gender and race: holding self-evaluations constant, managers lowered the
ratings of female and White employees less, reversing the gender gap in ratings induced by the
supply side for Whites but introducing a race gap. The race-based demand-side effects were
particularly pronounced in the US, negatively affecting Black, Asian and Latinx employees.
Counterfactual simulations suggest that 22-28% of Black employees’ ratings would have to be
increased for this race gap to disappear. Finally, we evaluate a potential intervention. In 2016, a
quasi-exogenous shock led to self-evaluations not being shared with managers before they
appraised employees. While this disruption of supply-side influences led to “de-anchoring” with
lower average manager ratings, it generally did not change any gender or race dynamics, as these
were mostly shaped by demand-side factors. A possible exception were employees of color hired
in 2016: when managers were not anchored by self-ratings (and were unaffected by previous
years), the race gap disappeared for women (but not for men) of color.
JEL Codes: D90, D91, J71, M14 *Bohnet: Harvard Kennedy School, Cambridge, MA, USA. Hauser: Department of Economics, University of Exeter, Exeter, UK. Kristal: Harvard Business School, Cambridge, MA, USA. Correspondence should be addressed to: Iris Bohnet, Harvard Kennedy School, 79 JFK Street, Cambridge, MA 02138; email: [email protected]; phone: +1(617)495-5605. We thank participants in seminars at Carnegie Mellon University, the Center for Economic and Policy Research, Harvard University, and the University of California Berkeley’s Science of Diversity and Inclusion Initiative for their helpful comments, and Pivotal Ventures and the UKRI Future Leaders Fellowship for their generous support.

2
I. INTRODUCTION
Annual performance reviews are common. They are part of organizations’ efforts towards
merit-based performance management systems that measure, incentivize and reward employees’
contributions to the organization. In a 2014 survey conducted by the Society of Human Resource
Management, 97 percent of organizations reported conducting formal performance appraisals
(Society of Human Resource Management, 2014). Often, performance appraisals are directly
linked to compensation, promotion, work allocation and termination decisions (Castilla 2008,
2015; Dobbin et al. 2015).
Performance reviews are controversial. Performance is rarely measurable objectively in
complex work environments. Subjective performance appraisals that rely on evaluations made by
managers—i.e., the demand side—are prone to various evaluation biases, including those based
on demographic characteristics (Bertrand and Mullainathan 2004; Castilla 2008, 2015; Wynn et
al. 2018; Kessler, Low & Sullivan, 2019). Such biases are of concern to firms as they can lead to
organizational inefficiency and social inequity, disadvantaging people who do not conform with
prevalent stereotypes and advantaging those who look the part but might not be the highest
performers (Bohnet 2016).
In addition to these demand-side dynamics, the supply side—i.e., the employees
themselves—might also contribute to differences in final performance scores through their self-
evaluations. In many performance appraisal systems, employees’ self-evaluations are shared with
managers before they make up their minds. Final performance scores assigned by managers are
likely due to some true indication of performance, supply-side factors affecting employee self-

3
evaluations that in turn may also influence or “anchor” manager ratings,1 and demand-side
factors impacting manager assessments. Disentangling the causes of differences in final
performance scores—to the extent possible given that all evaluations are subjective—helps
diagnose potential problems and inform how they might be addressed.
Working with a multi-national financial services firm headquartered in the United States,
we explore the determinants of performance ratings with a special focus on the two dimensions
in employee demographic characteristics available to us, gender and race. We start by focusing
on the complete dataset for all countries in which the firm operates and employ a binary
definition of race comparing Whites and “people of color”. To analyze race at a more granular
level, including interactions between gender and different racial groups, we then take a closer
look at the firm’s home market, the United States, where we have the most complete race self-
categorization data and which comprises about half of the workforce.
Understanding whether gender or race differences in final performance scores are mostly
driven by supply-side or by demand-side effects helps inform policy and predict the expected
impact of a policy change on various groups’ final performance scores. We evaluate such a
change in policy, taking advantage of a quasi-exogenous shock to this firm’s performance
appraisal process normally employed (we refer to this as “standard years”). In 2016 (the “non-
standard year”), without the employees’ or managers’ prior knowledge, the firm experienced a
time crunch due to factors unrelated to the process at hand and was unable to share self-
1 In particular, in ambiguous situations, experts ranging from real estate agents to legal professionals have been shown to be influenced by (often irrelevant) information provided to them—an “anchor”—before they made an expert judgment (Tversky and Kahneman 1974, for a review, Furnham and Boo 2011). Anchoring effects have also been found in hypothetical performance assessments in the laboratory where subjects were informed of another person’s self-assessment (Shore, Adams and Tashchian 1998; Klimoski and Inks 1990) or an example rating before evaluating the other person’s performance (Thorsteinson et al., 2008).
4
evaluations with managers before they appraised their employees. We take as evidence for
demand-side driven gender and race effects if they persist even in the non-standard year 2016
when managers could not be directly anchored by the supply-side. In contrast, we would expect
that any supply-side driven differences disappear in the non-standard year. Thus, we expect the
2016 quasi-exogenous shock to most strongly affect the final performance scores of employees
most impacted by their self-ratings.
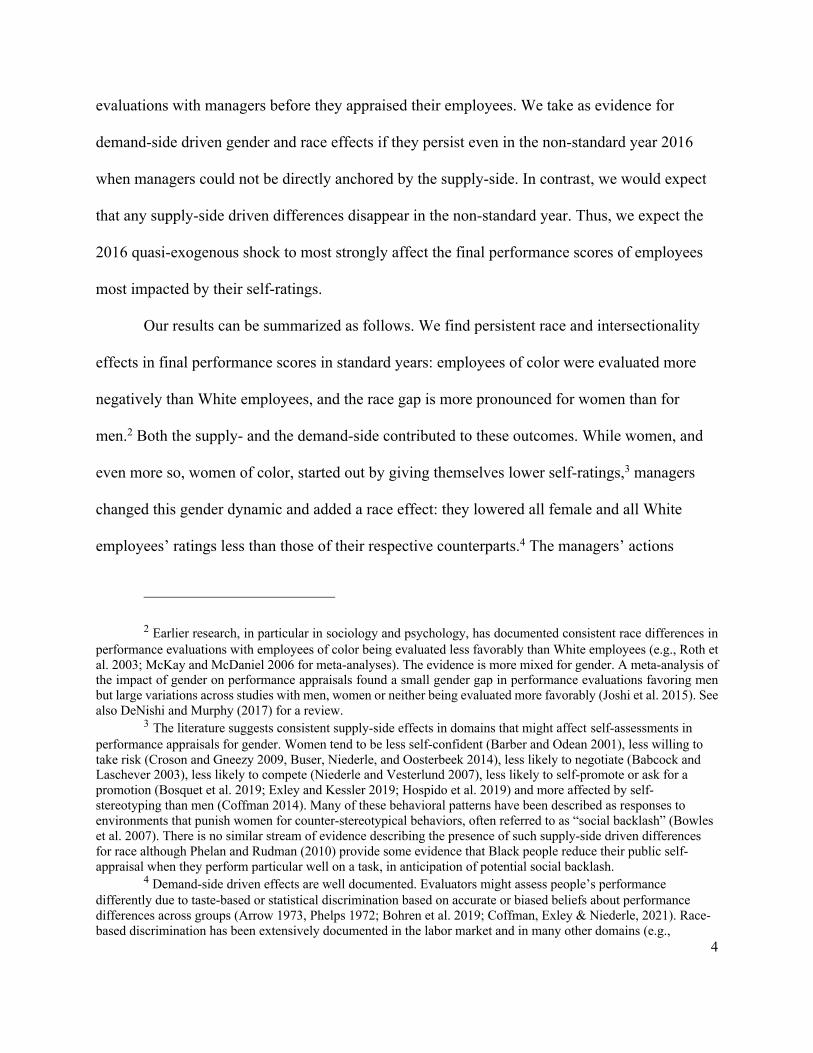
Our results can be summarized as follows. We find persistent race and intersectionality
effects in final performance scores in standard years: employees of color were evaluated more
negatively than White employees, and the race gap is more pronounced for women than for
men.2 Both the supply- and the demand-side contributed to these outcomes. While women, and
even more so, women of color, started out by giving themselves lower self-ratings,3 managers
changed this gender dynamic and added a race effect: they lowered all female and all White
employees’ ratings less than those of their respective counterparts.4 The managers’ actions
2 Earlier research, in particular in sociology and psychology, has documented consistent race differences in performance evaluations with employees of color being evaluated less favorably than White employees (e.g., Roth et al. 2003; McKay and McDaniel 2006 for meta-analyses). The evidence is more mixed for gender. A meta-analysis of the impact of gender on performance appraisals found a small gender gap in performance evaluations favoring men but large variations across studies with men, women or neither being evaluated more favorably (Joshi et al. 2015). See also DeNishi and Murphy (2017) for a review.
3 The literature suggests consistent supply-side effects in domains that might affect self-assessments in performance appraisals for gender. Women tend to be less self-confident (Barber and Odean 2001), less willing to take risk (Croson and Gneezy 2009, Buser, Niederle, and Oosterbeek 2014), less likely to negotiate (Babcock and Laschever 2003), less likely to compete (Niederle and Vesterlund 2007), less likely to self-promote or ask for a promotion (Bosquet et al. 2019; Exley and Kessler 2019; Hospido et al. 2019) and more affected by self-stereotyping than men (Coffman 2014). Many of these behavioral patterns have been described as responses to environments that punish women for counter-stereotypical behaviors, often referred to as “social backlash” (Bowles et al. 2007). There is no similar stream of evidence describing the presence of such supply-side driven differences for race although Phelan and Rudman (2010) provide some evidence that Black people reduce their public self-appraisal when they perform particular well on a task, in anticipation of potential social backlash.
4 Demand-side driven effects are well documented. Evaluators might assess people’s performance differently due to taste-based or statistical discrimination based on accurate or biased beliefs about performance differences across groups (Arrow 1973, Phelps 1972; Bohren et al. 2019; Coffman, Exley & Niederle, 2021). Race-based discrimination has been extensively documented in the labor market and in many other domains (e.g.,
5
benefitted White female employees most: despite their lower self-evaluations, they ended up
with the highest final performance scores. Managers’ actions hurt male employees of color most:
despite their higher self-evaluations, they ended up in the group with the lowest final
performance scores. Based on managers’ actions summarized thus far, one might have expected
women of color to be rated more positively than their male counterparts; however, in reality,
they ended up with equally low final ratings as men of color because—in addition to the
demand-side induced beneficial gender and harmful race effects—they were hurt by having
given themselves the lowest self-ratings.
Given that gender and race dynamics were heavily driven by the demand side in standard
years, we expect the 2016 quasi-exogenous shock—the “non-standard” year—to have little
impact overall, with one exception: it might make the supply-side induced gender gaps, most
pronounced for people of color, irrelevant. In the non-standard year, all employees’ average
performance scores were lower, suggesting that some “de-anchoring” from self-ratings took
place, but overall gender and race dynamics remained mostly the same. In addition to the gaps in
final scores being heavily driven by demand-side effects, it was at least in theory possible that
managers could have accessed previous years’ ratings in all years, including in 2016. While we
Bertrand and Mullainathan 2004; Pager and Pedulla 2015; Quilian et al. 2017; Arnold et al. 2020). In sports, for example, the referees’ racial bias affected the likelihood that personal fouls were called in basketball and how pitches were evaluated in baseball (Price and Wolfers 2010; Parsons et al. 2011). Pitchers adjusted to these incentives in the United States, as did minority cashiers in grocery stores with biased managers in France (Glover et al. 2017). Gender-based discrimination has also been studied widely. For example, Goldin and Rouse (2000) showed that female musicians were discriminated against in orchestra auditions when evaluators knew their gender, Moss-Racusin et al. (2012) that science faculty evaluated male applicants for a lab manager positions more highly than otherwise identical female applicants, Bohnet et al. (2016) that high-performing women and men were overlooked for counter-stereotypical tasks when evaluated separately, and Quadlin (2018) that employers used gendered standards for job applicants looking for competence in men and likability in women. For a review, see Bertrand and Duflo (2017).
6
have no data on how many managers in fact consulted prior ratings, we find some evidence that
they might have in particular done so in 2016: the “shadow of the past”—i.e. their own past
evaluation of the employee—was correlated more with their current year’s rating of the
employee in the non-standard year than in standard years.
In order to rule out the impact of previous years’ ratings, we take a closer look at
employees during their first year of employment in the firm, the “newcomers,” for whom there
are no past evaluations. Comparable to our complete sample, most manager ratings assigned to
newcomers were lower in the non-standard than in the standard year—with one exception:
women of color. Without the self-ratings present as anchors, women of color were evaluated
more positively than men of color. The latter group was hurt most by employers neither having
their high self-evaluations nor the higher ratings from previous years available and ended up with
worse manager ratings than any other group.
While our analysis first focuses on the global gender and race dynamics, race data is
missing for many countries. To examine race effects more thoroughly, we focus on the United
States where race data is fully available at a relatively granular level. Indeed, a heterogeneity
analysis suggests that our race findings are heavily driven by the US: the difference between
manager and self-ratings was larger for all employee groups of color—including Asian, Black,
Latinx and others—than for the White employee group, suggesting persistent demand-side
effects in standard years. The pattern does not change in the non-standard year. Not sharing self-
evaluations, a supply-side intervention, had no impact in the US, as differences in final
performance scores were heavily driven by demand-side effects. We employ counterfactual
simulations to study the magnitude of these effects in the US. By bootstrapping the US data, we
identify how many employees of color would have to receive a higher manager rating for the gap
7
between White employees and Asian, Black and Latinx employees to close. We estimate that
between 22% and 28% of Black employees would have to receive a boost in manager ratings for
the race gap to close, while fewer than 10-12% of Asian, Latinx and other employees would need
to see their manager rating increase.
Our paper contributes to the literature on performance management by evaluating a
quasi-exogenous shock that could have affected gender and race gaps in performance appraisals.
We suggest that differentiating between supply-side and demand-side driven gaps can help
inform the expected effectiveness of a given process and thus, ultimately, policy design. The
design in question—whether or not self-evaluations were shared with managers before they
made their minds up—had little effect in this firm as the most persistent gap—i.e. the race gap—
in final performance scores was heavily driven by managers, the demand side, and very little by
employees themselves, the supply side. Disrupting the potential impact of the supply-side did,
however, matter overall, lowering all employees’ final scores. The correlation between
employees’ and managers’ ratings was not only due to intrinsic agreement but, at least to some
degree, managers were anchored by their employees’ self-ratings.
In addition, our paper contributes to a growing literature on gender and race dynamics in
the labor market. In contrast to most of the work thus far focusing on job applications,
recruitment and hiring, we take a closer look at processes taking place within the firm that have
been linked to career advancement and pay - performance appraisals. The persistent gaps in
performance appraisals between White people and people of color, in particular Black people in
the US, might contribute to the low representation of Black employees in positions of leadership:
in 2020, 0.6 percent of Fortune 500 CEOs were Black (and 1.8 percent Latinx and 7.0 percent
Asian) and about 7.6 percent of the CEOs were women (Benveniste 2020; Davis 2020; Garcia

8
2020). Our results also suggest better understanding intersectionality effects between gender and
race is warranted (Beal 1969; Rosette and Livingston 2012; Crenshaw 2017).
The remainder of our paper is organized as follows. We first provide some context about
the field site of our study. Then, we present the results for all countries, followed by a closer look
at the United States, and then conclude with a discussion.
II. FIELD CONTEXT
II.A. Firm context and sample
We study the performance data of a global financial services company over four years,
from 2015-2018. The firm is headquartered in the United States and has offices in over 20
countries worldwide. Over this time period 60% of the employees identified as male, 42.9% as
White, 31.6% as a person of color and 25.5% did not disclose their race5 (Table I).
Insert Table I
II.B. The performance appraisal system
In this firm, performance is evaluated on a categorical scale with five choices, from
“needing improvement” (which we code as “1” in our data) to “significantly outperforming”
(coded as “5”).6 In assigning ratings to their employees, managers were encouraged to distribute
5 Disclosure rates of race varied substantially by region, varying from more than 97% disclosed in the Americas to 59% disclosed in EMEA (Europe-Middle East-Africa) to 45% disclosed in APAC (Asia-Pacific), reflecting variations in legal requirements or cultural norms related to identification by and the disclosure of race.
6 The guidance provided to managers gives an overview of what is expected for each category. The highest rating is reserved for employees who significantly exceed high expectations and set new standards for the firm. The next highest rating is reserved for employees who have exceeded expectations and outperformed their peers, while

9
the ratings such that only 5% of employees received the highest (5) and lowest (1) scores each.
Managers were set targets of about 25% of employees receiving a score of 4, 45% receiving a
score of 3, and 20% receiving a score of 2. Figure I shows that, in aggregate, managers generally
produced a distribution of ratings that fit this pattern (blue bars). In contrast, on average,
employees (red bars) were more optimistic about their own performance than their managers.
Insert Figure I
II.C. Standard years and non-standard year
In most years, the “standard years,” employees submitted their self-ratings before
managers evaluated their employees. We include data for three of those years, 2015, 2017 and
2018 during which the performance evaluation process stayed the same. While all other aspects
of the process remained the same, in 2016, which we refer to as the “non-standard year”, the firm
was unable to share employees’ self-evaluations with managers beforehand. In our interviews
with the firm, managers referred to a time crunch due to other factors, not allowing them to
follow standard procedure, and assured us that this was not an intentional move. We examine
performance scores by employees and managers during and before/after this quasi-shock over
the four years where the other features of the process remained unchanged, from 2015-2018.
III. RESULTS: ALL COUNTRIES
the middle rating is for employees who meet or occasionally exceed expectations. The bottom two ratings are for employees who meet most but not all expectations, or fail to meet those expectations and are unlikely to improve.

10
We start by examining our complete data set for all countries, employing binary definitions of
gender and race. We discuss our data by first focusing on “standard years” where self-
evaluations were shared with managers before they assessed the employees and then turning to
the “non-standard year” where they were not.
III.A. Standard Years
In Table II, we present summary statistics of self-ratings and manager ratings, split by
employees’ gender and race and their interaction for all countries across the standard years,
2015, 2017 and 2018.
Insert Table II
Table III examines manager ratings by demographic group in standard years. In order to
introduce the notion and regression structure for the remainder of the paper, Columns 1 and 2
show the estimates for the following simple ordinary least squares (OLS) models, respectively:
𝑚!"#$% = 𝛽& + 𝛽'𝑓! + 𝜀" (1)
𝑚!"#$% = 𝛽& + 𝛽'𝑟! + 𝜀" (2)
The dependent variable, mijlgt, is an ordinal rating of employee i by manager j in job level
l in geographic region g in year t. The manager rating ranges from 1 to 5, where a higher number
indicates the manager’s impression of a better performance of the employee. The dummy
variables, fi and ri, indicate the gender and race of employee i, respectively: fi is 1 if the
employee is female and 0 otherwise, and ri is 1 if the employee is a person of color (i.e. any self-
selected category other than “White”) and 0 otherwise. There are five job-levels (l):

11
administrative assistant, junior level, middle management, junior senior management and senior
management. There are three geographic regions (g): the Americas, APAC (Asia-Pacific), and
EMEA (Europe, Middle East, Africa). Robust standard errors (ej) are clustered at the manager
level.
When only examining gender or race, respectively, we see that female employees
received significantly lower ratings than male employees (Table III, Column 1) and employees
of color received significantly lower ratings than White employees (Column 2). However, once
we account for gender and race together, the gender gap disappears while the magnitude of the
race gap remains relatively unchanged (Column 3). In Column 4, we include interaction effects
(i.e., being a woman of color): while the gender gap remains not significant for White women, a
significant interaction emerges: the race gap is even larger for women than for men.
To ensure robustness of these findings, we add several fixed effects. Manager (qj),
geographic region (qg), job level (ql) and year (𝜃%)fixed effects are included, as rating standards
may differ by individual managers, across geographic regions, between job levels and across
years. Equation (3) presents the full model:
𝑚!"#$% = 𝛽& + 𝛽'𝑓! + 𝛽(𝑟! + 𝛽)𝑓!𝑟! + 𝜃" + 𝜃$ + 𝜃# + 𝜃% + 𝜀" (3)
Table III presents several fixed-effects estimates in Columns 5-8. Once we control for
iteratively more variables, including manager fixed effects (Column 5), regional fixed effects
(Column 6), job-level fixed effects (Column 7) and year fixed effects (Column 8), the gender gap
among White employees reverses with White women being evaluated more favorably than White
men. The gender-race interaction remains significant across specifications: the race gap is larger
for female than for male employees. Across the fixed-effects models, all effect sizes remain
relatively similar.
12
Table A.1 in the Appendix replicates our analysis interacting employee demographics
with manager demographics, finding consistent race effects independent of the manager’s race
and some nuances in the gender dynamics with female managers assigning lower ratings than
male managers, in particular to male employees.
Insert Table III
Manager ratings may be related to supply-side and/or to demand-side factors. We first
focus on the supply-side and examine the relationship between gender and race and employees’
self-ratings in Table IV repeating the same analyses as above with self-ratings on the left-hand
side of the regression.
Female employees gave themselves significantly lower ratings than male employees
(Column 1) as did employees of color compared with their White counterparts (Column 2).
When we account for gender and race simultaneously, we see the same pattern (Column 3);
however, once we control for the interaction between gender and race, we find that the apparent
race gap in self-ratings was driven entirely by women of color (Column 4). There is no
significant difference in self-ratings between White men and men of color. These findings
remain relatively constant, once managerial, regional, job-level and year fixed effects are
accounted for (Columns 5-8).
Insert Table IV
13
To isolate demand-driven gender and race differences in manager scores, we control for
self-ratings. Table V shows that manager ratings are consistently correlated with self-ratings.
However, gender and race effects remain important, suggesting significant demand-side effects
on manager ratings. Controlling for self-ratings, managers lowered female employees’ ratings
less (Column 1) and employees of color’s ratings more than those of their respective counterparts
(Column 2). This pattern holds when controlling for both gender and race (Column 3), the
interaction of gender and race (Column 4), and managerial, regional, job-level and year fixed
effects (Columns 5-8).7
Insert Table V
Figure II illustrates these relationships graphically, plotting the marginal effects of gender
and race, controlling for all fixed-effects in Column 8 in Table III (self-ratings) and Table IV
(manager ratings). Average self-ratings are depicted in red triangles and average manager ratings
in blue circles. Figure II shows that managers lowered all employees’ ratings compared to their
self-ratings. They lowered female employees’ ratings less than male employees’ ratings and
employees of color’s ratings more than White employees’ ratings, thus, reversing the supply-side
induced gender gap in final ratings for White employees and closing it for employees of color.
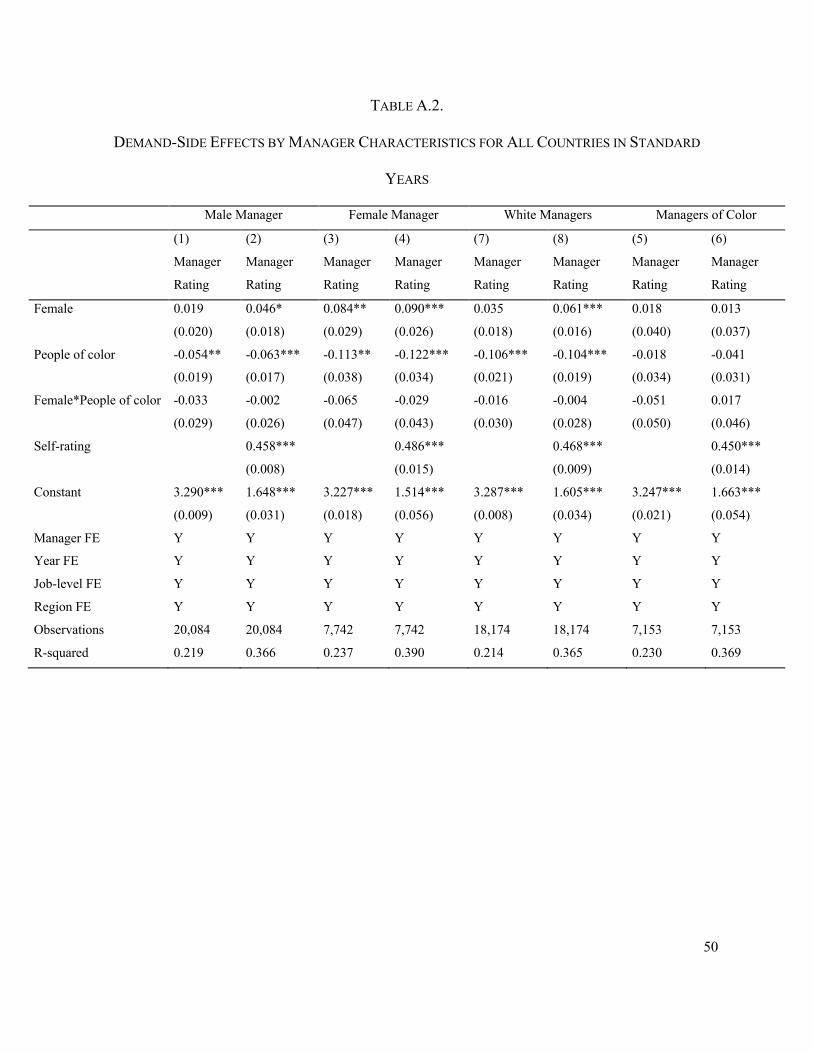
7 Tables A.2 to A.4 in the Appendix take a closer look at heterogeneity and replicate the analyses in Table V for various sub-groups. Table A.2 suggests that the demand-side driven race gap was mostly due White managers, and Table A.3 that the gender and race dynamics were heavily driven by junior employees, our biggest sub-group. Table A.4 suggests that the race dynamics were most pronounced in the Americas, a topic we will explore in more detail below.

14
Managers also introduced a race gap for all, with all employees of color ending up with lower
scores than their White counterparts.
Insert Figure II
III.B. The Non-standard Year
In 2016, the firm experienced a quasi-exogenous shock, whereby managers had to
provide their ratings before having the opportunity to view employees’ self-ratings. While not an
experiment, balancing tests of our samples in the two time periods of interest (Table A.5 in the
Appendix) do not suggest dramatic differences in the composition of employees in standard
years as compared to the non-standard year, giving us some confidence that the company did not
experience any other relevant exogenous shocks that could explain our findings. Specifically,
self-ratings in the standard and the non-standard years did not differ on average, suggesting that
employees were indeed unaware of the change and also did not change their own behavior in
other unexpected ways (even if doing so would not actually have been observed by their
manager before they made up their minds). Nonetheless, as it was not a randomized controlled
trial, general time trends or unobserved characteristics might still affect our results.
In Table VI, we examine whether manager ratings differed in the non-standard year. As
managers did not have self-evaluations available in 2016, we do not include self-ratings. Column
1 confirms that managers assigned lower ratings to employees in the non-standard than in
standard years. The non-standard year did not have differential gender or race effects,
independent of the controls we add (Columns 2-6), suggesting consistent demand-side effects.
Even when managers did not have employee self-evaluations available in 2016, they assigned
15
higher ratings to White female employees than White male employees, and lower ratings to all
employees of color, with the race gap being most pronounced for women.
Insert Table VI
Figure III illustrates estimated manager and self-ratings for standard and non-standard
years graphically, controlling for the fixed effects in Column 6 of Table VI. Self-ratings are
depicted in red triangles and manager ratings in blue circles, showing that managers assigned
lower ratings across all groups in the non-standard year where self-ratings were not available to
them. Otherwise, the gender and race dynamics in the non-standard year are very similar to the
standard years, leaving White women with higher final scores than White men and all employees
of color being evaluated more negatively than White employees.
Insert Figure III
Given that managers’ ratings were significantly lower in the non-standard year, we
conjecture that self-ratings might have had some influence on managers’ ratings in standard
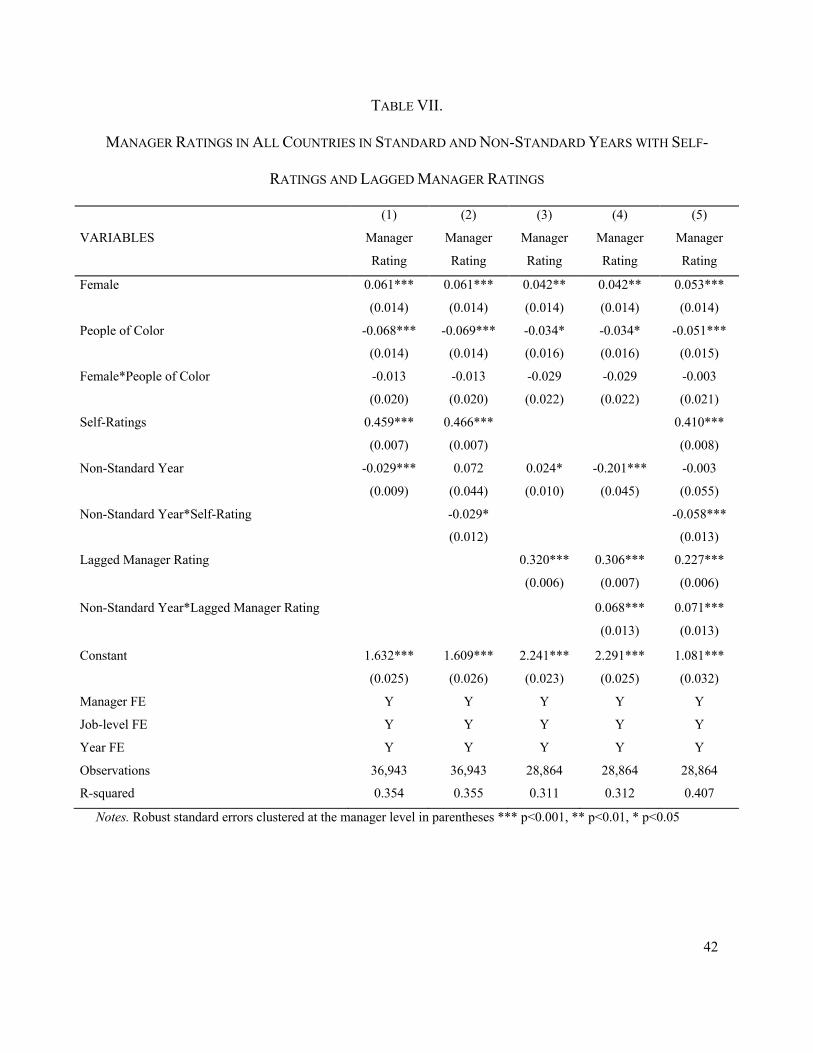
years. To investigate this further, we control for self-ratings in Table VII (even though managers
in 2016 could not “see” self-ratings, their own ratings might still correlate with the employee’s
self-rating) and take into account that most managers and employees have a history (including of
self-ratings in previous years potentially having influenced manager ratings in previous years).
While our data does not allow us to make causal inferences due to this inherent endogeneity over
time, we expect manager ratings to be less correlated with employee self-ratings and more
16
correlated with their own manager rating from the previous year in the non-standard than in the
standard years. Residual correlations between self-ratings and manager ratings in the non-
standard year may be due to intrinsic agreement between the employee and the manager. It
cannot, however, be a result of this year’s self-rating influencing the manager rating.
The raw correlation coefficients between manager and self-ratings are rs = 0.46 in
standard years and rns = 0.41 in the non-standard year. In contrast, manager ratings appear less
correlated with their previous year’s own rating in standard years (rs = 0.38) than in the non-
standard year (rns = 0.43). Table VII examines these relationships more precisely.
Insert Table VII
Table VII shows that manager ratings are correlated with self-ratings (Column 1) but, as
shown by the negative interaction between the non-standard year and self-rating, that
relationship is less pronounced in the non-standard than in standard years (Column 2). Manager
ratings are also correlated with last year’s manager ratings (Column 3) but that relationship—as
shown by the positive interaction of non-standard year and lagged manager rating—is more
pronounced in the non-standard than in standard years (Column 4). These dynamics hold when
considered simultaneously (Column 5). While managers indeed seemed to rely more on past
ratings in the year where self-evaluations were not available to them, the overall pattern of
performance ratings by gender and race did not change (across Columns 1-5): holding self-
ratings constant, managers assigned women higher and people of color lower ratings than their
relevant counterparts in all years.

17
Overall, these results suggest that manager ratings were heavily influenced by demand-
side factors and history. Not having access to employees’ self-evaluations in one year did not
change their evaluations of their employees in fundamental ways. That said, not being directly
anchored by employee self-evaluations seems to have led managers to assign somewhat lower
ratings in the non-standard year overall but this “de-anchoring” did not have differential gender
or race effects for most employees. Given that managers more heavily relied on the previous
year’s ratings in the non-standard year, that year’s ratings were also affected by the “shadow of
the past.”
In addition to demand-side effects, our data further suggest that managers were also
influenced by supply-side factors during standard years: Manager ratings were more closely
related to employees’ self-ratings in years where the latter were available to them, which may
have contributed to higher manager ratings. Still, manager ratings and self-ratings were related in
all years, whether the latter were known to managers or not, suggesting either intrinsic agreement
on how an employee should be rated or on a convergence of views over time.
To examine the potential impact of the non-standard year on performance ratings without
the “shadow of the past,” we take a closer look at employees’ ratings during their first year of
employment in the company, the “newcomers.” Specifically, we conduct subgroup analyses on
newcomers for the standard year and the non-standard year (Table A.6 in the Appendix). While
we find a persistent race gap for all newcomers in standard years, the race gap disappears for
women in the non-standard year. Only men of color but not women of color were rated more
negatively than their respective White counterparts when managers did not have self-evaluations
available. As in standard years, men of color were harmed by both demand-side induced race and
gender effects, while women of color were harmed by the race effect but benefitted from the

18
gender dynamics. In contrast to standard years, the additional disadvantage women of color
experienced due to their lower self-evaluations was removed by the supply-side policy
intervention.
While directionally consistent, we do not have sufficient power to statistically document
this effect for women of color among newcomers in a fully-specified triple interaction (the
coefficient on female x people of color x non-standard year is positive but n.s. with p=0.14). We
thus take the newcomer results only as suggestive evidence that managers might assign higher
ratings to women of color when not anchored by their self-evaluations. Figure IV illustrates the
effects for newcomers graphically.
Insert Figure IV
IV. RESULTS: UNITED STATES
Our analysis so far has included the entire dataset across all countries and years. Our
global results suggest persistent supply-side effects for gender and demand-side effects for race.
However, race requires further attention for at least two reasons. First, employing a binary
definition of race—while necessary in a global context where race categories are not the same
across countries—is not satisfactory, and second, race data is incomplete in most countries in our
dataset. The reasons for why race data is missing in some countries vary, including differences in
legal requirements or, conversely, restrictions to collect race data from employees, as well as
cultural norms where people are not used to defining themselves based on race or prefer not
disclosing race, potentially introducing selection effects. The only country in our dataset with
almost perfectly complete data on race is the United States. In addition to having an unbiased

19
sample available in the US, we can also analyze various race categories separately, moving
beyond a binary definition of race.
In Table VIII, we show how our main findings break down when looking at the US and
other countries separately. While many dynamics seem to apply across geographies—with
female employees being “lifted up” by managers even though they evaluated themselves more
harshly than male employees—the demand-side driven race dynamics appear much more
pronounced in the US, especially when looking at final manager ratings. We now dissect the US
effects further and also run counter-factual simulations to better understand the resulting effect
sizes.
Insert Table VIII
IV.A. Standard Years in the US
Table IX presents average self- and manager-ratings for the five racial groups we can
distinguish in the US, Asian, Black, Latinx, Other and White Americans. Asian, Black and
Latinx employees appear to give themselves lower self-ratings and receive lower manager
ratings than White employees in standard years, 2015, 2017 and 2018. (Table A.7 shows average
ratings for all possible gender and race combinations.)
Insert Table IX
Table X examines manager ratings by demographic group in standard years accounting
for manager, job-level, and year fixed effects. While all employees of color received lower

20
ratings than their White counterparts, the effect is most pronounced for Black employees who
received the most negative ratings independent of our specification.
Insert Table X
Turning to the supply-side, in Table XI, we examine the relationship between gender and
the various race categories and employees’ self-ratings, repeating the analyses conducted for
manager ratings. Women, and in particular, Asian American women, and Black employees gave
themselves lower ratings.
Insert Table XI
As we did in the global analysis, to isolate demand-side driven differences in manager
ratings, we next control for self-ratings. Table XII shows that managers ratings are consistently
correlated with self-ratings. However, gender and race dynamics remain important. Controlling
for self-ratings, managers assigned female employees higher ratings and all employee groups of
color lower ratings, independent of our specification.
Insert Table XII
21
As the persistent race effects in the US were mostly driven by the demand-side, not
sharing self-evaluations did not have any impact in the US, including for newcomers (analysis
not shown).
IV.B. Race Simulations for the US
To better illustrate the magnitude of the effect sizes we observe for race in the United
States, we conduct a number of counterfactual simulations. We run bootstrapped simulations,
drawing from the original data, with the goal of identifying how many employees of color would
have to receive a more positive manager rating for us to no longer observe differences between
demographic subgroups. These simulations enable us to study the magnitude of the observed
effects, which is useful for policy and decision-makers. We only draw from observations in
standard years where self-ratings were observable to managers.
We estimate a model that includes dummy variables for gender, all racial categories and a
number of fixed effects:
𝑚!"#$% = 𝛽& + 𝛽'𝑓! + 𝛽(𝑟*,! + 𝛽)𝑟,,! + 𝛽-𝑟.,! + 𝛽-𝑟/,! + 𝜃" + 𝜃$ + 𝜃# + 𝜃% + 𝜀" (4)
where rA,i is 1 if the employee is Asian; rB,i is 1 if the employee is Black; rL,i is 1 if the employee
is Latinx; rO,i is 1 if the employee is in the “Other” category; all other variables are as defined
above for Eqs. (1-3). We chose not to include the interaction terms between gender and racial
categories because the policy-relevant counterfactual does not require intersectionality: as Table
IX shows, men and women of color (including Asian, Black, Latinx and “Other” employees) are
experiencing lower manager ratings than White employees regardless of their gender. As such,
we explore how many employees of each racial category—regardless of their gender—would

22
need to experience a higher rating, so that the average rating of that group is indistinguishable
from White employees.
In the first set of simulations, we increase the manager rating of a randomly selected
subset of Black employees. We focus on Black employees because the race gap in manager
ratings is most pronounced for them (see Table X). We conduct 100 iterations for each fraction
of the subset: in each iteration, we draw a subset of Black employees without replacement,
increasing the manager rating by one unit (unless the employees had already received the highest
manager rating8), estimate Eq. (4) and save the regression coefficients and standard errors
associated with rB,i. After all iterations, we calculate the mean coefficient β-), the mean standard
error, as well as the associated t-statistic and p-value. This process is repeated for differently
sized fractions of Black employees to identify above which threshold there exists no difference
in ratings between White employees and Black employees.
Insert Table XIII
Table XIII shows that approximately 22% of Black employees in the United States would
need to experience a higher manager rating than they currently receive, in order for there to be no
significant difference between the managers’ ratings of White employees and Black employees
(p > 0.5). Furthermore, beyond non-significance, we also explore at what point the coefficient is
8 For a small fraction of employees of color (who have the highest manager rating prior to the simulation change) the manager rating will not be altered, although they are technically “treated”. Excluding employees with a rating of 5 from this procedure does not affect our results or the conclusions we can draw (results not shown).

23
closely estimated at 0 (i.e. virtually no difference between the two groups), which would require
a subset of at least 28% of Black employees to be affected by higher manager ratings.
In additional simulations, we repeat the same process with Asian, Latinx and employees
who self-selected into the “Other” racial category. In the Appendix, Tables A.8–A.10 show that
4-7% Asian, 4-11% Latinx and 3-12% “Other” employees would need to experience an increase
in their manager rating for there to be no difference to White employees.
V. DISCUSSION AND CONCLUSION
We examine gender and race dynamics in performance appraisals in a multi-national
financial services firm headquartered in the United States. Gender or race differences in final
performance scores may be due to supply-side effects with employees with certain demographic
characteristics giving themselves different self-evaluations, demand-side effects with managers
assigning different scores to employees with certain demographic characteristics and their
interplay. As in most performance appraisal systems, employee self-evaluations are shared with
managers before managers assign performance ratings, which may lead to anchoring.
Differentiating between supply- and demand-side effects helps inform policy design in
case a firm wishes to address observed differences in final performance scores. Performance
reviews appear prone to allegations of bias, and some fear that remote work, prevalent for many
during the Covid-19 pandemic, might have exacerbated bias in talent reviews (Mackenzie et al.
2019; Lanik 2020). News reports suggest that some companies have taken action. For example,
Amazon announced in April 2021 that it would “inspect any statistically significant demographic
differences in Q1 2021 performance ratings … to identify root causes and, as necessary,

24
implement action plans” (Galetti 2021) Clearly, different interventions are called for depending
on the causes of the observed differences.
In the firm we examined here, a particularly striking demographic pattern emerging from
the data is a demand-side driven race gap in final performance scores. Managers introduced a
race gap not present in self-evaluations, with the manager-employee gap in ratings being largest
for people of color, in particular in the US where about a quarter of Black employees would have
to receive better scores for the race gap to be closed. The race gaps are significant but smaller for
Latinx and Asian employees in the US. In contrast, self-evaluations were mostly shaped by
gender: women (in particular, women of color) gave themselves lower self-ratings than their
male counterparts but, perhaps just as strikingly, managers reversed the gender gap in final
performance scores for Whites and closed it for employees of color.
As the race gap and the changes in the gender gaps in final performance scores were
mostly driven by the demand side, a quasi-exogenous shock to this firm’s appraisal process
disrupting anchoring did not have much impact on the race and gender dynamics. However,
when managers did not have access to self-evaluations in one year, everyone’s ratings were
lowered on average, suggesting some “de-anchoring” took place. Preliminary evidence suggests
that the one group that appears to have benefited from the process change was women of color in
their first year: when managers were neither anchored by these employees’ lower self-
evaluations (nor by their previous year’s lower evaluations as those did not exist for newcomers),
women of color ended up with performance scores that were slightly higher than those of their
male counterparts and on par with those of other employees.
Subjective performance appraisals similar to the ones analyzed in this firm are common
in most firms as objective performance data is rarely available for complex jobs. While neither

25
the firm nor we can assess to what degree differences in final performance ratings are due to true
underlying differences in performance or to self- or manager bias, systematic differences based
on demographic characteristics are of concern as these performance scores are typically used to
inform compensation and promotion decisions and thus could induce systemic inequities.
Our paper contributes to the on-going debate about how such inequities could be
addressed, suggesting that differentiating between supply- and demand-side driven differences in
final outcomes could be useful in informing policy. If the supply-side was heavily affected by
demographic characteristics, e.g., through self-stereotyping or expectations of social backlash,
and then anchored the demand side, interventions aimed at employees or at disabling anchoring
would be particularly fruitful; if alternatively, the demand side was mostly responsible for the
gender and race differences in final performance scores, then interventions focused on managers
would be called for.

26
References
Arnold, D., Dobbie, W.S. and Hull, P., 2020. Measuring racial discrimination in bail decisions
(No. w26999). National Bureau of Economic Research.
Arrow, K.J., 1973. Information and Economic Behavior. Cambridge: Harvard University Press.
Babcock, L. and Laschever, S., 2003. Women Don’t Ask: Negotiation and the Gender Divide,
Princeton.
Barber, B.M. and Odean, T., 2001. Boys will be boys: Gender, overconfidence, and common
stock investment. The quarterly journal of economics, 116(1), pp.261-292.
Beal, F.M., 1969. Black women’s manifesto; double jeopardy: To be Black and female. New
York: Third World Women’s Alliance.
Benveniste, A. “The Fortune 500 now has a record number of female CEOs: A whopping 39.”
CNN Business, September 10, 2020.
Bertrand, M. and Duflo, E., 2017. Field experiments on discrimination. In Handbook of
economic field experiments (Vol. 1, pp. 309-393). North-Holland.
Bertrand, M. and Mullainathan, S., 2004. Are Emily and Greg more employable than Lakisha
and Jamal? A field experiment on labor market discrimination. American Economic
Review, 94(4), pp.991-1013.
Bohnet, I., 2016. What Works: Gender Equality by Design. Cambridge: Harvard University
Press.
Bohren, J.A., Imas, A. and Rosenberg, M., 2019. The dynamics of discrimination: Theory and
evidence. American Economic Review, 109(10), pp.3395-3436.
Bosquet, C., Combes, P.P. and García-Peñalosa, C., 2019. Gender and promotions: evidence

27
from academic economists in France. The Scandinavian Journal of Economics, 121(3),
pp.1020-1053.
Bowles, H.R., Babcock, L. and Lai, L., 2007. Social incentives for gender differences in the
propensity to initiate negotiations: Sometimes it does hurt to ask. Organizational
Behavior and Human Decision Processes, 103(1), pp.84-103.
Buser, T., Niederle, M., & Oosterbeek, H. (2014). Gender, competitiveness, and career choices.
Quarterly Journal of Economics, 129(3), 1409-1447.
Castilla, E.J., 2008. Gender, race, and meritocracy in organizational careers. American Journal of
Sociology, 113(6), pp.1479-1526.
Castilla, E.J., 2015. Accounting for the gap: A firm study manipulating organizational
accountability and transparency in pay decisions. Organization Science, 26(2), pp.311-
333.
Coffman, K.B., 2014. Evidence on self-stereotyping and the contribution of ideas. Quarterly
Journal of Economics, 129(4), pp.1625-1660.
Coffman, K. B., Exley, C. L., & Niederle, M. (Forthcoming). The Role of Beliefs in Driving
Gender Discrimination. Management Science.
Crenshaw, K.W., 2017. On intersectionality: Essential writings. The New Press.
Croson, R. and Gneezy, U., 2009. Gender differences in preferences. Journal of Economic
Literature, 47(2), pp.448-74.
Davis, D. “One of the only 4 Black Fortune 500 CEOs just stepped down — here are the 3 that
remain.” Business Insider, July 21, 2020.
DeNisi, A. S., & Murphy, K. R., 2017. Performance appraisal and performance management:
100 years of progress? Journal of Applied Psychology, 102(3), 421–433.
28
Dobbin, F., Schrage, D. and Kalev, A., 2015. Rage against the iron cage: The varied effects of
bureaucratic personnel reforms on diversity. American Sociological Review, 80(5),
pp.1014-1044.
Exley, C.L. and Kessler, J.B., 2019. The gender gap in self-promotion (No. w26345). National
Bureau of Economic Research.
Furnham, A. and Boo, H.C., 2011. A literature review of the anchoring effect. The Journal of
Socio-economics, 40(1), pp.35-42.
Galetti, B., 2021. Diversity, Equity, and Inclusion. About Amazon.
https://www.aboutamazon.com/news/workplace/diversity-equity-and-inclusion
Garcia, A. “Only 9 Hispanic CEOs at top 500 companies.” CNN Money, September 9, 2020.
Glover, D., Pallais, A. and Pariente, W., 2017. Discrimination as a self-fulfilling prophecy:
Evidence from French grocery stores. Quarterly Journal of Economics, 132(3), pp.1219-
1260.
Goldin, C. and Rouse, C., 2000. Orchestrating impartiality: The impact of" blind" auditions on
female musicians. American Economic Review, 90(4), pp.715-741.
Hospido, L.. Laeven, L., and Lamo, A. 2019. "The gender promotion gap: evidence from central
banking." Working paper.
Joshi, A., Son, J. and Roh, H., 2015. When can women close the gap? A meta-analytic test of sex
differences in performance and rewards. Academy of Management Journal, 58(5),
pp.1516-1545.
Kessler, J. B., Low, C., & Sullivan, C. D. 2019. Incentivized resume rating: Eliciting employer
preferences without deception. American Economic Review, 109(11), 3713-44.

29
Klimoski, R. and Inks, L., 1990. Accountability forces in performance appraisal. Organizational
Behavior and Human Decision Processes, 45(2), pp.194-208.
Lanik, M., 2020. Why This Year’s Talent Reviews Are the Perfect Storm for Bias and
Discrimination. Pinsight. https://www.pinsight.com/blog/why-this-years-talent-reviews-
are-the-perfect-storm-for-bias-and-discrimination/
Mackenzie, L. N., Wehner, J., & Correll, S. J., 2019. Why Most Performance Evaluations Are
Biased, and How to Fix Them. Harvard Business Review. https://hbr.org/2019/01/why-
most-performance-evaluations-are-biased-and-how-to-fix-them
McKay, P.F. and McDaniel, M.A., 2006. A reexamination of black-white mean differences in
work performance: More data, more moderators. Journal of Applied Psychology, 91(3),
p.538.
Moss-Racusin, C.A., Dovidio, J.F., Brescoll, V.L., Graham, M.J. and Handelsman, J., 2012.
Science faculty’s subtle gender biases favor male students. Proceedings of the National
Academy of Sciences, 109(41), pp.16474-16479.
Niederle, M. and Vesterlund, L., 2007. Do women shy away from competition? Do men compete
too much?. Quarterly Journal of Economics, 122(3), pp.1067-1101.
Pager, D. and Pedulla, D.S., 2015. Race, self-selection, and the job search process. American
Journal of Sociology, 120(4), pp.1005-1054.
Parsons, C.A., Sulaeman, J., Yates, M.C. and Hamermesh, D.S., 2011. Strike three:
Discrimination, incentives, and evaluation. American Economic Review, 101(4),
pp.1410-35.
Phelan, J.E. and Rudman, L.A., 2010. Reactions to ethnic deviance: The role of backlash in
racial stereotype maintenance. Journal of Personality and Social Psychology, 99(2),

30
p.265.
Phelps, E.S., 1972. The statistical theory of discrimination. American Economic Review, 62(4),
pp.659-661.
Price, J. and Wolfers, J., 2010. Racial discrimination among NBA referees. Quarterly
Journal of Economics, 125(4), pp.1859-1887.
Quadlin, N., 2018. The mark of a woman’s record: Gender and academic performance in hiring.
American Sociological Review, 83(2), pp.331-360.
Quillian, L., Pager, D., Hexel, O. and Midtbøen, A.H., 2017. Meta-analysis of field experiments
shows no change in racial discrimination in hiring over time. Proceedings of the National
Academy of Sciences, 114(41), pp.10870-10875.
Rosette, A.S. and Livingston, R.W., 2012. Failure is not an option for Black women: Effects of
organizational performance on leaders with single versus dual-subordinate identities.
Journal of Experimental Social Psychology, 48(5), pp.1162-1167.
Roth, P.L., Huffcutt, A.I. and Bobko, P., 2003. Ethnic group differences in measures of job
performance: A new meta-analysis. Journal of Applied Psychology, 88(4), p.694.
Shore, T.H., Adams, J.S. and Tashchian, A., 1998. Effects of self-appraisal information,
appraisal purpose, and feedback target on performance appraisal ratings. Journal of
business and psychology, 12(3), pp.283-298.
Society for Human Resource Management, 2014. HR Professionals’ Perceptions About
Performance Management Effectiveness Accessed on 7 July 2019
at https://www.shrm.org/hr-today/trends-and-forecasting/research-and-
surveys/pages/2014-performance-management.aspx.
Thorsteinson, T.J., Breier, J., Atwell, A., Hamilton, C. and Privette, M., 2008. Anchoring effects
31
on performance judgments. Organizational Behavior and Human Decision Processes,
107(1), pp.29-40.
Tversky, A. and Kahneman, D., 1974. Judgment under uncertainty: Heuristics and biases.
science, 185(4157), pp.1124-1131.
Wynn, A. T., & Correll, S. J., 2018. Combating Gender Bias in Modern Workplaces. In B. J.
Risman, C. M. Froyum, & W. J. Scarborough (Eds.), Handbook of the Sociology of
Gender (pp. 509–521). Springer International Publishing.

32
FIGURE I.
DISTRIBUTION OF RATINGS IN STANDARD YEARS

33
FIGURE II.
ESTIMATED SELF-RATINGS AND MANAGER RATINGS BY RACE AND GENDER

34
FIGURE III.
ESTIMATED MANAGER AND SELF-RATINGS IN STANDARD AND NON-STANDARD YEARS, BY GENDER
AND RACE

35
FIGURE IV.
NEWCOMERS: ESTIMATED MANAGER AND SELF-RATINGS IN STANDARD AND NON-STANDARD
YEARS, BY GENDER AND RACE

36
TABLE I
UNIQUE EMPLOYEE DATA: DISTRIBUTION BY GENDER AND RACE IN ALL COUNTRIES (IN %)
Male Female
All Employees 59.8% 40.2%
White Employees 45.3% 39.4%
Employees of Color 29.4% 34.8%
Global: Did not disclose race 25.3% 25.8%
100% 100%
US: White 32.9% 52.7%
US: Black 21.4% 6.1%
US: Latinx 18.4% 5.4%
US: Asian 24.3% 29.0%
US: Other races 1.4% 3.1%
US: Did not disclose race 1.4% 3.8%
100% 100% Notes. This table is a cumulative summary of unique employee demographics across all four years (only including employees with
non-missing manager ratings and self-ratings, which corresponds to 96% of the sample).

37
TABLE II
AVERAGE SELF- AND MANAGER RATINGS BY DEMOGRAPHIC GROUP IN ALL COUNTRIES IN
STANDARD YEARS
Gender Race Gender-Race Interaction
All Men Women Whites People
of color
White
Men
White
Women
Men of
color
Women
of color
Self-ratings 3.52
(0.76)
3.58
(0.76)
3.44
(0.75)
3.57
(0.74)
3.51
(0.77)
3.59
(0.75)
3.52
(0.73)
3.57
(0.78)
3.42
(0.76)
Manager
ratings
3.22
(0.79)
3.24
(0.80)
3.20
(0.78)
3.28
(0.79)
3.20
(0.79)
3.27
(0.80)
3.30
(0.78)
3.22
(0.80)
3.17
(0.77)
Observations 38,022 23,347 14,674 17,103 11,823 10,976 6,127 6,812 5,010
Notes. Self-ratings refer to the self-evaluation that each employee has to fill out and share with their
manager before the manager decides on their rating of the employee. The self-ratings row shows the average self-
rating by each subgroup with standard deviations in parentheses. The manager ratings row shows the average rating
that the corresponding subgroup receives from their managers (regardless of the managers’ gender or race). The
final row shows the total number of observations for each subgroup. We are missing data on race for 9,096
observations.

38
TABLE III
MANAGER RATINGS IN ALL COUNTRIES IN STANDARD YEARS
(1)
Manager
Rating
(2)
Manager
Rating
(3)
Manager
Rating
(4)
Manager
Rating
(5)
Manager
Rating
(6)
Manager
Rating
(7)
Manager
Rating
(8)
Manager
Rating
Female -0.031** -0.009 0.022 0.043** 0.043** 0.048** 0.043**
(0.009) (0.011) (0.014) (0.016) (0.016) (0.016) (0.016)
People of Color -0.082*** -0.082*** -0.053*** -0.052** -0.057*** -0.063*** -0.068***
(0.011) (0.011) (0.014) (0.017) (0.017) (0.017) (0.017)
Female*People
of Color
-0.073*** -0.063** -0.060* -0.056* -0.055*
(0.021) (0.024) (0.024) (0.024) (0.024)
Constant 3.235*** 3.282*** 3.286*** 3.275*** 3.268*** 3.270*** 3.269*** 3.273***
(0.007) (0.008) (0.009) (0.010) (0.008) (0.008) (0.008) (0.008)
Manager FE N N N N Y Y Y Y
Region FE N N N N N Y Y Y
Job-level FE N N N N N Y Y Y
Year FE N N N N N N N Y
Observations 38,021 28,926 28,925 28,925 27,910 27,910 27,910 27,910
R-squared 0.000 0.003 0.003 0.003 0.216 0.216 0.221 0.225
Notes. Robust standard errors clustered at the manager level in parentheses *** p<0.001, ** p<0.01, * p<0.05

39
TABLE IV
SUPPLY-SIDE EFFECTS: SELF-RATINGS IN ALL COUNTRIES IN STANDARD YEARS
(1)
Self-rating
(2)
Self-rating
(3)
Self-rating
(4)
Self-rating
(5)
Self-rating
(6)
Self-rating
(7)
Self-rating
(8)
Self-rating
Female -0.136*** -0.104*** -0.075*** -0.052*** -0.052*** -0.041** -0.044**
(0.009) (0.011) (0.014) (0.015) (0.015) (0.015) (0.015)
People of Color -0.059*** -0.053*** -0.025 0.017 0.022 0.021 0.019
(0.011) (0.011) (0.014) (0.017) (0.017) (0.017) (0.017)
Female*People
of Color
-0.068** -0.072** -0.075** -0.072** -0.071**
(0.021) (0.024) (0.024) (0.024) (0.024)
Constant 3.577*** 3.567*** 3.604*** 3.594*** 3.571*** 3.569*** 3.565*** 3.567***
(0.007) (0.008) (0.008) (0.009) (0.008) (0.008) (0.008) (0.008)
Manager FE N N N N Y Y Y Y
Region FE N N N N N Y Y Y
Job-level FE N N N N N Y Y Y
Year FE N N N N N N N Y
Observations 38,021 28,926 28,925 28,925 27,910 27,910 27,910 27,910
R-squared 0.008 0.001 0.006 0.006 0.241 0.242 0.246 0.249
Notes. Robust standard errors clustered at the manager level in parentheses *** p<0.001, ** p<0.01, * p<0.05

40
TABLE V
DEMAND-SIDE EFFECTS: MANAGER RATINGS CONTROLLING FOR SELF-RATINGS IN ALL
COUNTRIES IN STANDARD YEARS
(1)
Manager
Rating
(2)
Manager
Rating
(3)
Manager
Rating
(4)
Manager
Rating
(5)
Manager
Rating
(6)
Manager
Rating
(7)
Manager
Rating
(8)
Manager
Rating
Female 0.034*** 0.040*** 0.057*** 0.067*** 0.067*** 0.067*** 0.063***
(0.008) (0.010) (0.013) (0.015) (0.015) (0.015) (0.015)
People of Color -0.055*** -0.057*** -0.041** -0.060*** -0.068*** -0.073*** -0.076***
(0.010) (0.010) (0.013) (0.015) (0.015) (0.015) (0.015)
Female*People
of Color
-0.040* -0.029 -0.025 -0.023 -0.021
(0.019) (0.022) (0.022) (0.022) (0.022)
Self-rating 0.478*** 0.471*** 0.472*** 0.472*** 0.470*** 0.471*** 0.468*** 0.466***
(0.006) (0.007) (0.007) (0.007) (0.007) (0.007) (0.007) (0.007)
Constant 1.526*** 1.604*** 1.584*** 1.579*** 1.590*** 1.589*** 1.602*** 1.611***
(0.021) (0.023) (0.024) (0.024) (0.027) (0.027) (0.027) (0.027)
Manager FE N N N N Y Y Y Y
Region FE N N N N N Y Y Y
Job-level FE N N N N N Y Y Y
Year FE N N N N N N N Y
Observations 38,021 28,926 28,925 28,925 27,910 27,910 27,910 27,910
R-squared 0.208 0.204 0.205 0.205 0.368 0.369 0.371 0.373
Notes. Robust standard errors clustered at the manager level in parentheses *** p<0.001, ** p<0.01, * p<0.05

41
TABLE VI.
MANAGER RATINGS IN ALL COUNTRIES IN STANDARD AND NON-STANDARD YEARS
(1)
Manager
Rating
(2)
Manager
Rating
(3)
Manager
Rating
(4)
Manager
Rating
(5)
Manager
Rating
(6)
Manager
Rating
Female 0.021 0.019 0.021 0.035* 0.035* 0.040**
(0.014) (0.014) (0.014) (0.015) (0.015) (0.016)
People of Color -0.054*** -0.054*** -0.056*** -0.047** -0.052** -0.060***
(0.014) (0.014) (0.014) (0.017) (0.017) (0.017)
Female*People of Color -0.067** -0.067** -0.067** -0.051* -0.049* -0.045*
(0.020) (0.020) (0.020) (0.023) (0.023) (0.023)
Non-Standard Year -0.030** -0.033** -0.032** -0.032* -0.031* -0.038**
(0.009) (0.011) (0.012) (0.013) (0.013) (0.013)
Non-Standard Year*Female 0.008 -0.003 -0.004 -0.003
(0.018) (0.018) (0.018) (0.018)
Non-Standard Year*People of
Color
0.005 -0.005 -0.005 -0.001
(0.018) (0.018) (0.018) (0.018)
Constant 3.304*** 3.275*** 3.275*** 3.268*** 3.269*** 3.271***
(0.014) (0.009) (0.009) (0.008) (0.008) (0.008) Manager FE N N N Y Y Y Region FE N N N N Y Y Job-level FE N N N N N Y
Observations 37,813 37,813 37,813 36,952 36,943 36,943
R-squared 0.003 0.003 0.003 0.204 0.204 0.210
Notes. Robust standard errors clustered at the manager level in parentheses *** p<0.001, ** p<0.01, * p<0.05
42
TABLE VII.
MANAGER RATINGS IN ALL COUNTRIES IN STANDARD AND NON-STANDARD YEARS WITH SELF-
RATINGS AND LAGGED MANAGER RATINGS
(1) (2) (3) (4) (5)
VARIABLES Manager
Rating
Manager
Rating
Manager
Rating
Manager
Rating
Manager
Rating
Female 0.061***
(0.014)
0.061***
(0.014)
0.042**
(0.014)
0.042**
(0.014)
0.053***
(0.014)
People of Color -0.068*** -0.069*** -0.034* -0.034* -0.051***
(0.014) (0.014) (0.016) (0.016) (0.015)
Female*People of Color -0.013 -0.013 -0.029 -0.029 -0.003
(0.020) (0.020) (0.022) (0.022) (0.021)
Self-Ratings 0.459***
(0.007)
0.466***
(0.007)
0.410***
(0.008)
Non-Standard Year -0.029*** 0.072 0.024* -0.201*** -0.003
(0.009) (0.044) (0.010) (0.045) (0.055)
Non-Standard Year*Self-Rating -0.029*
(0.012)
-0.058***
(0.013)
Lagged Manager Rating 0.320***
(0.006)
0.306***
(0.007)
0.227***
(0.006)
Non-Standard Year*Lagged Manager Rating 0.068***
(0.013)
0.071***
(0.013)
Constant 1.632*** 1.609*** 2.241*** 2.291*** 1.081***
(0.025) (0.026) (0.023) (0.025) (0.032)
Manager FE Y Y Y Y Y
Job-level FE Y Y Y Y Y
Year FE Y Y Y Y Y
Observations 36,943 36,943 28,864 28,864 28,864
R-squared 0.354 0.355 0.311 0.312 0.407
Notes. Robust standard errors clustered at the manager level in parentheses *** p<0.001, ** p<0.01, * p<0.05

43
TABLE VIII.
MANAGER AND SELF-RATINGS IN THE UNITED STATES AND OTHER COUNTRIES IN STANDARD
YEARS
Other countries USA
(1) (2) (3) (4) (5) (6)
VARIABLES Manager
Rating
Self-
Rating
Manager
Rating
Manager
Rating
Self-
Rating
Manager
Rating
Female 0.033 -0.074* 0.071* 0.043* -0.037* 0.060***
(0.034) (0.031) (0.029) (0.019) (0.018) (0.018)
People of Color -0.004 0.055 -0.032 -0.089*** 0.001 -0.090***
(0.035) (0.034) (0.030) (0.021) (0.020) (0.018)
Female*People of Color -0.084 -0.096* -0.036 -0.041 -0.055 -0.017
(0.046) (0.043) (0.040) (0.030) (0.029) (0.027)
Self-Rating 0.506*** 0.448***
(0.013) (0.009)
Constant 3.248*** 3.479*** 1.488*** 3.279*** 3.610*** 1.664***
(0.019) (0.018) (0.047) (0.009) (0.009) (0.034)
Manager FE Y Y Y Y Y Y
Job-level FE Y Y Y Y Y Y
Year FE Y Y Y Y Y Y
Observations 8,800 8,800 8,800 18,749 18,749 18,749
R-squared 0.284 0.322 0.446 0.226 0.238 0.362
Notes. Robust standard errors clustered at the manager level in parentheses *** p<0.001, ** p<0.01, * p<0.05

44
TABLE IX
AVERAGE SELF- AND MANAGER RATINGS BY DEMOGRAPHIC GROUP IN THE UNITED STATES IN
STANDARD YEARS
Gender Race
All
employees
Men Women White Black Latinx Asian Other
Self-ratings 3.59
(0.75)
3.62
(0.76)
3.53
(0.74)
3.61
(0.74)
3.41
(0.82)
3.57
(0.78)
3.56
(0.75)
3.61
(0.80)
Manager
ratings
3.25
(0.75)
3.25
(0.80)
3.25
(0.78)
3.29
(0.80)
2.99
(0.77)
3.16
(0.78)
3.23
(0.78)
3.19
(0.80)
Observations 19,977 12,321 7,656 12,258 861 849 4,906 491
Notes. The self-ratings row shows the average self-rating by each subgroup with standard deviations in
parentheses. The manager ratings row shows the average rating that the corresponding subgroup receives from their
managers (regardless of the managers’ gender or race). The final row shows the total sample size for each subgroup.

45
TABLE X
MANAGER RATINGS IN THE UNITED STATES IN STANDARD YEARS
(1) (2) (3) (4)
Manager
Rating
Manager
Rating
Manager
Rating
Manager
Rating
Female 0.001 0.005 0.036
(0.011) (0.011) (0.019)
Asian -0.062*** -0.063*** -0.054*
(0.018) (0.018) (0.023)
Black -0.279*** -0.280*** -0.278***
(0.033) (0.033) (0.049)
Latinx -0.097** -0.097** -0.080
(0.034) (0.034) (0.048)
Other -0.120** -0.121** -0.065
(0.042) (0.042) (0.055)
Female*Asian -0.028
(0.033)
Female*Black -0.011
(0.065)
Female*Latinx -0.043
(0.067)
Female*Other -0.135
(0.082)
Constant 3.226*** 3.259*** 3.257*** 3.248***
(0.004) (0.011) (0.012) (0.013) Manager FE Y Y Y Y Job-level FE Y Y Y Y Year FE Y Y Y Y Observations 37,091 37,091 37,091 37,091
R-squared 0.208 0.210 0.210 0.211
Notes. Robust standard errors clustered at the manager level in parentheses *** p<0.001, ** p<0.01, * p<0.05

46
TABLE XI
SUPPLY-SIDE EFFECTS: SELF-RATINGS IN THE UNITED STATES IN STANDARD YEARS
(1) (2) (3) (4)
VARIABLES Self-Rating Self-Rating Self-Rating Self-Rating
Female -0.091*** -0.092*** -0.034
(0.010) (0.010) (0.018)
Asian -0.019 -0.008 0.019
(0.018) (0.018) (0.022)
Black -0.136*** -0.130*** -0.180***
(0.036) (0.037) (0.053)
Latinx 0.021 0.023 0.029
(0.033) (0.033) (0.045)
Other 0.037 0.042 0.103
(0.043) (0.043) (0.057)
Female*Asian -0.076*
(0.031)
Female*Black 0.084
(0.074)
Female*Latinx -0.023
(0.067)
Female*Other -0.152
(0.088)
Constant 3.562*** 3.571*** 3.606*** 3.588***
(0.004) (0.011) (0.012) (0.012) Manager FE Y Y Y Y Job-level FE Y Y Y Y Year FE Y Y Y Y Observations 37,091 37,091 37,091 37,091
R-squared 0.237 0.236 0.238 0.239
Notes. Robust standard errors clustered at the manager level in parentheses *** p<0.001, ** p<0.01, * p<0.05

47
TABLE XII.
DEMAND-SIDE EFFECTS: MANAGER RATINGS IN THE UNITED STATES CONTROLLING FOR SELF-
RATINGS IN STANDARD YEARS
(1) (2) (3) (4)
VARIABLES Manager Rating Manager Rating Manager Rating Manager Rating
Female 0.043*** 0.048*** 0.052**
(0.010) (0.010) (0.017)
Asian -0.053*** -0.059*** -0.063**
(0.016) (0.016) (0.020)
Black -0.216*** -0.218*** -0.194***
(0.030) (0.030) (0.043)
Latinx -0.107*** -0.108*** -0.094*
(0.031) (0.031) (0.044)
Other -0.138*** -0.141*** -0.113*
(0.037) (0.037) (0.050)
Female*Asian 0.007
(0.031)
Female*Black -0.050
(0.057)
Female*Latinx -0.032
(0.061)
Female*Other -0.063
(0.076)
Self-ratings 0.472*** 0.470*** 0.472*** 0.472***
(0.006) (0.006) (0.006) (0.006)
Constant 1.543*** 1.579*** 1.556*** 1.555***
(0.023) (0.025) (0.026) (0.026) Manager FE Y Y Y Y Job-level FE Y Y Y Y Year FE Y Y Y Y
Observations 37,091 37,091 37,091 37,091
R-squared 0.363 0.365 0.365 0.365
Notes. Robust standard errors clustered at the manager level in parentheses *** p<0.001, ** p<0.01, * p<0.05

48
TABLE XIII.
COUNTERFACTUAL SIMULATION VARYING MANAGER RATINGS OF BLACK EMPLOYEES IN THE
UNITED STATES IN STANDARD YEARS
Fraction of Black
employees whose
manager rating gets
increased
Number of Black
employees whose
manager rating gets
increased
Black employee
β"!
(SE)
t-statistic
p-value
0.20 172 -0.083
(0.035)
t = -2.314
p = 0.021
0.21 181 -0.072
(0.036)
t = -2.002
p = 0.045
0.22 189 -0.063
(0.036)
t = -1.779
p = 0.075
0.23 198 -0.053
(0.036)
t = -1.481
p = 0.139
0.24 207 -0.043
(0.036)
t = -1.190
p = 0.234
0.25 215 -0.034
(0.036)
t = -0.933
p = 0.351
0.26 224 -0.024
(0.036)
t = -0.663
p = 0.507
0.27 232 -0.014
(0.036)
t = -0.392
p = 0.695
0.28 241 -0.004
(0.036)
t = -0.117
p = 0.907
0.29 250 0.006
(0.036)
t = 0.180
p = 0.858

49
APPENDIX: Supply- and Demand-Side Effects in Performance Appraisals: The Role of
Gender and Race
TABLE A.1.
MANAGER RATINGS CONTROLLING FOR MANAGER GENDER AND RACE FOR ALL COUNTRIES IN
STANDARD YEARS
(1) (2) (3) (4) (5) (6) (7)
VARIABLES Manager
Rating
Manager
Rating
Manager
Rating
Manager
Rating
Manager
Rating
Manager
Rating
Manager Rating
Female Employee -0.005 -0.023* -0.004 0.012 -0.004
(0.010) (0.011) (0.013) (0.011) (0.013)
Female Manager -0.046*** -0.074*** -0.081*** -0.081***
(0.012) (0.015) (0.018) (0.018)
Female
Manager*Female
Employee
0.061**
(0.021)
0.070**
(0.024)
0.070**
(0.024)
Employee of Color -0.074*** -0.074*** -0.079*** -0.075*** -0.077***
(0.012) (0.015) (0.012) (0.015) (0.015)
Manager of Color -0.014 -0.014 -0.014 -0.010
(0.010) (0.019) (0.019) (0.019)
Manager of
Color*Employee of
Color
0.003
(0.025)
0.003
(0.025)
0.001
(0.025)
Constant 3.239*** 3.299*** 3.245*** 3.285*** 3.296*** 3.281*** 3.300***
(0.007) (0.016) (0.007) (0.009) (0.010) (0.010) (0.011)
Manager FE N N N N N N N
Job-level FE Y Y Y Y Y Y Y
Year FE Y Y Y Y Y Y Y
Observations 37,900 28,925 37,900 28,925 28,839 28,925 28,839
R-squared 0.013 0.012 0.014 0.012 0.014 0.013 0.014
Robust standard errors clustered at the manager level in parentheses *** p<0.001, ** p<0.01, * p<0.05
50
TABLE A.2.
DEMAND-SIDE EFFECTS BY MANAGER CHARACTERISTICS FOR ALL COUNTRIES IN STANDARD
YEARS
Male Manager Female Manager White Managers Managers of Color
(1) (2) (3) (4) (7) (8) (5) (6)
Manager
Rating
Manager
Rating
Manager
Rating
Manager
Rating
Manager
Rating
Manager
Rating
Manager
Rating
Manager
Rating
Female 0.019 0.046* 0.084** 0.090*** 0.035 0.061*** 0.018 0.013
(0.020) (0.018) (0.029) (0.026) (0.018) (0.016) (0.040) (0.037)
People of color -0.054** -0.063*** -0.113** -0.122*** -0.106*** -0.104*** -0.018 -0.041
(0.019) (0.017) (0.038) (0.034) (0.021) (0.019) (0.034) (0.031)
Female*People of color -0.033 -0.002 -0.065 -0.029 -0.016 -0.004 -0.051 0.017
(0.029) (0.026) (0.047) (0.043) (0.030) (0.028) (0.050) (0.046)
Self-rating 0.458*** 0.486*** 0.468*** 0.450***
(0.008) (0.015) (0.009) (0.014)
Constant 3.290*** 1.648*** 3.227*** 1.514*** 3.287*** 1.605*** 3.247*** 1.663***
(0.009) (0.031) (0.018) (0.056) (0.008) (0.034) (0.021) (0.054)
Manager FE Y Y Y Y Y Y Y Y
Year FE Y Y Y Y Y Y Y Y
Job-level FE Y Y Y Y Y Y Y Y
Region FE Y Y Y Y Y Y Y Y
Observations 20,084 20,084 7,742 7,742 18,174 18,174 7,153 7,153
R-squared 0.219 0.366 0.237 0.390 0.214 0.365 0.230 0.369

51
TABLE A.3.
DEMAND-SIDE EFFECTS BY JOB LEVEL FOR ALL COUNTRIES IN STANDARD YEARS
Administrative
Assistant Junior Level Middle Management
Junior Senior
Management Senior Management
(1) (2) (3) (4) (5) (6) (7) (8) (9) (10)
Manager
Rating
Manager
Rating
Manager
Rating
Manager
Rating
Manager
Rating
Manager
Rating
Manager
Rating
Manager
Rating
Manager
Rating
Manager
Rating
Female 0.295 0.134 0.052 0.093*** 0.031 0.052 -0.016 0.005 0.133* 0.102
(0.280) (0.278) (0.028) (0.025) (0.034) (0.030) (0.039) (0.036) (0.058) (0.056)
People of color -0.229 -0.344 -0.143*** -0.129*** -0.016 -0.042 -0.010 -0.024 0.102 0.068
(0.397) (0.391) (0.028) (0.025) (0.035) (0.030) (0.045) (0.039) (0.064) (0.057)
Female*People
of color
0.170
(0.414)
0.241
(0.423)
-0.051
(0.039)
-0.030
(0.039)
-0.056
(0.054)
-0.005
(0.049)
0.011
(0.070)
0.007
(0.067)
0.068
(0.122)
-0.058
(0.119)
Self-rating 0.263*** 0.448*** 0.477*** 0.487*** 0.469***
(0.053) (0.012) (0.016) (0.019) (0.026)
Constant 2.983*** 2.249*** 3.228*** 1.643*** 3.295*** 1.578*** 3.351*** 1.580*** 3.268*** 1.616***
(0.269) (0.310) (0.015) (0.043) (0.016) (0.059) (0.015) (0.069) (0.017) (0.092)
Manager FE Y Y Y Y Y Y Y Y Y Y
Year FE Y Y Y Y Y Y Y Y Y Y
Region FE Y Y Y Y Y Y Y Y Y Y
Observations 722 722 11,458 11,458 6,798 6,798 4,726 4,726 2,164 2,164
R-squared 0.623 0.653 0.310 0.441 0.323 0.456 0.280 0.416 0.243 0.375

52
TABLE A.4.
DEMAND-SIDE EFFECTS BY REGION FOR ALL COUNTRIES IN STANDARD YEARS
Americas EMEA Asia-Pacific
(1) (2) (3) (4) (5) (6)
Manager Rating Manager Rating Manager Rating Manager Rating Manager Rating Manager Rating
Female 0.054** 0.070*** 0.035 0.083** -0.217 -0.078
(0.020) (0.018) (0.036) (0.031) (0.115) (0.127)
People of color -0.081*** -0.085*** 0.065 0.005 -0.107 -0.099
(0.020) (0.019) (0.045) (0.039) (0.082) (0.077)
Female*People of color -0.054 -0.025 -0.203** -0.136* 0.209 0.145
(0.030) (0.028) (0.062) (0.058) (0.119) (0.130)
Self-rating 0.448*** 0.524*** 0.468***
(0.009) (0.016) (0.024)
Constant 3.279*** 1.666*** 3.230*** 1.411*** 3.352*** 1.704***
(0.009) (0.034) (0.017) (0.056) (0.077) (0.108)
Manager FE Y Y Y Y Y Y
Year FE Y Y Y Y Y Y
Job-level FE Y Y Y Y Y Y
Observations 19,498 18,806 5,798 5,597 3,125 3,060
R-squared 0.227 0.365 0.283 0.449 0.311 0.452

53
TABLE A.5.
BALANCE CHECK: STANDARD VERSUS NON-STANDARD YEARS FOR ALL COUNTRIES
Sample characteristic Standard years Non-standard year p-value
% Female 38.6% 37.6% 0.05
% People of Color 40.9% 39.7% 0.06
Self-rating 3.52 3.52 0.24

54
TABLE A.6.
MANAGER RATINGS OF NEWCOMERS IN ALL COUNTRIES
PANEL A: STANDARD YEARS (1) (2) (3) (4) (5) (6) (7) (8) Manager
Rating Manager Rating
Manager Rating
Manager Rating
Manager Rating
Manager Rating
Manager Rating
Manager Rating
Female -0.011 -0.001 0.010 0.055 0.054 0.044 0.043
(0.019) (0.023) (0.034) (0.038) (0.038) (0.038) (0.038)
People of color -0.124*** -0.124*** -0.114*** -0.101** -0.098* -0.099* -0.103**
(0.024) (0.024) (0.031) (0.039) (0.039) (0.039) (0.039)
Female*POC -0.022
(0.042)
-0.034
(0.052)
-0.033
(0.053)
-0.039
(0.052)
-0.039
(0.052)
Constant 2.836*** 2.919*** 2.919*** 2.915*** 2.902*** 2.901*** 2.907*** 2.909***
(0.015) (0.022) (0.024) (0.027) (0.021) (0.021) (0.021) (0.021)
Observations 7,162 5,080 5,079 5,079 3,493 3,493 3,493 3,493
Manager FE N N N N Y Y Y Y
Region FE N N N N N Y Y Y
Job-level FE N N N N N N Y Y
Year-level FE N N N N N N N Y
R-squared 0.000 0.007 0.007 0.007 0.523 0.523 0.530 0.531
PANEL B: NON-STANDARD YEARS
(1) (2) (3) (4) (5) (6) (7) (8) Manager
Rating Manager Rating
Manager Rating
Manager Rating
Manager Rating
Manager Rating
Manager Rating
Manager Rating
Female 0.059 (0.034)
0.100* (0.040)
0.073 (0.056)
-0.099 (0.083)
-0.104 (0.085)
-0.095 (0.091)
-0.095 (0.091)
People of color -0.060 (0.042)
-0.064 (0.041)
-0.092 (0.055)
-0.235* (0.094)
-0.215* (0.101)
-0.200* (0.100)
-0.200* (0.100)
Female*POC 0.058 (0.083)
0.332* (0.138)
0.315* (0.142)
0.298* (0.147)
0.298* (0.147)
Constant 2.712*** (0.025)
2.824*** (0.033)
2.778*** (0.036)
2.790*** (0.041)
2.902*** (0.048)
2.908*** (0.051)
2.901*** (0.053)
2.901*** (0.053)
Observations 2,121 1,532 1,532 1,532 798 787 787 787
Manager FE N N N N Y Y Y Y
Region FE N N N N N Y Y Y
Job-level FE N N N N N N Y Y
Year-level FE N N N N N N N Y
R-squared 0.001 0.002 0.006 0.006 0.555 0.555 0.559 0.559

55
TABLE A.7.
AVERAGE SELF- AND MANAGER RATINGS BY GENDER X RACE INTERACTION IN THE UNITED
STATES IN STANDARD YEARS
White
Men
White
Women
Black
Men
Black
Women
Latinx
Men
Latinx
Women
Asian
Men
Asian
Women
Other
Men
Other
Women
Self-ratings 3.62
(0.74)
3.58
(0.72)
3.42
(0.82)
3.41
(0.83)
3.59
(0.78)
3.55
(0.77)
3.62
(0.77)
3.48
(0.72)
3.70
(0.81)
3.51
(0.78)
Manager
ratings
3.28
(0.80)
3.32
(0.78)
2.97
(0.81)
3.00
(0.73)
3.13
(0.78)
3.20
(0.78)
3.26
(0.79)
3.21
(0.77)
3.22
(0.83)
3.14
(0.77)
Observations 8,032 4,226 404 457 445 404 2,825 2,081 271 220 Notes. Self-ratings refer to the self-evaluation that each employee has to fill out and share with their manager before the manager
decides on their rating of the employee. The self-ratings row shows the average self-rating by each subgroup on the left with standard deviations
in parentheses. The manager ratings row shows the average rating that the corresponding subgroup receives from their managers (regardless of
the managers’ gender or ethnicity). The final row shows the total sample size for each subgroup

56
TABLE A.8.
COUNTERFACTUAL SIMULATION VARYING MANAGER RATINGS OF ASIAN EMPLOYEES IN THE
UNITED STATES IN STANDARD YEARS
Fraction of Asian
employees whose
manager rating gets
increased
Number of Asian
employees whose
manager rating gets
increased
Asian employee
β"!
(SE)
t-statistic
p-value
0.01 49 -0.059
(0.019)
t = -3.173
p = 0.002
0.02 98 -0.050
(0.019)
t = -2.655
p = 0.008
0.03 147 -0.040
(0.019)
t = -2.157
p = 0.031
0.04 196 -0.031
(0.019)
t = -1.626
p = 0.104
0.05 245 -0.21
(0.019)
t = -1.103
p = 0.270
0.06 294 -0.12
(0.019)
t = -0.612
p = 0.540
0.07 343 -0.002
(0.019)
t = -0.114
p = 0.909
0.08 392 0.007
(0.019)
t = 0.364
p = 0.716
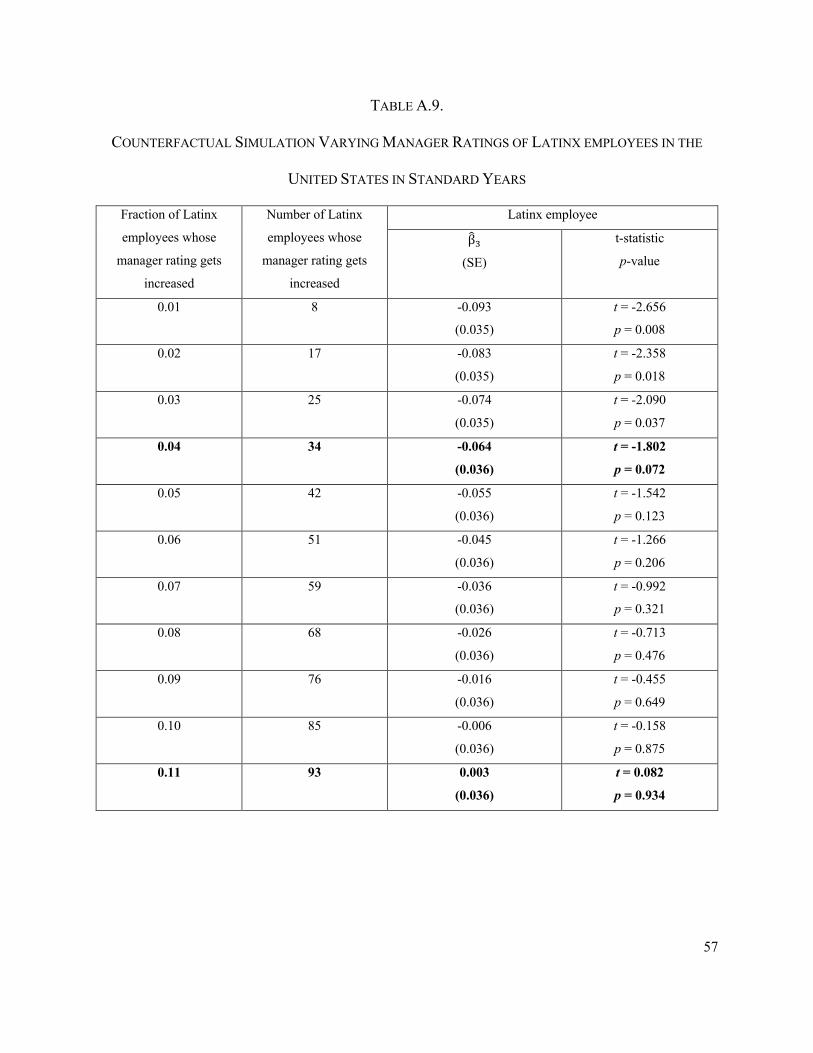
57
TABLE A.9.
COUNTERFACTUAL SIMULATION VARYING MANAGER RATINGS OF LATINX EMPLOYEES IN THE
UNITED STATES IN STANDARD YEARS
Fraction of Latinx
employees whose
manager rating gets
increased
Number of Latinx
employees whose
manager rating gets
increased
Latinx employee
β"!
(SE)
t-statistic
p-value
0.01 8 -0.093
(0.035)
t = -2.656
p = 0.008
0.02 17 -0.083
(0.035)
t = -2.358
p = 0.018
0.03 25 -0.074
(0.035)
t = -2.090
p = 0.037
0.04 34 -0.064
(0.036)
t = -1.802
p = 0.072
0.05 42 -0.055
(0.036)
t = -1.542
p = 0.123
0.06 51 -0.045
(0.036)
t = -1.266
p = 0.206
0.07 59 -0.036
(0.036)
t = -0.992
p = 0.321
0.08 68 -0.026
(0.036)
t = -0.713
p = 0.476
0.09 76 -0.016
(0.036)
t = -0.455
p = 0.649
0.10 85 -0.006
(0.036)
t = -0.158
p = 0.875
0.11 93 0.003
(0.036)
t = 0.082
p = 0.934

58
TABLE A.10.
COUNTERFACTUAL SIMULATION VARYING MANAGER RATINGS OF “OTHER” EMPLOYEES IN THE
UNITED STATES IN STANDARD YEARS
Fraction of “Other”
employees whose
manager rating gets
increased
Number of “Other”
employees whose
manager rating gets
increased
Employee with self-selected “Other” racial category
β"!
(SE)
t-statistic
p-value
0.01 5 -0.101
(0.043)
t = -2.348
p = 0.019
0.02 10 -0.092
(0.043)
t = -2.107
p = 0.035
0.03 15 -0.082
(0.044)
t = -1.877
p = 0.061
0.04 20 -0.072
(0.044)
t = -1.640
p = 0.101
0.05 25 -0.062
(0.044)
t = -1.418
p = 0.156
0.06 29 -0.054
(0.044)
t = -1.230
p = 0.219
0.07 34 -0.045
(0.044)
t = -1.025
p = 0.306
0.08 39 -0.035
(0.044)
t = -0.789
p = 0.430
0.09 44 -0.026
(0.045)
t = -0.573
p = 0.567
0.10 49 -0.015
(0.045)
t = -0.345
p = 0.730
0.11 54 -0.006
(0.045)
t = -0.139
p = 0.889
0.12 59 0.003
(0.045)
t = 0.077
p = 0.939
Recommended