SUPPLEMENTARY INFORMATIONDOI: 10.1038/NMAT4365
NATURE MATERIALS | www.nature.com/naturematerials 1
1
Negative-pressure induced enhancements in a freestanding
ferroelectric
Jin Wang1,2,*, Ben Wylie-van Eerd3, Tomas Sluka1, Cosmin Sandu1, Marco Cantoni4,
Xian-Kui Wei1,5, Alexander Kvasov1, Leo John McGilly1, Pascale Gemeiner6, Brahim
Dkhil6, Alexander Tagantsev1, Joe Trodahl3, Nava Setter1,*
1. Ceramics Laboratory, Swiss Federal Institute of Technology (EPFL), 1015
Lausanne, Switzerland.
2. Graduate School at Shenzhen, Tsinghua University, 518055, Shenzhen, China.
3. MacDiarmid Institute for Advanced Materials and Nanotechnology, Victoria
University of Wellington, New Zealand.
4. Interdisciplinary Centre for Electron Microscopy, Swiss Federal Institute of
Technology (EPFL), 1015 Lausanne, Switzerland.
5. Peter Grünberg Institute and Ernst Ruska Center for Microscopy and Spectroscopy
with Electrons, Research Center Jülich, 52425 Jülich, Germany.
6. Laboratoire Structures, Propriétés et Modélisation des Solides, CNRS-UMR8580,
Ecole Centrale Paris, Grande voie des vignes, 92290 Châtenay-Malabry, France.
*Corresponding author: J.W. ([email protected]) and N.S. ([email protected]).
Negative-pressure-induced enhancement in a freestanding ferroelectric
© 2015 Macmillan Publishers Limited. All rights reserved
2 NATURE MATERIALS | www.nature.com/naturematerials
SUPPLEMENTARY INFORMATION DOI: 10.1038/NMAT4365
2
Experimental details:
Preparation: Wires used here were prepared initially as PX via a hydrothermal
method1,2. 4 mmol Ti(OC4H9)4 was first dissolved in 8 mL ethanol and then
hydrolyzed in 8 mL deionized H2O. After adding 20 mmol KOH, 5.2 mmol
Pb(CH3COO)23H2O, and 0.050 g polyvinyl alcohol (PVA) under stirring, the final
feedstock was adjusted to 40 mL with deionized H2O and transferred to a 50mL
Teflon-lined autoclave. The hydrothermal processing was conducted at 200C for 3.5
hours. The products were washed first with deionized H2O for several cycles and then
with 10wt% H2(CH3COO)2 solution to remove unreacted ions and the remnant PbO.
The final pure PX-phase sample was obtained by another cycle of washing with de-
ionized H2O and dried at 60C in air. The PX-phase powders have the same
stoichiometry as perovskite PT but a crystalline structure with a reduced density (by
13%). When annealed in air at 540 °C for 30 min they transformed into conventional
perovskite PT. The microstructural feature and the phase characteristic of the
converted perovskite PT wires are shown in Supplementary Fig.1
© 2015 Macmillan Publishers Limited. All rights reserved
NATURE MATERIALS | www.nature.com/naturematerials 3
SUPPLEMENTARY INFORMATIONDOI: 10.1038/NMAT4365
3
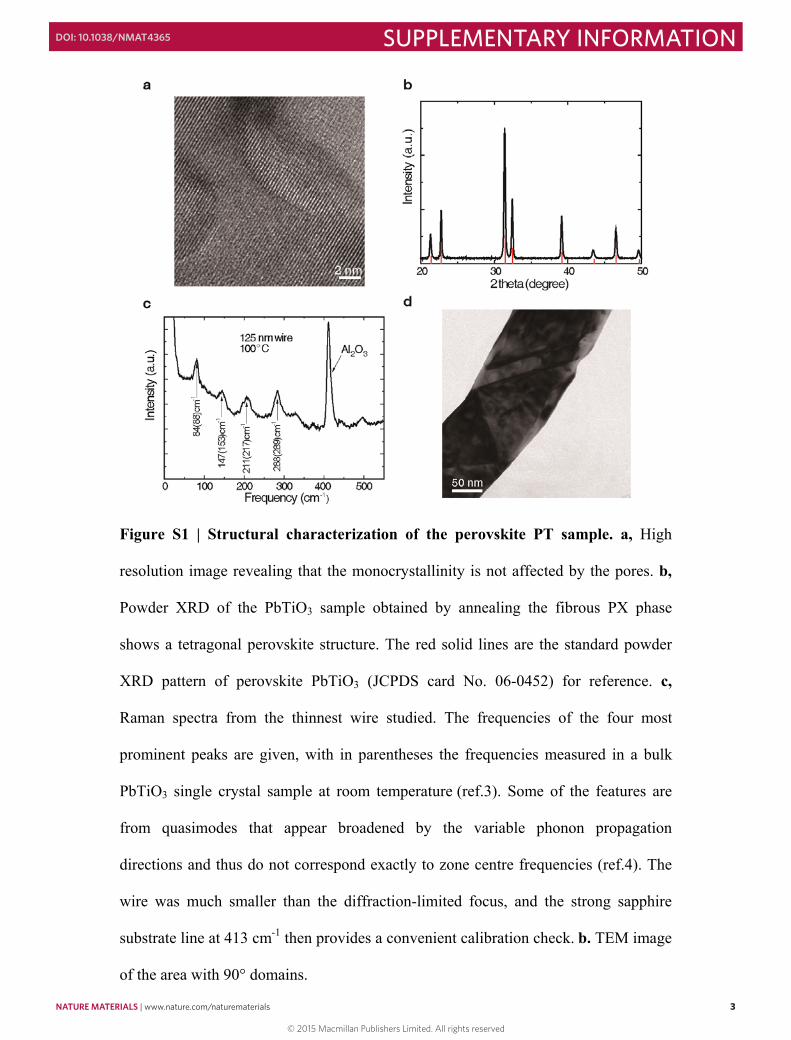
Figure S1 | Structural characterization of the perovskite PT sample. a, High
resolution image revealing that the monocrystallinity is not affected by the pores. b,
Powder XRD of the PbTiO3 sample obtained by annealing the fibrous PX phase
shows a tetragonal perovskite structure. The red solid lines are the standard powder
XRD pattern of perovskite PbTiO3 (JCPDS card No. 06-0452) for reference. c,
Raman spectra from the thinnest wire studied. The frequencies of the four most
prominent peaks are given, with in parentheses the frequencies measured in a bulk
PbTiO3 single crystal sample at room temperature (ref.3). Some of the features are
from quasimodes that appear broadened by the variable phonon propagation
directions and thus do not correspond exactly to zone centre frequencies (ref.4). The
wire was much smaller than the diffraction-limited focus, and the strong sapphire
substrate line at 413 cm-1 then provides a convenient calibration check. b. TEM image
of the area with 90° domains.
© 2015 Macmillan Publishers Limited. All rights reserved
4 NATURE MATERIALS | www.nature.com/naturematerials
SUPPLEMENTARY INFORMATION DOI: 10.1038/NMAT4365
4
Raman Spectroscopy on single wires. Raman spectroscopy was performed with a
Horiba Jobin-Yvon T64000 spectrometer, excited with the 514.5 nm line from an Ar+
ion laser. Measurements were performed on single wires of 125, 250 and 650 nm
diameter previously selected by scanning electron microscopy, on small bundles of
large-diameter wires and on a macroscopic pile of wires. The samples were supported
on sapphire substrates placed on the hearth of a Linkam variable-temperature
microscope stage capable of being heated to 600 °C. The single wires were too small
to be resolved in the microscope, so after imaging the field in a scanning electron
microscope they were identified by larger nearby bundles of wires. The power used
was reduced to avoid heating the wire, and carefully checked to establish that
increasing it by factors of 2 did not affect the results.X-ray Diffraction. The temperature-dependent XRD measurements on the multiple-
wire sample were performed using a high resolution two axis X-Ray diffractometer in
Bragg-Brentano geometry with the Cu-Kβ radiation (λ=1.3922 Å). The {200}, {220}
and {222} family peaks were recorded in the temperature range between 25 °C and
640 °C with a temperature step of 10 °C. After correction of the zero shift, the lattice
parameters in both tetragonal and cubic phases have been extracted.
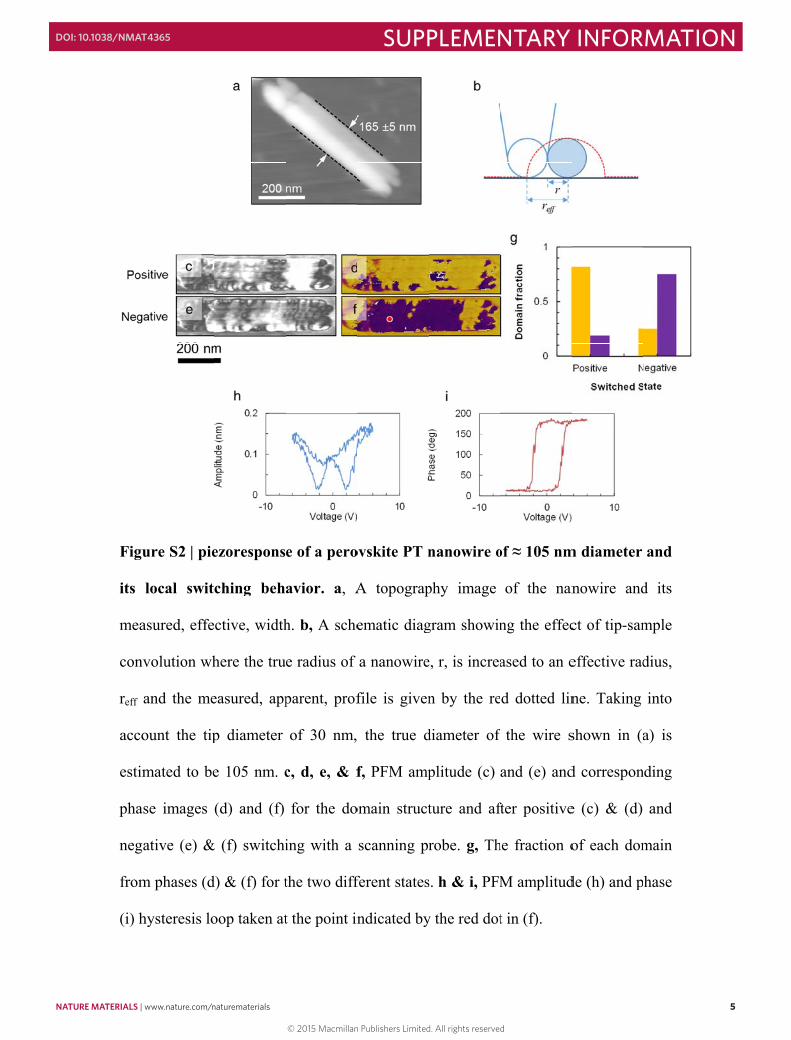
Ferroelectric switching and piezoelectric response: The local piezoelectric and
ferroelectric activity of the PT wires were examined by piezoresponse force
microscopy (Cypher™, Asylum Research) with a Ti/Ir coated tip (3 N /m in force
constant). Supplementary Fig. 2 shows representative result on an individual wire
dispersed on a conductive Nb-doped SrTiO3 substrate. The particular shown wire has
the diameter of ≈105 nm, showing switchability of the most highly stretched wires.
© 2015 Macmillan Publishers Limited. All rights reserved
NATURE MATERIALS | www.nature.com/naturematerials 5
SUPPLEMENTARY INFORMATIONDOI: 10.1038/NMAT4365
Figu
its
mea
conv
reff
acco
estim
pha
neg
from
(i) h
ure S2 | pie
local switc
asured, effe
volution wh
and the me
ount the tip
mated to be
se images
ative (e) &
m phases (d
hysteresis lo
ezorespons
ching beh
ctive, width
here the tru
easured, app
p diameter
e 105 nm. c
(d) and (f)
& (f) switchi
d) & (f) for t
oop taken at
e of a pero
avior. a, A
h. b, A sche
e radius of
parent, prof
of 30 nm,
c, d, e, & f
for the do
ing with a
the two diff
t the point in
ovskite PT n
A topograp
ematic diag
a nanowire
file is given
the true d
f, PFM amp
omain struct
scanning pr
ferent states
ndicated by
nanowire o
phy image
gram showin
e, r, is increa
n by the re
diameter of
plitude (c)
ture and af
robe. g, Th
s. h & i, PFM
y the red dot
of ≈ 105 nm
of the nan
ng the effec
ased to an e
d dotted lin
the wire s
and (e) and
fter positive
he fraction o
M amplitud
t in (f).
m diameter
nowire and
ct of tip-sam
effective rad
ne. Taking
shown in (a
d correspon
e (c) & (d)
of each dom
de (h) and p
5
and
d its
mple
dius,
into
a) is
nding
and
main
hase
© 2015 Macmillan Publishers Limited. All rights reserved
6 NATURE MATERIALS | www.nature.com/naturematerials
SUPPLEMENTARY INFORMATION DOI: 10.1038/NMAT4365
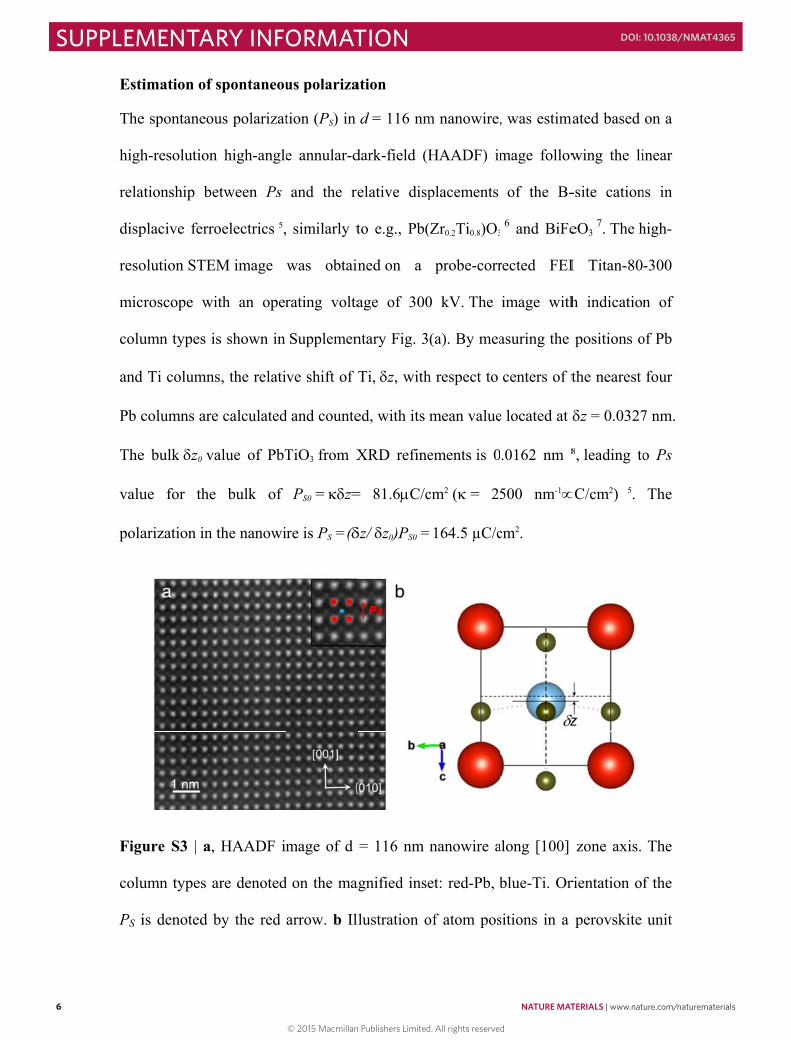
Esti
The
high
rela
disp
reso
mic
colu
and
Pb c
The
valu
pola
Figu
colu
PS i
imation of
e spontaneou
h-resolution
ationship be
placive ferro
olution STE
roscope wi
umn types i
Ti column
columns are
e bulk z0 v
ue for the
arization in
ure S3 | a,
umn types a
is denoted b
spontaneou
us polarizat
n high-angle
etween Ps
oelectrics 5,
EM image
ith an oper
is shown in
s, the relati
e calculated
alue of PbT
e bulk of
the nanowi
HAADF im
are denoted
by the red
us polariza
tion (PS) in
e annular-d
and the re
similarly t
was obtain
rating volta
Supplemen
ve shift of
d and counte
TiO3 from X
PS0 = z=
re is PS =(
mage of d
d on the ma
arrow. b Il
ation
d = 116 nm
dark-field (H
elative disp
to e.g., Pb(
ned on a
age of 300
ntary Fig. 3
Ti, z, with
ed, with its
XRD refine
= 81.6C/c
z/ z0)PS0 =
= 116 nm
agnified inse
llustration o
m nanowire,
HAADF) im
placements
(Zr0.2Ti0.8)O3
probe-corr
0 kV. The
(a). By mea
h respect to
mean value
ements is 0
cm2 ( = 25
= 164.5 µC/c
nanowire a
et: red-Pb, b
of atom pos
, was estima
mage follow
of the B-
6 and BiFe
rected FEI
image with
asuring the
centers of t
e located at
.0162 nm 8
500 nm-1
cm2.
along [100]
blue-Ti. Or
sitions in a
mated based
wing the li
-site cation
eO3 7. The h
I Titan-80
h indication
positions o
the nearest
z = 0.0327
8, leading to
C/cm2) 5.
zone axis.
rientation of
perovskite
6
on a
inear
ns in
high-
-300
n of
of Pb
four
7 nm.
o Ps
The
The
f the
unit
© 2015 Macmillan Publishers Limited. All rights reserved
NATURE MATERIALS | www.nature.com/naturematerials 7
SUPPLEMENTARY INFORMATIONDOI: 10.1038/NMAT4365
7
cell (red-Pb, blue-Ti, olive-O). z denotes the displacements of Ti with respect to
center of the nearest four Pb columns. The mean value of z in 116 nm nanowire is
0.0327 nm as measured from (a) while its bulk value in PbTiO3 is 0.0162 nm.
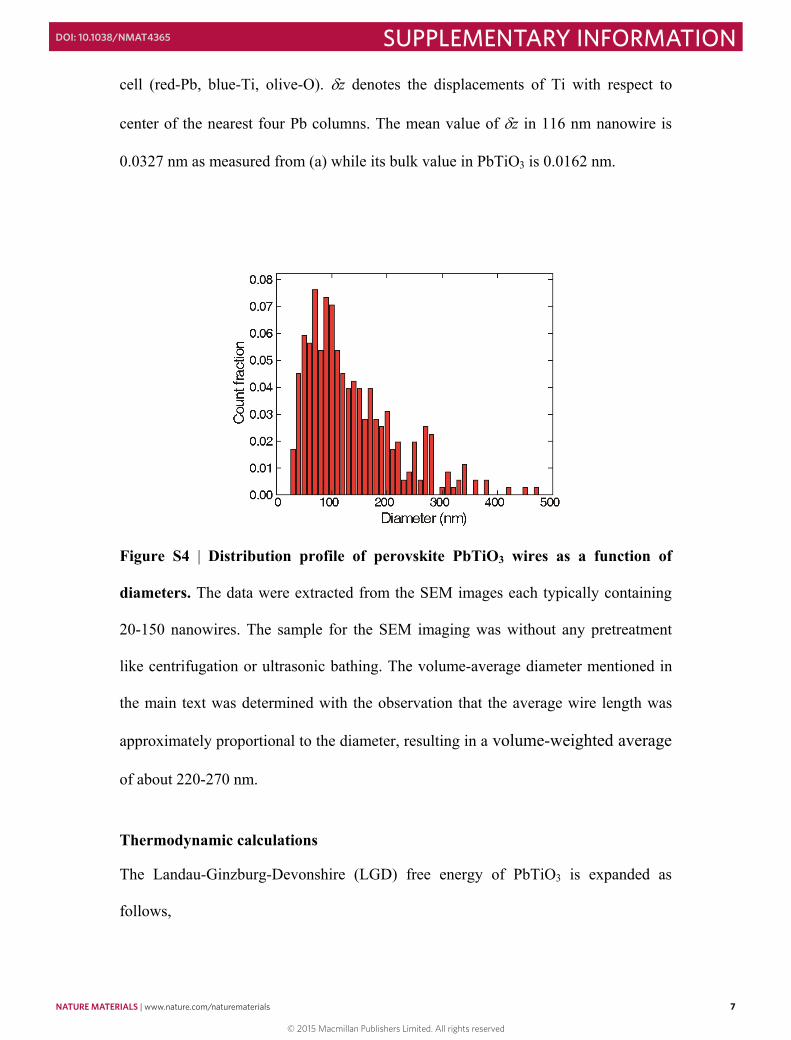
Figure S4 | Distribution profile of perovskite PbTiO3 wires as a function of
diameters. The data were extracted from the SEM images each typically containing
20-150 nanowires. The sample for the SEM imaging was without any pretreatment
like centrifugation or ultrasonic bathing. The volume-average diameter mentioned in
the main text was determined with the observation that the average wire length was
approximately proportional to the diameter, resulting in a volume-weighted average
of about 220-270 nm.
Thermodynamic calculations
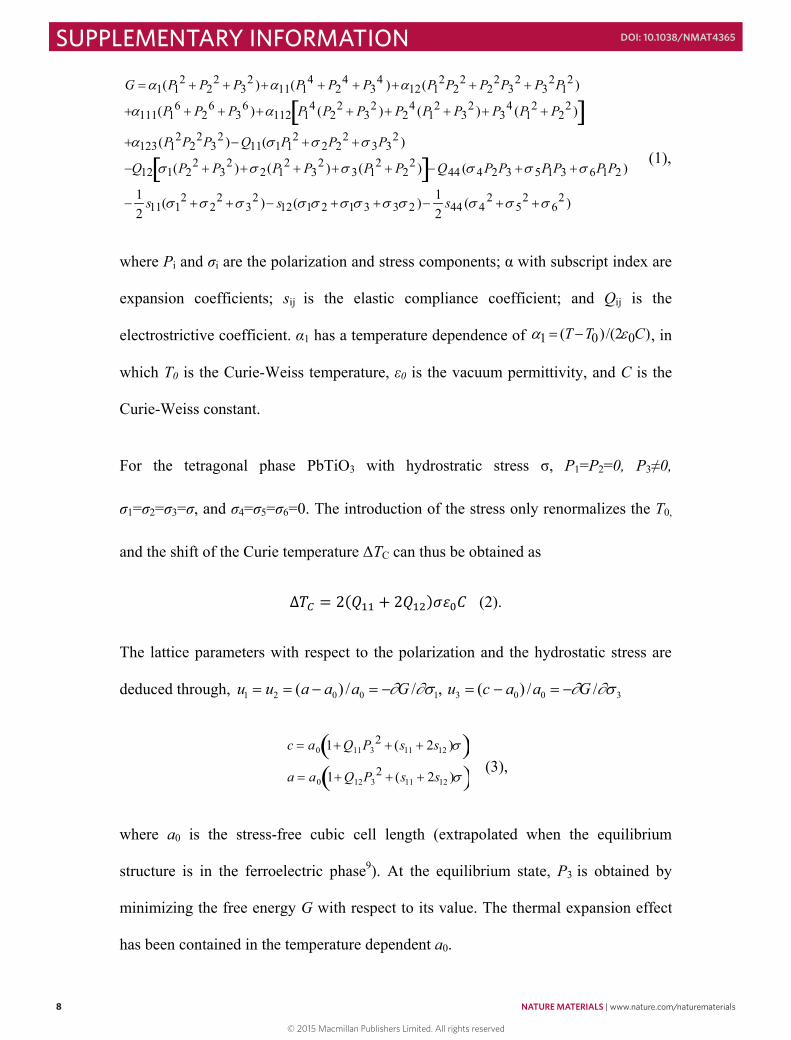
The Landau-Ginzburg-Devonshire (LGD) free energy of PbTiO3 is expanded as
follows,
© 2015 Macmillan Publishers Limited. All rights reserved
8 NATURE MATERIALS | www.nature.com/naturematerials
SUPPLEMENTARY INFORMATION DOI: 10.1038/NMAT4365
8
(1),
where Pi and σi are the polarization and stress components; α with subscript index are
expansion coefficients; sij is the elastic compliance coefficient; and Qij is the
electrostrictive coefficient. α1 has a temperature dependence of 1 (TT0)/(20C), in
which T0 is the Curie-Weiss temperature, ε0 is the vacuum permittivity, and C is the
Curie-Weiss constant.
For the tetragonal phase PbTiO3 with hydrostratic stress σ, P1=P2=0, P3≠0,
σ1=σ2=σ3=σ, and σ4=σ5=σ6=0. The introduction of the stress only renormalizes the T0,
and the shift of the Curie temperature ΔTC can thus be obtained as
��� � ����� � ��������� (2).
The lattice parameters with respect to the polarization and the hydrostatic stress are
deduced through, u1 u2 (a a0) /a0 G /1, u3 (c a0) /a0 G / 3
c a0 1Q11P32 (s11 2s12 )
a a0 1Q12P32 (s11 2s12 )
(3),
where a0 is the stress-free cubic cell length (extrapolated when the equilibrium
structure is in the ferroelectric phase9). At the equilibrium state, P3 is obtained by
minimizing the free energy G with respect to its value. The thermal expansion effect
has been contained in the temperature dependent a0.
G 1(P12 P2
2 P32 )11(P1
4 P24 P3
4 )12(P12P2
2 P22P3
2 P32P1
2 )
111(P16 P2
6 P36 )112 P1
4 (P22 P3
2 ) P24 (P1
2 P32 ) P3
4 (P12 P2
2 ) 123(P1
2P22P3
2 )Q11(1P12 2P2
2 3P32 )
Q12 1(P22 P3
2 ) 2(P12 P3
2 ) 3(P12 P2
2 ) Q44 ( 4 P2P3 5P1P3 6P1P2 )
12
s11(12 2
2 32 ) s12(1 2 1 3 3 2 ) 1
2s44 ( 4
2 52 6
2 )
© 2015 Macmillan Publishers Limited. All rights reserved
NATURE MATERIALS | www.nature.com/naturematerials 9
SUPPLEMENTARY INFORMATIONDOI: 10.1038/NMAT4365
9
For PbTiO3, Q12<0 and Q11>0. As hydrostatic tensile stress (σ>0) is imposed, the
spontaneous polarization will be increased, thus as seen from equation (3), in the
ferroelectric tetragonal phase, the c axis will have a definite increase due to the
enhancing role of both Pσ,T and σ terms. In parallel, the a axis will change much less
drastically since the effects of Pσ,T and σ terms tend to cancel out each other. This
feature is clearly shown in the measured lattice constants of the multiple-wire sample
(Fig. 3a).
Equations (2) and (3) are precise only in low pressure and higher-order terms in the
LGD expansion are needed for high pressure. However, as seen from Fig. 3c, the
deviation of the ab-initio results from the LGD results starts only above 3 GPa.
It is noted that although inhomogeneity of stress might be expected in highly stressed
wires as indicated in Fig. 4e, the signal in the XRD measurement on the multiple-wire
sample (Fig. 3a and 3b) is mainly from 220-270nm thick wires, in which the built-in
stress is the residual stress after relaxation due to the formation of a big central void or
cracks. It is expected that the stress heterogeneity is much reduced after relaxation and
thus it is reasonable to use uniform hydrostatic stress as effective stress in the LGD
simulation.
Ab-initio calculations
To study the behavior of PT under negative pressure we use the Quantum ESPRESSO
(QE)10 ab initio package. For the structural full relaxation calculations, we exploit
PWscf code, which is a set of programs for electronic structure calculations within
density functional theory (DFT). The PWscf calculations are made within the
generalized gradient approximation (GGA) with PBE exchange-correlation functional
© 2015 Macmillan Publishers Limited. All rights reserved
10 NATURE MATERIALS | www.nature.com/naturematerials
SUPPLEMENTARY INFORMATION DOI: 10.1038/NMAT4365
10
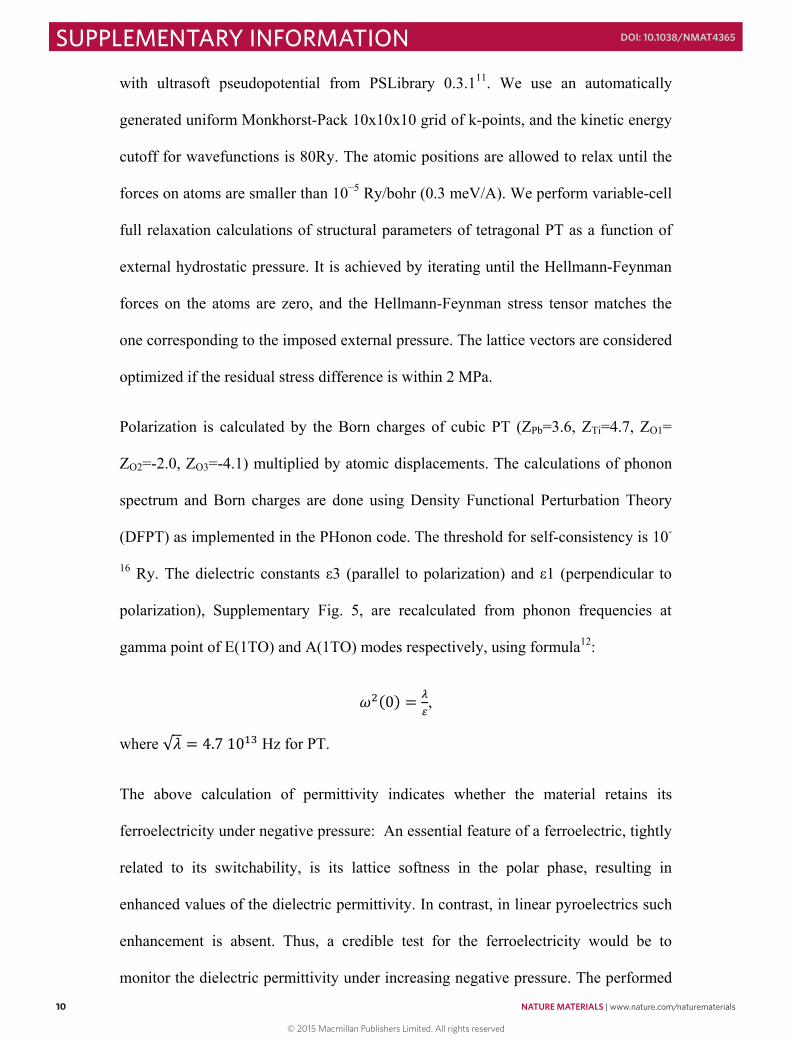
with ultrasoft pseudopotential from PSLibrary 0.3.111. We use an automatically
generated uniform Monkhorst-Pack 10x10x10 grid of k-points, and the kinetic energy
cutoff for wavefunctions is 80Ry. The atomic positions are allowed to relax until the
forces on atoms are smaller than 10−5 Ry/bohr (0.3 meV/A). We perform variable-cell
full relaxation calculations of structural parameters of tetragonal PT as a function of
external hydrostatic pressure. It is achieved by iterating until the Hellmann-Feynman
forces on the atoms are zero, and the Hellmann-Feynman stress tensor matches the
one corresponding to the imposed external pressure. The lattice vectors are considered
optimized if the residual stress difference is within 2 MPa.
Polarization is calculated by the Born charges of cubic PT (ZPb=3.6, ZTi=4.7, ZO1=
ZO2=-2.0, ZO3=-4.1) multiplied by atomic displacements. The calculations of phonon
spectrum and Born charges are done using Density Functional Perturbation Theory
(DFPT) as implemented in the PHonon code. The threshold for self-consistency is 10-
16 Ry. The dielectric constants ε3 (parallel to polarization) and ε1 (perpendicular to
polarization), Supplementary Fig. 5, are recalculated from phonon frequencies at
gamma point of E(1TO) and A(1TO) modes respectively, using formula12:
���0� � ��,
where √� � ���10�� Hz for PT.
The above calculation of permittivity indicates whether the material retains its
ferroelectricity under negative pressure: An essential feature of a ferroelectric, tightly
related to its switchability, is its lattice softness in the polar phase, resulting in
enhanced values of the dielectric permittivity. In contrast, in linear pyroelectrics such
enhancement is absent. Thus, a credible test for the ferroelectricity would be to
monitor the dielectric permittivity under increasing negative pressure. The performed
© 2015 Macmillan Publishers Limited. All rights reserved
NATURE MATERIALS | www.nature.com/naturematerials 11
SUPPLEMENTARY INFORMATIONDOI: 10.1038/NMAT4365
11
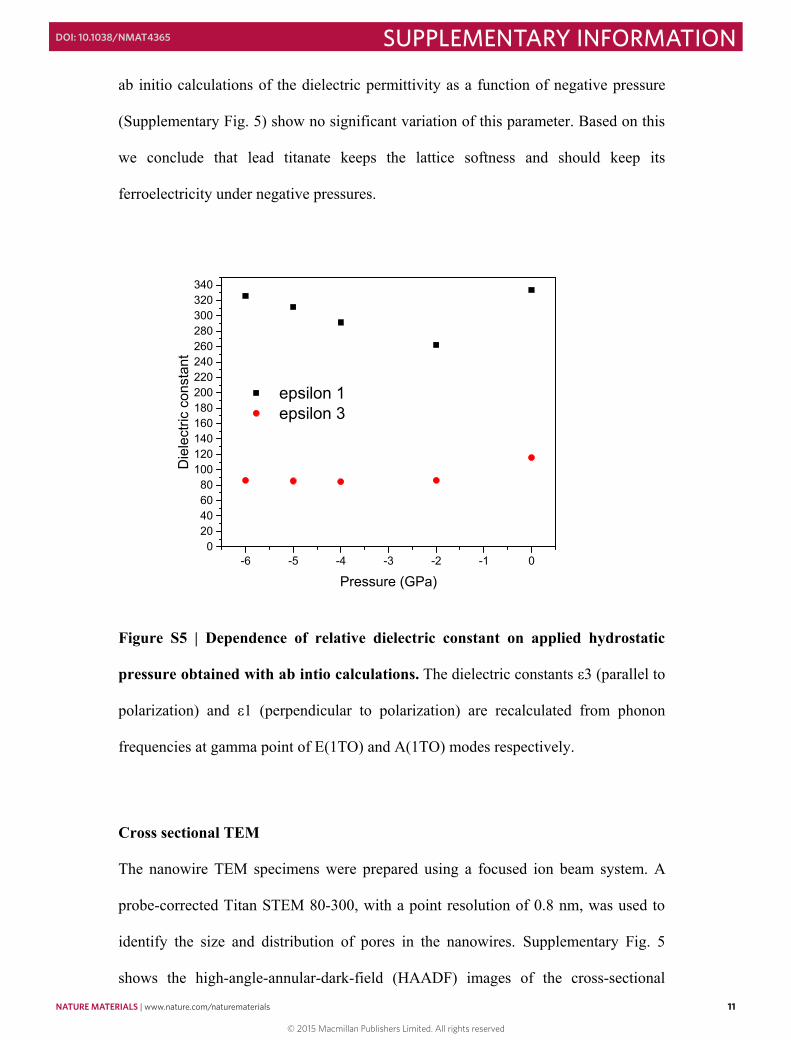
ab initio calculations of the dielectric permittivity as a function of negative pressure
(Supplementary Fig. 5) show no significant variation of this parameter. Based on this
we conclude that lead titanate keeps the lattice softness and should keep its
ferroelectricity under negative pressures.
-6 -5 -4 -3 -2 -1 00
20406080
100120140160180200220240260280300320340
Die
lect
ric c
onst
ant
Pressure (GPa)
epsilon 1 epsilon 3
Figure S5 | Dependence of relative dielectric constant on applied hydrostatic
pressure obtained with ab intio calculations. The dielectric constants ε3 (parallel to
polarization) and ε1 (perpendicular to polarization) are recalculated from phonon
frequencies at gamma point of E(1TO) and A(1TO) modes respectively.
Cross sectional TEM
The nanowire TEM specimens were prepared using a focused ion beam system. A
probe-corrected Titan STEM 80-300, with a point resolution of 0.8 nm, was used to
identify the size and distribution of pores in the nanowires. Supplementary Fig. 5
shows the high-angle-annular-dark-field (HAADF) images of the cross-sectional
© 2015 Macmillan Publishers Limited. All rights reserved
12 NATURE MATERIALS | www.nature.com/naturematerials
SUPPLEMENTARY INFORMATION DOI: 10.1038/NMAT4365
12
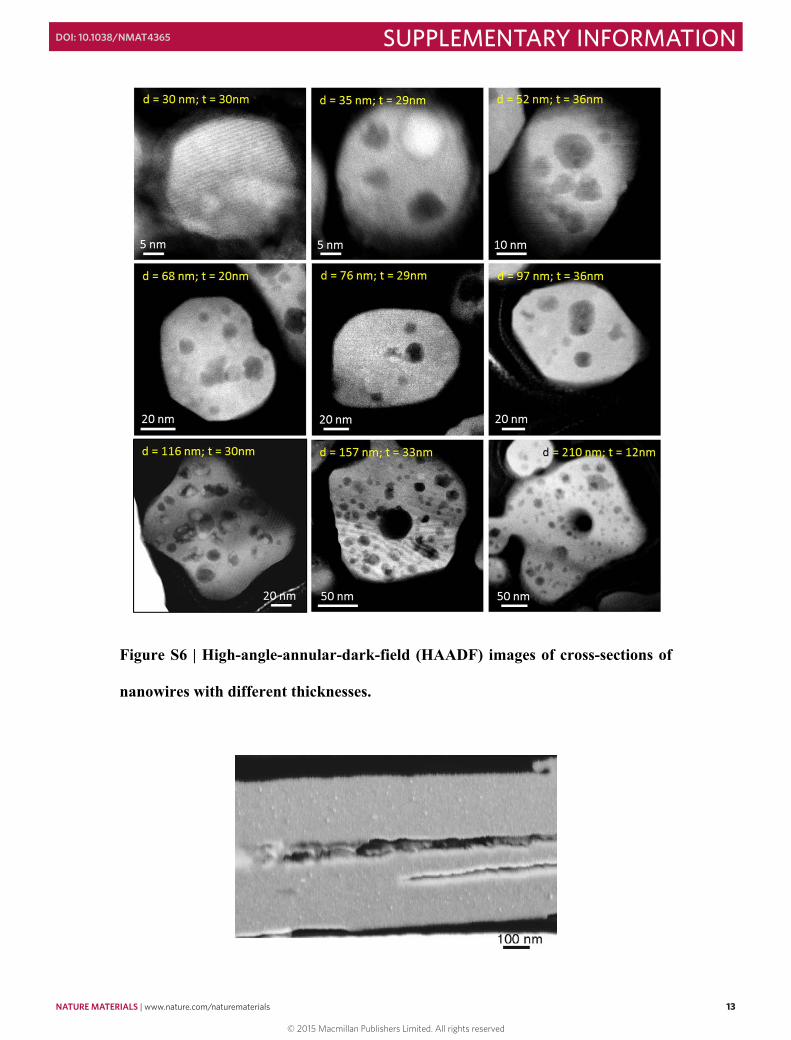
specimens. Since the HAADF technique is sensitive to element distribution and
specimen thickness, morphology and size of the pores in the nanowire can be directly
identified. The thickness of the cross sections is estimated by analyzing the electron
energy loss spectra collected on the TEM, the mean free path of electrons used for the
estimation is λ = 100 nm. From the morphology of the samples, it can be seen that the
thinner wires with fewer pores have a round cross section. With increasing of the
diameter, the cross section of the wires transforms from a round to a rectangular shape.
The most evident effect of negative pressure appears in the wire with diameter d =
116 nm, where the flat surfaces, i.e., the edges of the cross section, strongly bent
towards the wire center. In other wires, such bending behavior is less evident but
indication of the negative pressure effect can still be seen from the wire with
diameters of d = 68 nm, 97 nm, 157 nm and 210 nm. In addition, it can be seen that
larger pores with sizes above 20 nm appear in wires with large diameter.
© 2015 Macmillan Publishers Limited. All rights reserved
NATURE MATERIALS | www.nature.com/naturematerials 13
SUPPLEMENTARY INFORMATIONDOI: 10.1038/NMAT4365
13
Figure S6 | High-angle-annular-dark-field (HAADF) images of cross-sections of
nanowires with different thicknesses.
© 2015 Macmillan Publishers Limited. All rights reserved
14 NATURE MATERIALS | www.nature.com/naturematerials
SUPPLEMENTARY INFORMATION DOI: 10.1038/NMAT4365
14
Figure S7 | A tomogram of a perovskite PbTiO3 wire with a thickness about 550
nm. The image was obtained by FIB (focused ion beam)-milling-assisted SEM,
showing the cracks in the center. The spot-like features in the cross-section are the
tiny pores inside the wire.
Description and results of simulation
In the qualitative scenario formulated in the main text for the formation of the
negative pressure at the PX/perovskite phase transition in a nanowire, the following
principle features can be singled out: (i) the negative pressure in nanowires forms as
a result of the layer-by-layer phase transition between the two phases, which is
accompanied with the plastic deformation and a volume reduction of 13%, (ii) the
negative pressure increases with increasing diameter of the nanowire, (iii) the
PX/perovskite phase transition is triggered by catalytic oxygen which is supplied by
diffusion from the surface of the nanowire, (iv) the negative pressure is controlled by
the relation between the width of the phase front for the PX/perovskite phase
transition and the wire diameter. Here we simulate this scenario. Specifically, we will
show that a phase transition of this kind (with a strong volume reduction and plastic
deformation) once triggered by a species provided by diffusion from the surface of
the wire will be accompanied by negative pressure formation, increasing as a function
of the wire diameter.
We have performed a 2D plane-strain elasto-plastic modeling with the local phase of
the system being described with a parameter � � ���1�where 0 stands for pure PX
and 1 for pure perovskite phase. Here it is defined as � � �1 � �������� ���������where � is a constant determining the width of a phase boundary and C
and C0 are the actual concentration of the catalytic oxygen and concentration at which
© 2015 Macmillan Publishers Limited. All rights reserved
NATURE MATERIALS | www.nature.com/naturematerials 15
SUPPLEMENTARY INFORMATIONDOI: 10.1038/NMAT4365
15
PTr occurs, respectively. The change of the phase parameter � introduces volume
change into the tensor of a total strain through the zero-stress spontaneous-
strain����� � ������ for i=j=1,2, when a=0.063 (in case of a 2D model).
The equations of the elasto-plastic model introduces below are those adopted by
software Comsol Multiphysics13 from theory developed in Refs. 14, 15. In this model,
the total strain �� � � � �� includes the elasto-plastic strain � � �� ������ � �� where
�� � �����is a deformation gradient tensor composed of two parts: elastic � � �� ���� and plastic �� � �mises � �ys if �� � 0. Here �mises is the von Mises stress and
�ys � �ys0 � �Tiso���Tiso�
�pe is a yield stress where �ys0 is an initial yield stress, �Tisois an
isotropic tangent modulus, � is the Young’s modulus, and �pe � �� ������ � �� is an
effective plastic strain. We have chosen the simplest model for plasticity in order to
demonstrate the fundamental mechanism. We have also tested wide range of �ys0 and
�Tiso values while no crucial impact on qualitative behavior of the negative pressure
formation was found. On the other hand, the magnitude of the built-in negative
pressure is relatively strongly sensitive to the value of the Young’s modulus �. Even
though a quantitative precision of the model was not expected, it was possible to
reproduce the magnitudes of the experimental c/a ratio when � was assumed about
two times larger than 2.3710��Pa reported in Ref. 16 and the parameters �ys0 and
�Tiso were used as optimization parameters to maximize the negative pressure. The
qualitative characteristics of the model predictions – the negative pressure formation
and its dependence on wire diameter – are robust.
PTr follows the change of concentration of the catalytic oxygen resulting from the
ambient-to-wire influx. We assume a simple model for oxygen influx to the wire from
© 2015 Macmillan Publishers Limited. All rights reserved
16 NATURE MATERIALS | www.nature.com/naturematerials
SUPPLEMENTARY INFORMATION DOI: 10.1038/NMAT4365
16
analogy with the heat surface radiation �. ������ � ��� where � is a surface
normal vector and � is a diffusion coefficient and � is oxygen transmissibility
through the surface. D and e determine the speed of oxygen influx and its distribution.
The initial concentration C of the wire is set slightly above the defined phase
transition point C0 , i.e. C/C0 =1.0017, to minimize calculation time before the phase
transformation starts.
The concentration distribution is solved with a classical diffusion equation ���� �
�. �����. The key feature of the introduced simulation is that the change of the phase
parameter �, i.e. also the shrinkage, proceeds from the surface of the wire inward
with the center of the phase boundary located at isosurface C=C0.
The PTr-induced shrinkage and the stress-strain distribution is calculated by
equation: ��. � � � where � � ������������ . Here � � ����� were ��� is the
isotropic tensor of elastic stiffness given classically by Young’s modulus � and
poisons ratio ν.
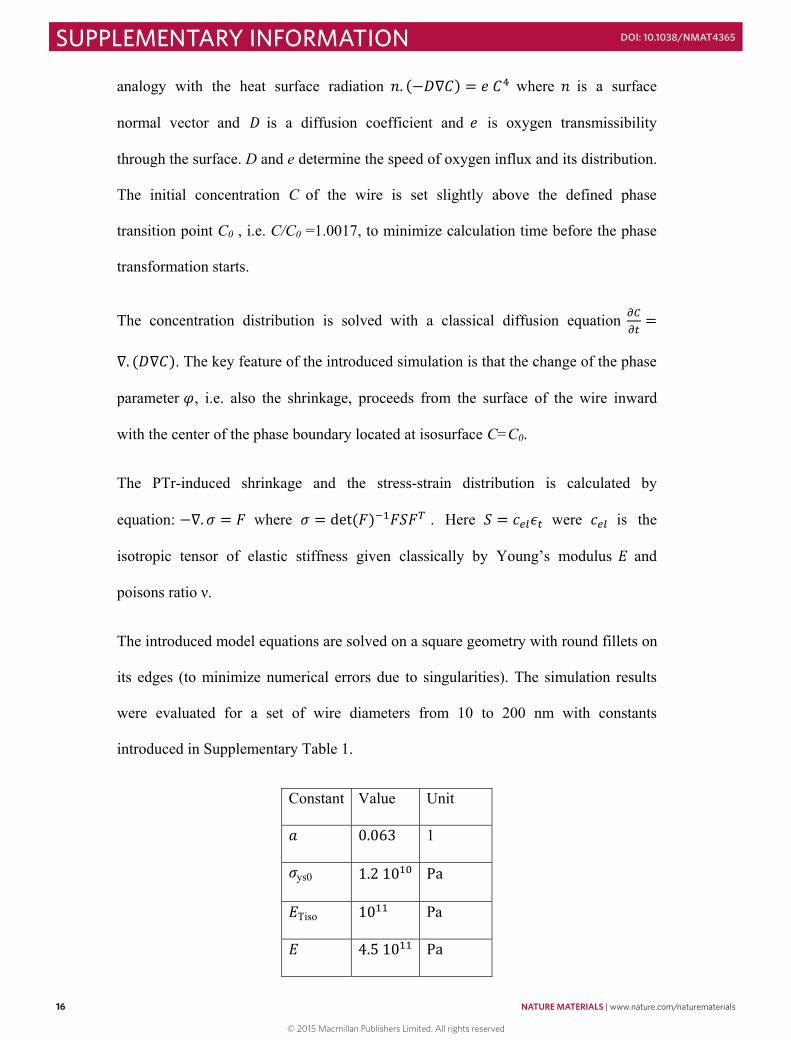
The introduced model equations are solved on a square geometry with round fillets on
its edges (to minimize numerical errors due to singularities). The simulation results
were evaluated for a set of wire diameters from 10 to 200 nm with constants
introduced in Supplementary Table 1.
Constant Value Unit
� 0.063 1
�ys0 1.2 10�� Pa
�Tiso 10�� Pa
� 4.5 10�� Pa
© 2015 Macmillan Publishers Limited. All rights reserved
NATURE MATERIALS | www.nature.com/naturematerials 17
SUPPLEMENTARY INFORMATIONDOI: 10.1038/NMAT4365
17
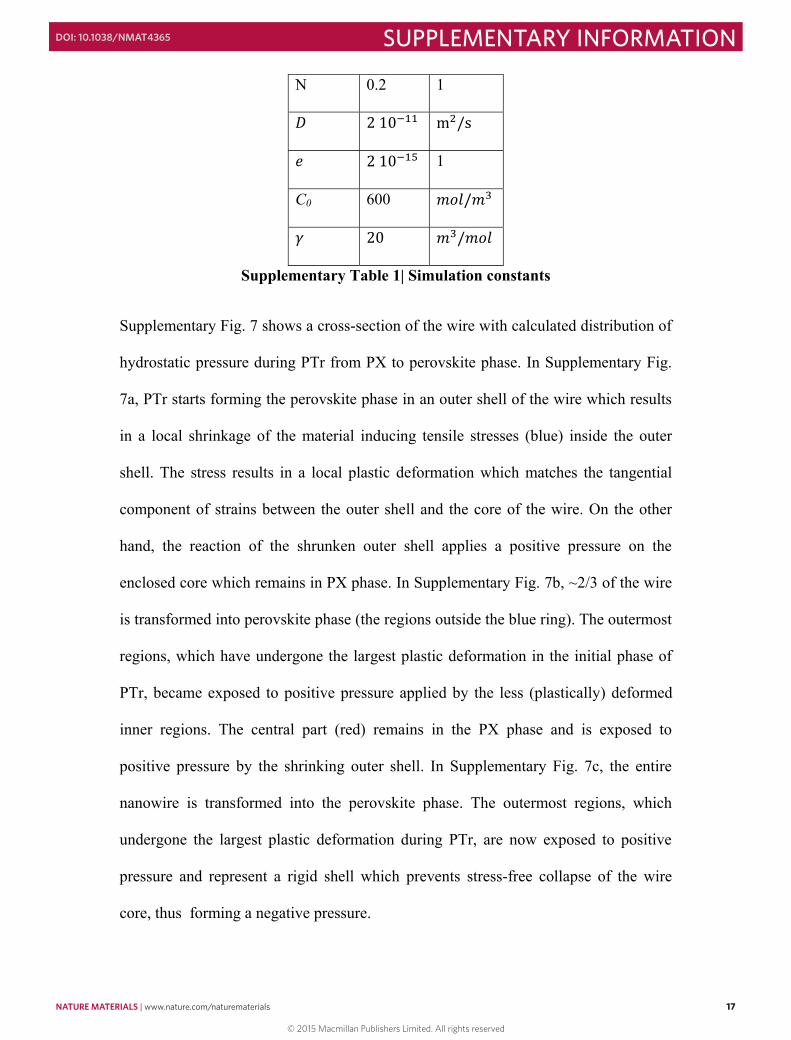
Ν 0.2 1
� 2 10��� m�/s � 2 10��� 1
C0 600 ���/��
� 20 ��/���
Supplementary Table 1| Simulation constants
Supplementary Fig. 7 shows a cross-section of the wire with calculated distribution of
hydrostatic pressure during PTr from PX to perovskite phase. In Supplementary Fig.
7a, PTr starts forming the perovskite phase in an outer shell of the wire which results
in a local shrinkage of the material inducing tensile stresses (blue) inside the outer
shell. The stress results in a local plastic deformation which matches the tangential
component of strains between the outer shell and the core of the wire. On the other
hand, the reaction of the shrunken outer shell applies a positive pressure on the
enclosed core which remains in PX phase. In Supplementary Fig. 7b, ~2/3 of the wire
is transformed into perovskite phase (the regions outside the blue ring). The outermost
regions, which have undergone the largest plastic deformation in the initial phase of
PTr, became exposed to positive pressure applied by the less (plastically) deformed
inner regions. The central part (red) remains in the PX phase and is exposed to
positive pressure by the shrinking outer shell. In Supplementary Fig. 7c, the entire
nanowire is transformed into the perovskite phase. The outermost regions, which
undergone the largest plastic deformation during PTr, are now exposed to positive
pressure and represent a rigid shell which prevents stress-free collapse of the wire
core, thus forming a negative pressure.
© 2015 Macmillan Publishers Limited. All rights reserved
18 NATURE MATERIALS | www.nature.com/naturematerials
SUPPLEMENTARY INFORMATION DOI: 10.1038/NMAT4365
18
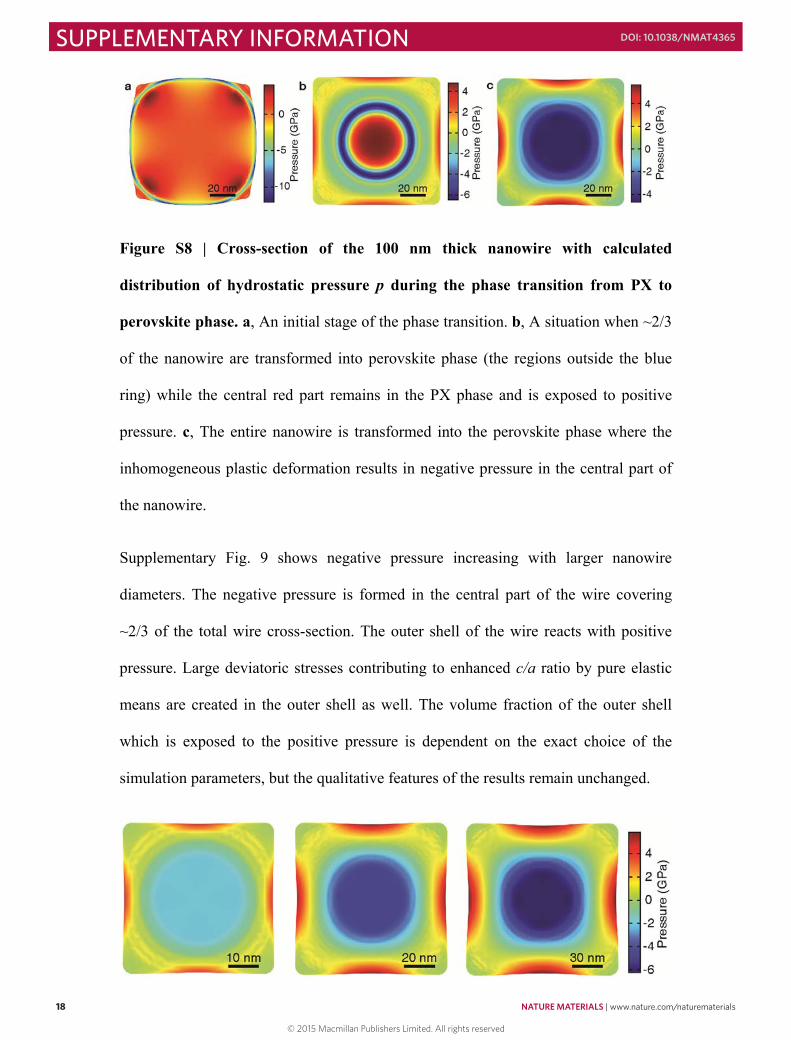
Figure S8 | Cross-section of the 100 nm thick nanowire with calculated
distribution of hydrostatic pressure p during the phase transition from PX to
perovskite phase. a, An initial stage of the phase transition. b, A situation when ~2/3
of the nanowire are transformed into perovskite phase (the regions outside the blue
ring) while the central red part remains in the PX phase and is exposed to positive
pressure. c, The entire nanowire is transformed into the perovskite phase where the
inhomogeneous plastic deformation results in negative pressure in the central part of
the nanowire.
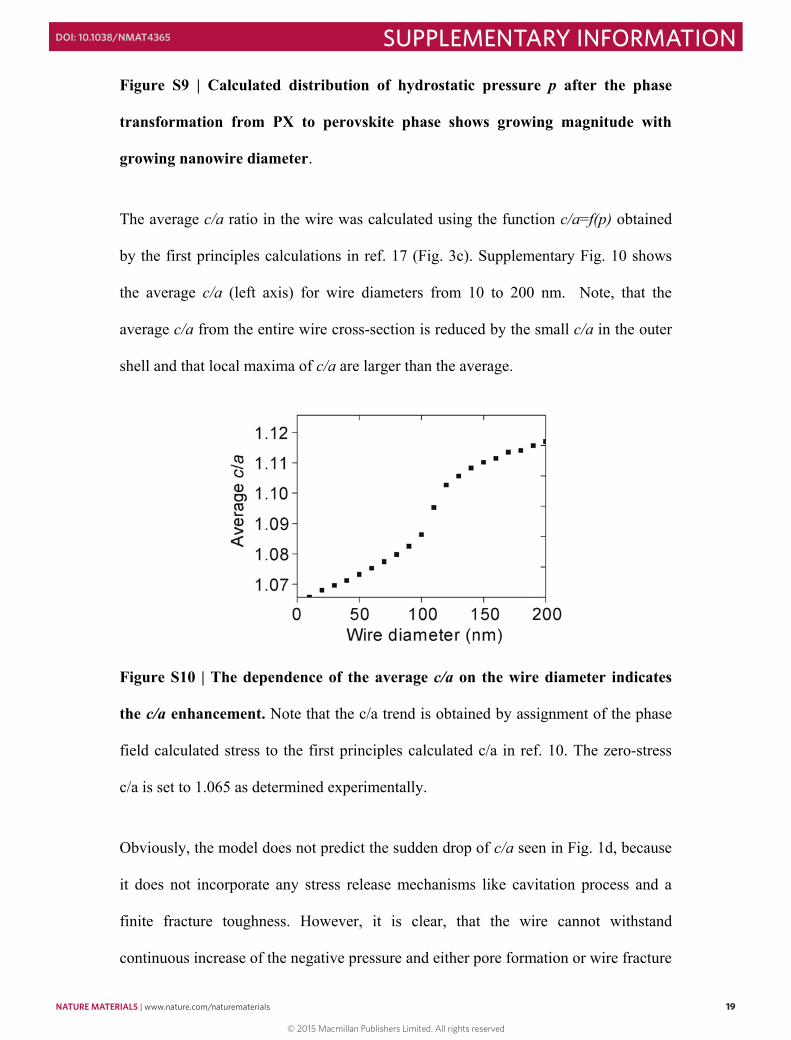
Supplementary Fig. 9 shows negative pressure increasing with larger nanowire
diameters. The negative pressure is formed in the central part of the wire covering
~2/3 of the total wire cross-section. The outer shell of the wire reacts with positive
pressure. Large deviatoric stresses contributing to enhanced c/a ratio by pure elastic
means are created in the outer shell as well. The volume fraction of the outer shell
which is exposed to the positive pressure is dependent on the exact choice of the
simulation parameters, but the qualitative features of the results remain unchanged.
© 2015 Macmillan Publishers Limited. All rights reserved
NATURE MATERIALS | www.nature.com/naturematerials 19
SUPPLEMENTARY INFORMATIONDOI: 10.1038/NMAT4365
19
Figure S9 | Calculated distribution of hydrostatic pressure p after the phase
transformation from PX to perovskite phase shows growing magnitude with
growing nanowire diameter.
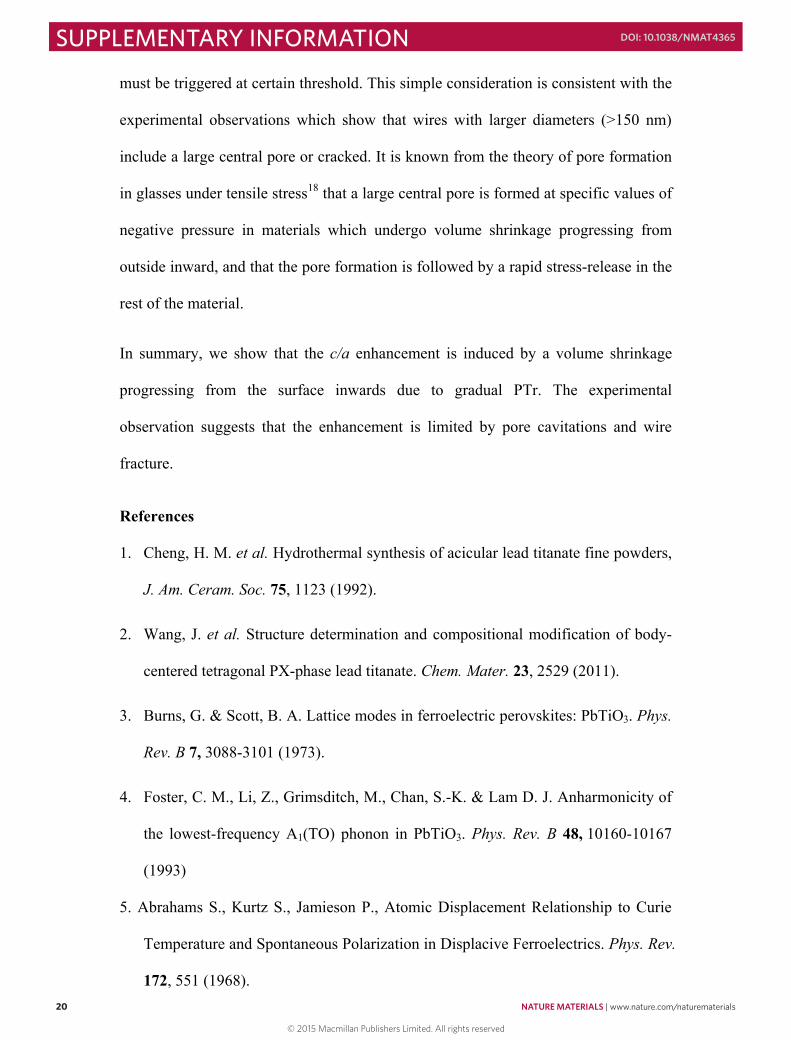
The average c/a ratio in the wire was calculated using the function c/a=f(p) obtained
by the first principles calculations in ref. 17 (Fig. 3c). Supplementary Fig. 10 shows
the average c/a (left axis) for wire diameters from 10 to 200 nm. Note, that the
average c/a from the entire wire cross-section is reduced by the small c/a in the outer
shell and that local maxima of c/a are larger than the average.
Figure S10 | The dependence of the average c/a on the wire diameter indicates
the c/a enhancement. Note that the c/a trend is obtained by assignment of the phase
field calculated stress to the first principles calculated c/a in ref. 10. The zero-stress
c/a is set to 1.065 as determined experimentally.
Obviously, the model does not predict the sudden drop of c/a seen in Fig. 1d, because
it does not incorporate any stress release mechanisms like cavitation process and a
finite fracture toughness. However, it is clear, that the wire cannot withstand
continuous increase of the negative pressure and either pore formation or wire fracture
© 2015 Macmillan Publishers Limited. All rights reserved
20 NATURE MATERIALS | www.nature.com/naturematerials
SUPPLEMENTARY INFORMATION DOI: 10.1038/NMAT4365
20
must be triggered at certain threshold. This simple consideration is consistent with the
experimental observations which show that wires with larger diameters (>150 nm)
include a large central pore or cracked. It is known from the theory of pore formation
in glasses under tensile stress18 that a large central pore is formed at specific values of
negative pressure in materials which undergo volume shrinkage progressing from
outside inward, and that the pore formation is followed by a rapid stress-release in the
rest of the material.
In summary, we show that the c/a enhancement is induced by a volume shrinkage
progressing from the surface inwards due to gradual PTr. The experimental
observation suggests that the enhancement is limited by pore cavitations and wire
fracture.
References
1. Cheng, H. M. et al. Hydrothermal synthesis of acicular lead titanate fine powders,
J. Am. Ceram. Soc. 75, 1123 (1992).
2. Wang, J. et al. Structure determination and compositional modification of body-
centered tetragonal PX-phase lead titanate. Chem. Mater. 23, 2529 (2011).
3. Burns, G. & Scott, B. A. Lattice modes in ferroelectric perovskites: PbTiO3. Phys.
Rev. B 7, 3088-3101 (1973).
4. Foster, C. M., Li, Z., Grimsditch, M., Chan, S.-K. & Lam D. J. Anharmonicity of
the lowest-frequency A1(TO) phonon in PbTiO3. Phys. Rev. B 48, 10160-10167
(1993)
5. Abrahams S., Kurtz S., Jamieson P., Atomic Displacement Relationship to Curie
Temperature and Spontaneous Polarization in Displacive Ferroelectrics. Phys. Rev.
172, 551 (1968).
© 2015 Macmillan Publishers Limited. All rights reserved
NATURE MATERIALS | www.nature.com/naturematerials 21
SUPPLEMENTARY INFORMATIONDOI: 10.1038/NMAT4365
21
6. Jia C. L., et al. Unit-cell scale mapping of ferroelectricity and tetragonality in
epitaxial ultrathin ferroelectric films. Nature Mater. 6, 64 (2007).
7. Nelson C. T., et al. Spontaneous vortex nanodomain arrays at ferroelectric
heterointerfaces. Nano Lett. 11, 828 (2011).
8. Glazer A. M. & Mabud S. A. Powder profile refinement of lead zirconate titanate at
several temperatures .II. Pure PbTiO3. Acta Crystallogr. B 34, 1065 (1978).
9 Haun, M. J., Furman, E., Jang, S. J., McKinstry, H. A. & Cross, L. E.
Thermodynamic theory of PbTiO3. J. Appl. Phys. 62, 3331 (1987).
10. P. Giannozzi, et al, Journal of Physics: Condensed Matter 21, 395502 (2009).
11. http://www.qe-forge.org/gf/project/pslibrary/
12. V. G. Vaks, Introduction into Microscopic Theory of Ferroelectrics (Nauka, Moscow, 1973).
13. Adaptation of the elasto-plastic equations from Refs 9, 10 for Comsol
Multiphysics 4.3a is described in detail in Comsol’s “Nonlinear Structural
Materials Module” documentation.
14. Simo, J.C. Algorithms for static and dynamic multiplicative plasticity that
preserve the classic return mapping schemes of the infinitesimal theory. Comput.
Method. Appl. M, 99, 61 (1992).
15. Simo, J.C. & Hughes, T.J.R. Computational Inelasticity, Springer, 1998
16. Mabud, S. A. & Glazer, A. M. Lattice parameters and birefringence in PbTiO3
single crystal. J. Appl. Phys. 62, 49-53 (1979).
17. Tinte, S., Rabe, K. M. & Vanderbilt, D. Anomalous enhancement of tetragonality
in PbTiO3 induced by negative pressure. Phys. Rev. B. 68, 144105 (2003).
18. Abyzov, A. S., Schmelzer, J. W. P. & Fokin, V. M. Theory of pore formation in
glass under tensile stress: Generalized Gibbs approach. J. Non-Cryst. Solids 357,
3474 (2011)..
© 2015 Macmillan Publishers Limited. All rights reserved
Recommended