Supplementary Information
Reduced Graphene Oxide by Chemical Graphitization
In Kyu Moon, Junghyun Lee, Rodney S. Ruoff, & Hyoyoung Lee
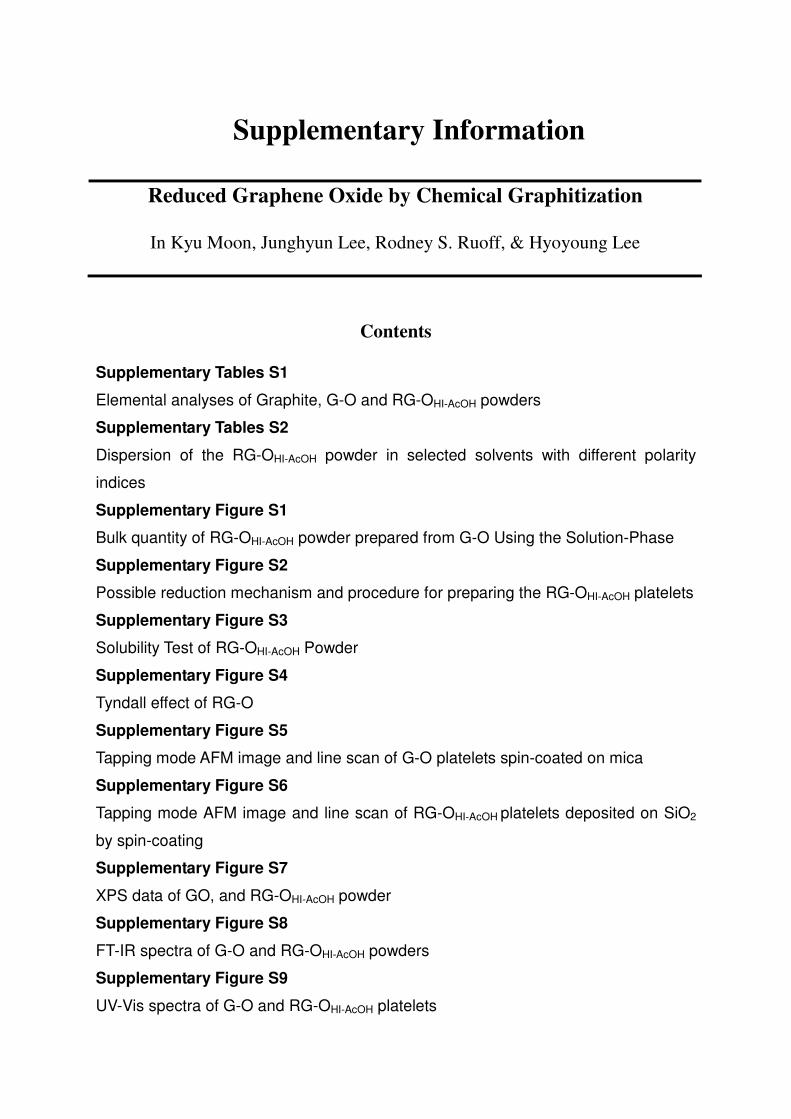
Contents
Supplementary Tables S1
Elemental analyses of Graphite, G-O and RG-OHI-AcOH powders
Supplementary Tables S2
Dispersion of the RG-OHI-AcOH powder in selected solvents with different polarity
indices
Supplementary Figure S1
Bulk quantity of RG-OHI-AcOH powder prepared from G-O Using the Solution-Phase
Supplementary Figure S2
Possible reduction mechanism and procedure for preparing the RG-OHI-AcOH platelets
Supplementary Figure S3
Solubility Test of RG-OHI-AcOH Powder
Supplementary Figure S4
Tyndall effect of RG-O
Supplementary Figure S5
Tapping mode AFM image and line scan of G-O platelets spin-coated on mica
Supplementary Figure S6
Tapping mode AFM image and line scan of RG-OHI-AcOH platelets deposited on SiO2
by spin-coating
Supplementary Figure S7
XPS data of GO, and RG-OHI-AcOH powder
Supplementary Figure S8
FT-IR spectra of G-O and RG-OHI-AcOH powders
Supplementary Figure S9
UV-Vis spectra of G-O and RG-OHI-AcOH platelets

Supplementary Figure S10
Conductivity of RG-OHI-AcOH graphene, chemically converted graphene (CCG),
chemically converted graphene (CCG2), and HRG
Supplementary Figure S11
Fabrication of G-O paper and VRG-OHI-AcOH paper
Supplementary Figure S12
Digital images of the apparatus for preparing VRG-ONH2NH2 paper
Supplementary Figure S13
Deconvoluted XPS C1s spectra
Supplementary Figure S14
Optical images of the surfaces
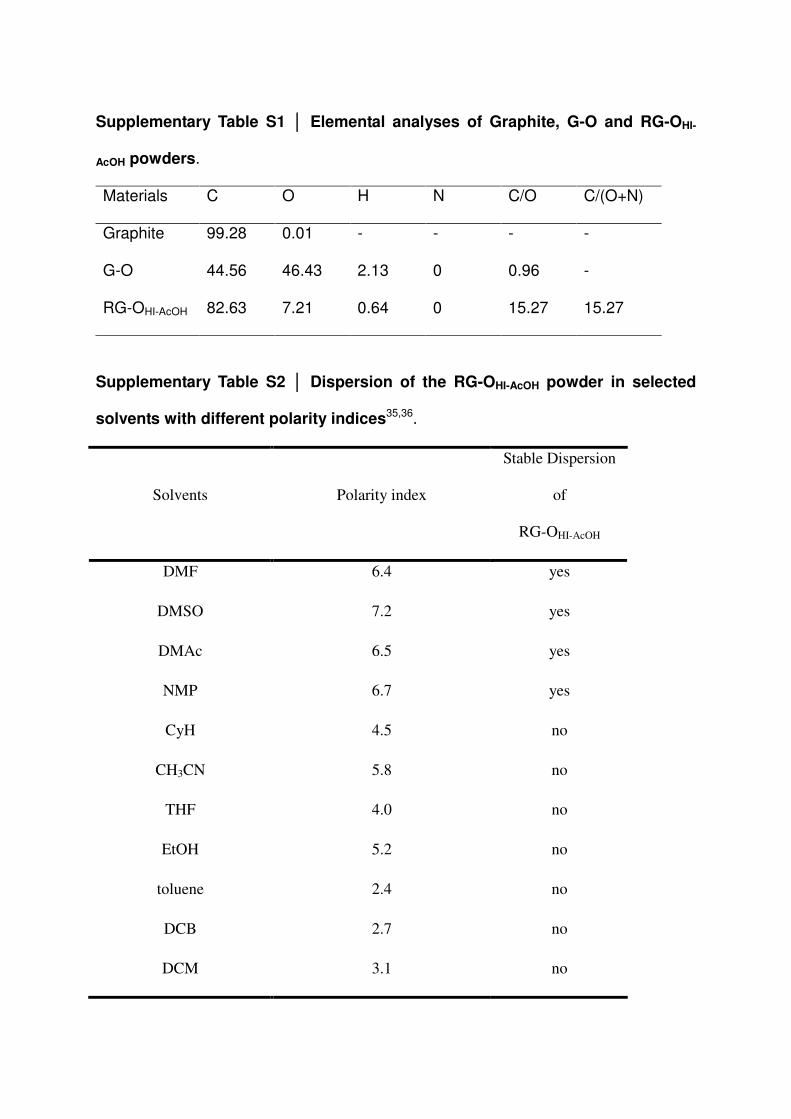
Supplementary Table S1 │ Elemental analyses of Graphite, G-O and RG-OHI-
AcOH powders.
Materials C O H N C/O C/(O+N)
Graphite 99.28 0.01 - - - -
G-O 44.56 46.43 2.13 0 0.96 -
RG-OHI-AcOH 82.63 7.21 0.64 0 15.27 15.27
Supplementary Table S2 │ Dispersion of the RG-OHI-AcOH powder in selected
solvents with different polarity indices35,36.
Solvents Polarity index
Stable Dispersion
of
RG-OHI-AcOH
DMF 6.4 yes
DMSO 7.2 yes
DMAc 6.5 yes
NMP 6.7 yes
CyH 4.5 no
CH3CN 5.8 no
THF 4.0 no
EtOH 5.2 no
toluene 2.4 no
DCB 2.7 no
DCM 3.1 no
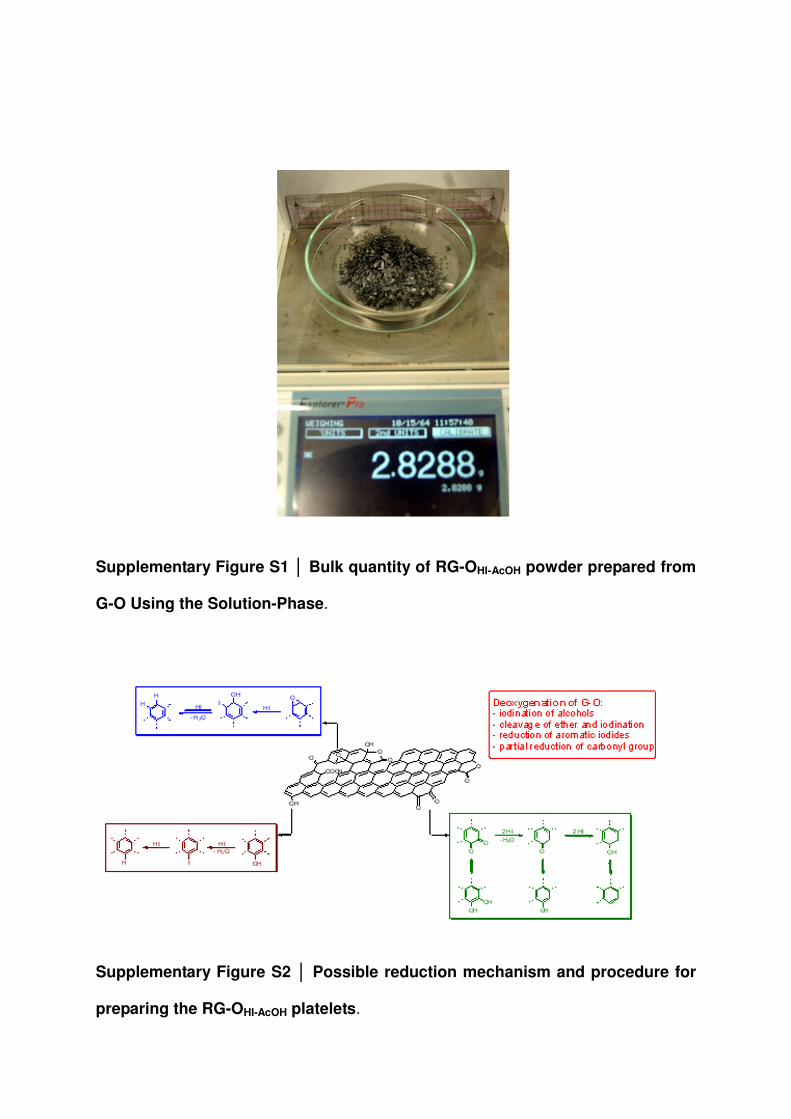
Supplementary Figure S1 │ Bulk quantity of RG-OHI-AcOH powder prepared from
G-O Using the Solution-Phase.
Supplementary Figure S2 │ Possible reduction mechanism and procedure for
preparing the RG-OHI-AcOH platelets.

Supplementary Figure S3 │Solubility Test of RG-OHI-AcOH Powder. (a)
Photographs of RG-OHI-AcOH dispersed in a variety of solvents prepared by 2 h
sonication (RG-OHI-AcOH/solvents = 0.3 mg/10 ml; 9:1 volume ratio of solvent to DMF,
(b) The photographs were taken 1 week after preparing the RG-OHI-AcOH dispersion.
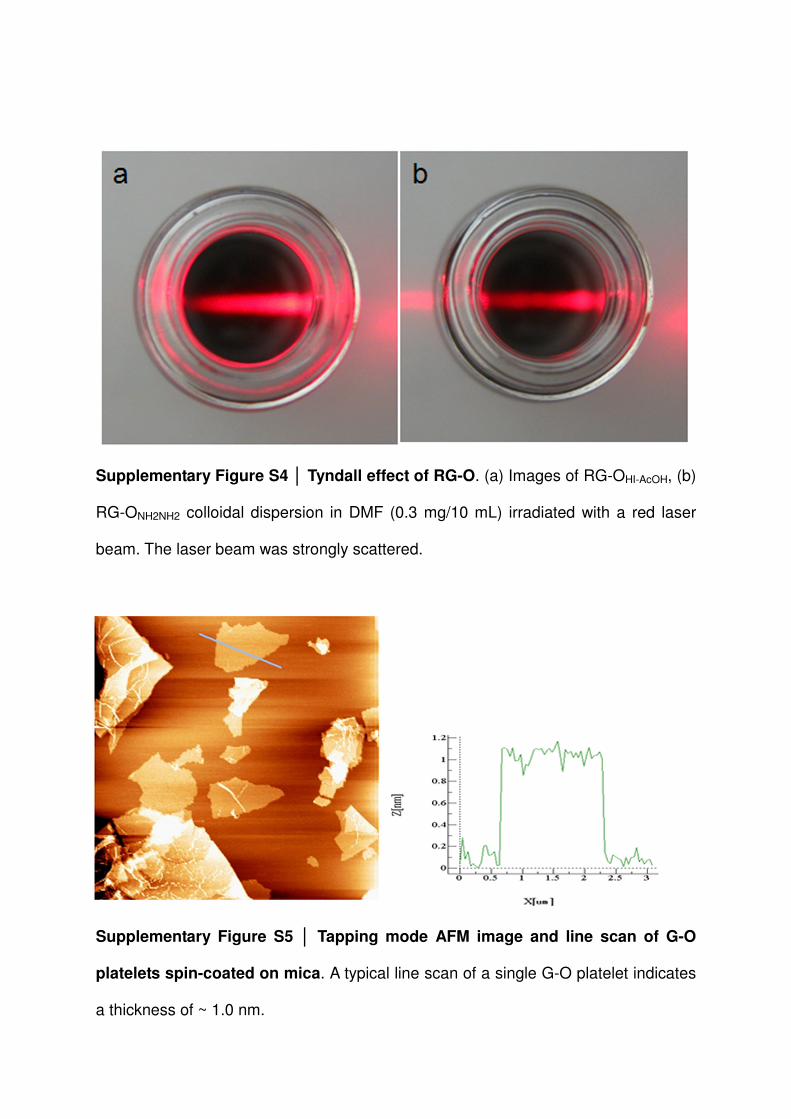
Supplementary Figure S4 │ Tyndall effect of RG-O. (a) Images of RG-OHI-AcOH, (b)
RG-ONH2NH2 colloidal dispersion in DMF (0.3 mg/10 mL) irradiated with a red laser
beam. The laser beam was strongly scattered.
Supplementary Figure S5 │ Tapping mode AFM image and line scan of G-O
platelets spin-coated on mica. A typical line scan of a single G-O platelet indicates
a thickness of ~ 1.0 nm.
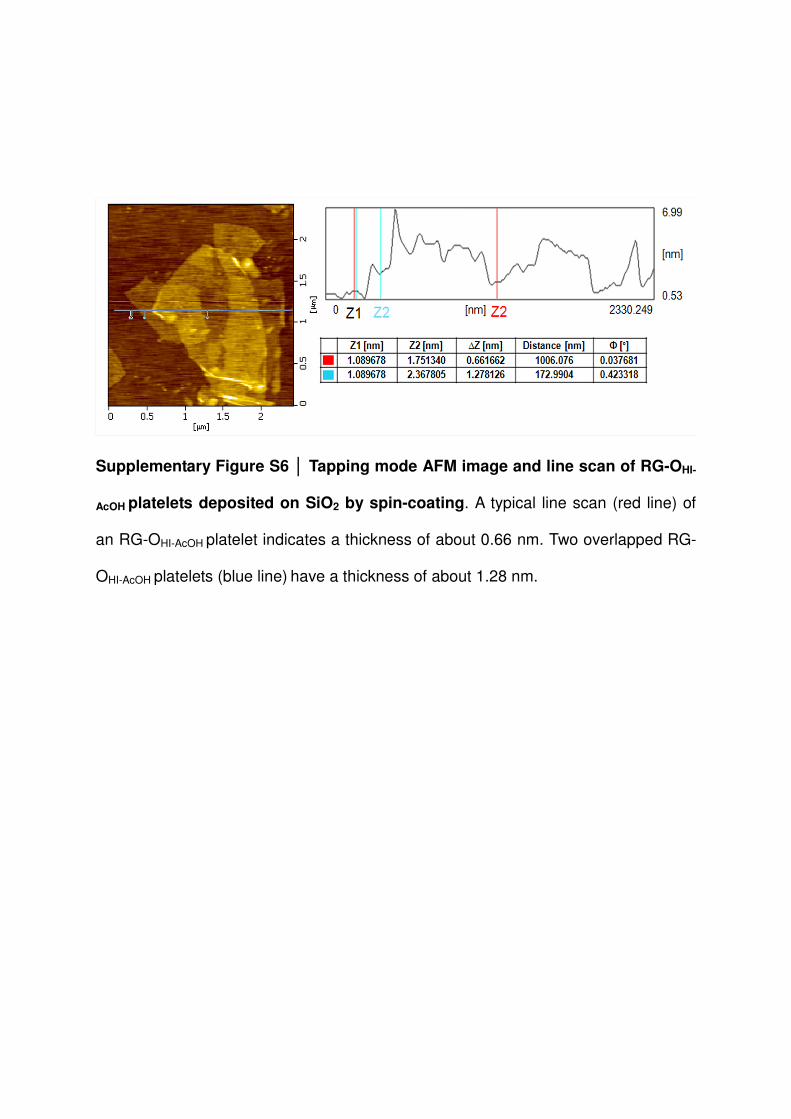
Supplementary Figure S6 │ Tapping mode AFM image and line scan of RG-OHI-
AcOH platelets deposited on SiO2 by spin-coating. A typical line scan (red line) of
an RG-OHI-AcOH platelet indicates a thickness of about 0.66 nm. Two overlapped RG-
OHI-AcOH platelets (blue line) have a thickness of about 1.28 nm.
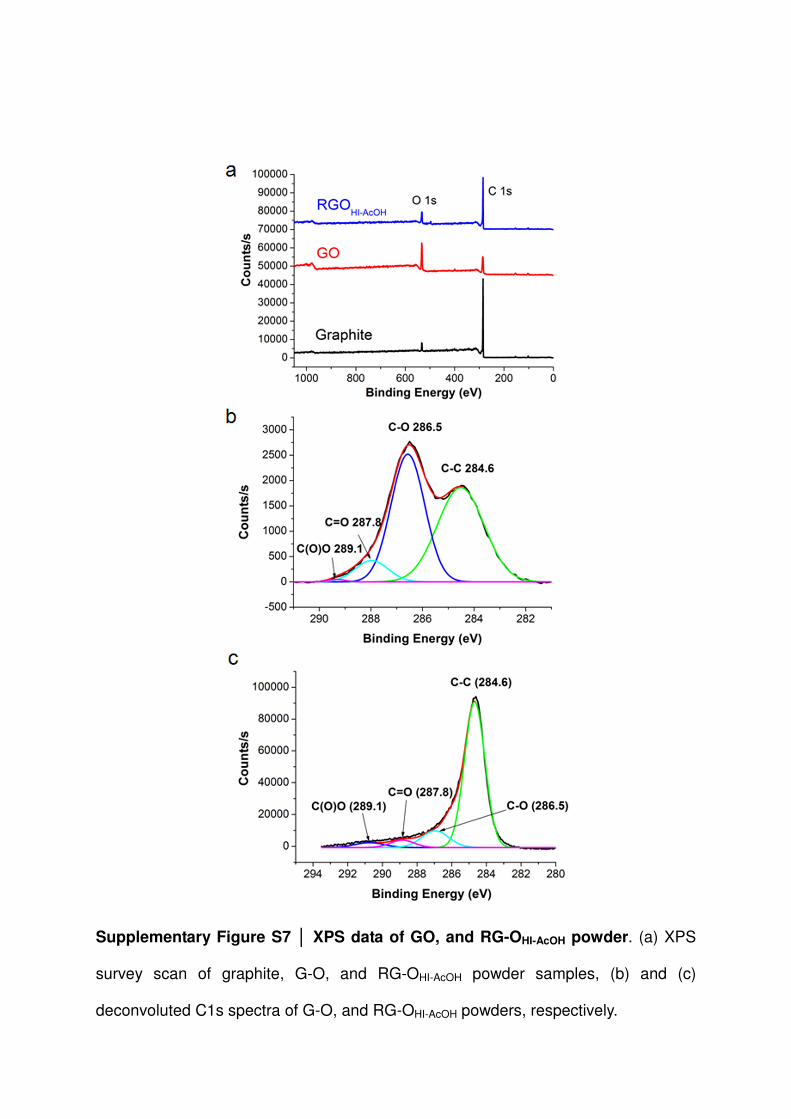
Supplementary Figure S7 │ XPS data of GO, and RG-OHI-AcOH powder. (a) XPS
survey scan of graphite, G-O, and RG-OHI-AcOH powder samples, (b) and (c)
deconvoluted C1s spectra of G-O, and RG-OHI-AcOH powders, respectively.
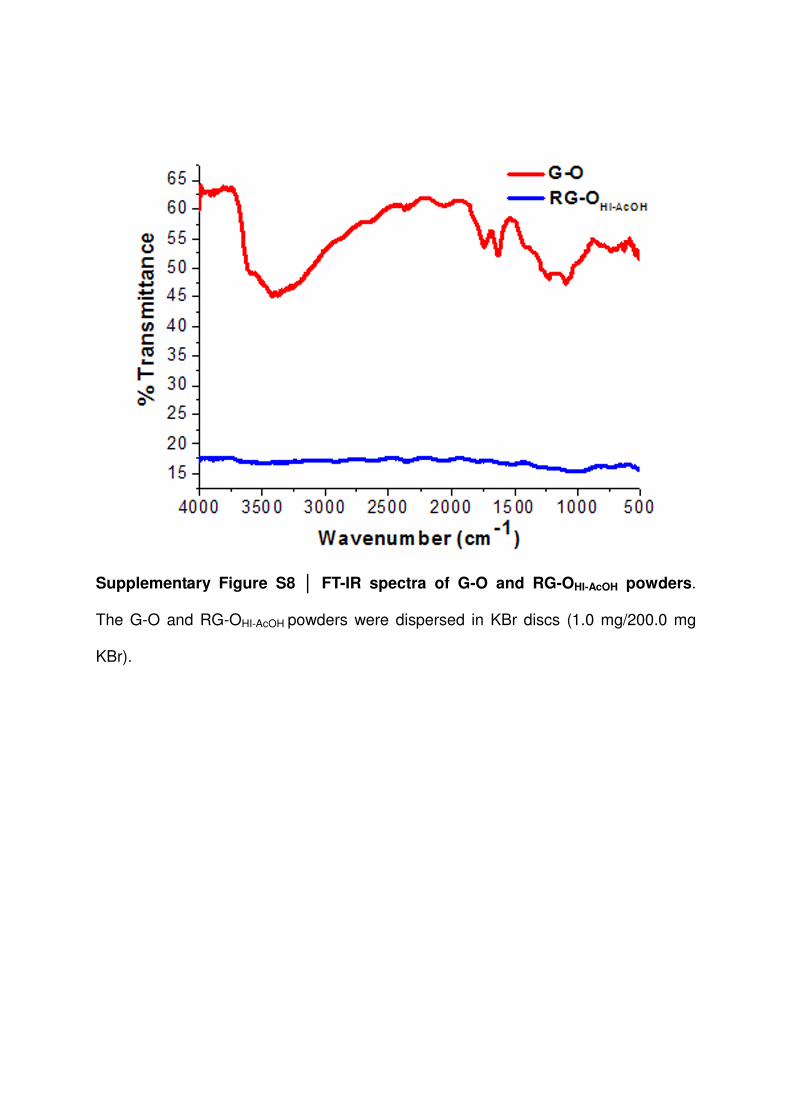
Supplementary Figure S8 │ FT-IR spectra of G-O and RG-OHI-AcOH powders.
The G-O and RG-OHI-AcOH powders were dispersed in KBr discs (1.0 mg/200.0 mg
KBr).
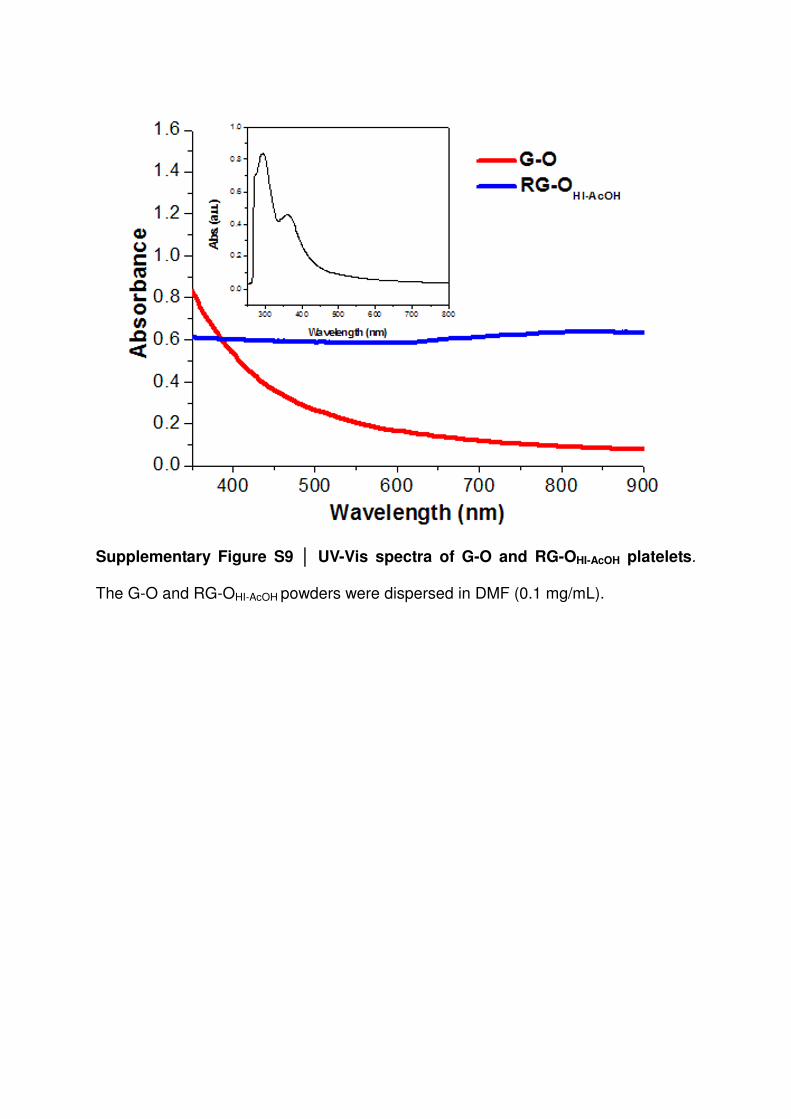
Supplementary Figure S9 │ UV-Vis spectra of G-O and RG-OHI-AcOH platelets.
The G-O and RG-OHI-AcOH powders were dispersed in DMF (0.1 mg/mL).
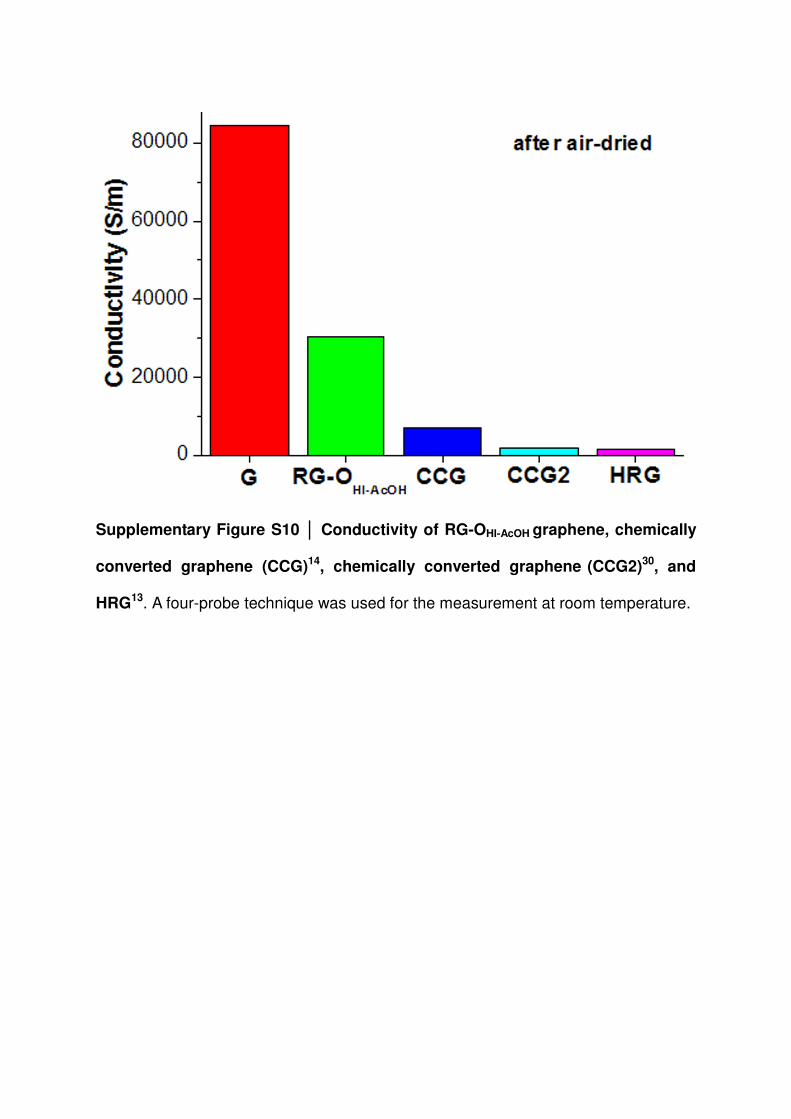
Supplementary Figure S10 │ Conductivity of RG-OHI-AcOH graphene, chemically
converted graphene (CCG)14, chemically converted graphene (CCG2)30, and
HRG13. A four-probe technique was used for the measurement at room temperature.

Supplementary Figure S11 │ Fabrication of G-O paper and VRG-OHI-AcOH
paper.(a) G-O paper pre-patterned (Circle), (b) Flexible G-O paper (Rectangle), (c)
Flexible G-O paper (Circle), (d) Preparation of bendable VRG-OHI-AcOH paper
exposed to a vapor emanating from the HI-AcOH solution, and (e) Pictures of the
bendable VRG-OHI-AcOH paper
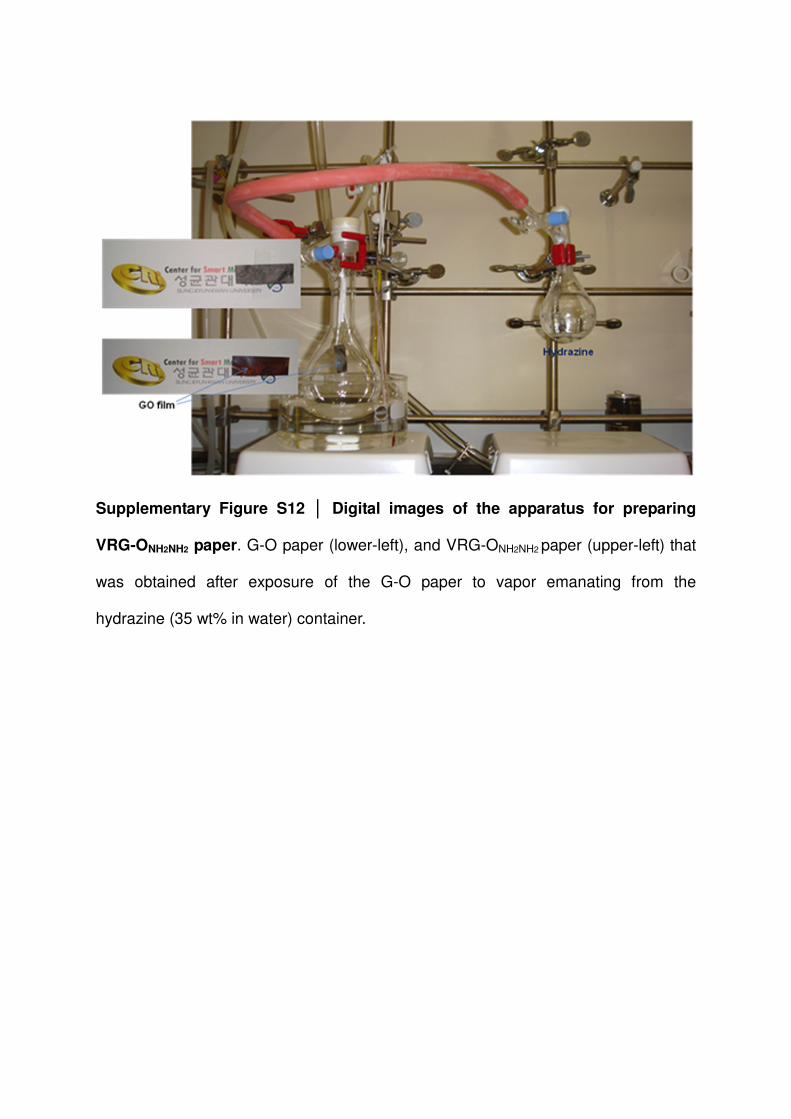
Supplementary Figure S12 │ Digital images of the apparatus for preparing
VRG-ONH2NH2 paper. G-O paper (lower-left), and VRG-ONH2NH2 paper (upper-left) that
was obtained after exposure of the G-O paper to vapor emanating from the
hydrazine (35 wt% in water) container.

Supplementary Figure S13 │ Deconvoluted XPS C1s spectra. (a) VRG-ONH2NH2,
and (b) VRG-OHI-AcOH paper.
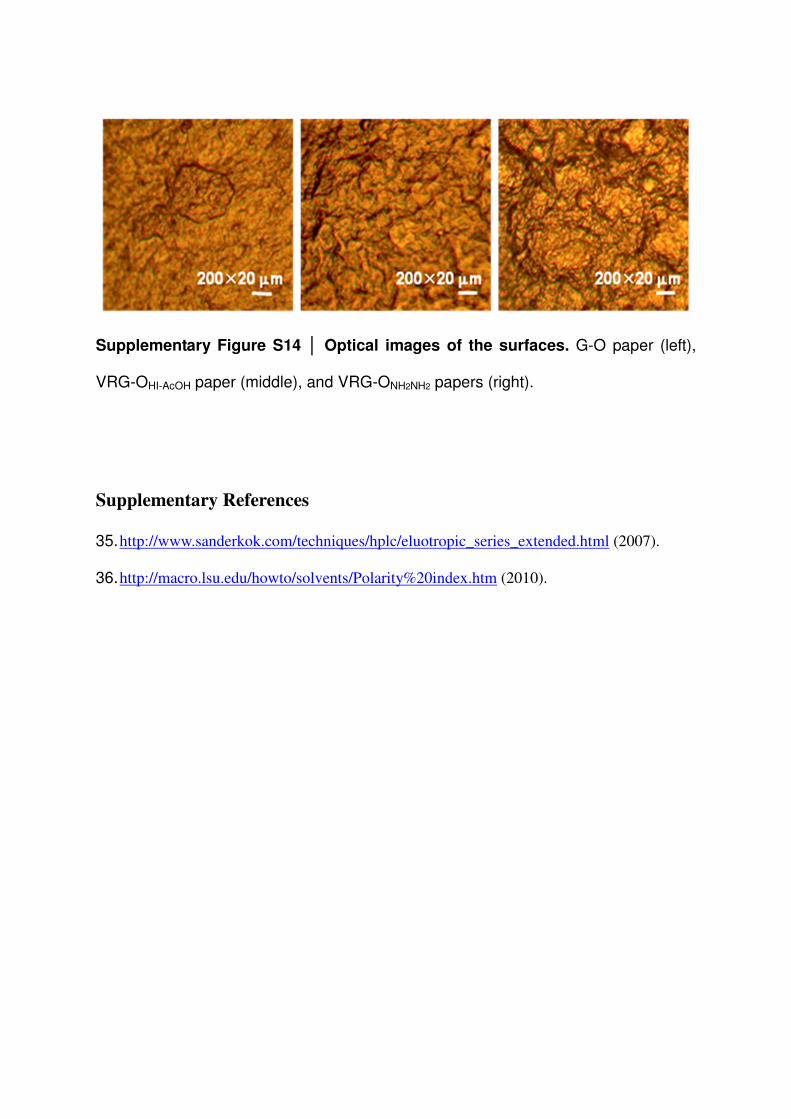
Supplementary Figure S14 │ Optical images of the surfaces. G-O paper (left),
VRG-OHI-AcOH paper (middle), and VRG-ONH2NH2 papers (right).
Supplementary References
35. http://www.sanderkok.com/techniques/hplc/eluotropic_series_extended.html (2007).
36. http://macro.lsu.edu/howto/solvents/Polarity%20index.htm (2010).
Recommended


![Yano Et Al., 1997 Prediction of the Concentrations of EtOH and AcOH[1]](https://img.pdfslide.us/doc/110x75/577cd52d1a28ab9e789a1519/yano-et-al-1997-prediction-of-the-concentrations-of-etoh-and-acoh1.jpg)