INVESTOR
PRESENTATION
March 2018
Forward Looking StatementsThis presentation contains certain forward-looking statements, including, without limitation, statements concerning our operations, economic performance and financial condition. These forward-looking statements are made pursuant to the safe harbor provisions of the Private Securities Litigation Reform Act of 1995. Forward-looking statements are developed by combining currently available information with our beliefs and assumptions and are generally identified by the words “believe,” “expect,” “anticipate” and other similar expressions. Forward-looking statements do not guarantee future performance, which may be materially different from that expressed in, or implied by, any such statements. Readers are cautioned not to place undue reliance on these forward-looking statements, which speak only as of their respective dates.
These forward-looking statements are based largely on our current beliefs, assumptions and expectations of our future performance taking into account all information currently available to us. These beliefs, assumptions and expectations can change as a result of many possible events or factors, not all of which are known to us or within our control, and which could materially affect actual results, performance or achievements. Factors that may cause actual results to vary from our forward-looking statements include, but are not limited to:
• factors described in our Annual Report on Form 10-K for the year ended December 31, 2017, and our Quarterly Reports on Form 10-Q for the quarter ended September 30, 2017, including those set forth under the captions “Risk Factors” and “Business”;
• defaults by borrowers in paying debt service on outstanding indebtedness; • impairment in the value of real estate property securing our loans or in which we invest;• availability of mortgage origination and acquisition opportunities acceptable to us;• potential mismatches in the timing of asset repayments and the maturity of the associated financing agreements;• national and local economic and business conditions;• general and local commercial and residential real estate property conditions;• changes in federal government policies;• changes in federal, state and local governmental laws and regulations;• increased competition from entities engaged in mortgage lending and securities investing activities;• changes in interest rates; and• the availability of, and costs associated with, sources of liquidity.
Additional risk factors are identified in our filings with the U.S. Securities and Exchange Commission (the “SEC”), which are available on our website at http://www.starwoodpropertytrust.com and the SEC’s website at http://www.sec.gov.
If a change occurs, our business, financial condition, liquidity and results of operations may vary materially from those expressed in our forward-looking statements. As a result, our business, financial condition, liquidity and results of operations may vary materially from those expressed in our forward-looking statements. We undertake no obligation to update or revise any forward-looking statements, whether as a result of new information, future events or otherwise. In light of these risks, uncertainties and assumptions, the events described by our forward-looking statements might not occur. We qualify any and all of our forward-looking statements by these cautionary factors. Please keep this cautionary note in mind as you assess the information given in this presentation.
1

Starwood Property Trust Today (NYSE: STWD)
Note: Figures as of December 31. 2017, unless otherwise noted1) As of February 15, 2018
• A leading real estate finance company and the largest commercial mortgage REIT in the U.S. with a market capitalization of approximately $5.2B
(1)
Page 20
• Highly flexible investment platform backed by 350 dedicated employees and leveraging Starwood Capital Group’s over 3,400 person organization
• Total capital deployed since 2009 inception of over $39B with $0 of realized loan losses; current portfolio of $12.6B spanning multiple business segments
• Lending segment is diversified across asset classes and geographies and has a very modest loan-to-value ratio of 62.1%
• Floating-rate loan portfolio constructed to outperform in a rising interest rate environment; position as special servicer provides a hedge against credit deterioration
• Focused on providing a secure dividend for investors; current dividend yield of 9.6%
(1)
2
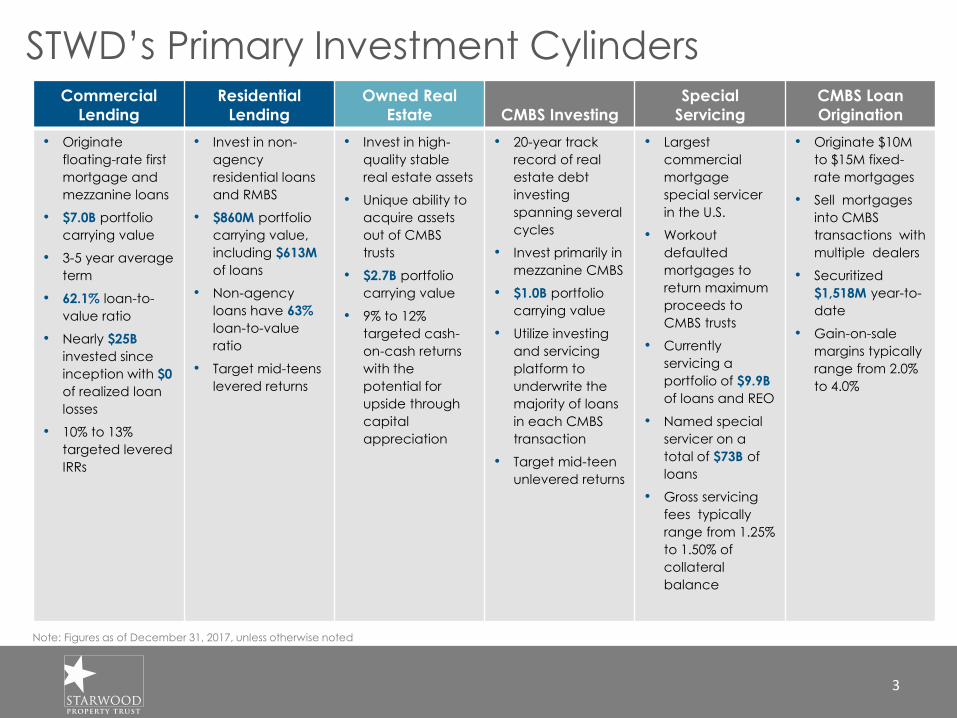
STWD’s Primary Investment Cylinders
Note: Figures as of December 31, 2017, unless otherwise noted
3
Commercial
Lending
Residential
Lending
Owned Real
Estate CMBS Investing
Special
Servicing
CMBS Loan
Origination
• Originate
floating-rate first
mortgage and
mezzanine loans
• $7.0B portfolio
carrying value
• 3-5 year average
term
• 62.1% loan-to-
value ratio
• Nearly $25B
invested since
inception with $0
of realized loan
losses
• 10% to 13%
targeted levered
IRRs
• Invest in non-
agency
residential loans
and RMBS
• $860M portfolio
carrying value,
including $613M
of loans
• Non-agency
loans have 63%
loan-to-value
ratio
• Target mid-teens
levered returns
• Invest in high-
quality stable
real estate assets
• Unique ability to
acquire assets
out of CMBS
trusts
• $2.7B portfolio
carrying value
• 9% to 12%
targeted cash-
on-cash returns
with the
potential for
upside through
capital
appreciation
• 20-year track
record of real
estate debt
investing
spanning several
cycles
• Invest primarily in
mezzanine CMBS
• $1.0B portfolio
carrying value
• Utilize investing
and servicing
platform to
underwrite the
majority of loans
in each CMBS
transaction
• Target mid-teen
unlevered returns
• Largest
commercial
mortgage
special servicer
in the U.S.
• Workout
defaulted
mortgages to
return maximum
proceeds to
CMBS trusts
• Currently
servicing a
portfolio of $9.9B
of loans and REO
• Named special
servicer on a
total of $73B of
loans
• Gross servicing
fees typically
range from 1.25%
to 1.50% of
collateral
balance
• Originate $10M
to $15M fixed-
rate mortgages
• Sell mortgages
into CMBS
transactions with
multiple dealers
• Securitized
$1,518M year-to-
date
• Gain-on-sale
margins typically
range from 2.0%
to 4.0%

Note: Figures as of December 31, 20171) Statistics in pie chart exclude Cash & Cash Equivalents of $364M, Restricted Cash of $49M, Other Corporate Assets of $5M and VIE assets. Accumulated
depreciation and amortization are included2) Excluding unallocated corporate costs and $52M gain related to the partial sale of Ten-X investment
ASSETS BY SEGMENT CORE EARNINGS BY SEGMENT
Total Assets: $12.5B (1) 2017 YTD Core Earnings: $1.2B (2)
Diversified, Complementary and Scalable
Platforms
4
Lending
48%
Investing &
Servicing
35%
Property
17%
Lending
64%
Investing &
Servicing
14%
Property
22%

STWD’s Evolving Strategy
2009• IPO in August
2009 raised approximately $1.0B
2014• Deployed a record $7.4B of capital in
2014• Spun off Starwood Waypoint Residential
Trust, which eventually merged with Colony American Homes to form Colony Starwood Homes (NYSE:SFR)
• Commenced strategy of core plus equity investing
2013• Acquired LNR Property
LLC for $0.7B• Deployed a total of $4.1B
of capital in 2013
2012• Deployed a total
of $2.6B of capital in 2012
2011• Deployed a
total of $2.0B of capital in 2011
2010• Deployed a total of
$1.7B of capital in 2010
• Increased aggregate financing capacity under five financing facilities to $1.1B
2015
• Deployed a total of $5.8B of capital in 2015
• Acquired a $350M multifamily portfolio located in Florida
One SoHo Square
New York, NY
1180 Peachtree
Atlanta, GAPresidential City
Philadelphia, PA420 Kent Avenue
Brooklyn, NY
2016• Deployed a
total of $6.4B of capital in 2016
Note: Figures as of December 31, 2017, unless otherwise noted
5
2017• Deployed $7.3B of
capital • Commenced strategy
of non-agency residential mortgage investing

STARWOOD CAPITAL
GROUP PROFILEAFFILIATED BUSINESSES
GLOBAL FOOTPRINT
Over 3,400 professionals in 11 offices and over 9,500 additional employees affiliated
with a dozen portfolio operating companies
• Founded in 1991 by Barry
Sternlicht
• Current assets under
management in excess of $56B
• Acquired $94B of assets over
the past 26 years across
virtually every major real estate
asset class
• Seasoned executive team that
has been together for over 23
years with an average of 31
years of experience
• Extensive public markets
expertise, having guided
IPOs for 8 leading companies
• The investment flexibility to shift
between real estate asset
classes, geographies and
positions in the capital stack as
risk-reward dynamics evolve
over cycles
Real Estate Equity Performing Real Estate Debt Energy
Note: Figures as of December 31, 2017, unless otherwise noted
6
A Leading Global Real Estate Investment Firm
Starwood Capital Group

Starwood Property Trust Organization
7
Fully integrated real estate debt platform with over 350 dedicated professionals
STARWOOD PROPERTY TRUST INVESTMENT COMMITTEE
Jeffrey DiModica
President, Starwood Property Trust
Barry Sternlicht
Chairman and CEO Starwood Capital Group & Starwood
Property Trust
Andrew Sossen
Chief Operating Officer, Starwood Property Trust
Jeffrey Dishner
Senior Managing Director and Global Head of Real Estate
Acquisitions, Starwood Capital Group
Dennis Schuh
Chief Originations Officer, Starwood Property Trust
Christopher Graham
Senior Managing Director and Head of Real Estate
Acquisitions for the Americas, Starwood Capital Group
Mark Cagley
Chief Credit Officer, Starwood Property Trust
Carl Tash
Managing Director, Starwood Capital Group
Cary Carpenter
Managing Director, Head of CRE Capital Markets, Trading
and Syndication, Starwood Property Trust
Austin Nowlin
Managing Director, Head of Capital Markets for the
Americas, Starwood Capital Group
• Starwood Property Trust’s business is supported by over 350 professionals across six offices in
Greenwich, New York, Miami, Atlanta, Los Angeles and San Francisco across a variety of functions
including:
• Originations • Underwriting • Asset Management • Loan Servicing
• Surveillance • Finance/Investor
Relations
• Capital Markets/Trading • Treasury/Risk
Management
Note: Figures as of December 31 2017, unless otherwise noted
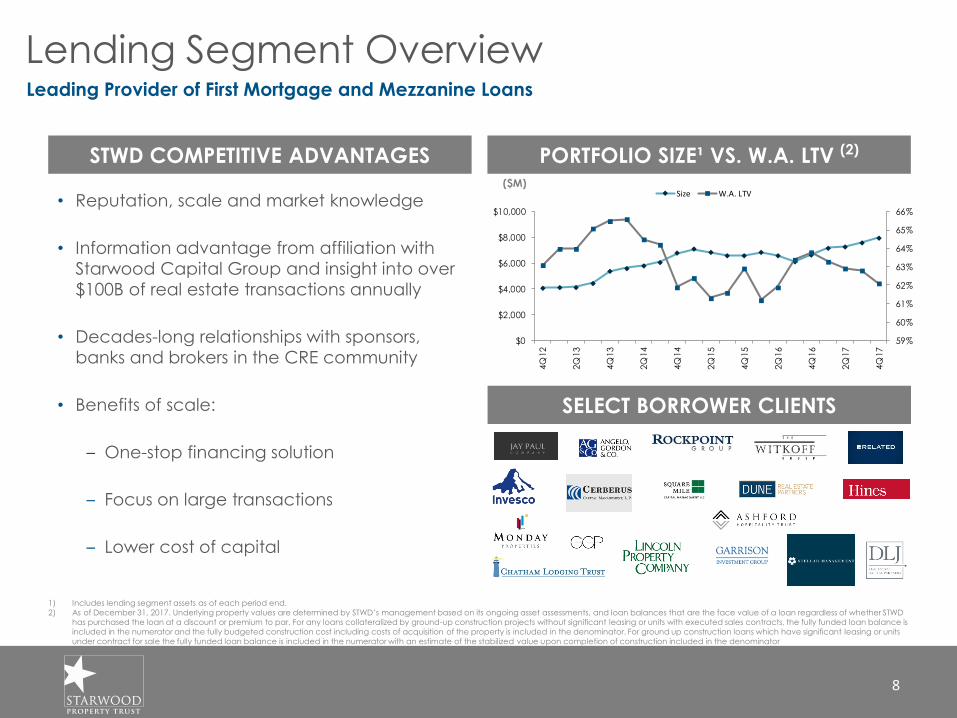
Lending Segment Overview
STWD COMPETITIVE ADVANTAGES PORTFOLIO SIZE¹ VS. W.A. LTV (2)
• Reputation, scale and market knowledge
• Information advantage from affiliation with
Starwood Capital Group and insight into over
$100B of real estate transactions annually
• Decades-long relationships with sponsors,
banks and brokers in the CRE community
• Benefits of scale:
– One-stop financing solution
– Focus on large transactions
– Lower cost of capital
SELECT BORROWER CLIENTS
1) Includes lending segment assets as of each period end.
2) As of December 31, 2017. Underlying property values are determined by STWD’s management based on its ongoing asset assessments, and loan balances that are the face value of a loan regardless of whether STWD
has purchased the loan at a discount or premium to par. For any loans collateralized by ground-up construction projects without significant leasing or units with executed sales contracts, the fully funded loan balance is
included in the numerator and the fully budgeted construction cost including costs of acquisition of the property is included in the denominator. For ground up construction loans which have significant leasing or units
under contract for sale the fully funded loan balance is included in the numerator with an estimate of the stabilized value upon completion of construction included in the denominator
($M)
66%
Leading Provider of First Mortgage and Mezzanine Loans
8
59%
60%
61%
62%
63%
64%
65%
66%
$0
$2,000
$4,000
$6,000
$8,000
$10,000
4Q
12
2Q
13
4Q
13
2Q
14
4Q
14
2Q
15
4Q
15
2Q
16
4Q
16
2Q
17
4Q
17
Size W.A. LTV
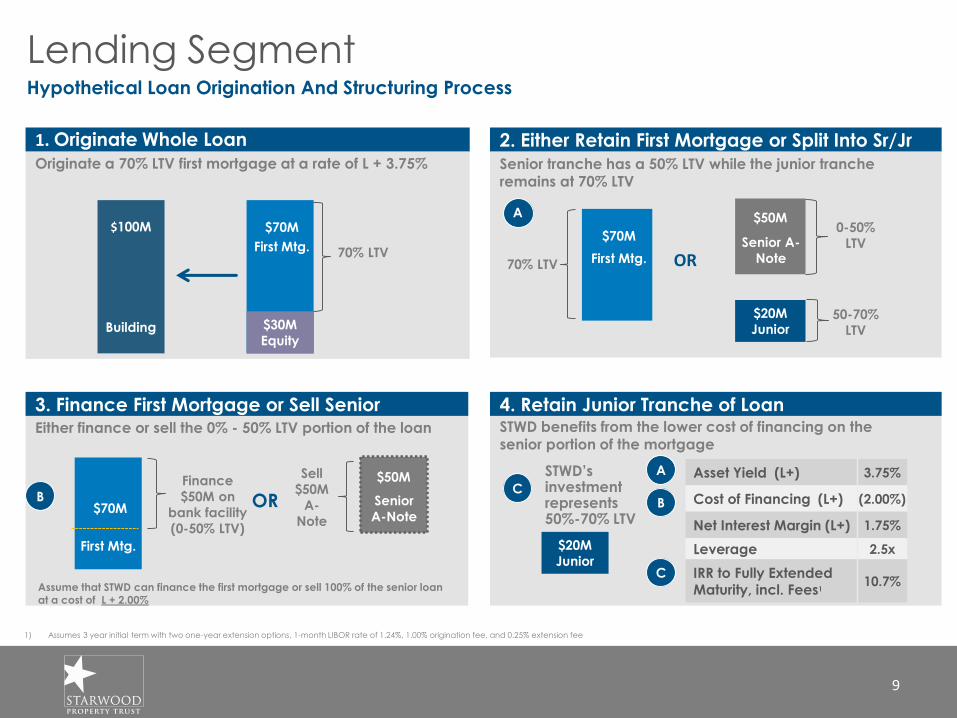
Lending SegmentHypothetical Loan Origination And Structuring Process
4. Retain Junior Tranche of Loan3. Finance First Mortgage or Sell SeniorEither finance or sell the 0% - 50% LTV portion of the loan
2. Either Retain First Mortgage or Split Into Sr/Jr
$70M
First Mtg.
$20M
Junior
$50M
Senior A-
Note
Senior tranche has a 50% LTV while the junior tranche remains at 70% LTV
A
1. Originate Whole Loan
Originate a 70% LTV first mortgage at a rate of L + 3.75%
$100M
Building $30M
Equity
$70M
First Mtg.
1) Assumes 3 year initial term with two one-year extension options, 1-month LIBOR rate of 1.24%, 1.00% origination fee, and 0.25% extension fee
STWD benefits from the lower cost of financing on the senior portion of the mortgage
STWD’s investmentrepresents50%-70% LTV
$20M
Junior
Asset Yield (L+) 3.75%
Cost of Financing (L+) (2.00%)
Net Interest Margin (L+) 1.75%
Leverage 2.5x
IRR to Fully Extended Maturity, incl. Fees1
10.7%
A
B
C
C
OR
Assume that STWD can finance the first mortgage or sell 100% of the senior loan at a cost of L + 2.00%
$70M
First Mtg.
OR
$50M
Senior
A-Note
B
Finance
$50M on
bank facility
(0-50% LTV)
Sell
$50M
A-
Note
70% LTV
50-70%
LTV
0-50%
LTV
70% LTV
66
9
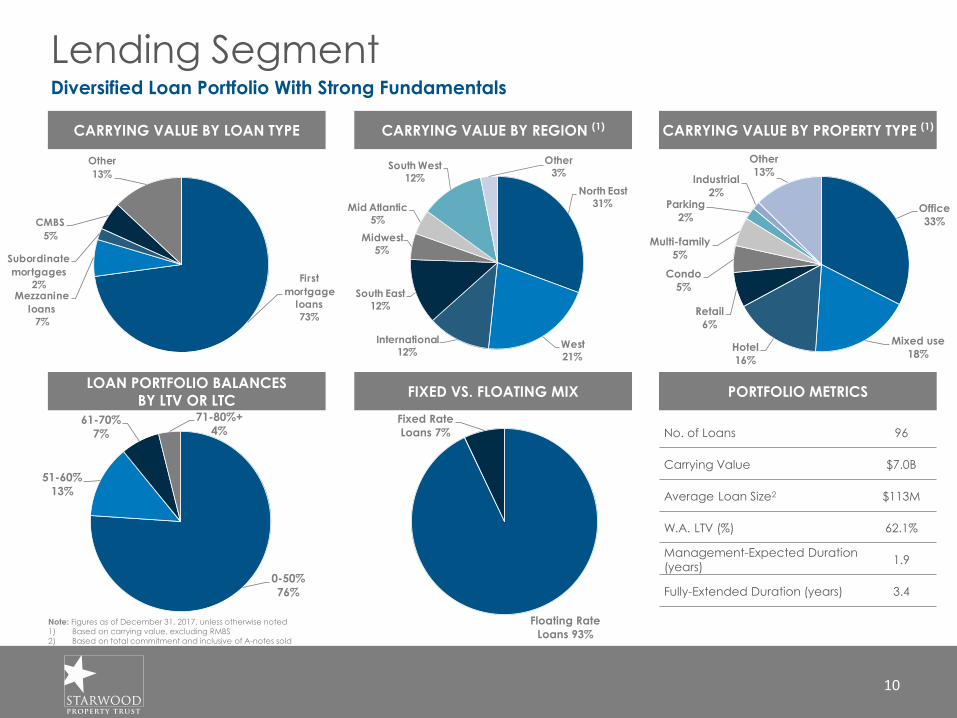
Lending SegmentDiversified Loan Portfolio With Strong Fundamentals
CARRYING VALUE BY LOAN TYPE CARRYING VALUE BY REGION (1) CARRYING VALUE BY PROPERTY TYPE (1)
FIXED VS. FLOATING MIX PORTFOLIO METRICS
No. of Loans 96
Carrying Value $7.0B
Average Loan Size2 $113M
W.A. LTV (%) 62.1%
Management-Expected Duration
(years)1.9
Fully-Extended Duration (years) 3.4
LOAN PORTFOLIO BALANCES BY LTV OR LTC
Note: Figures as of December 31, 2017, unless otherwise noted
1) Based on carrying value, excluding RMBS
2) Based on total commitment and inclusive of A-notes sold
10
Office
33%
Mixed use
18%Hotel
16%
Retail
6%
Condo
5%
Multi-family
5%
Parking
2%
Industrial
2%
Other
13%
First
mortgage
loans
73%
Mezzanine
loans
7%
Subordinate
mortgages
2%
CMBS
5%
Other
13%
North East
31%
West
21%
International
12%
South East
12%
Midwest
5%
Mid Atlantic
5%
South West
12%
Other
3%
0-50%
76%
51-60%
13%
61-70%
7%
71-80%+
4%
Floating Rate
Loans 93%
Fixed Rate
Loans 7%
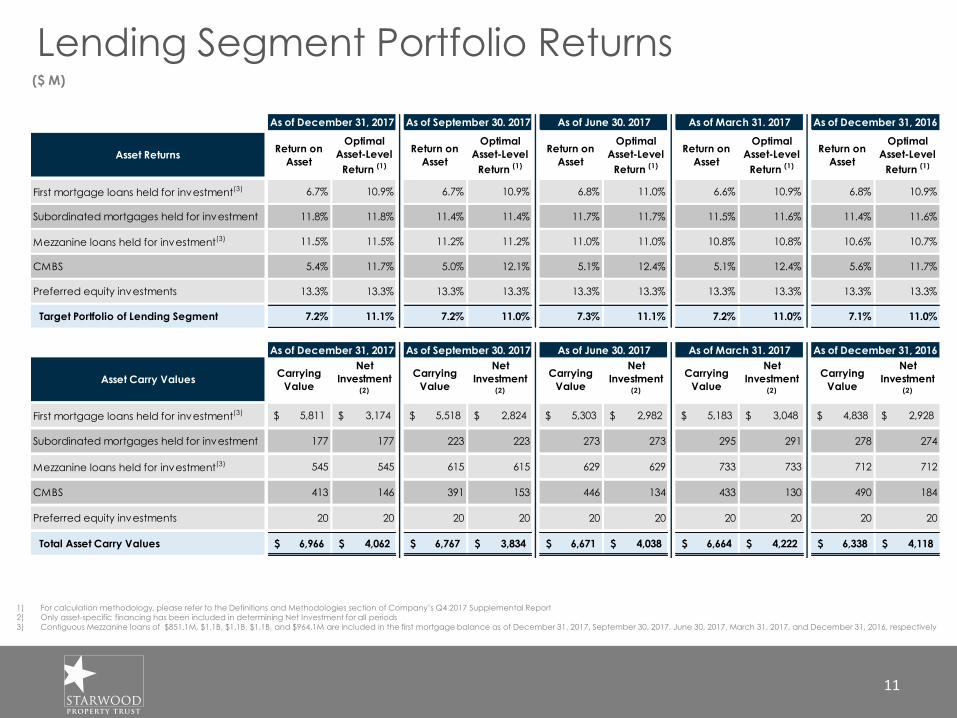
Lending Segment Portfolio Returns
1) For calculation methodology, please refer to the Definitions and Methodologies section of Company’s Q4 2017 Supplemental Report
2) Only asset-specific financing has been included in determining Net Investment for all periods
3) Contiguous Mezzanine loans of $851.1M, $1.1B, $1.1B, $1.1B, and $964.1M are included in the first mortgage balance as of December 31, 2017, September 30, 2017, June 30, 2017, March 31, 2017, and December 31, 2016, respectively
($ M)
11
Asset ReturnsReturn on
Asset
Optimal
Asset-Level
Return (1)
Return on
Asset
Optimal
Asset-Level
Return (1)
Return on
Asset
Optimal
Asset-Level
Return (1)
Return on
Asset
Optimal
Asset-Level
Return (1)
Return on
Asset
Optimal
Asset-Level
Return (1)
First mortgage loans held for investment(3) 6.7% 10.9% 6.7% 10.9% 6.8% 11.0% 6.6% 10.9% 6.8% 10.9%
Subordinated mortgages held for investment 11.8% 11.8% 11.4% 11.4% 11.7% 11.7% 11.5% 11.6% 11.4% 11.6%
Mezzanine loans held for investment(3) 11.5% 11.5% 11.2% 11.2% 11.0% 11.0% 10.8% 10.8% 10.6% 10.7%
CMBS 5.4% 11.7% 5.0% 12.1% 5.1% 12.4% 5.1% 12.4% 5.6% 11.7%
Preferred equity investments 13.3% 13.3% 13.3% 13.3% 13.3% 13.3% 13.3% 13.3% 13.3% 13.3%
Target Portfolio of Lending Segment 7.2% 11.1% 7.2% 11.0% 7.3% 11.1% 7.2% 11.0% 7.1% 11.0%
Asset Carry ValuesCarrying
Value
Net
Investment (2)
Carrying
Value
Net
Investment (2)
Carrying
Value
Net
Investment (2)
Carrying
Value
Net
Investment (2)
Carrying
Value
Net
Investment (2)
First mortgage loans held for investment(3) 5,811$ 3,174$ 5,518$ 2,824$ 5,303$ 2,982$ 5,183$ 3,048$ 4,838$ 2,928$
Subordinated mortgages held for investment 177 177 223 223 273 273 295 291 278 274
Mezzanine loans held for investment(3) 545 545 615 615 629 629 733 733 712 712
CMBS 413 146 391 153 446 134 433 130 490 184
Preferred equity investments 20 20 20 20 20 20 20 20 20 20
Total Asset Carry Values 6,966$ 4,062$ 6,767$ 3,834$ 6,671$ 4,038$ 6,664$ 4,222$ 6,338$ 4,118$
As of December 31, 2016
As of September 30. 2017 As of June 30. 2017 As of March 31. 2017 As of December 31, 2016
As of December 31, 2017
As of December 31, 2017
As of September 30. 2017 As of June 30. 2017 As of March 31. 2017
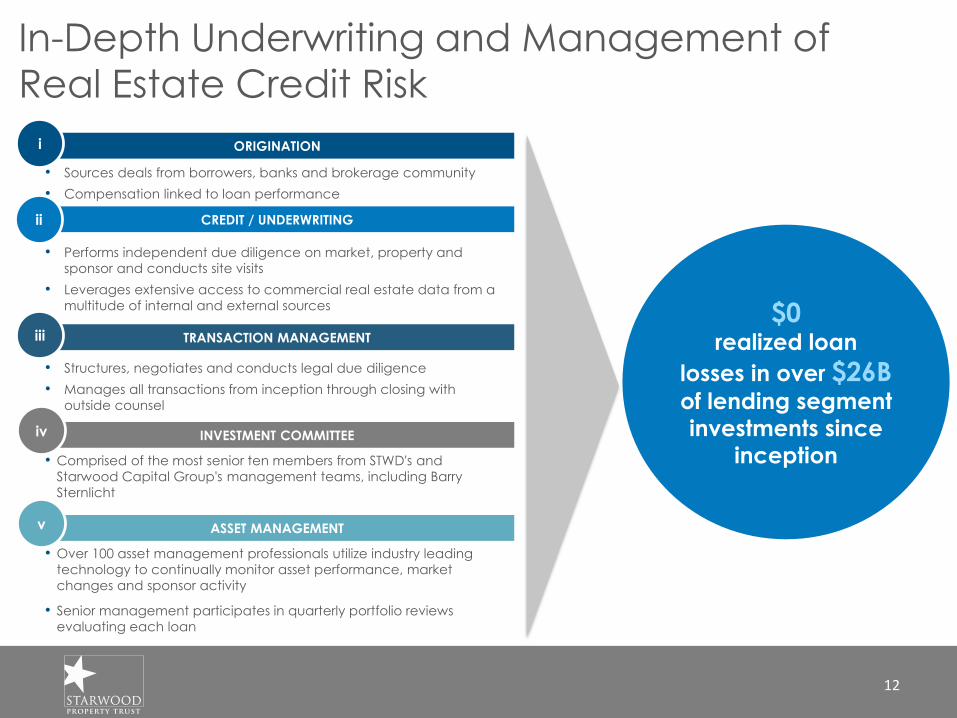
TRANSACTION MANAGEMENT
ORIGINATION
CREDIT / UNDERWRITING
INVESTMENT COMMITTEE
• Sources deals from borrowers, banks and brokerage community
• Compensation linked to loan performance
• Performs independent due diligence on market, property and
sponsor and conducts site visits
• Leverages extensive access to commercial real estate data from a
multitude of internal and external sources
• Comprised of the most senior ten members from STWD's and
Starwood Capital Group's management teams, including Barry
Sternlicht
• Structures, negotiates and conducts legal due diligence
• Manages all transactions from inception through closing with
outside counsel
i
iii
ii
iv
In-Depth Underwriting and Management of
Real Estate Credit Risk
$0realized loan
losses in over $26Bof lending segment investments since
inception
ASSET MANAGEMENT
• Over 100 asset management professionals utilize industry leading
technology to continually monitor asset performance, market
changes and sponsor activity
• Senior management participates in quarterly portfolio reviews
evaluating each loan
v
12

$0
$50
$100
$150
$200
$250
'01 &
Prior
'02 '03 '04 '05 '06 '07 '08 '11 '12 '13 '14 '15 '16 '17
Investing & Servicing Segment Overview
Note: Figures as of December 31, 2017, unless otherwise noted; Balances reflect fair market value
1) No assurance can be given that future margins will be within this range
2) CMBS 1.0 deals were originated in prior to 2008. CMBS 2.0/3.0 deals were originated from 2009 forward. Different credit underwriting and regulatory requirements are applied to CMBS 2.0/3.0 deals
SPECIAL SERVICER MARKET SHARE
STWD OWNED CMBS BY VINTAGE ($M)
84% ($864M) of CMBS 2.0/3.0 (post-2009)2
16% ($160M) of CMBS 1.0 (pre-2009)2
• Largest CMBS special servicer
• Named special servicer on 160 trusts with a
collateral balance of $73B
• $9.9B of loans and real estate owned
currently in special servicing
• 20-year track record of real estate debt
investing spanning several cycles
• Purchase new issue CMBS B-pieces and
legacy bonds for yield and servicing
control
• $1B portfolio carrying value
CMBS INVESTING
• Originate conduit loans for securitization
into CMBS transactions
• Average loan size of $10-15M
• $1,518M in 8 securitizations in 2017
• Gain-on-sale margins typically range from
2.0% to 4.0%1
CONDUIT LOAN
ORIGINATION
21%
PROPERTY
PORTFOLIO
• Proprietary ability to purchase properties
from CMBS trusts
• $351M investment balance
Source: Trepp and rating agency reports
SPECIAL
SERVICING OF
CMBS LOANS
Leading CMBS Investor, Special Servicer and Conduit Originator
13
0.0%
5.0%
10.0%
15.0%
20.0%
25.0%
30.0%
35.0%
40.0%
$-
$0.0
$0.0
$0.0
$0.0
$0.0
$0.0
$0.0
$0.0
$0.0
$0.0
Midland Rialto LNR CW C-III Torchlight Wells Fargo Keybank Situs
Ac
tiv
e S
S M
ark
et
Sha
re
Na
me
d C
MBS
Ma
rke
t Sh
are
Mil
lio
ns
CMBS 1.0 UPB CMBS 2.0/3.0 UPB Active SS Market Share
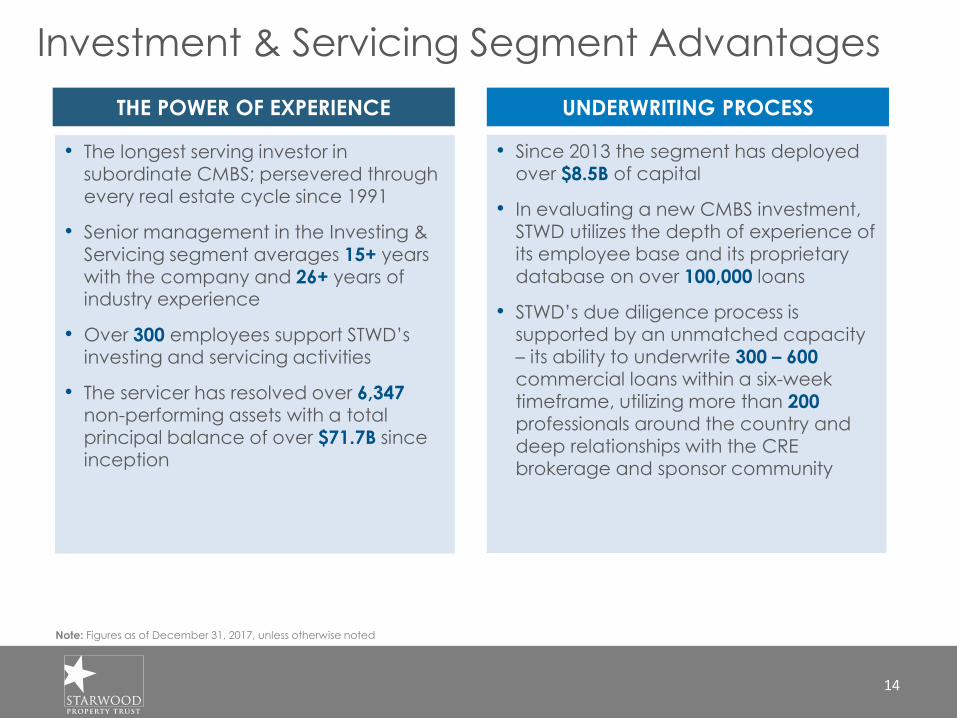
THE POWER OF EXPERIENCE UNDERWRITING PROCESS
Note: Figures as of December 31, 2017, unless otherwise noted
• The longest serving investor in subordinate CMBS; persevered through every real estate cycle since 1991
• Senior management in the Investing &
Servicing segment averages 15+ years with the company and 26+ years of industry experience
• Over 300 employees support STWD’s investing and servicing activities
• The servicer has resolved over 6,347 non-performing assets with a total principal balance of over $71.7B since inception
• Since 2013 the segment has deployed over $8.5B of capital
• In evaluating a new CMBS investment, STWD utilizes the depth of experience of its employee base and its proprietary
database on over 100,000 loans
• STWD’s due diligence process is supported by an unmatched capacity – its ability to underwrite 300 – 600commercial loans within a six-week timeframe, utilizing more than 200
professionals around the country and deep relationships with the CRE brokerage and sponsor community
21%Investment & Servicing Segment Advantages
14

Property Segment OverviewContinued Focus on Growth of Real Estate Portfolio
• Focused on investing in high quality real estate with:
– Stable current cash-on-cash returns
– Potential for capital appreciation
– Longer duration of cash flows
– Natural inflation hedge
• Acquired five major investments totaling approximately $2.7B
• Continue to leverage Starwood Capital Group and its acquisition and asset management professionals with expertise across all of the major real estate asset classes globally
MEDICAL OFFICE PORTFOLIO
DUBLIN PORTFOLIO
WOODSTAR MULTIFAMILY PORTFOLIO
SELECT OPERATING STATISTICS
W.A. Occupancy Rate 97.8%
Number of Properties 113
Number of Residential Units 10,733
Total Commercial Square Footage 11.7M1
Note: Figures as of December 31, 2017, unless otherwise noted
1) Includes 3.9M square feet relating to the Regional Mall Portfolio for which STWD maintains a 33% ownership interest
15
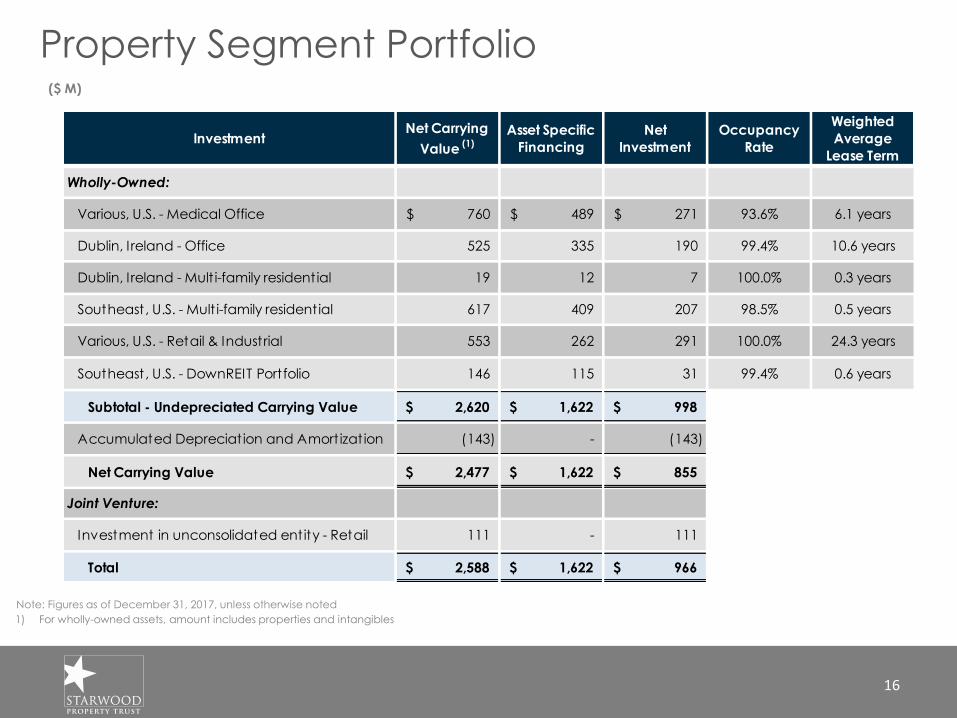
Property Segment Portfolio
Note: Figures as of December 31, 2017, unless otherwise noted
1) For wholly-owned assets, amount includes properties and intangibles
($ M)
16
InvestmentNet Carrying
Value (1)
Asset Specific
Financing
Net
Investment
Occupancy
Rate
Weighted
Average
Lease Term
Wholly-Owned:
Various, U.S. - Medical Office 760$ 489$ 271$ 93.6% 6.1 years
Dublin, Ireland - Office 525 335 190 99.4% 10.6 years
Dublin, Ireland - Mult i-family residential 19 12 7 100.0% 0.3 years
Southeast, U.S. - Mult i-family residential 617 409 207 98.5% 0.5 years
Various, U.S. - Retail & Industrial 553 262 291 100.0% 24.3 years
Southeast, U.S. - DownREIT Portfolio 146 115 31 99.4% 0.6 years
Subtotal - Undepreciated Carrying Value 2,620$ 1,622$ 998$
Accumulated Depreciat ion and Amort izat ion (143) - (143)
Net Carrying Value 2,477$ 1,622$ 855$
Joint Venture:
Investment in unconsolidated entity - Retail 111 - 111
Total 2,588$ 1,622$ 966$
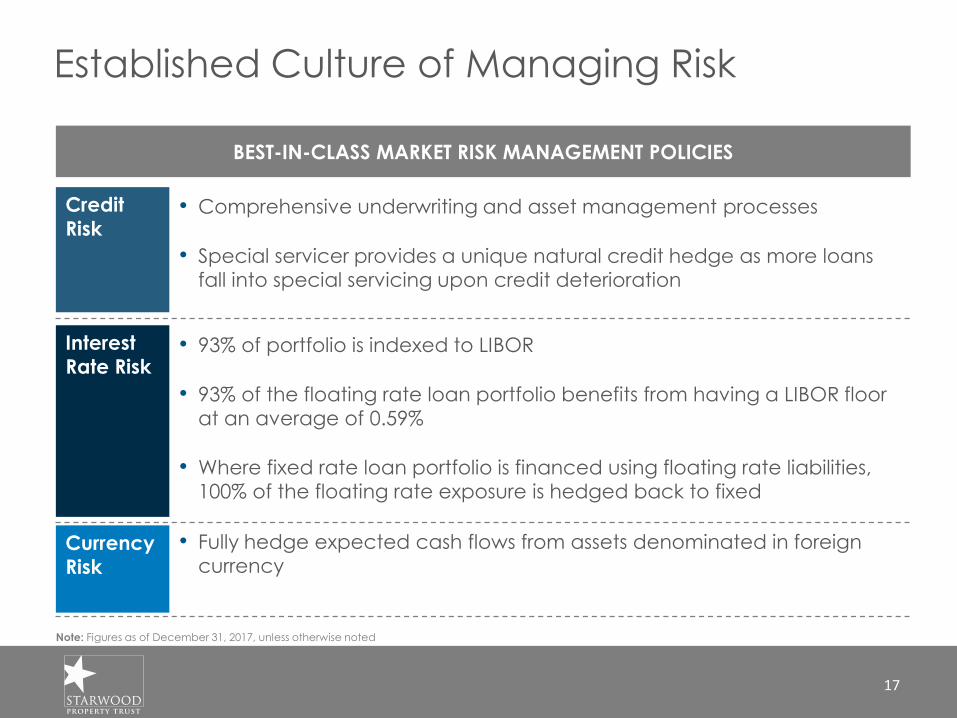
Established Culture of Managing Risk
BEST-IN-CLASS MARKET RISK MANAGEMENT POLICIES
Credit
Risk
Currency
Risk
Interest
Rate Risk
• Fully hedge expected cash flows from assets denominated in foreign
currency
• Comprehensive underwriting and asset management processes
• Special servicer provides a unique natural credit hedge as more loans
fall into special servicing upon credit deterioration
• 93% of portfolio is indexed to LIBOR
• 93% of the floating rate loan portfolio benefits from having a LIBOR floor
at an average of 0.59%
• Where fixed rate loan portfolio is financed using floating rate liabilities,
100% of the floating rate exposure is hedged back to fixed
Note: Figures as of December 31, 2017, unless otherwise noted
17

$66
$41
$19
3.0% Increase
2.0% Increase
1.0% Increase
Well-Positioned to Benefit from a Rising
Interest Rate Environment
Note: Figures as of December 31, 2017, unless otherwise noted1) Includes all variable rate loans, held-to-maturity CMBS, variable rate debt and interest rate hedging instruments across all business segments. Excludes fixed rate loans,
real estate properties, intangible assets, fixed rate debt, and other instruments which are not variable rate
VARIABLE RATE ASSETS & LIABILITIES (1) CASH FLOW SENSITIVITY
TO CHANGES IN LIBOR (1)
($M)
Variable Rate
Assets
Variable Rate
Liabilities
Net Equity
($M)
Incremental benefit expected to be realized by special servicer
18
+$0.07/share
+$0.16/share
+$0.25/share
$6,550
($4,207)
$2,343

Equity Market
Capitalization
$5.6
Secured Debt
$5.8
Unsecured
Debt
$2.6
Conservative Balance SheetUtilize a Combination of Secured Asset-Level and Corporate-Level Debt
HISTORICAL DEBT-TO-EQUITY RATIO (1) CAPITALIZATION
NOTE: As of December 31, 2017, unless otherwise indicated1) Debt-to-undepreciated-equity2) Excludes Borrowings on transferred loans 3) Based on outstanding shares as of December 31, 2017 of 261.8 million and closing stock price on December 31, 2017 of $21.35
(2)
(3)
19
1.4x 1.4x 1.4x1.5x
1.6x1.7x
3Q16 4Q16 1Q17 2Q17 3Q17 4Q17

Total Debt Capacity$12.3 Billion of On-Balance Sheet Debt Capacity Not Including A-Note Syndications
US$ (M)
20
NOTE: As of December 31,2017, unless otherwise indicated1) Drawn amounts exclude discounts / premiums and unamortized deferred financing costs
Type
Maximum
Facility Size Drawn (1)Available
Capacity
Asset Specific Financing:
Large Loans 6,334$ 3,098$ 3,236$
Property Segment 1,670 1,640 30
Conduit Loans 450 67 383
MBS 678 531 147
REO Portfolio 196 177 19
Subtotal - Asset Specific Financing 9,328$ 5,513$ 3,815$
Corporate Debt:
Convertible Senior Notes 1,373$ 1,373$ -$
Senior Unsecured Notes 1,200 1,200 -
Term Loan 300 300 -
Revolv ing Secured Financing 100 - 100
Subtotal - Corporate Debt 2,973$ 2,873$ 100$
TOTAL DEBT: 12,301$ 8,386$ 3,915$
Debt Obligations
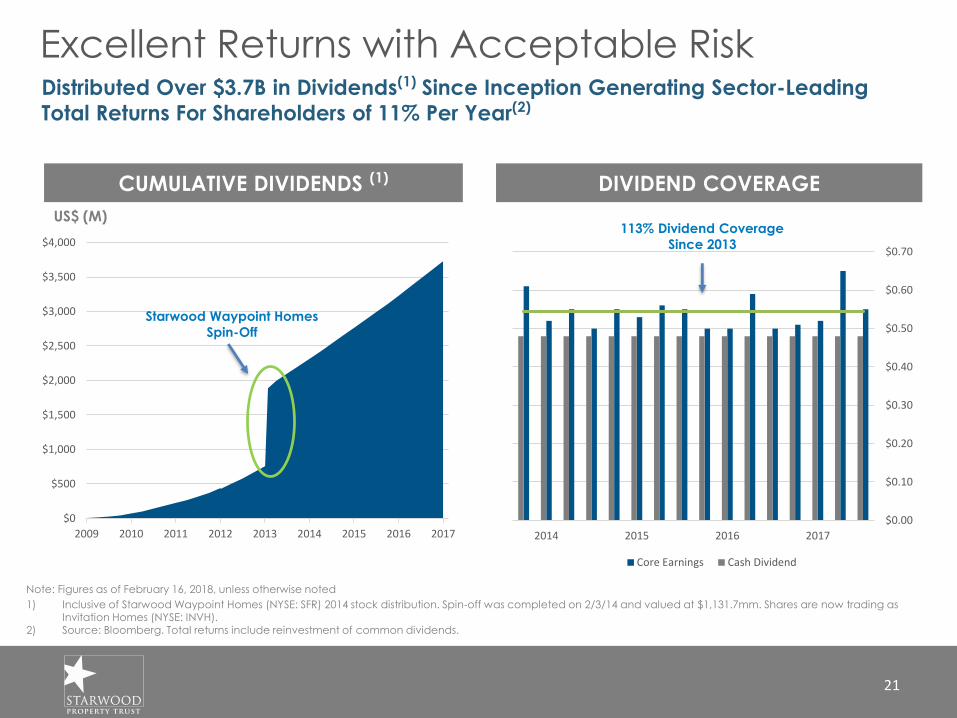
Excellent Returns with Acceptable RiskDistributed Over $3.7B in Dividends(1) Since Inception Generating Sector-Leading
Total Returns For Shareholders of 11% Per Year(2)
1) Inclusive of Starwood Waypoint Homes (NYSE: SFR) 2014 stock distribution. Spin-off was completed on 2/3/14 and valued at $1,131.7mm. Shares are now trading as Invitation Homes (NYSE: INVH).
2) Source: Bloomberg. Total returns include reinvestment of common dividends.
Note: Figures as of February 16, 2018, unless otherwise noted
DIVIDEND COVERAGECUMULATIVE DIVIDENDS (1)
21
US$ (M)
$0.00
$0.10
$0.20
$0.30
$0.40
$0.50
$0.60
$0.70
2017201620152014
Core Earnings Cash Dividend
113% Dividend Coverage
Since 2013
$0
$500
$1,000
$1,500
$2,000
$2,500
$3,000
$3,500
$4,000
2009 2010 2011 2012 2013 2014 2015 2016 2017
Starwood Waypoint Homes
Spin-Off
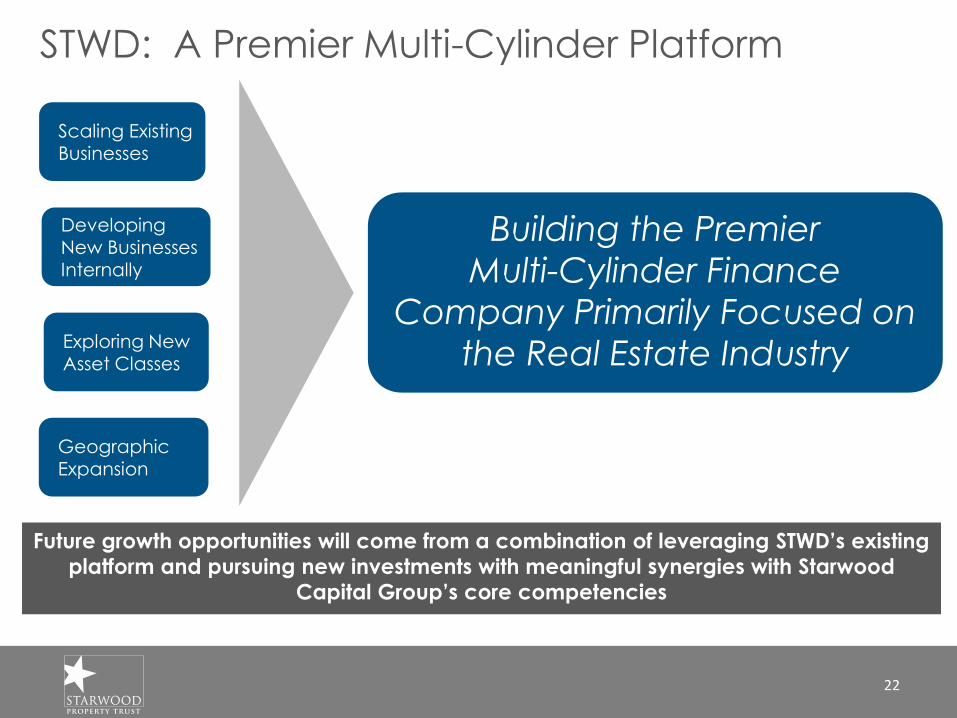
STWD: A Premier Multi-Cylinder Platform
Future growth opportunities will come from a combination of leveraging STWD’s existing
platform and pursuing new investments with meaningful synergies with Starwood
Capital Group’s core competencies
Scaling Existing Businesses
Developing New Businesses Internally
Exploring New Asset Classes
Geographic Expansion
Building the Premier
Multi-Cylinder Finance
Company Primarily Focused on
the Real Estate Industry
22
NYSE : STWD
Recommended


![[XLS] · Web view94 stwd candidates exp Type: N=Normal; I=In Kind Page Cand Last Cand Suf Cand First Cand Mi Party Office District Date Amount Type Contr Last Contr First Address](https://img.pdfslide.us/doc/110x75/5af3fdb47f8b9a74448c4011/xls-view94-stwd-candidates-exp-type-nnormal-iin-kind-page-cand-last-cand-suf.jpg)