Supplement of The Cryosphere, 9, 1183–1190, 2015http://www.the-cryosphere.net/9/1183/2015/doi:10.5194/tc-9-1183-2015-supplement© Author(s) 2015. CC Attribution 3.0 License.
Supplement of
Winter speed-up of quiescent surge-type glaciers in Yukon, Canada
T. Abe and M. Furuya
Correspondence to:T. Abe ([email protected])
The copyright of individual parts of the supplement might differ from the CC-BY 3.0 licence.

1
Supplementary material of “Winter speed-up of quiescent 1
surge-type glaciers in Yukon, Canada” by T. Abe and M. 2
Furuya 3
4
This supplementary material documents the surging episodes at four glaciers (Lowell, 5
Tweedsmuir, Ottawa Glacier, and Logan). We show radar intensity changes associated with 6
the opening and closing of crevasses due to the surge; the intensity changes were derived by 7
the RGB method (Yasuda and Furuya, 2013). We also describe the spatial-temporal changes 8
in the ice velocity at the glaciers and terminus advances during their active phases. 9
1. Surface crevasse formation revealed by SAR intensity analysis 10
Due to the sudden speed-up, a glacier surge generates new crevasses that will dramatically 11
change the surface roughness and hence enhance the SAR scattering intensities (Yasuda and 12
Furuya, 2013). By co-registrating two temporally separated SAR intensity images and 13
assigning the older image (master) with cyan [(Red, Green, Blue) = (0%, 100%, 100%)] and 14
the newer image (slave) with red [(Red, Green, Blue) = (100%, 0%, 0%)], the composite 15
image tells us where the scattering intensity has remarkably changed. This is called the RGB 16
method, which has also been employed in identifying the emerged/subsided small islands 17
after the 2004 Sumatra Earthquake (Tobita et al., 2006). In the composite image, the cyan 18
shows areas having an intensity increase, whereas the red shows with a decrease. The RGB 19
method allows us to clearly visualize the intensity changes that can be attributed to the 20
initiation of glacier surge. Although the SAR intensities can change by other processes such 21
as surface melt in summer and snow accumulation in winter, we apply this method to the 22
intensity images before and after a significant speed-up event (i.e., surge episodes), which 23
occurred at Lowell, Tweedsmuir and Ottawa Glacier (Fig. 1). We have confirmed that there 24
are few changes except surging glaciers (i.e., non-surging glaciers and off-ice area). Thus, all 25
the intensity changes we show below are attributed to glacier surge. 26
27
28
29

2
2. Spatial and temporal variability of surging glaciers 30
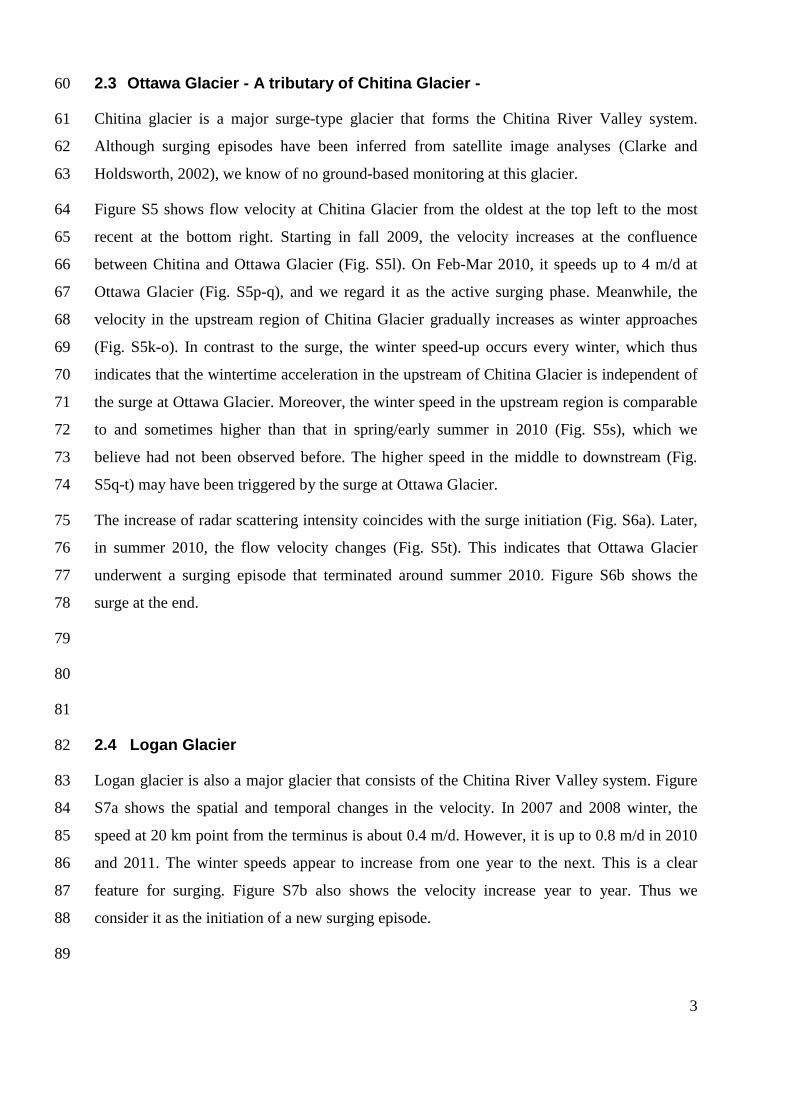
2.1 Lowell Glacier 31
Lowell Glacier is a famous surge-type glacier located in Kluane National Park near the 32
eastern edge of the St Elias Mountains. According to the Yukon Geological Survey (YGS), 33
Lowell Glacier has surged 5 times in the last 70 years (YGS, 2011). The latest surge began in 34
late 2009 and continued until late 2010 (YGS, 2011; Bevington and Copland, 2014). Pre-35
surge, the ice velocity was at most ~1 m/d (2007- 2009), it exceeded 5 m/d in the data pair of 36
January and March 2010 (Fig. S1). This is consistent with the YGS report. The ice velocity 37
slowed down in July and September 2010, but a lack of data prevents us from determining 38
exactly when the surge ended. 39
Figure S2a shows that the terminus advances by up to 4 km from early 2009 to July 2010. The 40
RGB method shows how the radar intensity increases after surge begins (Fig. S2b), and how 41
it decreases after the surge ends (Fig. S2c). We interpret the intensity changes as being due to 42
changes in the roughness of the ice surface that are attributable to the opening and closing of 43
crevasses at the start and end of the surge. 44
45
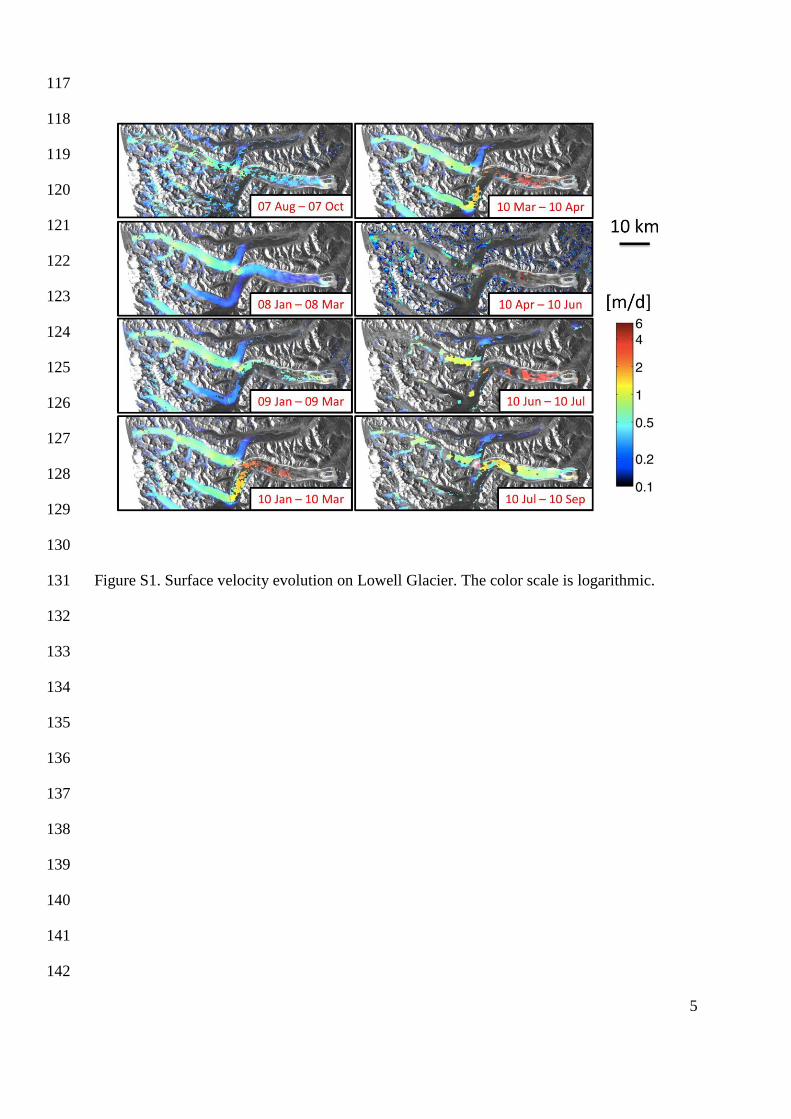
2.2 Tweedsmuir Glacier 46
Tweedsmuir Glacier is 50-km south of Lowell Glacier in the St. Elias Mountains. According 47
to the United States Geological Survey (USGS), the last surge began around 2007 summer 48
and terminated in 2008 (USGS, 2010). Figure S3 shows the ice velocity evolution, which 49
exhibits a greater velocity with ~6 m/d during the period from August to October 2007, but 50
slows down in January to March 2009. In 2010, we find a summer speed-up, but the velocity 51
magnitude is ~0.3 m/d, which is an order of magnitude slower than that during the surge in 52
2007. 53
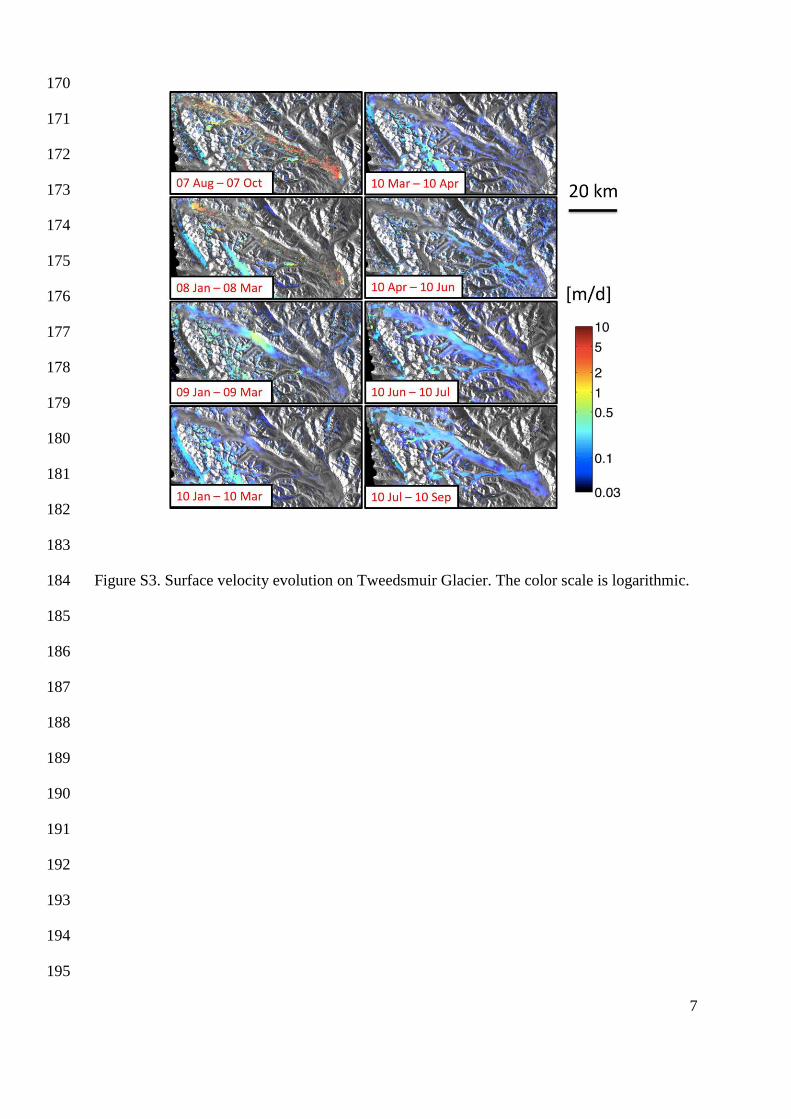
Figure S4a shows the terminus location changes, which expands several hundreds of meters 54
from the summer in 2007 to 2009. The RGB-method images in Figs. S4b and S4c, analogous 55
to those in Fig. 2 show the surge at its beginning and end. 56
57
58
59
3
2.3 Ottawa Glacier - A tributary of Chitina Glacier - 60
Chitina glacier is a major surge-type glacier that forms the Chitina River Valley system. 61
Although surging episodes have been inferred from satellite image analyses (Clarke and 62
Holdsworth, 2002), we know of no ground-based monitoring at this glacier. 63
Figure S5 shows flow velocity at Chitina Glacier from the oldest at the top left to the most 64
recent at the bottom right. Starting in fall 2009, the velocity increases at the confluence 65
between Chitina and Ottawa Glacier (Fig. S5l). On Feb-Mar 2010, it speeds up to 4 m/d at 66
Ottawa Glacier (Fig. S5p-q), and we regard it as the active surging phase. Meanwhile, the 67
velocity in the upstream region of Chitina Glacier gradually increases as winter approaches 68
(Fig. S5k-o). In contrast to the surge, the winter speed-up occurs every winter, which thus 69
indicates that the wintertime acceleration in the upstream of Chitina Glacier is independent of 70
the surge at Ottawa Glacier. Moreover, the winter speed in the upstream region is comparable 71
to and sometimes higher than that in spring/early summer in 2010 (Fig. S5s), which we 72
believe had not been observed before. The higher speed in the middle to downstream (Fig. 73
S5q-t) may have been triggered by the surge at Ottawa Glacier. 74
The increase of radar scattering intensity coincides with the surge initiation (Fig. S6a). Later, 75
in summer 2010, the flow velocity changes (Fig. S5t). This indicates that Ottawa Glacier 76
underwent a surging episode that terminated around summer 2010. Figure S6b shows the 77
surge at the end. 78
79
80
81
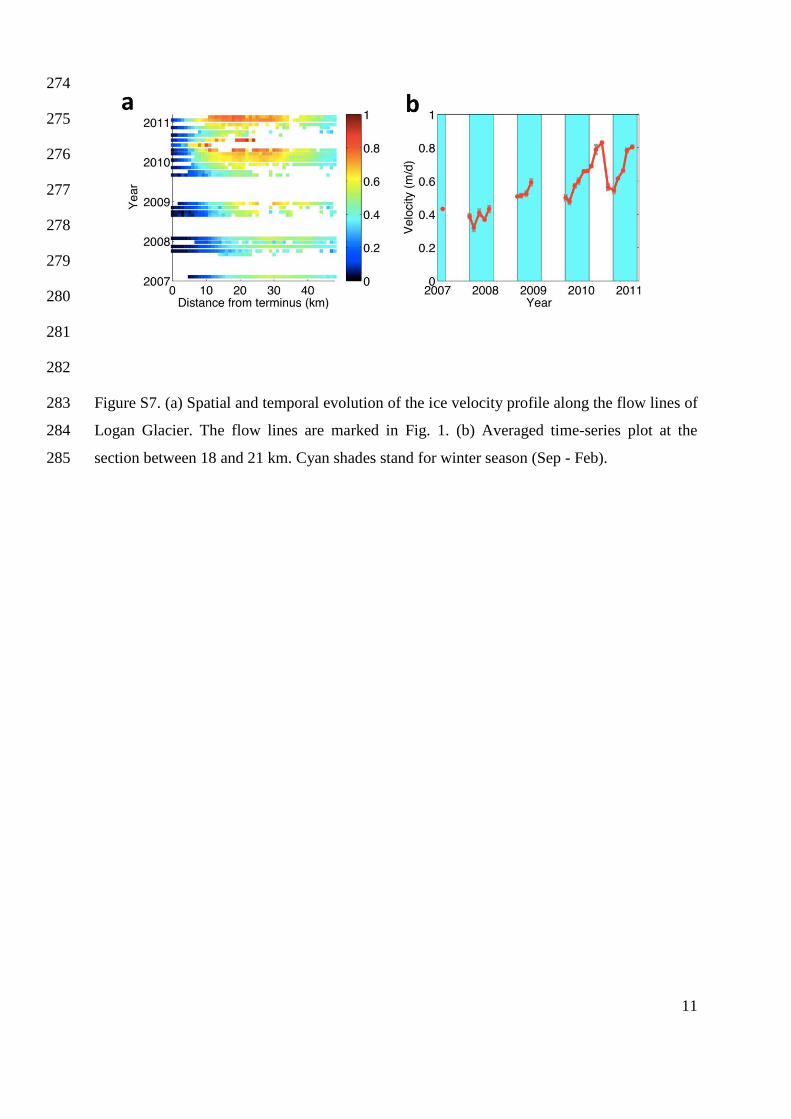
2.4 Logan Glacier 82
Logan glacier is also a major glacier that consists of the Chitina River Valley system. Figure 83
S7a shows the spatial and temporal changes in the velocity. In 2007 and 2008 winter, the 84
speed at 20 km point from the terminus is about 0.4 m/d. However, it is up to 0.8 m/d in 2010 85
and 2011. The winter speeds appear to increase from one year to the next. This is a clear 86
feature for surging. Figure S7b also shows the velocity increase year to year. Thus we 87
consider it as the initiation of a new surging episode. 88
89

4
References 90
Bevington, A., and Copland, L.: Characteristics of the last five surges of Lowell Glacier, 91
Yukon, Canada, since 1948, J. Glaciol, 60(219), 113-123, 2014. 92
Tobita, M., Suito, H., Imakiire, T., Kato, M., Fujiwara, S., and Murakami, M.: Outline of 93
vertical displacement of the 2004 and 2005 Sumatra earthquakes revealed by satellite radar 94
imagery, Earth Planets Space, 58, e1–e4, 2006. 95
The United Nations Geological Survey: 96
http://ak.water.usgs.gov/Projects/Tweedsmuir/index.php, last access: 25 June 2013, 2010. 97
Yukon Geological Survey: http://www.geology.gov.yk.ca/821.html, last access: 24 May 2013, 98
2011. 99
100
101
102
103
104
105
106
107
108
109
110
111
112
113
114
115
116
5
117
118
119
120
121
122
123
124
125
126
127
128
129
130
Figure S1. Surface velocity evolution on Lowell Glacier. The color scale is logarithmic. 131
132
133
134
135
136
137
138
139
140
141
142

6
143
144
145
146
147
148
149
150
151
152
153
154
Figure S2. Surging event on Lowell Glacier. (a) Terminus locations based on PALSAR 155
intensity images. (b) An RGB composite image derived from the images on 3 March, 2009 156
and 6 March, 2010. The red region indicates where the scattering intensity has increased. (c) 157
A composite image derived from the images on 3 March, 2010 and 10 September, 2010. The 158
cyan region indicates where the scattering intensity has decreased. 159
160
161
162
163
164
165
166
167
168
169
7
170
171
172
173
174
175
176
177
178
179
180
181
182
183
Figure S3. Surface velocity evolution on Tweedsmuir Glacier. The color scale is logarithmic. 184
185
186
187
188
189
190
191
192
193
194
195
8
196
197
198
199
200
201
202
203
204
205
206
207
208
Figure S4. (a) Terminus locations on Tweedsmuir Glacier based on PALSAR intensity 209
images. (b) An RGB composite image derived from the images on 29 August, 2007 and 14 210
January, 2008. (c) A composite image derived from the images on 29 February, 2008 and 16 211
January, 2009. 212
213
214
215
216
217
218
219
220
221

9
222
223
224
225
226
227
228
229
230
231
232
233
234
235
Figure S5. Surface velocity time-series (from upper left to lower right) at Chitina Glacier. 236
Images are arranged in the order of middle date between the first and second acquisitions for 237
each pair. The color scale is logarithmic. The black ovals mark a surge from autumn 2009 to 238
summer 2010 on Ottawa Glacier. 239
240
241
242
243
244
245
246
247

10
248
249
250
251
252
253
254
255
256
Figure S6. Composite images on Ottawa Glacier. The larger glacier at the top is Chitina 257
Glacier. (a) An RGB composite image derived from the images on 23 December, 2008 and 26 258
December, 2009. (b) A composite image derived from the images on 26 December, 2009 and 259
29 December, 2010. 260
261
262
263
264
265
266
267
268
269
270
271
272
273
11
274
275
276
277
278
279
280
281
282
Figure S7. (a) Spatial and temporal evolution of the ice velocity profile along the flow lines of 283
Logan Glacier. The flow lines are marked in Fig. 1. (b) Averaged time-series plot at the 284
section between 18 and 21 km. Cyan shades stand for winter season (Sep - Feb). 285
Recommended