Summer Series
EPAC Representatives:Janine Carzo
Robin O’Brein

Performance & Outcomes Measures (Measurement Year 3, (MY3))November 2015 to November 2016
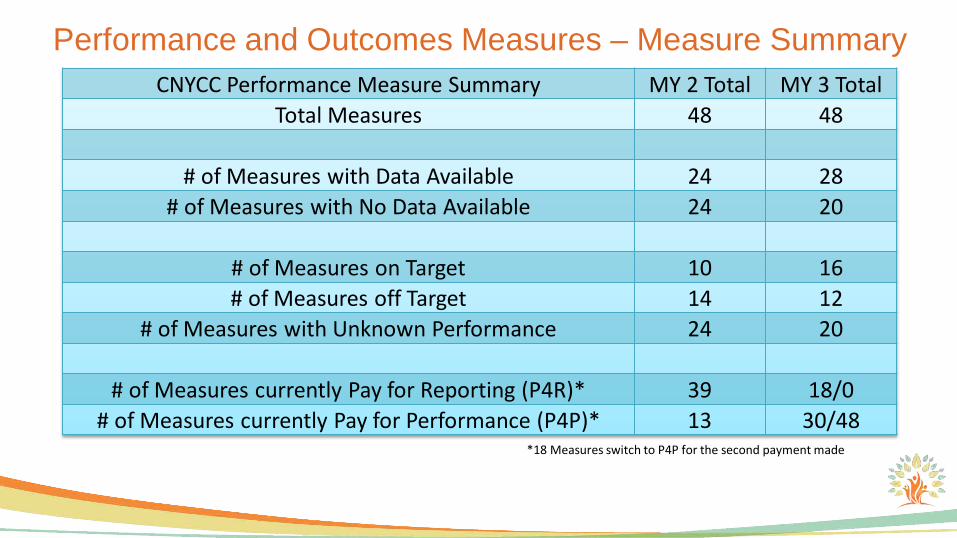
Performance and Outcomes Measures – Measure SummaryCNYCC Performance Measure Summary MY 2 Total MY 3 Total
Total Measures 48 48
# of Measures with Data Available 24 28# of Measures with No Data Available 24 20
# of Measures on Target 10 16# of Measures off Target 14 12
# of Measures with Unknown Performance 24 20
# of Measures currently Pay for Reporting (P4R)* 39 18/0# of Measures currently Pay for Performance (P4P)* 13 30/48
*18 Measures switch to P4P for the second payment made

Performance & Outcomes Measures – Goals & Results(Performance Period: July 2016 – November 2016 [Measurement Year 3])
The Performance and Outcomes Measures below apply to the following projects:
• Integrated Delivery System (2.a.i)
• DSRIP Care Management (2.a.iii)
• ED Care Triage (2.b.iii)
• Care Transitions (2.b.iv)

Performance & Outcomes Measures – Goals & ResultsPay for Performance Measures(Performance Period: July 2016 – November 2016 [Measurement Year 3])
On or Above GoalNot on Target to Goal – Indicates which direction and how much improvement is needed for CNYCC to meet monthly goal
84.3
6%
90.0
9%
87.1
2%
95.3
2%
95.5
3%
91.3
6%
96.9
8%
85.4
0%
90.5
4%
89.0
2%
95.3
9%
95.4
9%
91.8
4%
96.6
1%
85.75%90.77% 89.35%
95.60%95.77%
92.24%96.82%
85.15%90.37% 88.78%
95.24% 95.30%91.55%
96.47%
0.00%
10.00%
20.00%
30.00%
40.00%
50.00%
60.00%
70.00%
80.00%
90.00%
100.00%
Adult Access to Preventativeor Ambulatory Care - 20 to
44 (Rate Per 100)
Adult Access to Preventativeor Ambulatory Care - 45 to
64 (Rate Per 100)
Adult Access to Preventativeor Ambulatory Care - 65 and
older (Rate Per 100)
Children's access to PrimaryCare - 12 to 19 years (Rate
Per 100)
Children's access to PrimaryCare - 12 to 24 months (Rate
Per 100)
Children's access to PrimaryCare - 25 months to 6 years
(Rate Per 100)
Children's access to PrimaryCare - 7 to 11 years (Rate Per
100)
(0.45) (1.90) (0.07) (0.48)(1.04)

Performance & Outcomes Measures – Goals & ResultsPay for Performance Measures(Performance Period: July 2016 – November 2016 [Measurement Year 3])
On or Above GoalNot on Target to Goal – Indicates which direction and how much improvement is needed for CNYCC to meet monthly goal
P4R/P4P Measure switches to P4P
136.73 33.57
589.88
1,185.70
152.32 35.57
626.18 1,155.26
145.5733.93
599.06
1,099.88
157.14 37.02
645.55
1,194.82
-
200.00
400.00
600.00
800.00
1,000.00
1,200.00
1,400.00
PDI 90 - Composite of all measures (Rate Per100,000)
Potentially Avoidable ER Vists (Rate Per 100) Potentially Avoidable Readmissions (Rate Per100,000)
PQI 90 - Composite of all Measures (Rate Per100,000)
P4R/P4P
(30.44)
P4R/P4P

Performance & Outcomes Measures – Goals & Results(Performance Period: July 2016 – November 2016 [Measurement Year 3])
The Performance and Outcomes Measures below apply to the following projects:
• Behavioral Health/Primary Care Integration (3.a.i)
• Behavioral Health Crisis Stabilization (3.a.ii)

Performance & Outcomes Measures – Goals & ResultsPay for Performance Measures(Performance Period: July 2016 – November 2016 [Measurement Year 3])
53.6
9%
49.6
6%
34.6
2%
69.3
9%
71.5
6%
78.7
9%
20.7
9%
59.1
4%
41.7
7%
63.6
4%
57.1
9%
44.4
3%
52.5
9%
48.8
9%
33.9
3%
78.9
6%
70.7
7%
79.0
3%
19.7
8%
59.0
8%
41.5
9%
63.1
4%
58.8
3%
43.6
4%
54.04%49.57%
34.51%
79.76%
71.93%79.64%
20.30%
60.85%
43.57%
64.08%59.65%
44.46%
51.55%48.41%
33.51%
78.38%
69.94%
78.60%
19.41%
57.81%
40.17%
62.46%58.25%
43.06%
0.00%
10.00%
20.00%
30.00%
40.00%
50.00%
60.00%
70.00%
80.00%
90.00%
Adherence toAntipsychotic
Medications forPeople with
Schizophrenia(Rate Per 100)
Antidepressant Medication
Management –Effective Acute
Phase Treatment (Rate Per 100)
Antidepressant Medication
Management –Effective
Continuation Phase Treatment
(Rate Per 100)
CardiovascularMonitoring for
People withCardiovascular
Disease andSchizophrenia(Rate Per 100)
DiabetesMonitoring for
People withDiabetes andSchizophrenia(Rate Per 100)
DiabetesScreening forPeople with
Schizophrenia orBipolar Diseasewho are UsingAntipsychotic
Medication (RatePer 100)
Engagement ofAlcohol andOther Drug
DependenceTreatment
(Initiation and 2visits within 44days) (Rate Per
100)
Follow-up after hospitalization
for Mental Illness – within 30 days (Rate Per 100)
Follow-up after hospitalization
for Mental Illness – within 7 days (Rate Per 100)
Follow-up carefor Children
Prescribed ADHDMedications -Continuation
Phase (Rate Per100)
Follow-up care for Children
Prescribed ADHD Medications –
Initiation Phase (Rate Per 100)
Initiation ofAlcohol andOther Drug
DependenceTreatment (1visit within 14
days) (Rate Per100)(1.64)
On or Above GoalNot on Target to Goal – Indicates which direction and how much improvement is needed for CNYCC to meet monthly goal
(9.57)
(0.24)
P4R/P4P Measure switches to P4P
P4R/P4PP4R/P4P

Performance & Outcomes Measures – Goals & ResultsPay for Performance Measures(Performance Period: July 2016 – November 2016 [Measurement Year 3])
On or Above GoalNot on Target to Goal – Indicates which direction and how much improvement is needed for CNYCC to meet monthly goal
83.98 92.90
89.39
95.40
0.00
10.00
20.00
30.00
40.00
50.00
60.00
70.00
80.00
90.00
100.00
Potentially Preventable Emergency Room Visits (for persons with BH diagnosis) ± (Rate Per 100)
Performance & Outcomes Measures – Goals & Results(Performance Period: July 2016 – November 2016 [Measurement Year 3])
The Performance and Outcomes Measures below apply to the following projects:
• Cardiovascular Disease Management (3.b.i)

Performance & Outcomes Measures – Goals & ResultsPay for Performance Measures(Performance Period: July 2016 – November 2016 [Measurement Year 3])
(3.24)
30.54 166.44
35.12 145.96
33.73
140.06
36.11
150.17
-
20.00
40.00
60.00
80.00
100.00
120.00
140.00
160.00
180.00
Prevention Quality Indicator # 7(Hypertension) ±
Prevention Quality Indicator # 8 (HeartFailure) ±
76.83%
55.04%
78.37%
58.28%
79.69%
60.82%
77.43%
56.47%
0.00%
10.00%
20.00%
30.00%
40.00%
50.00%
60.00%
70.00%
80.00%
90.00%
Statin Therapy for Patients with CardiovascularDisease - Received Statin Therapy (Rate Per 100)
Statin Therapy for Patients with CardiovascularDisease - Statin Adherence 80% (Rate Per 100)
(20.48) (1.54)
On or Above GoalNot on Target to Goal – Indicates which direction and how much improvement is needed for CNYCC to meet monthly goal
Measure switches to P4P

Total Available FundingDY4 Payments from MY3 & DY3 Activities
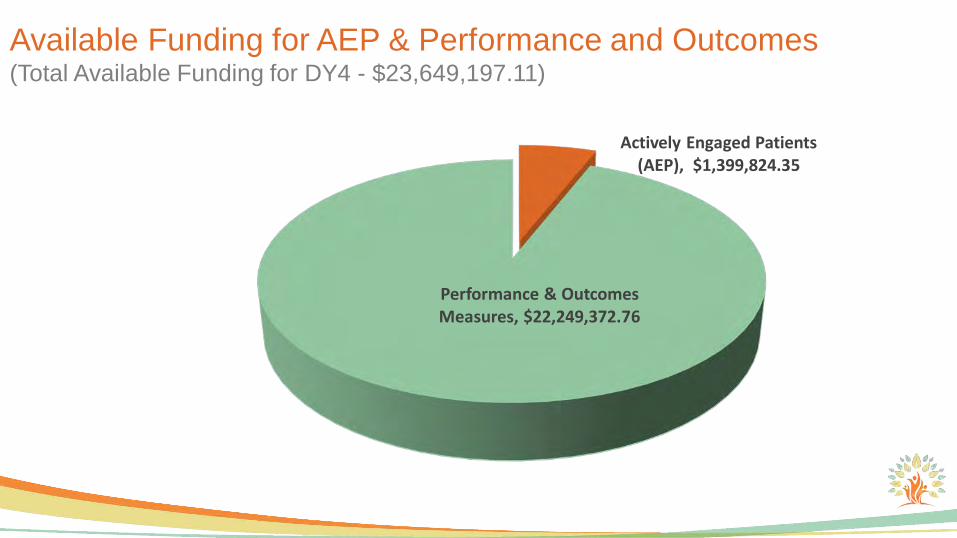
Available Funding for AEP & Performance and Outcomes (Total Available Funding for DY4 - $23,649,197.11)
Actively Engaged Patients (AEP), $1,399,824.35
Performance & Outcomes Measures, $22,249,372.76

Available Funding for Performance and Outcomes – P4R vs. P4P(Total Available Funding for DY4 - $22,249,372.76)
Pay for Reporting – Guaranteed Funds Pay for Performance – Funds Dependent on Results
$19,725,386.85
$1,644,227.34

Available Funding for Performance and Outcomes – P4R vs. P4P(Total Available Funding for DY4 - $22,249,372.76)
Projected NOT to Receive Payment
Pay for Reporting – Guaranteed Funds
Performance Unknown – Pay for Performance
Projected to Receive Payment
$1,644,227.33
$8,307,321.10
$4,527,622.93
$7,770,201.41

Performance & Outcome Measures: Projected FundingJuly 2016 to November 2016 (Measurement Year 3)

Performance and Outcomes – Projected Funding Summary• Dollar Values reflected in the Dashboards are based on the available funds paid out in
DY4. Total available to CNYCC is $22,249,372.76
• Performance Measures are broken into 4 Tiers based on measure worth• Tier 1 – 13 Performance and Outcomes Measures worth $13,070,771.62
• Includes Potentially Avoidable Readmissions and Potentially Avoidable ER Visits Measures
• Tier 2 – 11 Performance and Outcomes Measures worth $5,176,420.18• Includes Adult Access Measures
• Tier 3 – 14 Performance and Outcomes Measures worth $3,420,079.94• Includes Follow-up Care Measures
• Tier 4 – 10 Performance and Outcomes Measures worth $582,101.04• Includes Cardiovascular Measures

Performance and Outcomes – Projected Funding Summary(Total Funding Available for DY4 – Performance Measures - $22,249,372.76)
Tier 1, $13,070,771.62
Tier 2, $5,176,420.18
Tier 3, $3,420,079.94
Tier 4, $582,101.04
Measure Tiers Based on Total Funding for All Projects

Performance and Outcomes – Projected Funding Summary(Total Funding Available for DY4 Performance Measures – Tier 1 - $13,070,771.62)
Projected NOT to Receive Payment
Performance Unknown – Pay for PerformanceProjected to Receive Payment
$8,203,323.69 $1,304,837.84
$3,562,610.09
Tier 1 Performance Measure Breakdown - Funding

Performance and Outcomes – Projected Funding Summary(Total Funding Available for DY4 Performance Measures - $22,249,372.76)
Projected NOT to Receive Payment
Performance Unknown – Pay for PerformanceProjected to Receive Payment
$1,128,886.13
$1,128,886.13
$1,128,886.13
$744,332.06
$744,332.06
$744,332.06
$1,454,783.00
$564,443.06
$564,443.06
$1,304,837.84
$1,128,886.13
$1,304,837.84
$1,128,886.13
Getting Timely Appointments, Care and Information (Q6, Q8 and Q10)
Care Coordination (Q13, 17 and 20)
HCAHPS - Care Transistion Metrics (Q23 to Q25)
ED Use by uninsured
Non-use of Primary and Preventive Care Services
PAM Score
IPOS
Primary Care - Length of Relationship - Q3
Primary Care - Usual Source of Care - Q2
PQI 90 - Composite of all Measures
Potentially Avoidable ER Vists (Rate Per 100)
PDI 90 - Composite of all measures (Rate Per 100,000)
Potentially Avoidable Readmissions (Rate Per 100,000)
$- $200,000.00 $400,000.00 $600,000.00 $800,000.00 $1,000,000.00 $1,200,000.00 $1,400,000.00 $1,600,000.00
Tier 1 Measure Payments ($13,070,771.62)

Performance and Outcomes – Projected Funding Summary(Total Funding Available for DY4 Performance Measures – Tier 2 - $5,176,420.18)
Projected NOT to Receive Payment
Performance Unknown – Pay for PerformanceProjected to Receive Payment
$2,049,760.54
$2,665,597.64
$461,061.99
Tier 2 Performance Measure Breakdown - Funding

Performance and Outcomes – Projected Funding Summary(Total Funding Available for DY4 Performance Measures - $22,249,372.06)
Projected NOT to Receive Payment Projected to Receive Payment
$461,061.99
$512,936.14
$512,936.14
$510,952.12
$376,257.75
$376,257.75
$376,257.75
$512,936.14
$512,936.14
$512,936.14
$510,952.12
$- $100,000.00 $200,000.00 $300,000.00 $400,000.00 $500,000.00 $600,000.00
Screening for Clinical Depression and follow-up (Rate Per 100)
Cardiovascular Monitoring for People with Cardiovascular Disease and Schizophrenia (Rate Per 100)
Diabetes Screening for People with Schizophrenia or Bipolar Disease who are Using AntipsychoticMedication (Rate Per 100)
Prevention Quality Indicator # 8 (Heart Failure) ±
Adult Access to Preventative or Ambulatory Care - 20 to 44 (Rate Per 100)
Adult Access to Preventative or Ambulatory Care - 45 to 64 (Rate Per 100)
Adult Access to Preventative or Ambulatory Care - 65 and older (Rate Per 100)
Adherence to Antipsychotic Medications for People with Schizophrenia (Rate Per 100)
Diabetes Monitoring for People with Diabetes and Schizophrenia (Rate Per 100)
Potentially Preventable Emergency Room Visits (for persons with BH diagnosis) ± (Rate Per 100)
Prevention Quality Indicator # 7 (Hypertension) ±
Tier 2 Measure Payments ($5,176,420.18)
Performance Unknown – Pay for Performance

Performance and Outcomes – Projected Funding Summary(Total Funding Available for DY4 Performance Measures – Tier 3 - $3,420,079.94)
Projected NOT to Receive Payment
Performance Unknown – Pay for PerformanceProjected to Receive Payment
$291,323.40
$794,974.06
$2,333,782.48
Tier 3 Performance Measure Breakdown - Funding

Performance and Outcomes – Projected Funding Summary(Total Funding Available for DY4 Performance Measures - $22,249,372.76)
Projected NOT to Receive Payment Performance Unknown – Pay for PerformanceProjected to Receive Payment
$145,661.70
$145,661.70
$230,531.00
$282,221.53
$282,221.53
$256,468.07
$256,468.07
$256,468.07
$256,468.07
$230,531.00
$282,221.53
$282,221.53
$256,468.07
$256,468.07
$- $50,000.00 $100,000.00 $150,000.00 $200,000.00 $250,000.00 $300,000.00
Controlling High Blood Pressure
Flu Shots for Adults Ages 18 – 64
Follow-up care for Children Prescribed ADHD Medications – Initiation Phase (Rate Per 100)
Children's access to Primary Care - 12 to 19 years (Rate Per 100)
Children's access to Primary Care - 25 months to 6 years (Rate Per 100)
Engagement of Alcohol and Other Drug Dependence Treatment (Initiation and 2 visits within 44…
Follow-up after hospitalization for Mental Illness – within 30 days (Rate Per 100)
Follow-up after hospitalization for Mental Illness – within 7 days (Rate Per 100)
Initiation of Alcohol and Other Drug Dependence Treatment (1 visit within 14 days) (Rate Per 100)
Follow-up care for Children Prescribed ADHD Medications - Continuation Phase (Rate Per 100)
Children's access to Primary Care - 12 to 24 months (Rate Per 100)
Children's access to Primary Care - 7 to 11 years (Rate Per 100)
Antidepressant Medication Management – Effective Acute Phase Treatment (Rate Per 100)
Antidepressant Medication Management – Effective Continuation Phase Treatment (Rate Per 100)
Tier 3 Measure Payments ($3,420,079.94)

Performance and Outcomes – Projected Funding Summary(Total Funding Available for DY4 Performance Measures – Tier 4 - $582,101.04)
$436,439.34
$145,661.70
Tier 4 Performance Measure Breakdown - Funding
Projected NOT to Receive Payment Performance Unknown – Pay for Performance

Performance and Outcomes – Projected Funding Summary(Total Funding Available for DY4 Performance Measures - $ 22,249,372.76)
$72,830.85
$72,830.85
$48,462.94
$48,462.94
$48,462.94
$48,462.94
$48,462.94
$48,462.94
$72,830.85
$72,830.85
$- $10,000.00 $20,000.00 $30,000.00 $40,000.00 $50,000.00 $60,000.00 $70,000.00 $80,000.00
Aspirin Use
Discussion of Risks and Benefits of Aspirin Use
Health Literacy (QHL13)
Health Literacy (QHL14)
Health Literacy (QHL16)
Medical Assistance with Smoking and Tobacco Use Cessation – Advised to Quit
Medical Assistance with Smoking and Tobacco Use Cessation – Discussed Cessation Medication
Medical Assistance with Smoking and Tobacco Use Cessation – Discussed Cessation Strategies
Statin Therapy for Patients with Cardiovascular Disease - Received Statin Therapy
Statin Therapy for Patients with Cardiovascular Disease - Statin Adherence 80%
Tier 4 Measure Payments ($582,101.04)
Projected NOT to Receive Payment Performance Unknown – Pay for Performance

Actively Engaged PatientsJuly 2017 (Demonstration Year 3)

Actively Engaged Patients: April 1 – July 31, 2017
28
ProjectDY3Q2 Target Actual
Gap to DY3Q2 Target Status
DSRIP Care Management (2aiii) 5,600 32 5,568
ED Care Triage (2biii) 7,200 2,562 4,638
Care Transitions (2biv) 2,970 2,123 847
Patient Activation (2di) 11,100 1,442 9,658
Primary Care/Behavioral Health Integration (3ai) 16,490 12,299 4,191
Behavioral Health Crisis Stabilization (3aii) 10,800 4,033 6,767
Cardiovascular Disease Management (3bi) 6,460 3,303 3,157
Palliative Care PCMH Integration (3gi) 1,980 18 1,962 Indicates that 80% of the Q4 target has been reached and the AV should therefore be achieved

DSRIP Care Management Actively Engaged PatientsActively Engaged Patient Contribution by Organization by Month
Oneida Health Systems, Inc. Regional Primary Care NetworkJul-17 6
Jun-17 9
May-17 11
Apr-17 6
Mar-17 6
Feb-17 14
Jan-17 4 1
Dec-16 5
Nov-16 5
Oct-16 2
Sep-16 10
Aug-16 6
0
10
20
30
40
50
60
70
80
90

DY Target Actual AEP / Month (*) $ At-Risk
DY3Q2 (9/17) 5,600 32 747 x 6 months $167,000
DY3Q4 (3/18) 16,700 - 1112 x 12 months $144,000
Action Steps
• To increase partnership between Health Homes, down stream providers and medical entities, a finalized sample Service Agreement and Care Coordination communication work flow will be disseminated to partner organizations to assist with implementation strategies.
DSRIP Care Management Actively Engaged Patient Targets
* 80% AEP needed to meet target
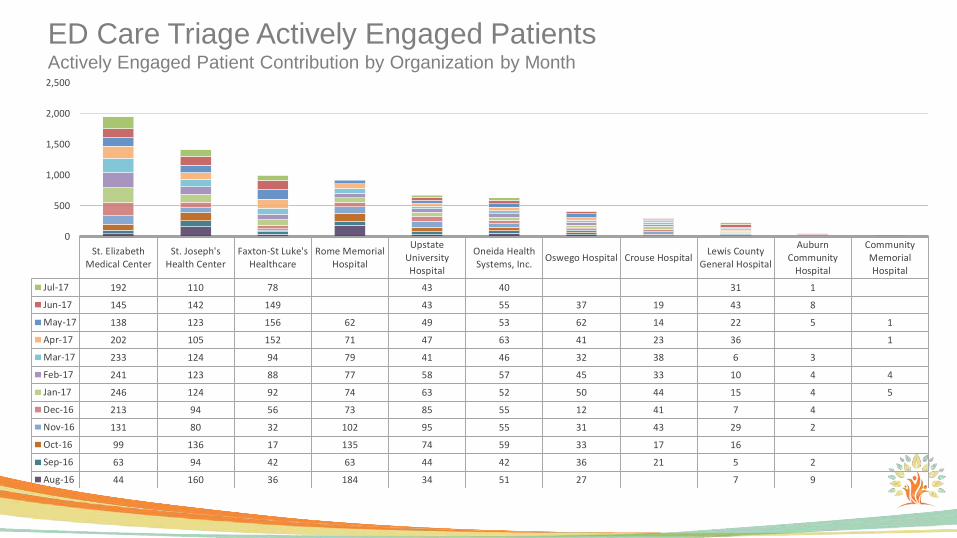
ED Care Triage Actively Engaged PatientsActively Engaged Patient Contribution by Organization by Month
St. ElizabethMedical Center
St. Joseph'sHealth Center
Faxton-St Luke'sHealthcare
Rome MemorialHospital
UpstateUniversityHospital
Oneida HealthSystems, Inc. Oswego Hospital Crouse Hospital Lewis County
General Hospital
AuburnCommunity
Hospital
CommunityMemorialHospital
Jul-17 192 110 78 43 40 31 1
Jun-17 145 142 149 43 55 37 19 43 8
May-17 138 123 156 62 49 53 62 14 22 5 1
Apr-17 202 105 152 71 47 63 41 23 36 1
Mar-17 233 124 94 79 41 46 32 38 6 3
Feb-17 241 123 88 77 58 57 45 33 10 4 4
Jan-17 246 124 92 74 63 52 50 44 15 4 5
Dec-16 213 94 56 73 85 55 12 41 7 4
Nov-16 131 80 32 102 95 55 31 43 29 2
Oct-16 99 136 17 135 74 59 33 17 16
Sep-16 63 94 42 63 44 42 36 21 5 2
Aug-16 44 160 36 184 34 51 27 7 9
0
500
1,000
1,500
2,000
2,500
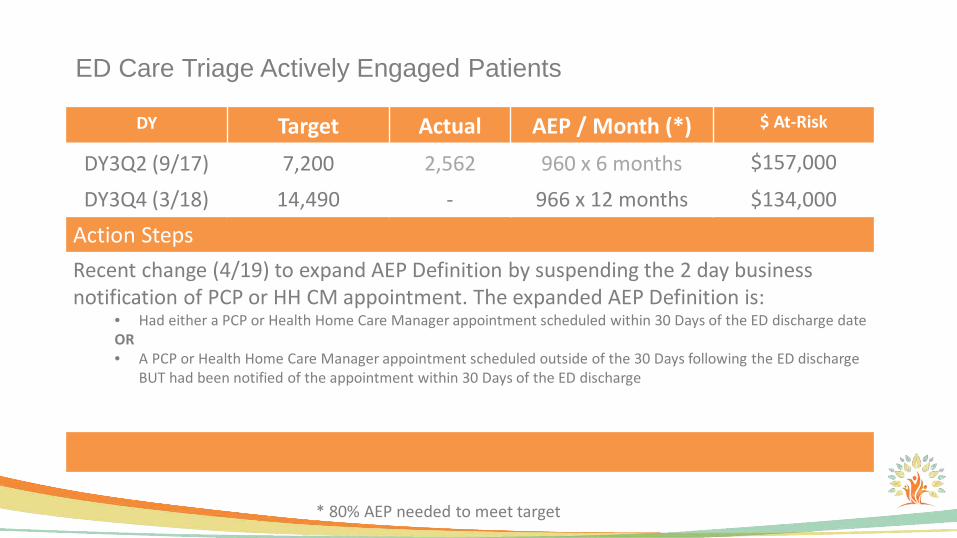
DY Target Actual AEP / Month (*) $ At-Risk
DY3Q2 (9/17) 7,200 2,562 960 x 6 months $157,000
DY3Q4 (3/18) 14,490 - 966 x 12 months $134,000
Action StepsRecent change (4/19) to expand AEP Definition by suspending the 2 day business notification of PCP or HH CM appointment. The expanded AEP Definition is:
• Had either a PCP or Health Home Care Manager appointment scheduled within 30 Days of the ED discharge date OR• A PCP or Health Home Care Manager appointment scheduled outside of the 30 Days following the ED discharge
BUT had been notified of the appointment within 30 Days of the ED discharge
ED Care Triage Actively Engaged Patients
* 80% AEP needed to meet target

Care Transitions Actively Engaged PatientsActively Engaged Patient Contribution by Organization by Month
UpstateUniversityHospital
St. Joseph'sHealth Center
St. ElizabethMedical Center
AuburnCommunity
Hospital
Oneida HealthSystems, Inc.
Faxton-St Luke'sHealthcare
Rome MemorialHospital
Lewis CountyGeneral Hospital Oswego Hospital Crouse Hospital
Jul-17 120 214 51 100 42 37 1
Jun-17 249 71 60 56 70 42
May-17 251 66 73 49 75 5
Apr-17 228 65 67 64 59 2 6
Mar-17 308 10 83 11 4 5
Feb-17 292 20 58 12 7 1
Jan-17 320 14 29 15 19 1
Dec-16 314 188 72 10 43 37 57 2 1
Nov-16 267 178 61 43 53 17 34 5 15
Oct-16 281 212 82 50 54 15 43 4 11 1
0
500
1,000
1,500
2,000
2,500
3,000

DY Target Actual AEP / Month (*) $ At-Risk
DY3Q2 (9/17) 2,970 2,123 396 x 6 months $156,000
DY3Q4 (3/18) 5,940 - 396 x 12 months $134,000
Action Steps• Actively Engaged Patient definition has been finalized and approved.• All participating Hospitals received the updated AEP and Reporting
Requirements• All participating Hospital have until August 14th at 10:00 a.m. to report AEP for
April, May and June of 2017. Following this retroactive reporting, it is anticipated that our target numbers will significantly improve.
Care Transitions Actively Engaged Patients
* 80% AEP needed to meet target

Patient Activation Actively Engaged PatientsActively Engaged Patient Contribution by Organization by Month
LewisCountyGeneralHospital
OneidaHealth
Systems, Inc.
CatholicCharitie
s ofOnonda
gaCounty
PlannedParenthood of
Mohawk
Hudson, Inc.
TheSalvation Army
FingerLakes
MigrantHealthCare
ProjectInc.
CrouseHospital
RescueMissionof Utica
ACRHealth
Faxton-St
Luke'sHealthc
are
AuburnCommu
nityHospital
CatholicCharitie
s ofOswegoCounty
Regional
PrimaryCare
Network
St.Elizabet
hMedicalCenter
NOCHSI
NorthCountryPrenata
lPerinat
alCouncil
Resource
Centerfor
IndependentLiving
Arise,Inc.
PlannedParenthood ofCentral
andWester
n NY
LewisCountyHealthAgency
HillsideChildre
n'sCenter
ElderChoice,Inc.
Hutchings
Psychiatric
Center
UpstateUniversi
tyHospital
Northern
Regional Center
forIndependentLiving
Jul-17 51 41 32 14 5 9 8 24 3 11 4 3 5 1
Jun-17 88 54 18 28 48 30 15 5 3 12 5 17 7 1 11 1
May-17 89 56 79 35 4 30 7 49 17 5 9 12 3 8 3 2 1 1 2
Apr-17 103 35 46 50 5 23 20 74 23 36 12 9 5 14 4 1 2 7 4 2 1
Mar-17 136 53 14 27 15 4 25 14 2 15 2 4 3 7 8 3 4 6
Feb-17 52 33 12 32 27 32 6 34 3 26 7 1 4 4 3 1 1 1
Jan-17 59 41 23 32 5 35 31 8 4 12 1 1 6 14 1
Dec-16 37 16 19 21 9 26 2 7 8 4 3 2 7
Nov-16 70 24 20 109 6 10 4 13 1 9 3 3
Oct-16 27 31 38 5 7 27 8 12 1 4 8 1
Sep-16 35 3 26 2 12 16 10 6 1 1 2
Aug-16 37 12 62 6 8 11 11 3 5 2 4
0
100
200
300
400
500
600
700

DY Target Actual AEP / Month (*) $ At-Risk
DY3Q2 (9/17) 11,100 1,442 1480 x 6 months $135,000
DY3Q4 (3/18) 22,300 - 1,487 x 12 months $116,000
Action Steps• Train-the-Trainer Session scheduled for 8/17/17• Quarterly Implementation Meeting 8/30/17 3:00PM-4:00PM
Patient Activation Performance Measure
• 1 Eligible Re-PAM to Date (Through July 2017) – Performance Not Hitting Target
Patient Activation Actively Engaged Patients/Re-Pamming Status
* 80% AEP needed to meet target

Primary Care/Behavioral Health Integration Actively Engaged PatientsActively Engaged Patient Contribution by Organization by Month
St.Elizabet
hMedicalCenter
NOCHSI
Faxton-St
Luke'sHealthc
are
St.Joseph'
sHealthCenter
UpstateUnivers
ityHospita
l
Planned
Parenthood of
Mohawk
Hudson, Inc.
Syracuse BrickHouse
Community
Memorial
Hospital
FamilyCare
MedicalGroup
Regional
PrimaryCare
Network
OswegoHospita
l
Syracuse
Community
HealthCenter,
Inc.
CrouseHospita
l
LibertyResources, Inc.
LewisCountyGeneralHospita
l
FingerLakes
MigrantHealthCare
ProjectInc.
OneidaHealthSystems, Inc.
Farnham Inc.
UnitedCerebral Palsy
Mohawk ValleyPsychia
tricService
s
AuburnCommu
nityHospita
l
Arise,Inc.
Jul-17 582 256 285 72 244 214 49 86 123 41 29 18 34 12 13
Jun-17 687 320 422 160 306 420 43 93 82 256 53 54 97 41 34 15 12
May-17 915 410 528 370 399 204 95 113 105 155 214 67 80 7 47 42 27 8
Apr-17 796 445 569 444 175 97 124 100 186 99 46 98 76 62 19 16 8
Mar-17 491 314 179 269 148 275 226 39 72 69 39 59 51 18 10 7 9 18
Feb-17 471 315 176 210 103 249 208 36 92 92 100 46 48 22 58 21 3 16 12 15
Jan-17 577 417 197 252 164 244 205 42 49 55 132 46 41 24 68 30 7 25 19 18 2
Dec-16 439 468 170 254 235 263 164 38 63 76 51 28 19 26 23 11 16 28
0
1,000
2,000
3,000
4,000
5,000
6,000
7,000
8,000

DY Target Actual AEP x Month (*) $ At-Risk
DY3Q2 (9/17) 16,490 12,299 2,199 x 6 months $142,000
DY3Q4 (3/18) 39,865 - 2,658 x 12 months $122,000
Action Steps
• Actively Engaged Patient Reporting Criteria narrows starting April 1st to align with the 3ai Standards of Care
Primary Care/Behavioral Health Integration Actively Engaged Patients
* 80% AEP needed to meet target

Behavioral Health Crisis Stabilization Actively Engaged PatientsActively Engaged Patient Contribution by Organization by Month
OnondagaCase
Management
OswegoHospital
SyracuseBrick
House
LibertyResources
, Inc.
St.Joseph'sHealthCenter
SyracuseCommunit
y HealthCenter,
Inc.
Arise, Inc.
CayugaCounty
Community Mental
HealthCenter
TheNeighborh
oodCenter,
Inc.
CentralNew YorkServices
HutchingsPsychiatric Center
MohawkValley
Psychiatric Services
NorthCountry
Transitional LivingServices
UpstateUniversityHospital
UnityHouse ofCayugaCounty,
Inc.
OswegoCounty
Opportunities
FarnhamInc.
Jul-17 59 83 61 25 16 11 2
Jun-17 443 157 192 94 69 19 21 18 13 2 2
May-17 475 256 168 319 127 26 24 29 18 23 1 4
Apr-17 459 239 149 242 110 21 18 14 21 2 1
Mar-17 172 235 95 35 20 24 3 2
Feb-17 668 257 157 132 109 21 22 20 15 16
Jan-17 745 268 161 133 156 32 47 25 27 31 13 2 2 1
Dec-16 610 259 163 113 136 39 35 24 13 9 2 3
Nov-16 591 252 150 137 141 24 31 19 16 4 7 1 1 4
0
1,000
2,000
3,000
4,000
5,000
6,000

DY Target Actual AEP / Month (*) $ At-Risk
DY3Q2 (9/17) 10,800 4,033 1,440 x 6 months $135,000
DY3Q4 (3/18) 24,480 - 1,632 x 12 months $116,000
Action Steps• Convening partner-led discussion about Open Access scheduling as a strategy to
improve access to services. • Workgroup meeting to develop protocols around mobile crisis, peer respite and
warm line. • Work of the group will continue, but at the county level; exploring overlap with
the Care Transition Coalitions and other forums.
Behavioral Health Crisis Stabilization Actively Engaged Patients
* 80% AEP needed to meet target

Cardiovascular Disease Management Actively Engaged Patients Actively Engaged Patient Contribution by Organization by Month
St.ElizabethMedicalCenter
Faxton-StLuke's
Healthcare
UpstateUniversityHospital
RomeMemorialHospital
Family CareMedicalGroup
LewisCountyGeneralHospital
SyracuseCommunity
HealthCenter, Inc.
CommunityMemorialHospital
NOCHSI
RegionalPrimary
CareNetwork
PhysicianCare, PC
OneidaHealth
Systems,Inc.
St. Joseph'sHealthCenter
AuburnCommunity
Hospital
OswegoHospital
Jul-17 176 132 45 51 37 29 20 7 14 8
Jun-17 230 179 65 55 86 109 39 31 34 14 23 6
May-17 368 258 89 50 23 81 37 41 17 32 17 23 16
Apr-17 235 93 118 54 81 21 43 48 54 60 8 29 17
Mar-17 218 150 65 31 47 82 29 26 24 3 23 4
Feb-17 218 133 24 26 31 62 14 15 29 23 30 17 13 10
Jan-17 65 166 10 25 65 61 14 22 31 32 32 17 9
Dec-16 46 150 15 21 39 31 4 25 30 23 34 12 1 10
Nov 16 38 136 218 52 70 48 20 35 27 10 16 7
0
200
400
600
800
1,000
1,200
1,400
1,600
1,800

DY Target Actual AEP / Month (*) $ At-Risk
DY3Q2 (9/17) 6,460 3,303 861 x 6 months $104,000
DY3Q4 (3/18) 12,730 - 849 x 12 months $89,000
Action Steps• Supporting partner implementation of Standards of Care.• Working with HealtheConnections and other community partners to increase Self-Measured
Blood Pressure opportunities to improve patient blood pressure control.• Continuing work with Central New York Regional Center for Tobacco Health Systems to
support smoking cessation training, 5A’s implementation and connections with the NYS Smoker’s Quitline.
• DY3 focus on promotion of community resources and population health management particularly for high risk patients.
Cardiovascular Disease Management Actively Engaged Patients
42* 80% AEP needed to meet target

Palliative Care IntegrationActively Engaged Patient Contribution by Organization by Month
St. Elizabeth Medical CenterJul-17 13Jun-17 4May-17 1Mar-17 6
0
5
10
15
20
25
30

DY Target Actual AEP / Month (*) $ At-Risk
DY3Q2 (9/17) 1,980 18 264 x 6 months $80,000
DY3Q4 (3/18) 3,960 - 264 x 12 months $69,000
Action Steps• Exploring alignment with PCMH and working with Karen Joncas to develop a
model for delivery within practices to support implementation.• Continued outreach to partner organizations considering the Palliative Care
project to help eliminate barriers to engagement• Developing repository for IPOS for contracted partners to be able to report• Formation of Implementation and Planning Meetings for palliative care
integration project partners and community palliative experts to foster/strengthen implementation
Palliative Care Integration Actively Engaged Patients
44* 80% AEP needed to meet target


Development of New Funds Flow Policy • Board of Directors charged CNYCC
with the development of a plan for the next iteration of program funding
• CNYCC hired COPE Health Solutions to support the new funds flow policy development
• Creation of a Funds Flow Work Group (FFWG) comprised of a wide-range of CNYCC partner organizations
• FFWG work directly with the CNYCC (COPE) to provide oversight and recommendations for the successful development of the PPS’s next-phase funds flow model.
CNYCC Funds Flow Work Group

CNYCC Phase II Funding
Currently being finalized for BOD approval (August) Development of a formulaic process to distribute funding for participation
Fund Allocation
Distribution of approximately $49 million
Bridge PaymentPhase II Project Agreement
Activity Focus
Actively Engaged PatientsReporting Performance ActivityTransition to VBPBridge Payment
New – CNYCC Funds Flow Policy

Proposed Allocation of CY17 Baseline Partner Share w/ Rollover
Copyright © 2017 COPE Health Solutions. All rights reserved.
$34M
$15M
0
$10M
$20M
$30M
$40M
$50M
$60M
CY17/FY17
Baseline Rollover
$10M
$3.4M
$1.6M
Innovation Fundsand Project RFPs
Revenue Loss
Bridge Payment
Total Partner Share for CY17/FY17: approx. $49M
Phase II Contracting Funds

Bridge Payment
• Above Target Patient Reporting – Retroactive funding provided to partner organizations that reported actively engaged patients over the identified targets ($1.5 Million)
• Performance Activity Funding – All CNYCC contracted partner organizations will be provided the opportunity to complete as many as seven performance activities to receive funding ($8.5 Million)
• A small cohort of contracted partners (approximately 40 partner organizations) will have the opportunity to participate in an additional activity focused on the implementation of the Population Health Management (PHM) system
• Flow funds to partners immediately for completed, in-process and near-term activities to advance DSRIP objectives
• Gather important information that will inform future contracting• “Bridge” the network activities from previous payment policies to upcoming Phase II contracts• PHM Integration Process
Goals of the Bridge Payment:
Bridge Payment: Funding Opportunities

PHM Readiness & Integration Activities ACR HealthARISE Child and Family ServicesAuburn Community HospitalCayuga Counseling ServicesCentral New York Health Home NetworkChristian Health Services of SyracuseCircareCommunity Memorial HospitalCrouse HospitalEast Hill Family MedicalFamilyCare Medical GroupFaXton-St Luke's HealthcareFinger Lakes Community HealthKinney DrugsLewis County General HospitalLiberty ResourcesLorettoMenorah Park
Mohawk Valley Psychiatric CenterNOCHSIOneida Health Systems, Inc.Oswego Family PhysiciansOswego Health (Hospital)Physician Care PCPlanned Parenthood of Mohawk HudsonRegional Primary Care NetworkRome Memorial HospitalSitrinSt. CamillusSt. Elizabeth Medical CenterSt. Joseph's Hospital Health CenterSyracuse Behavioral HealthSyracuse Community Health Center, Inc.The Neighborhood CenterUpstate Cerebral PalsyUpstate University Hospital

Phase II Project Agreements
• $32 Million Dollars to be allocated to Partner Organizations • Formula to Determine Potential Funding Possible per Individual Partner Organization• Greater Emphasis on Performance Measurement • “Bridge” the network activities from previous payment policies to upcoming Phase II contracts
Phase II Funding:
Next Steps:
• FFWG Recommendation of Phase II Funds Flow Policies to CNYCC BOD• Network Engagement on Funds Flow Process – Bridge Payment/Phase II Project Agreement• BOD Approval for Final Analysis Outputs (August Board Meeting)• Development & Distribution of Phase II Project Agreements

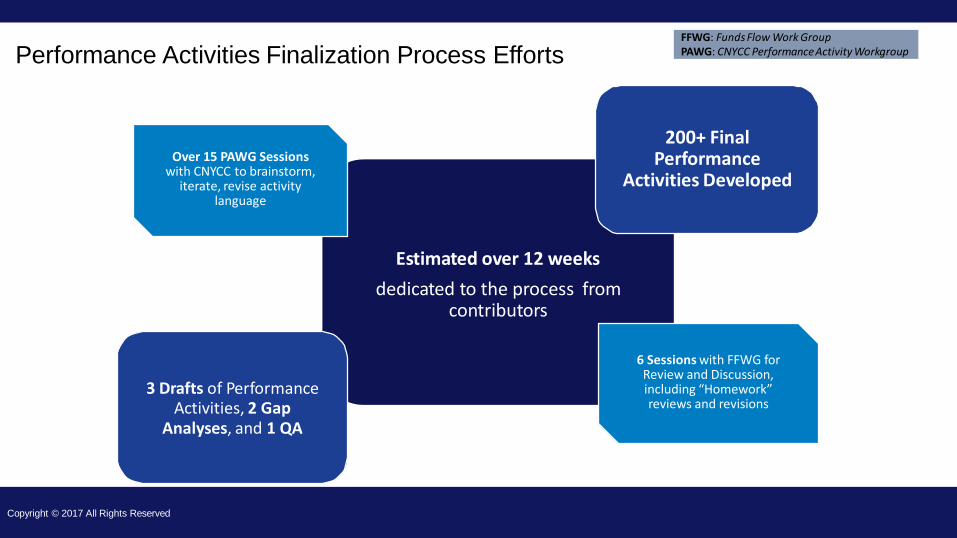
Performance Activities Finalization Process Efforts
Estimated over 12 weeksdedicated to the process from
contributors
Over 15 PAWG Sessions with CNYCC to brainstorm,
iterate, revise activity language
6 Sessions with FFWG for Review and Discussion, including “Homework” reviews and revisions
3 Drafts of Performance Activities, 2 Gap
Analyses, and 1 QA
200+ Final Performance
Activities Developed
Copyright © 2017 All Rights Reserved
FFWG: FundsFlow Work GroupPAWG: CNYCC PerformanceActivity Workgroup
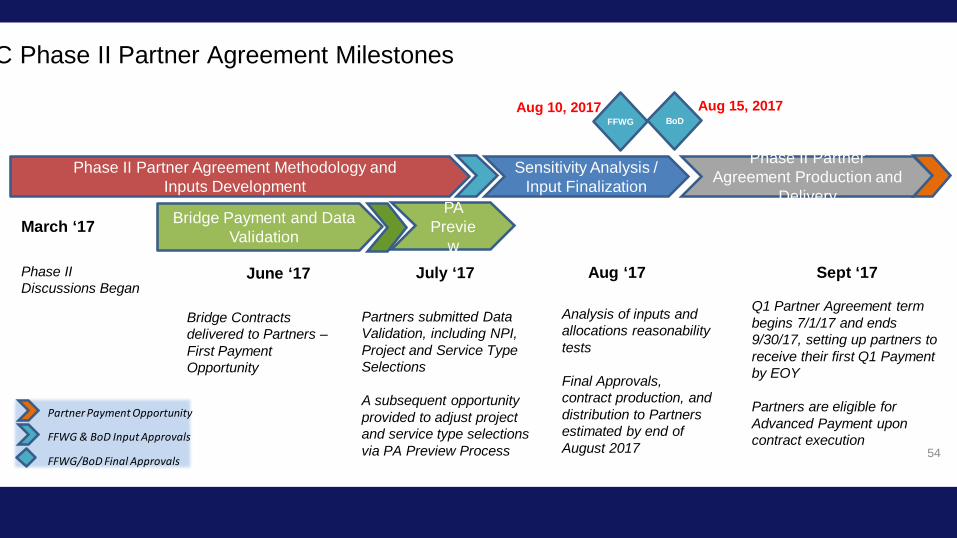
C Phase II Partner Agreement Milestones
54
FFWG BoD
Bridge Payment and Data Validation
PA Previe
w
Phase II Partner Agreement Production and
Delivery
Phase II Partner Agreement Methodology and Inputs Development
Sept ‘17
Aug 15, 2017Aug 10, 2017
June ‘17
March ‘17
Phase II Discussions Began
Bridge Contracts delivered to Partners –First Payment Opportunity
Partners submitted Data Validation, including NPI, Project and Service Type Selections
A subsequent opportunity provided to adjust project and service type selections via PA Preview Process
July ‘17
Q1 Partner Agreement term begins 7/1/17 and ends 9/30/17, setting up partners to receive their first Q1 Payment by EOY
Partners are eligible for Advanced Payment upon contract execution
Sensitivity Analysis / Input Finalization
FFWG & BoD Input Approvals
FFWG/BoD Final Approvals
Partner Payment Opportunity
Aug ‘17
Analysis of inputs and allocations reasonability tests
Final Approvals, contract production, and distribution to Partners estimated by end of August 2017

Total Partner Share Available for Distribution: $32.36M
Contract Term: July 1, 2017 to June 30, 2018
Total Contracting Partners: 123Performance Activities: 235• General: 127• Patient Engagement Reporting: 108
Partner Service Types: 48 Total Membership Assigned: Approx. 150K lives
55
II Elements Summary
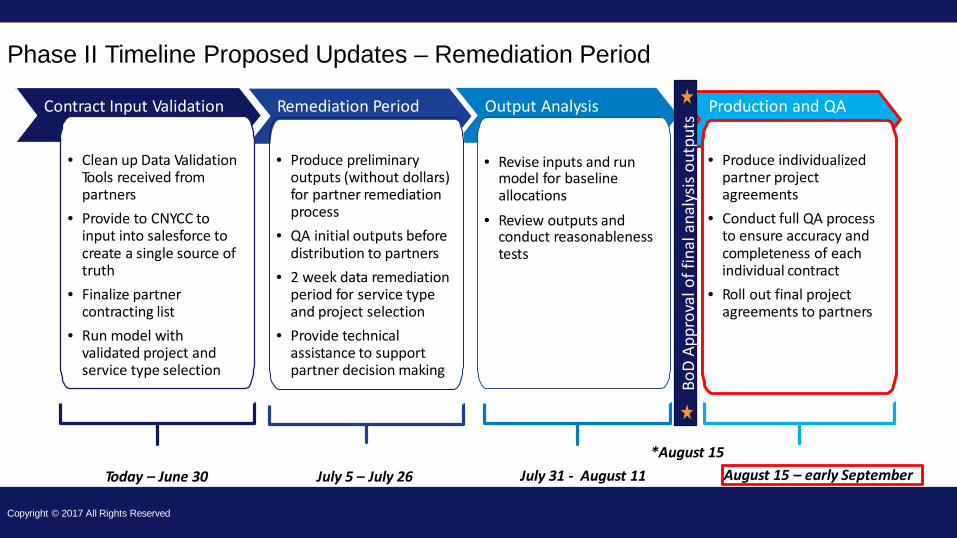
Phase II Timeline Proposed Updates – Remediation Period
• Review outputs andconduct reasonablenesstests
Contract Input Validation Remediation Period Output Analysis Production and QA
• Produce individualized partner project agreements
• Conduct full QA processto ensure accuracy andcompleteness of eachindividual contract
• Roll out final project agreements to partners
• Revise inputs and runmodel for baseline allocations
• Produce preliminaryoutputs (without dollars) for partner remediationprocess
• QA initial outputs before distribution to partners
• 2 week data remediationperiod for service type and project selection
• Provide technical assistance to support partner decision making
• Clean up Data ValidationTools received frompartners
• Provide to CNYCC toinput into salesforce tocreate a single source oftruth
• Finalize partnercontracting list
• Run model withvalidated project andservice type selection
Today – June 30 July 5 – July 26 July 31 - August 11
BoD
Appr
oval
of fi
nala
naly
sisou
tput
s
August 15 – early September
Copyright © 2017 All Rights Reserved
*August 15

10-minute break

Care Transitions – Workgroup Update
Case Study Presentation
Tammy Van Epps, CNYCC Christine Stegel, I-PRO

1. Consumer transitioned out of Rehabilitation. Communication between the case manager and Resource Center of Independent Living(RICL) prior to discharge assisted with having services started for when the consumer was able to go home. Consumer had a smoothtransition with 84 hours of services. (Was this case a new or active patient with RICL?)
2. Recently we received a referral for a person that was in the hospital in March. The hospital staff had contacted me about the program,trying to get services upon discharge. I worked with that person to explain the process for getting services. I spoke with the person’s wife as well about the program. He was discharged and due to the assessment process and authorization, we just received the referral 5/1. He is not yet open.
3. One thing I come across often is the hospital thinking Resource Center of Independent Living (RICL) is the case manager for a person with Consumer Directed Personal Assistance Program (CDPAP). We work to explain how the program works and point them in the right direction of the actual case manager so that staff has a better understanding.
ONEIDA COUNTY RPAC/Workgroup MEETING August 24, 2017
PATIENT SCENARIOS
Care Transition Protocol Overview
Tammy Van Epps, CNYCC Christine Stegel, I-PRO

Introduction of Oneida County “Community Workflow” Model
Janine Carzo, RPCN Christine Stegel, I-PRO

Operational Report

Sue Jessen Director of Project Management and Performance Improvement(315) [email protected]
Siti MackManager for Workforce and Cultural Competency/Health Literacy(315) 703- [email protected]
New Employees

3.30.17

OneidaNext Meeting:
November 16, 2017
Recommended