Washington State
Summary of Public Transportation – 2010


Washington State
Summary of Public Transportation – 2010November 2011
Public Transportation Division
with partial financial assistance through grants from the U.S. Department of Transportation, Federal Transit Administration, and Federal Highway Administration

Americans with Disabilities Act (ADA) InformationMaterials can be provided in alternative formats by calling the ADA Compliance Manager at 360‑705‑7097. Persons who are deaf or hard of hearing may contact that number via the Washington Relay Service at 7‑1‑1.
Title VI Notice to the PublicIt is Washington State Department of Transportation (WSDOT) policy to ensure no person shall, on the grounds of race, color, national origin, or sex, as provided by Title VI of the Civil Rights Act of 1964, be excluded from participation in, be denied the benefits of, or be otherwise discriminated against under any of its federally funded programs and activities. Any person who believes his/her Title VI protection has been violated may file a complaint with WSDOT’s Office of Equal Opportunity (OEO). For Title VI complaint forms and advice, please contact OEO’s Title VI Coordinator at 360‑705‑7082 or 509‑324‑6018.
This report is available in electronic format only. It can be downloaded and printed from the WSDOT Public Transportation Divisions website at www.wsdot.wa.gov/transit.
For more information, contact:
Ron Gross, Transit Data Specialist [email protected] 360‑705‑7887
Washington State Department of Transportation Public Transportation Division PO Box 47387 Olympia, WA 98504‑7387

Summary of Public Transportation – 2010 Page iii November 2011
ContentsPage
Introduction . . . . . . . . . . . . . . . . . . . . . . . . . . . . . . . . . . . . . . . . . . . . . . . . . . . . . . . . . . . . . . 1
Statewide Operations Overview . . . . . . . . . . . . . . . . . . . . . . . . . . . . . . . . . . . . . . . . . . . . . . 7
Transit Systems Serving Urban Areas . . . . . . . . . . . . . . . . . . . . . . . . . . . . . . . . . . . . . . . 19C‑TRAN . . . . . . . . . . . . . . . . . . . . . . . . . . . . . . . . . . . . . . . . . . . . . . . . . . . . . . . . . . . . . . . . . . . . . 21Community Transit . . . . . . . . . . . . . . . . . . . . . . . . . . . . . . . . . . . . . . . . . . . . . . . . . . . . . . . . . . . . . 25Everett Transit . . . . . . . . . . . . . . . . . . . . . . . . . . . . . . . . . . . . . . . . . . . . . . . . . . . . . . . . . . . . . . . . . 29King County Metro . . . . . . . . . . . . . . . . . . . . . . . . . . . . . . . . . . . . . . . . . . . . . . . . . . . . . . . . . . . . . 33Pierce Transit . . . . . . . . . . . . . . . . . . . . . . . . . . . . . . . . . . . . . . . . . . . . . . . . . . . . . . . . . . . . . . . . . 37Sound Transit . . . . . . . . . . . . . . . . . . . . . . . . . . . . . . . . . . . . . . . . . . . . . . . . . . . . . . . . . . . . . . . . . 41Spokane Transit Authority . . . . . . . . . . . . . . . . . . . . . . . . . . . . . . . . . . . . . . . . . . . . . . . . . . . . . . . 45
Transit Systems Serving Small Urban Areas . . . . . . . . . . . . . . . . . . . . . . . . . . . . . . . . . . 49Asotin County Transit . . . . . . . . . . . . . . . . . . . . . . . . . . . . . . . . . . . . . . . . . . . . . . . . . . . . . . . . . . . 51Ben Franklin Transit . . . . . . . . . . . . . . . . . . . . . . . . . . . . . . . . . . . . . . . . . . . . . . . . . . . . . . . . . . . . 55Cowlitz Transit Authority (dba CUBS). . . . . . . . . . . . . . . . . . . . . . . . . . . . . . . . . . . . . . . . . . . . . . 59Intercity Transit . . . . . . . . . . . . . . . . . . . . . . . . . . . . . . . . . . . . . . . . . . . . . . . . . . . . . . . . . . . . . . . . 63Kitsap Transit . . . . . . . . . . . . . . . . . . . . . . . . . . . . . . . . . . . . . . . . . . . . . . . . . . . . . . . . . . . . . . . . . 67Link Transit . . . . . . . . . . . . . . . . . . . . . . . . . . . . . . . . . . . . . . . . . . . . . . . . . . . . . . . . . . . . . . . . . . . 71City of Selah Transportation Service . . . . . . . . . . . . . . . . . . . . . . . . . . . . . . . . . . . . . . . . . . . . . . . 75Skagit Transit . . . . . . . . . . . . . . . . . . . . . . . . . . . . . . . . . . . . . . . . . . . . . . . . . . . . . . . . . . . . . . . . . 79Union Gap Transit . . . . . . . . . . . . . . . . . . . . . . . . . . . . . . . . . . . . . . . . . . . . . . . . . . . . . . . . . . . . . . 83Whatcom Transportation Authority . . . . . . . . . . . . . . . . . . . . . . . . . . . . . . . . . . . . . . . . . . . . . . . . 85Yakima Transit . . . . . . . . . . . . . . . . . . . . . . . . . . . . . . . . . . . . . . . . . . . . . . . . . . . . . . . . . . . . . . . . 89
Transit Systems Serving Rural Areas . . . . . . . . . . . . . . . . . . . . . . . . . . . . . . . . . . . . . . . . 93Clallam Transit System . . . . . . . . . . . . . . . . . . . . . . . . . . . . . . . . . . . . . . . . . . . . . . . . . . . . . . . . . . 95Columbia County Public Transportation . . . . . . . . . . . . . . . . . . . . . . . . . . . . . . . . . . . . . . . . . . . . 99Garfield County Public Transportation . . . . . . . . . . . . . . . . . . . . . . . . . . . . . . . . . . . . . . . . . . . . . 103Grant Transit Authority . . . . . . . . . . . . . . . . . . . . . . . . . . . . . . . . . . . . . . . . . . . . . . . . . . . . . . . . 105Grays Harbor Transportation Authority . . . . . . . . . . . . . . . . . . . . . . . . . . . . . . . . . . . . . . . . . . . . 109Island Transit . . . . . . . . . . . . . . . . . . . . . . . . . . . . . . . . . . . . . . . . . . . . . . . . . . . . . . . . . . . . . . . . . 113Jefferson Transit Authority . . . . . . . . . . . . . . . . . . . . . . . . . . . . . . . . . . . . . . . . . . . . . . . . . . . . . . 117Mason County Transportation Authority . . . . . . . . . . . . . . . . . . . . . . . . . . . . . . . . . . . . . . . . . . . 121Pacific Transit System . . . . . . . . . . . . . . . . . . . . . . . . . . . . . . . . . . . . . . . . . . . . . . . . . . . . . . . . . . 125Pullman Transit . . . . . . . . . . . . . . . . . . . . . . . . . . . . . . . . . . . . . . . . . . . . . . . . . . . . . . . . . . . . . . 129Twin Transit . . . . . . . . . . . . . . . . . . . . . . . . . . . . . . . . . . . . . . . . . . . . . . . . . . . . . . . . . . . . . . . . . 133Valley Transit . . . . . . . . . . . . . . . . . . . . . . . . . . . . . . . . . . . . . . . . . . . . . . . . . . . . . . . . . . . . . . . . 137

Contents
Page iv Summary of Public Transportation – 2010 November 2011
Page
Community Transportation Providers . . . . . . . . . . . . . . . . . . . . . . . . . . . . . . . . . . . . . . . 141HopeSource Transportation . . . . . . . . . . . . . . . . . . . . . . . . . . . . . . . . . . . . . . . . . . . . . . . . . . . . . 147Klickitat County Senior Services . . . . . . . . . . . . . . . . . . . . . . . . . . . . . . . . . . . . . . . . . . . . . . . . . 149L.E.W.I.S. Mountain Highway Transit . . . . . . . . . . . . . . . . . . . . . . . . . . . . . . . . . . . . . . . . . . . . . 151Lower Columbia Community Action Council . . . . . . . . . . . . . . . . . . . . . . . . . . . . . . . . . . . . . . . 153Makah Public Transit . . . . . . . . . . . . . . . . . . . . . . . . . . . . . . . . . . . . . . . . . . . . . . . . . . . . . . . . . . 155Okanogan County Transportation and Nutrition . . . . . . . . . . . . . . . . . . . . . . . . . . . . . . . . . . . . . . 157People For People – Moses Lake . . . . . . . . . . . . . . . . . . . . . . . . . . . . . . . . . . . . . . . . . . . . . . . . . 159People For People – Yakima . . . . . . . . . . . . . . . . . . . . . . . . . . . . . . . . . . . . . . . . . . . . . . . . . . . . . 161Rural Resources Community Action . . . . . . . . . . . . . . . . . . . . . . . . . . . . . . . . . . . . . . . . . . . . . . 163Skamania County Senior Services . . . . . . . . . . . . . . . . . . . . . . . . . . . . . . . . . . . . . . . . . . . . . . . . 165Special Mobility Services, Inc. . . . . . . . . . . . . . . . . . . . . . . . . . . . . . . . . . . . . . . . . . . . . . . . . . . . 167Spokane Indian Tribe . . . . . . . . . . . . . . . . . . . . . . . . . . . . . . . . . . . . . . . . . . . . . . . . . . . . . . . . . . 171Squaxin Island Tribe . . . . . . . . . . . . . . . . . . . . . . . . . . . . . . . . . . . . . . . . . . . . . . . . . . . . . . . . . . . 173Thurston Regional Planning Council . . . . . . . . . . . . . . . . . . . . . . . . . . . . . . . . . . . . . . . . . . . . . . 175
Medicaid Transportation Brokers . . . . . . . . . . . . . . . . . . . . . . . . . . . . . . . . . . . . . . . . . . 177COAST . . . . . . . . . . . . . . . . . . . . . . . . . . . . . . . . . . . . . . . . . . . . . . . . . . . . . . . . . . . . . . . . . . . . . 181Hopelink . . . . . . . . . . . . . . . . . . . . . . . . . . . . . . . . . . . . . . . . . . . . . . . . . . . . . . . . . . . . . . . . . . . . 183Human Services Council . . . . . . . . . . . . . . . . . . . . . . . . . . . . . . . . . . . . . . . . . . . . . . . . . . . . . . . . 185Northwest Regional Council . . . . . . . . . . . . . . . . . . . . . . . . . . . . . . . . . . . . . . . . . . . . . . . . . . . . . 187Paratransit Services . . . . . . . . . . . . . . . . . . . . . . . . . . . . . . . . . . . . . . . . . . . . . . . . . . . . . . . . . . . . 189People For People . . . . . . . . . . . . . . . . . . . . . . . . . . . . . . . . . . . . . . . . . . . . . . . . . . . . . . . . . . . . . 195Special Mobility Services, Inc. . . . . . . . . . . . . . . . . . . . . . . . . . . . . . . . . . . . . . . . . . . . . . . . . . . . 197Trancare . . . . . . . . . . . . . . . . . . . . . . . . . . . . . . . . . . . . . . . . . . . . . . . . . . . . . . . . . . . . . . . . . . . . 201
Travel Washington – Rural Intercity Bus Program . . . . . . . . . . . . . . . . . . . . . . . . . . . . . 203Apple Line . . . . . . . . . . . . . . . . . . . . . . . . . . . . . . . . . . . . . . . . . . . . . . . . . . . . . . . . . . . . . . . . . . 205Dungeness Line . . . . . . . . . . . . . . . . . . . . . . . . . . . . . . . . . . . . . . . . . . . . . . . . . . . . . . . . . . . . . . . 207Grape Line . . . . . . . . . . . . . . . . . . . . . . . . . . . . . . . . . . . . . . . . . . . . . . . . . . . . . . . . . . . . . . . . . . 209Gold Line . . . . . . . . . . . . . . . . . . . . . . . . . . . . . . . . . . . . . . . . . . . . . . . . . . . . . . . . . . . . . . . . . . . 211
Ferry Systems in Washington State . . . . . . . . . . . . . . . . . . . . . . . . . . . . . . . . . . . . . . . . 213King County Ferry District . . . . . . . . . . . . . . . . . . . . . . . . . . . . . . . . . . . . . . . . . . . . . . . . . . . . . . 217Kitsap Transit Foot Ferry . . . . . . . . . . . . . . . . . . . . . . . . . . . . . . . . . . . . . . . . . . . . . . . . . . . . . . . 221Lummi Island Ferry . . . . . . . . . . . . . . . . . . . . . . . . . . . . . . . . . . . . . . . . . . . . . . . . . . . . . . . . . . . 223Pierce County Ferry System . . . . . . . . . . . . . . . . . . . . . . . . . . . . . . . . . . . . . . . . . . . . . . . . . . . . . 225Washington State Ferries . . . . . . . . . . . . . . . . . . . . . . . . . . . . . . . . . . . . . . . . . . . . . . . . . . . . . . . 229
Seattle Center Monorail . . . . . . . . . . . . . . . . . . . . . . . . . . . . . . . . . . . . . . . . . . . . . . . . . . 233
Summary of Statewide Statistics . . . . . . . . . . . . . . . . . . . . . . . . . . . . . . . . . . . . . . . . . . . 235
Appendix 1 Glossary . . . . . . . . . . . . . . . . . . . . . . . . . . . . . . . . . . . . . . . . . . . . . . . . . . . 247
Appendix 2 Public Transportation Grant Awards . . . . . . . . . . . . . . . . . . . . . . . . . . . . 255
Appendix 3 Summary of Public Transportation Notes . . . . . . . . . . . . . . . . . . . . . . . . 265

Summary of Public Transportation – 2010 Page 1 November 2011
Introduction
Since 1978, the Washington State Department of Transportation (WSDOT) has prepared an annual report that summarizes the status of public transportation in Washington State. This report provides data to public transportation providers, Legislative Transportation committees, and local and regional governments.1
There are currently 31 local public transit authorities in Washington State—20 of which are Public Transportation Benefit Areas (PTBA), five City Authorities, three County Authorities, two Unincorporated Transportation Benefit Area (UTBA), and one Regional District Authority. A map showing the location and service areas of these systems is provided at the end of this introduction. It is important to note that Whitman County UTBA did not provide any measureable transportation services for the 2010 calendar year and does not have any operating or financial data to include in this report.
This report also includes sections on Community and Tribal transportation providers, Medicaid Brokerage service providers, the Rural Intercity Bus network, Ferries in Washington State, and the Seattle monorail.
Organization of the SummaryThis year’s summary is organized into ten main sections and includes three appendices, with the bulk of the report devoted to profiles of each transit system’s operating characteristics and services for 2010.
The Transit System profiles are sectioned according to the size of the system and are organized alphabetically. For the purposes of this summary, transit systems are referred to as “Urban” (serving a population greater than 200,000), “Small Urban” (serving a population between 50,000 and 200,000) and “Rural” (serving populations less than 50,000). Urbanzied Areas (UZAs) are defined by the U.S. Census Bureau and include one or more incoprorated cities (villages or towns) central city (or more than one) and are based on population and population density. UZAs do not conform to political boundaries such as a congressional or legislative districts. Current UZA definitions are based on the census figures for April 1, 2000, and took effect October 1, 2002. As a result of the 2010 U.S. Census, the current UZA definitions may change before the publishing of the next Summary of Public Transportation.
The Community and Tribal, Medicaid brokers, and Intercity Bus sections are organized alphabetically. Sections on ferry operations in Washington State and the Seattle Center Monorail are also included and precede the appendices.
Statewide Operations OverviewThis section provides statewide totals on revenue, expenditures, level of service, and performance measures for public transportation systems in Washington State.
1The annual Summary of Public Transportation is required by RCW 35.58.2796. House Bill 1967 was signed into law on May 16, 2011 amending RCW 35.58.2795 and 35.58.2796 as well as adding a new section to Chapter 43.19 RCW.

Introduction
Page 2 Summary of Public Transportation – 2010 November 2011
Transit Systems Serving Urban AreasThis section includes the operating and financial data as well as service characteristics for the 2008, 2009, and 2010 calendar years for the seven Urban transit systems:• C‑TRAN• Community Transit• Everett Transit• King County Metro• Pierce Transit• Sound Transit (Puget Sound Regional Transit Authority)• Spokane Transit Authority
Transit Systems Serving Small Urban AreasThis section includes the operating and financial data as well as service characteristics for the 2008, 2009, and 2010 calendar years for the 11 Small Urban transit systems:• Asotin County PTBA• Ben Franklin Transit• Cowlitz Transit Authority (dba CUBS)• Intercity Transit• Kitsap Transit• Link Transit• City of Selah Transportation Service• Skagit Transit• Union Gap Transit• Whatcom Transportation Authority• Yakima Transit
Transit Systems Serving Rural AreasThis section includes the operating and financial data as well as service characteristics for the 2008, 2009, and 2010 calendar years for the 12 Rural transit systems:• Clallam Transit System• Columbia County Public Transportation• Garfield County Public Transportation• Grant Transit Authority• Grays Harbor Transportation Authority• Island Transit• Jefferson Transit Authority• Mason County Transportation Authority• Pacific Transit• Pullman Transit• Twin Transit• Valley Transit

Introduction
Summary of Public Transportation – 2010 Page 3 November 2011
Community Transportation ProvidersThis section describes the available features and operating characteristics for the community transportation providers that received Federal Transit Administration (FTA) §5311 funding through WSDOT grants process during the 2010 calendar year.
The following is a list of the Community Transportation Providers included in this report.• HopeSource• Klickitat County Senior Services• L.E.W.I.S. Mountain Highway Transit• Lower Columbia Community Action Council• Makah Public Transit (Makah Tribal Council)• Okanogan County Transportation and Nutrition• People For People – Moses Lake• People For People – Yakima• Rural Resources Community Action• Skamania County Senior Services• Special Mobility Services, Inc.• Spokane Tribe of Indians• Squaxin Island Tribe• Thurston Regional Planning Council
Medicaid BrokersThis section describes the available features and operating characteristics for Medicaid brokerage services provided in Washington State. Information for the Medicaid transportation brokers was provided by the Washington State Health Care Authority.
The following is a list of the Medicaid Brokers that provided transportation brokerage services during the 2010 calendar year.• COAST• Hopelink• Human Services Council• Northwest Regional Council• Paratransit Services• People For People• Special Mobility Services, Inc.• Trancare

Introduction
Page 4 Summary of Public Transportation – 2010 November 2011
Travel Washington – Rural Intercity Bus ProgramThis section describes the available features and characteristics for the Rural Intercity Bus Program in Washington State. The data elements are directly from the data that the Intercity Bus providers submitted to WSDOT as part of their FTA required National Transit Database (NTD) reporting for the 2010 calendar year.
The following is a list of the Intercity Bus Providers that received FTA §5311 Funding through WSDOT.• Apple Line (Northwestern Trailways)• Dungeness Line (Olympic Bus Lines)• Grape Line (Central Washington Airporter)• Gold Line (Central Washington Airporter)
Ferry Systems in Washington StateThis section describes the available features and characteristics for Ferry Systems in Washington State, including the Washington State Ferries, which operates 22 ferry vessels, as well as data and information from 4 additional ferry systems
The following is a list of the Ferry Systems in Washington State that are included in this report.• King County Ferry District• Kitsap Transit Foot Ferry• Lummi Island Ferry • Pierce County Ferry System• Washington State Ferries
Seattle Center MonorailThis section describes the available features and characteristics for the Seattle Monorail.
Summary of Statewide StatisticsThis section includes operational and financial information for the 30 transit systems operating in Washington State.
AppendicesThe appendices include a glossary of terms related to public transportation, information about the Public Transportation Grants Competitive Awards and notes on the data collection for the 2010 Summary of Public Transportation.• Appendix 1 – Glossary• Appendix 2 – Public Transportation Consolidated Grants 2009–2011• Appendix 3 – Summary of Public Transportation Notes

Introduction
Summary of Public Transportation – 2010 Page 5 November 2011
8
2631
27
2221
3
17
10
5
11
15
14
29
4
9
1
192
24
18
23
30
16
13
20
28
25
7
12 6
1 A
sotin
Cou
nty
PTB
A 2
Ben
Fra
nklin
Tra
nsit
3 C
lalla
m T
rans
it S
yste
m 4
Col
umbi
a C
ount
y P
ublic
Tra
nspo
rtatio
n 5
Com
mun
ity T
rans
it 6
Cow
lits
Tran
sit A
utho
rity
(CU
BS
) 7
C-T
RA
N 8
Eve
rett
Tran
sit
9 G
arfie
ld C
ount
y P
ublic
Tra
nspo
rtatio
n10
Gra
nt T
rans
it A
utho
rity
11 G
rays
Har
bor T
rans
porta
tion
Aut
horit
y12
Int
erci
ty T
rans
it13
Isl
and
Tran
sit
14 J
effe
rson
Tra
nsit
Aut
horit
y15
Kin
g C
ount
y M
etro
16 K
itsap
Tra
nsit
17 L
ink
Tran
sit
18 M
ason
Cou
nty
Tran
spor
tatio
n A
utho
rity
19 P
acifi
c Tr
ansi
t20
Pie
rce
Tran
sit
21 P
ullm
an T
rans
it22
City
of S
elah
Tra
nspo
rtatio
n S
ervi
ce23
Ska
git T
rans
it24
Sou
nd T
rans
it25
Spo
kane
Tra
nsit
Aut
horit
y26
Tw
in T
rans
it27
Uni
on G
ap T
rans
it28
Val
ley
Tran
sit
29 W
hitm
an C
ount
y U
TBA
30 W
hatc
om T
rans
porta
tion
Aut
horit
y31
Yak
ima
Tran
sit
Tran
sit C
lass
ifica
tion
Reg
iona
l Dis
trict
Smal
l Urb
anU
rban
Rur
al
"
City
Boun
darie
s es
tabl
ishe
d by
the
Was
hing
ton
Stat
e D
epar
tmen
t of R
even
ue a
re n
ot n
eces
saril
y co
nsis
tent
with
tran
sit s
ervi
ce a
reas
.
Was
hing
ton
Stat
e's
Publ
ic T
rans
it A
utho
ritie
s

Introduction
Page 6 Summary of Public Transportation – 2010 November 2011

Summary of Public Transportation – 2010 Page 7 November 2011
Statewide Operations Overview
Results of Efforts to Increase Public Transportation Tax RatesIncreasing local tax rates to fund public transportation is a sensitive political issue. The process of winning consensus among voters involves a lot of public outreach to communicate the benefits of public transportation. Depending on the local political climate at the time, voters within the boundaries of the transportation benefit district approve or disapprove the increase of taxes to fund public transportation.
Between January of 2007 and the end of November 2011, ten transit systems have had increases to their sales and use taxes authorized by a local majority vote. The Cities of Selah and Union Gap, Cowlitz County, Island County, King County, Skagit County, the Walla Walla County PTBA, and the Sound Transit Regional Transit Authority had changes that went into effect prior to the end of the 2010 calendar year. Jefferson and Thurston counties measures didn’t take effect until calendar year 2011.
Efforts to Create or Expand Transit DistrictsThe Washington State Department of Transportation Public Transportation Division has been providing technical assistance to several Eastern Washington communities regarding the establishment and/or expansion of public transportation districts. These include Kittitas (Ellensburg), Okanogan, Ferry, Lincoln, Pend Oreille, and Stevens counties. Although these communities had several public meetings, no elections were held. Whitman County was successful in October of 2009 in creating an Unincorporated Transportation Benefit Area.

Statewide Operations Overview
Page 8 Summary of Public Transportation – 2010 November 2011
Local Sales and Use Tax Authorized for Public Transportation in 2010
Transit System Authority
Sales Tax 2010 Service Area
PopulationRate Last Increase1 Asotin County PTBA PTBA 0.2% 4/1/2005 21,700 2 Ben Franklin Transit PTBA 0.6% 7/1/2002 222,392 3 C-TRAN PTBA 0.5% 1/1/2006 366,951 4 Clallam Transit System PTBA 0.6% 1/1/2001 70,100 5 Columbia County Public Transportation CTA 0.4% 4/1/2006 4,150 6 Community Transit PTBA 0.9% 1/1/2001 516,099 7 Cowlitz Transit Authority (CUBS) PTBA 0.3% 4/1/2009 47,880 8 Everett Transit City 0.6% 1/1/2005 103,019 9 Garfield County Public Transportation UTBA 0.0% N/A 775
10 Grant Transit Authority PTBA 0.2% 1996 87,700 11 Grays Harbor Transportation Authority CTA 0.6% 2000 72,797 12 Intercity Transit PTBA 0.8% 1/1/2011 156,070 13 Island Transit PTBA 0.9% 1/1/2010 81,100 14 Jefferson Transit Authority PTBA 0.9% 7/1/2011 29,300 15 King County Metro County 0.9% 4/1/2007 1,931,249 16 Kitsap Transit PTBA 0.8% 10/1/2001 248,300 17 Link Transit PTBA 0.4% 1990 106,154 18 Mason County Transportation Authority PTBA 0.6% 1/1/2001 57,100 19 Pacific Transit PTBA 0.3% 1979 22,100 20 Pierce Transit PTBA 0.6% 7/1/2002 758,510 21 Pullman Transit City 0.0% N/A 29,799 22 City of Selah Transportation Service City 0.3% 7/1/2007 7,147 23 Skagit Transit PTBA 0.4% 4/1/2009 104,293 24 Sound Transit Regional 0.9% 4/1/2009 2,734,764 25 Spokane Transit Authority PTBA 0.6% 1/1/2005 398,461 26 Twin Transit PTBA 0.2% 4/1/2005 22,755 27 Union Gap Transit City 0.2% 4/1/2008 6,047 28 Valley Transit PTBA 0.6% 7/1/2010 50,054 29 Whatcom Transportation Authority PTBA 0.6% 2002 195,272 30 Whitman County UTBA UTBA 0.0% N/A 14,977 31 Yakima Transit City 0.3% 1980 91,196
Totals 5,808,470

Statewide Operations Overview
Summary of Public Transportation – 2010 Page 9 November 2011
2010 Federal Transit Funding
Area Funding Source PurposePortland OR/WA $37,084,609 Section 5307 Urbanized Area ApportionmentsSeattle, WA $96,013,644 Section 5307 Urbanized Area ApportionmentsSpokane WA/ID $7,987,591 Section 5307 Urbanized Area ApportionmentsBellingham $1,856,360 Section 5307 Small Urbanized Area ApportionmentsBremerton $2,760,790 Section 5307 Small Urbanized Area ApportionmentsKennewick-Richland $2,915,306 Section 5307 Small Urbanized Area ApportionmentsLewiston, ID-WA $239,645 Section 5307 Small Urbanized Area ApportionmentsLongview, WA-OR $849,969 Section 5307 Small Urbanized Area ApportionmentsMarysville, WA $1,697,442 Section 5307 Small Urbanized Area ApportionmentsMount Vernon $937,584 Section 5307 Small Urbanized Area ApportionmentsOlympia-Lacey $2,670,612 Section 5307 Small Urbanized Area ApportionmentsWenatchee $1,377,586 Section 5307 Small Urbanized Area ApportionmentsYakima $1,923,409 Section 5307 Small Urbanized Area ApportionmentsSeattle, WA $1,232,509 Section 5316 Urbanized Area ApportionmentsSpokane WA/ID $229,015 Section 5316 Urbanized Area ApportionmentsPortland OR/WA $835,399 Section 5316 Urbanized Area ApportionmentsStatewide $1,563,376 Section 5316 Small and Nonurbanized Area ApportionmentsSeattle, WA $878,690 Section 5317 Urbanized Area ApportionmentsSpokane WA/ID $124,824 Section 5317 Urbanized Area ApportionmentsPortland OR/WA $515,782 Section 5317 Urbanized Area ApportionmentsStatewide $961,000 Section 5317 Small and Nonurbanized Area ApportionmentsSeattle, WA $5,415,058 Section 5309 (FG) Fixed GuidewayMount Vernon $400,000 Section 5309 (B) Chuckanut Park and Ride LotVancouver $1,850,600 Section 5309 (B) C-Tran Bus ReplacementOlympia-Lacey $1,735,200 Section 5309 (B) Intercity Transit Bus ReplacementWenatchee $2,496,700 Section 5309 (B) Link Transit Bus PurchaseSouth Bend $250,000 Section 5309 (B) Pacific Transit Bus ReplacementTacoma $1,272,700 Section 5309 (B) Pierce Transit Bus PurchasePort Angeles $550,000 Section 5309 (B) Gateway International Multimodal CenterSpokane WA/ID $1,266,200 Section 5309 (B) Spokane Transit Bus PurchaseTacoma $974,000 Section 5309 (B) Tacoma Intermodal Transit CenterSeattle, WA $600,000 Section 5309 (B) West Seattle RapidRide Bus ProgramBellingham $974,000 Section 5309 (B) Whatcom Transit Authority Bus ReplacementKing County $9,368,193 Section 5309 (NS) Bellevue-Redmond BRTSeattle, WA $3,144,294 Section 5309 (NS) Central Link Initial SegmentKing County $6,815 Section 5309 (NS) Pacific Highway South BRTSeattle, WA $110,000,000 Section 5309 (NS) Sound Transit - University Link LRT ExtensionAnnual Total $304,958,902

Statewide Operations Overview
Page 10 Summary of Public Transportation – 2010 November 2011
Local FundingAll local taxes for public transit for 2010 totaled $1,317,503,018, accounting for 74.4 percent of the operating revenues for public transit systems. This figure includes: local sales tax revenues, utility tax revenues as well as MVET (Sound Transit). King County Metro represented 30.0 percent of the local taxes collected for public transit in 2010, while Sound Transit’s local taxes represent 43.4 percent of the statewide local tax.
Farebox RevenueStatewide farebox revenues increased 10.2 percent from $202,284,555 in 2009 to $222,923,395 in 2010. In 2010 farebox receipts accounted for 12.6 percent of the operating revenues for public transit systems.
The transit agencies that showed the largest increases in farebox revenues were:
• Urban – Sound Transit 29.4 percent
• Small Urban – CUBS 87.80 percent
• Rural – Valley 44.56 percent
The Transits that showed the largest decreases in farebox revenues were:
• Urban – Pierce Transit ‑9.17 percent
• Small Urban – Yakima ‑13.05 percent
• Rural – Mason ‑44.51 percent
Farebox Revenue by Service Mode, 2005-2010 2005 2006 2007 2008 2009 2010 % Change
Fixed Route $111,447,661 $116,974,694 $128,970,330 $172,788,283 $187,465,492 $201,842,038 7.67Route Deviated $503,502 $469,884 $485,567 $440,053 $712,432 $565,257 -20.66Demand Response $2,528,786 $2,629,175 $3,288,112 $3,639,017 $3,625,137 $3,484,162 -3.89Commuter Rail $2,684,000 $5,108,179 $6,731,888 $8,196,172 $7,766,691 $7,134,458 -8.14Light Rail $211,571 $1,930 $0 $275,185 $2,714,803 $9,897,480 264.57Total $117,375,520 $125,183,862 $139,475,897 $185,338,711 $202,284,555 $222,923,395 10.20
Vanpool RevenuesStatewide vanpool revenues decreased 4.96 percent from $22,209,338 in 2009 to $21,107,839 in 2010.
In 2010 statewide vanpool revenue accounted for 1.2 percent of the total operating revenues for public transit systems.
Vanpool Revenues, 2005-2010 2005 2006 2007 2008 2009 2010 % Change
Vanpool $11,789,034 $14,035,661 $15,274,455 $18,357,376 $22,209,338 $21,107,839 -4.96

Statewide Operations Overview
Summary of Public Transportation – 2010 Page 11 November 2011
Operating and Capital Investment by SourceThe 2010 statewide operating investment levels were:
Total Local Investment: $1,620,749,914 (up 1.4% from 2009)
Total State Investment: $ 16,944,581 (down 6.7% from 2009)
Total Federal Investment: $ 139,691,357 (up 1.7% from 2009)
Total Operating Investment: $1,777,385,852 (up 1.3% from 2009)
The 2010 capital investment levels were:
Total Local Investment: $29,280,767 (down 75.5 % from 2009)
Total State Investment: $19,661.789 (down 39.2 % from 2009)
Total Federal Investment: $225,220,665 (up 2.9% from 2009)
Total Capital Investment: $274,163,221 (down 26.0% from 2009)
Total Funds by Source, 2005-2010 2005 2006 2007 2008 2009 2010 % of Total
OperatingTotal Local Investment $1,166,770,045 $1,282,661,295 $1,417,871,997 $1,366,000,804 $1,598,880,201 $1,620,749,914 91.19Total State Investment $12,214,179 $16,175,376 $15,842,481 $18,801,886 $18,166,610 $16,944,581 0.95Total Federal Investment $43,252,678 $100,324,621 $79,572,107 $103,100,349 $137,376,432 $139,691,357 7.86
Total $1,222,236,902 $1,399,161,292 $1,513,286,584 $1,487,903,039 $1,754,423,243 $1,777,385,852 100.00CapitalTotal Local Investment $390,788,964 $597,968,664 $852,154,587 $99,666,769 $119,295,027 $29,280,767 10.68Total State Investment $5,188,491 $10,845,920 $12,231,185 $23,440,696 $32,332,676 $19,661,789 7.17Total Federal Investment $257,919,203 $161,475,695 $157,697,174 $224,894,612 $218,899,094 $225,220,665 82.15
Total $653,896,658 $770,290,279 $1,022,082,946 $348,002,077 $370,526,797 $274,163,221 100.00
Total Local Investment
91%
Total State Investment
1%
Total Federal Investment
8%
Total Operating Funds by Source, 2010
Total = $1,777,385,852

Statewide Operations Overview
Page 12 Summary of Public Transportation – 2010 November 2011
Total Local Investment
11%
Total State Investment
7%
Total Federal Investment
82%
Total Capital Funds by Source, 2010
Total = $274,163,221
The following table shows the changes in the specific modal operating expenses for public transportation in 2010 compared to 2009.
Operating Expense by Service Mode, 2005-2010 2005 2006 2007 2008 2009 2010 % Change
Fixed Route $651,239,152 $692,839,806 $743,628,805 $780,457,591 $779,457,917 $788,358,227 1.14Route Deviated $8,726,891 $10,222,565 $12,490,440 $9,355,135 $10,052,077 $13,037,325 29.70Demand Response $123,902,612 $133,204,245 $142,385,614 $158,227,188 $153,512,114 $158,514,304 3.26Vanpool $16,939,091 $18,120,073 $21,269,209 $27,039,048 $25,866,966 $25,825,329 -0.16Commuter Rail $22,198,000 $22,700,320 $24,851,744 $31,084,795 $34,020,024 $32,459,887 -4.59Light Rail $5,877,123 $3,885,882 $3,376,195 $5,506,292 $23,105,329 $46,744,774 102.31Total $828,882,869 $880,972,891 $948,002,006 $1,011,670,049 $1,026,014,427 $1,064,939,846 3.79
Revenue Vehicle Hours and Revenue Vehicle MilesRevenue Vehicle Hours
Between 2002 and 2009 there has been a general upward trend of increases in revenue vehicle hours across all public transportation services in Washington State. This trend slowed in 2007 with increases over 2006 in all but light rail, which showed decreases in both revenue vehicle hours and miles, and demand response which also showed a decrease in revenue vehicle hours.
In 2010, the most significant changes occurred in Light Rail, which showed a 95 percent increase over 2009, followed by Route Deviated with an increase of over 24 percent. Commuter Rail also showed an increase with nearly 7 percent.
Revenue vehicle hours for Light Rail more than doubled from 2007 to 2008, increased by nearly 400 percent between 2008 and 2009, and increased by over 95 percent in 2010.

Statewide Operations Overview
Summary of Public Transportation – 2010 Page 13 November 2011
Overall, there was a ‑0.87 percent decrease between 2009 and 2010, with Demand Response showing the largest decrease of 3.8 percent, followed by Fixed Route with a decrease of 1.6 percent. In 2010, Fixed Route and Demand Response accounted for 96.1 percent of all revenue vehicle hours.
Revenue Vehicle Hours by Service Mode, 2005-2010 2005 2006 2007 2008 2009 2010 % Change
Fixed Route 5,896,431 5,880,346 6,097,399 6,538,667 6,613,074 6,505,048 -1.63Route Deviated 126,555 132,647 150,092 117,935 117,295 145,722 24.24Demand Response 1,834,347 1,912,686 1,893,897 2,034,134 2,003,165 1,926,249 -3.84Commuter Rail 14,201 16,855 19,329 27,006 36,010 38,518 6.96Light Rail 20,179 10,208 10,034 21,107 81,109 158,433 95.33Total 7,891,713 7,952,742 8,170,751 8,738,849 8,850,653 8,773,970 -0.87
Revenue Vehicle Miles
Between 2002 and 2010 there has been a general upward trend of increases in revenue vehicle miles across all public transportation services in Washington State. Between 2009 and 2010, Fixed Route services showed a decrease in revenue vehicle miles of nearly 1.7 percent, and Vanpool decreased slightly by 0.07 percent. Total revenue vehicle miles showed a 0.7 percent increase between 2009 and 2010.
The most significant increase in revenue vehicle miles occurred in Light Rail with a 116 percent increase between 2009 and 2010. Since 2005, Light Rail has gone from just over 135 thousand, to over 2.7 million revenue vehicle miles.
Revenue Vehicle Miles by Service Mode, 2005-2010 2005 2006 2007 2008 2009 2010 % Change
Fixed Route 83,695,305 80,846,858 83,413,193 90,612,627 91,649,982 90,105,804 -1.68Route Deviated 2,679,101 2,979,111 3,384,521 2,482,781 2,413,943 3,140,271 30.09Demand Response 27,179,876 28,092,439 28,177,783 30,087,429 29,400,985 28,769,457 -2.15Vanpool 25,145,198 27,888,254 30,046,749 34,654,746 35,563,842 35,540,446 -0.07Commuter Rail 533,047 632,664 743,207 1,039,433 1,399,687 1,506,922 7.66Light Rail 135,076 97,422 97,115 150,712 1,262,886 2,736,295 116.67Total 139,367,603 140,536,748 145,862,568 159,027,728 161,691,325 161,799,195 0.07
Residents Within Transit District Boundaries
As of April 1, 2010 Washington State’s Office of Financial Management official resident population for 2010 was 6,724,540. Of the total resident population approximately 5,808,470 residents lived within the boundaries of a transit district in 2010, representing an increase of 1.35 percent over 2009.

Statewide Operations Overview
Page 14 Summary of Public Transportation – 2010 November 2011
Disabled Residents With Disabilities
The Americans with Disabilities Act requires transit agencies to provide paratransit services (demand response) to individuals that cannot take the fixed-route bus because of a functional disability. This requirement for duplicative service is not required when the transit system provides route‑deviated services.
Passenger Trips
For the purpose of this summary a passenger trip is defined as a single unlinked passenger trip (also known as a passenger boarding). It is important to note that in any analysis using passenger trip as a metric that a single trip does not necessarily equate to a single individual’s commute to their destination. For example, a person could transfer from one bus to another or transfer from one mode of transport to another (a passenger ferry to a bus) and in both cases each boarding would be counted as a single passenger trip.
Passenger Trips by Service Mode, 2005-2010 2005 2006 2007 2008 2009 2010 % Change
Fixed Route 159,162,843 164,825,977 176,373,343 203,736,892 194,912,291 187,696,208 -3.70Route Deviated 1,029,901 1,213,550 1,336,912 1,276,488 1,248,003 1,344,303 7.72Demand Response 5,261,413 5,396,842 4,746,662 4,895,658 4,799,152 4,675,676 -2.57Vanpool 5,174,427 5,699,182 6,202,917 7,976,274 8,083,452 7,745,157 -4.19Commuter Rail 1,267,973 1,692,971 2,156,652 2,668,623 2,492,362 2,480,052 -0.49Light Rail 1,259,222 885,397 919,013 1,339,329 3,841,974 8,352,838 117.41Total 173,155,779 179,713,919 191,735,499 221,893,264 215,377,234 212,294,234 -1.43
Between 2005 and 2008, public transportation has reported an increase in total passenger trips. Since 2008, there has been a decline in passenger trips in every mode except Route Deviated and Light Rail.
Between 2009 and 2010, Route Deviated showed an increase in passenger trips of 7.7 percent and Light Rail increased by 117.4 percent.
Performance Measures for Public TransportationRCW 35.58.2796 mandates that public transportation have measurable goals of its performance. The performance measures are as follows:
• Passenger Trips per Revenue Vehicle Hour
• Passenger Trips per Revenue Vehicle Mile
• Operating Costs per Revenue Vehicle Hour
• Operating Costs per Revenue Vehicle Mile
• Operating Costs per Passenger Trip
• Farebox Recovery

Statewide Operations Overview
Summary of Public Transportation – 2010 Page 15 November 2011
The performance measures reflect statewide data that is grouped according to size of communities served by transit agencies; urban, small urban, and rural. Performance measures for this summary report are reported in averages. Since averages are a commonly understood method of communicating complex sets of data, they are used throughout the Summary of Public Transportation.
Passenger Trips per Revenue Vehicle Hour Reflects the number of passengers a transit system transports in an hour of service. Public transportation agencies are able to measure their effectiveness through two similar performance measures, passenger trips per revenue vehicle hour and passenger trips per revenue vehicle mile. Large urban areas will typically have higher values on these performance measures due to several factors: density of urban growth, frequency of bus operation, and size of buses.
Passenger Trips per Revenue Vehicle Hour, 2005-2010 2005 2006 2007 2008 2009 2010 % Change
Fixed Route 27.0 28.0 28.9 31.2 29.5 28.9 -2.10Route Deviated 8.1 9.1 8.9 10.8 10.6 9.2 -13.30Demand Response 2.9 2.8 2.5 2.4 2.4 2.4 1.32Commuter Rail 89.3 100.4 111.6 98.8 69.2 64.4 -6.97Light Rail 62.4 86.7 91.6 63.5 47.4 52.7 11.30
Passenger Trips per Revenue Vehicle MileReflects the average number of passengers that a transit system transports per mile of service. The performance measure, passenger trip per vehicle revenue mile also illustrates a positive correlation between system size and the population within the boundaries of a transit agency. Population, urban density, size of buses, and frequency of buses, all affect passenger trip per revenue vehicle mile data.
Passenger Trips per Revenue Vehicle Mile, 2005-2010 2005 2006 2007 2008 2009 2010 % Change
Fixed Route 1.9 2.0 2.1 2.2 2.1 2.1 -2.05Route Deviated 0.4 0.4 0.4 0.5 0.5 0.4 -17.20Demand Response 0.2 0.2 0.2 0.2 0.2 0.2 -0.43Vanpool 0.2 0.2 0.2 0.2 0.2 0.2 -4.12Commuter Rail 2.4 2.7 2.9 2.6 1.8 1.6 -7.57Light Rail 9.3 9.1 9.5 8.9 3.0 3.1 0.34

Statewide Operations Overview
Page 16 Summary of Public Transportation – 2010 November 2011
Operating Cost per Revenue Vehicle Hour/MileReflects the overall operating costs per number of hours/miles a transit system provides revenue service. Other measures of efficiency for public transportation are the operating costs per revenue vehicle hour and operating costs per revenue vehicle mile. These performance measures account for administrative, fuel and labor, and maintenance costs in the overall operating expenses for a vehicle. The larger the transit service area, the farther the vehicles travel, thereby consuming more fuel and requiring more labor to operate, affecting both revenue and service vehicles.
Operating Costs per Revenue Vehicle Hour, 2005-2010 2005 2006 2007 2008 2009 2010 % Change
Fixed Route $110 $118 $122 $119 $118 $121 2.82Route Deviated $69 $77 $83 $79 $86 $89 4.40Demand Response $68 $70 $75 $78 $77 $82 7.38Commuter Rail $1,563 $1,347 $1,286 $1,151 $945 $843 -10.80Light Rail $291 $381 $336 $261 $285 $295 3.57
Operating Costs per Revenue Vehicle Mile, 2005-2010 2005 2006 2007 2008 2009 2010 % Change
Fixed Route $7.78 $8.57 $8.92 $8.61 $8.50 $8.75 2.88Route Deviated $3.26 $3.43 $3.69 $3.77 $4.16 $4.15 -0.30Demand Response $4.56 $4.74 $5.05 $5.26 $5.22 $5.51 5.53Vanpool $0.67 $0.65 $0.71 $0.78 $0.73 $0.73 -0.10Commuter Rail $41.64 $35.88 $33.44 $29.91 $24.31 $21.54 -11.38Light Rail $43.51 $39.89 $34.76 $36.54 $18.30 $17.08 -6.63
Operating Costs per Passenger TripReflects annual operating costs as a function of the number of passengers a transit system transports—less debt service, capital purchases, or typical transit costs such as rideshare coordination.
Many different variables affect operating costs per passenger trip data. Often, passengers ride due to low fare rates (including those subsidized by employers and schools), superior marketing, or good service between origin and destination. Therefore, a low cost per passenger trip may be more representative of the system’s use, just as a high cost per passenger trip might reflect higher fare rates, ineffective marketing, and/or less frequent service. Other economic factors such as gas prices may also affect ridership as people use their cars more or less depending on gas prices.

Statewide Operations Overview
Summary of Public Transportation – 2010 Page 17 November 2011
Operating Costs per Passenger Trip, 2005-2010 2005 2006 2007 2008 2009 2010 % Change
Fixed Route $4.09 $4.20 $4.22 $3.83 $4.00 $4.20 5.03Route Deviated $8.47 $8.42 $9.34 $7.33 $8.05 $9.70 20.41Demand Response $23.55 $24.68 $30.00 $32.32 $31.99 $33.90 5.99Vanpool $3.27 $3.18 $3.43 $3.39 $3.20 $3.33 4.20Commuter Rail $17.51 $13.41 $11.52 $11.65 $13.65 $13.09 -4.11Light Rail $4.67 $4.39 $3.67 $4.11 $6.01 $5.60 -6.94
Farebox Recovery/Vanpool Revenue RecoveryFarebox recovery is the percent of annual operating costs recovered by passengers paying fares for all transit services, except vanpools.
The largest indicator of farebox recovery is local policy. The lower farebox recovery rates that are typically seen in demand‑response services are due to reduced fare, or fare‑free policies that support ridership among special needs populations; elderly persons, and persons with disabilities. In addition, systems serving larger populations typically result in higher farebox recovery ratios.
Vanpool recovery is unique in that the fees vanpool participants pay is used to cover the costs of operating the vanpool. In some instances, vanpool fees are expected to cover a portion of capital costs. All vanpool revenue recovery policies are established by the transit agency’s board of directors that reflect the specific characteristics of each transit agency. The differences in vanpool recovery may be attributed to how each transit agency defines the operating cost of their vanpool, since there is no standard for allocating operating costs.
For vanpools, the farebox recovery percentage is determined based on local policies.
Farebox Recovery/Vanpool Revenue Recovery, 2005-2010 2005 2006 2007 2008 2009 2010 % Change
Fixed Route 17.1% 16.9% 17.3% 22.1% 24.1% 25.6% 6.45Route Deviated 5.8% 4.6% 3.9% 4.7% 7.1% 4.3% -38.83Demand Response 2.0% 2.0% 2.3% 2.3% 2.4% 2.2% -6.92Vanpool 69.6% 77.5% 71.8% 67.9% 85.9% 81.7% -4.81Commuter Rail 12.1% 22.5% 27.1% 26.4% 22.8% 22.0% -3.73Light Rail 3.6% 0.0% 0.0% 5.0% 11.7% 21.2% 80.20

Statewide Operations Overview
Page 18 Summary of Public Transportation – 2010 November 2011

Summary of Public Transportation – 2010 Page 19 November 2011
Transit Systems Serving Urban Areas
Local public transportation systems serving populations more than 50,000 are considered “urbanized,” as defined by the U.S. Bureau of the Census as of April 1, 2000. The national census figures for April 1, 2000, for urbanized areas took effect October 1, 2002. The results of the 2010 U.S. Census were not published in time for inclusion in this document. Generally, transit systems are referred to as “Urban” (serving a population greater than 200,000), “Small Urban” (serving a population between 50,000 and 200,000) and “Rural” (serving populations less than 50,000).
The seven local Urban public transportation systems and the urbanized areas (UZA) they serve are:
• C‑TRAN (Vancouver portion of Portland, OR‑WA UZA)
• Community Transit (Suburban Snohomish County portion of Seattle, WA UZA and Marysville)
• Everett Transit (Everett portion of Seattle, WA UZA)
• King County Metro Transit (Seattle and King County suburban portions of Seattle, WA UZA)
• Pierce Transit (Tacoma)
• Sound Transit (Seattle, WA UZA and Tacoma)
• Spokane Transit Authority (Spokane, WA‑ID UZA)
For the purpose of this summary, local public transportation systems in these urbanized areas are eligible to receive Federal Transit Administration (FTA) Section 5307 and Section 5309 Bus Discretionary funding appropriated by Congress for eligible projects. In addition, they may receive Section 5309 Fixed Guideway formula funding from the FTA, if they have any fixed guideway systems.

Transit Systems Serving Urban Areas
Page 20 Summary of Public Transportation – 2010 November 2011

Summary of Public Transportation – 2010 Page 21 November 2011
C-TRANJeff HammExecutive Director/CEO2425 NE 65th AvenueVancouver, WA 98661360‑696‑4494www.c‑tran.com
System Snapshot• Service Area: The city of Vancouver and its urban growth boundry; and the city
limits of of Battle Ground, Camas, La Center, Ridgefield, Washougal, and the town of Yacolt.
• Congressional District: 3
• Legislative District: 15, 17, 18, and 49
• Type of Government: PTBA
• Governing Body: Nine member Board of Directors comprised of three Clark County Commissioners, three city of Vancouver Council Members, one City Council Member from either Camas or Washougal, one City Council member from either Battle Ground or Yacolt, and one City Council Member from either Ridgefield or La Center
• Tax Authorized: 0.5 percent total sales and use tax—0.3 percent sales and use tax in November 1980, and an additional 0.2 percent in September 2005.
• Fares: C‑TRAN’s cash fare structure per boarding is as follows:
– Fixed Route (C‑Zone): $1.60 per boarding (Youth, Honored, Medicare Card Holders; $0.80)
– Fixed Route (All‑Zone): $2.45 (Youth, Honored, Medicare Card Holders; $1.20)
– Fixed Route (Express): $3.35
– Paratransit (C‑Zone): $1.60
– Paratransit (All‑Zone): $2.45
• Intermodal Connections: C‑TRAN provides commuter express service from varied points in its Clark County service area directly into downtown Portland, Oregon where riders can access MAX Light Rail, Portland Streetcar and the Aerial Tram to their final destinations. C-TRAN’s Limited express service provides access to MAX Light Rail stations located on the I‑5 and I‑205 corridors. C‑TRAN’s local routes provide service to Washington State University, Clark College, and many of the public elementary, middle and high schools within the service area. Connections with Skamania Transit to the east and the Cowlitz Community Action Program to the north are facilitated by C‑TRAN at C‑TRAN Transit Centers.
• Transit Development Plan: C‑TRAN TDP

C-TRAN
Page 22 Summary of Public Transportation – 2010 November 2011
Annual Operating Information
2008 2009 2010 % ChangeFixed Route Services (Direct Operated)Revenue Vehicle Hours 278,980 275,761 256,428 -7.01 Total Vehicle Hours 303,127 299,155 279,432 -6.59 Revenue Vehicle Miles 4,476,702 4,289,232 3,931,152 -8.35 Total Vehicle Miles 5,125,849 4,970,800 4,618,039 -7.10 Passenger Trips 6,984,933 6,201,190 6,317,040 1.87 Diesel Fuel Consumed (gallons) 1,015,753 977,065 923,216 -5.51 Employees - FTEs 293.3 283.3 253.5 -10.50 Operating Expenses $28,240,702 $28,669,170 $28,235,748 -1.51 Farebox Revenues $6,346,589 $6,670,570 $6,793,511 1.84
Demand Response Services (Direct Operated)Revenue Vehicle Hours 88,258 80,971 80,555 -0.51 Total Vehicle Hours 99,972 92,240 87,973 -4.63 Revenue Vehicle Miles 1,348,396 1,250,801 1,253,477 0.21 Total Vehicle Miles 1,535,597 1,431,883 1,436,388 0.31 Passenger Trips 245,684 215,357 218,104 1.28 Diesel Fuel Consumed (gallons) 193,569 174,834 146,364 -16.28 Gasoline Fuel Consumed (gallons) - - 12,123 -Employees - FTEs 80.2 80.7 80 -0.35 Operating Expenses $8,799,279 $7,797,742 $7,800,955 0.04 Farebox Revenues $266,498 $230,340 $336,942 46.28
Vanpooling Services (Direct Operated)Revenue Vehicle Hours - 2,223 2,395 7.74 Total Vehicle Hours - 2,223 2,395 7.74 Revenue Vehicle Miles - 65,835 78,431 19.13 Total Vehicle Miles - 65,835 78,431 19.13 Passenger Trips - 14,086 17,426 23.71 Gasoline Fuel Consumed (gallons) - 4,300 5,370 24.88 Employees - FTEs - 0.3 0.3 13.33 Operating Expenses $0 $91,525 $94,926 3.72 Vanpool Revenue $0 $37,348 $46,697 25.03

C-TRAN
Summary of Public Transportation – 2010 Page 23 November 2011
Revenues2008 2009 2010 % Change
Operating Related RevenuesSales Tax $24,256,571 $21,179,904 $22,008,102 3.91 Farebox Revenues $6,613,087 $6,900,910 $7,130,453 3.33 Vanpooling Revenue $0 $37,348 $46,697 25.03 Federal Section §5307 Operating $129,750 $394,644 $331,205 -16.07 Federal Section §5307 Preventative $790,098 $5,456,820 $4,668,148 -14.45 FTA JARC (§5316) Program $118,634 $144,296 $172,444 19.51 Other Federal Operating $14,370 $143,259 $64,852 -54.73 State Regional Mobility Operating Grants $0 $327,798 $312,518 -4.66 State Special Needs Grants $236,563 $0 $580,480 -Other State Operating Grants $435,989 $212,370 $229,384 8.01 Other Operating Sub-Total $1,600,166 $566,269 $324,215 -42.75 Other-Interest $1,560,755 $528,076 $388,557 -26.42 Other-Gain (Loss) on Sale of Assets $25,881 $0 -$81,772 -Other-MISC $13,530 $38,193 $17,430 -54.36 Total (Excludes Capital Revenues) $34,195,228 $35,363,618 $35,868,498 1.43
Federal Capital Grant RevenuesFederal Section §5307 Capital Grants $9,515,737 $3,938,909 $3,504,860 -11.02 Federal Section §5309 Capital Grants $225,017 $0 $480,200 -CM/AQ and Other Federal Grants $480,001 $120,230 $2,044,076 1600.14 Total Federal Capital $10,220,755 $4,059,139 $6,029,136 48.53
State Capital Grant RevenuesState Vanpool Grants $198,010 $454,646 $0 -100.00 Other State Capital Funds $426,310 $0 $0 -Total State Capital $624,320 $454,646 $0 -100.00
ExpendituresLocal Capital ExpendituresLocal Funds $785,058 $0 $1,046,835 -Total Local Capital $785,058 $0 $1,046,835 -
Other ExpendituresOther Expenditures $442,186 $673,732 $426,468 -36.70 Depreciation (Not included in Total Expenditures) $4,067,786 $5,122,488 $5,744,744 12.15
Ending Balances, December 31Unrestricted Cash and Investments $18,562,554 $8,689,369 $7,248,407 -16.58 Operating Reserve $0 $8,940,369 $13,266,496 48.39 Working Capital $5,000,000 $10,845,000 $10,307,804 -4.95 Capital Reserve Funds $25,204,516 $17,400,919 $16,003,374 -8.03 Insurance Funds $3,000,000 $3,000,000 $3,786,758 26.23 Total $51,767,070 $48,875,657 $50,612,839 3.55

C-TRAN
Page 24 Summary of Public Transportation – 2010 November 2011
Total Funds by Source2008 2009 2010 % of Total
OperatingTotal Local Investment $32,912,010 $29,358,163 $29,935,935 82.48 Total State Investment $672,552 $540,168 $1,122,382 3.09 Total Federal Investment $1,052,852 $6,139,019 $5,236,649 14.43 Total Operating $34,637,414 $36,037,350 $36,294,966 100.00
CapitalTotal Local Investment $785,058 $0 $1,046,835 14.79 Total State Investment $624,320 $454,646 $0 0.00 Total Federal Investment $10,220,755 $4,059,139 $6,029,136 85.21 Total Capital $11,630,133 $4,513,785 $7,075,971 100.00

Summary of Public Transportation – 2010 Page 25 November 2011
Community Transit
Joyce Eleanor CEO7100 Hardeson RoadEverett, WA 98203-5834425‑348‑7100www.commtrans.org
System Snapshot• Service Area: Suburban and Rural Snohomish County
• Congressional District: 1 and 2
• Legislative District: 1, 10, 21, 32, 38, 39, and 44
• Type of Government: PTBA
• Governing Body: Nine voting members and one non‑voting labor representative. The Board of Directors includes two members of the Snohomish County Council, seven elected officals appointed by their representative jurisdictions. The non-voting Labor Representative is selected by the Transit’s collective bargaining units.
• Tax Authorized: 0.9 percent total sales and use tax—0.3 percent approved in June 1976, an additional 0.3 percent approved in February 1990, and an additional 0.3 percent approved in September 2001.
• Fares: January–May 2010– Local service regular fare; $1.50– Commuter service South County regular fare; $3.50– Commuter service North and East County regular fare; $4.50– Paratransit service regular fare; $1.50– Beginning in June 2010, the regular fare for local service and paratransit
service increased to $1.75.
• Intermodal Connections: Community Transit provides intermodal connections to Everett Transit, Island Transit, King County Metro, Kitsap Transit, Pierce Transit, Sound Transit, Amtrak, Greyhound, and the Washington State Ferries, by serving a variety of transit centers, park and ride facilities, ferry terminals, and regional employment centers in Snohomish and King Counties. Service in Snohomish County includes nearly all the cities, major employment centers, many of the public schools, and two college campuses. Service in King County is limited to the Seattle central business district and University District.
• Transit Development Plan: Currently under revision by the transit system.

Community Transit
Page 26 Summary of Public Transportation – 2010 November 2011
Annual Operating Information
2008 2009 2010 % ChangeFixed Route Services (Direct Operated)Revenue Vehicle Hours 502,690 513,487 444,619 -13.41Total Vehicle Hours 646,317 663,873 522,128 -21.35Revenue Vehicle Miles 8,302,346 8,519,508 7,153,098 -16.04Total Vehicle Miles 12,023,614 12,405,001 9,269,453 -25.28Passenger Trips 10,849,358 10,292,248 7,337,474 -28.71Diesel Fuel Consumed (gallons) 2,505,666 2,610,317 1,912,387 -26.74Employees - FTEs 741.2 765.8 545.7 -28.74Operating Expenses $80,500,274 $82,255,673 $66,725,954 -18.88Farebox Revenues $15,230,331 $15,008,336 $9,741,508 -35.09
Fixed Route Services (Purchased Transportation)Revenue Vehicle Hours - - 54,426 -Total Vehicle Hours - - 116,565 -Revenue Vehicle Miles - - 1,272,040 -Total Vehicle Miles - - 2,587,024 -Passenger Trips - - 1,642,463 -Diesel Fuel Consumed (gallons) - - 599,200 -Employees - FTEs - - 135.5 -Operating Expenses $0 $0 $12,759,772 -Farebox Revenues $0 $0 $6,638,046 -
Demand Response Services (Purchased Transportation)Revenue Vehicle Hours 103,795 103,188 99,012 -4.05Total Vehicle Hours 115,537 115,191 114,350 -0.73Revenue Vehicle Miles 1,733,901 1,824,704 1,778,032 -2.56Total Vehicle Miles 2,151,512 2,241,421 2,194,878 -2.08Passenger Trips 214,568 217,909 217,648 -0.12Diesel Fuel Consumed (gallons) 119437 195,734 220,839 12.83Gasoline Fuel Consumed (gallons) 142333 52,267 2,124 -95.94Employees - FTEs 102.1 109.3 98.8 -9.57Operating Expenses $8,401,128 $8,342,370 $8,522,739 2.16Farebox Revenues $274,305 $229,212 $280,741 22.48

Community Transit
Summary of Public Transportation – 2010 Page 27 November 2011
2008 2009 2010 % ChangeVanpooling Services (Direct Operated)Revenue Vehicle Hours 88,136 84,326 81,716 -3.10Total Vehicle Hours 88,136 84,326 81,716 -3.10Revenue Vehicle Miles 4,810,407 4,782,731 4,664,437 -2.47Total Vehicle Miles 4,810,407 4,782,731 4,664,437 -2.47Passenger Trips 854,850 862,341 843,551 -2.18Gasoline Fuel Consumed (gallons) 289,655 282,882 269,147 -4.86Employees - FTEs 17.0 19.2 19.9 3.65Operating Expenses $3,493,988 $3,676,890 $3,693,738 0.46Vanpool Revenue $2,136,079 $2,581,320 $2,605,099 0.92
RevenuesOperating Related RevenuesSales Tax $69,185,113 $62,185,478 $62,633,947 0.72Farebox Revenues $15,504,636 $15,237,548 $16,660,295 9.34Vanpooling Revenue $2,136,079 $2,581,320 $2,605,099 0.92Federal Section §5307 Operating $0 $6,047,121 $2,739,137 -54.70Federal Section §5307 Preventative $4,678,950 $5,450,672 $3,327,916 -38.94FTA JARC (§5316) Program $108,909 $115,720 $133,408 15.29Other Federal Operating $0 $1,194,562 $2,436,235 103.94State Regional Mobility Operating Grants $0 $233,874 $2,266,126 868.95State Special Needs Grants $686,251 $398,859 $602,648 51.09Other State Operating Grants $56,109 $138,071 $128,847 -6.68Other Operating Sub-Total $5,126,699 $2,796,871 $8,632,259 208.64Other-Advertising $1,139,451 $1,045,638 $670,922 -35.84Other-Interest $3,256,105 $854,800 $259,161 -69.68Other-Gain (Loss) on Sale of Assets $168,099 $149,235 $86,721 -41.89Other-MISC $563,044 $747,198 $7,615,455 919.20Total (Excludes Capital Revenues) $97,482,746 $96,380,096 $102,165,917 6.00
Federal Capital Grant RevenuesFederal Section §5307 Capital Grants $10,069,850 $9,831,461 $10,376,860 5.55Federal Section §5309 Capital Grants $4,953,553 $4,030,519 $237,500 -94.11CM/AQ and Other Federal Grants $561,077 $125,076 $174,747 39.71Total Federal Capital $15,584,480 $13,987,056 $10,789,107 -22.86
State Capital Grant RevenuesState Regional Mobility Grants $2,033,154 $2,090,106 $1,857,070 -11.15State Vanpool Grants $345,900 $456,300 $0 -100.00Other State Capital Funds $57,550 $0 $0 -Total State Capital $2,436,604 $2,546,406 $1,857,070 -27.07

Community Transit
Page 28 Summary of Public Transportation – 2010 November 2011
Expenditures2008 2009 2010 % Change
Local Capital ExpendituresLocal Funds $13,762,090 $18,820,396 $13,890,070 -26.20Total Local Capital $13,762,090 $18,820,396 $13,890,070 -26.20
Other ExpendituresOther Expenditures $2,234,114 $2,812,001 $1,558,249 -44.59Depreciation (Not included in Total Expenditures) $0 $0 $15,650,181 -
Debt ServiceInterest $297,058 $263,308 $190,890 -27.50Principal $1,125,000 $1,160,000 $0 -100.00Total Debt Service $1,422,058 $1,423,308 $190,890 -86.59
Ending Balances, December 31General Fund $8,052,269 $10,581,182 $17,488,765 65.28Capital Reserve Funds $52,281,609 $45,192,367 $35,578,458 -21.27Debt Service Funds $12,273,921 $12,542,042 $11,359,307 -9.43Insurance Funds $3,480,882 $2,552,943 $3,424,116 34.12Total $76,088,681 $70,868,534 $67,850,646 -4.26
Total Funds by Source2008 2009 2010 % of Total
OperatingTotal Local Investment $94,186,641 $85,613,218 $92,089,849 88.78Total State Investment $742,360 $770,804 $2,997,621 2.89Total Federal Investment $4,787,859 $12,808,075 $8,636,696 8.33Total Operating $99,716,860 $99,192,097 $103,724,166 100.00
CapitalTotal Local Investment $13,762,090 $18,820,396 $13,890,070 52.34Total State Investment $2,436,604 $2,546,406 $1,857,070 7.00Total Federal Investment $15,584,480 $13,987,056 $10,789,107 40.66Total Capital $31,783,174 $35,353,858 $26,536,247 100.00

Summary of Public Transportation – 2010 Page 29 November 2011
Everett Transit
Tom HingsonTransportation and Transit Services Director3225 Cedar StreetEverett, WA 98201-4515425‑257‑8939www.everettwa.org
System Snapshot• Service Area: City of Everett
• Congressional District: 1 and 2
• Legislative District: 21, 38, and 44
• Type of Government: City
• Governing Body: City Council
• Tax Authorized: .06 percent retail sales tax—0.3 percent approved in September 1978 and an additional 0.3 percent approved in September 2004.
• Fares: For fixed route – $0.75 full fare; $0.50 youth fare; free for seniors and people with disabilities; for paratransit – $1.00.
• Intermodal Connections: Everett Transit service connects with Washington State Ferries, Community Transit, and Sound Transit at the Mukilteo Ferry Terminal. Connections with Greyhound, Amtrak, Sound Transit, Community Transit, Island Transit, and SKAT are available at the Everett Station located just east of the Everett central business district.
• Transit Development Plan: Everett Transit TDP

Everett Transit
Page 30 Summary of Public Transportation – 2010 November 2011
Annual Operating Information
2008 2009 2010 % ChangeFixed Route Services (Direct Operated)Revenue Vehicle Hours 111,650 117,636 129,722 10.27Total Vehicle Hours 117,790 124,184 138,290 11.36Revenue Vehicle Miles 1,377,928 1,452,306 1,610,676 10.90Total Vehicle Miles 1,505,472 1,589,349 1,798,188 13.14Passenger Trips 2,517,100 2,495,005 2,289,729 -8.23Diesel Fuel Consumed (gallons) 347,710 371,103 394,941 6.42Employees - FTEs 119.0 113 117 3.54Operating Expenses $12,858,718 $13,340,826 $14,240,793 6.75Farebox Revenues $1,091,474 $1,076,498 $1,206,313 12.06
Demand Response Services (Direct Operated)Revenue Vehicle Hours 45,158 42,672 43,791 2.62Total Vehicle Hours 47,850 45,361 46,511 2.54Revenue Vehicle Miles 524,124 505,602 518,059 2.46Total Vehicle Miles 578,050 558,879 570,665 2.11Passenger Trips 111,684 108,952 113,581 4.25Gasoline Fuel Consumed (gallons) 103,436 103,487 105,654 2.09Employees - FTEs 41.0 41.0 40 -2.44Operating Expenses $3,894,273 $3,772,835 $3,845,805 1.93Farebox Revenues $41,211 $47,157 $104,512 121.63
RevenuesOperating Related RevenuesSales Tax $17,351,813 $14,489,333 $15,650,951 8.02Farebox Revenues $1,132,685 $1,123,655 $1,310,825 16.66Federal Section §5307 Operating $0 $1,969,815 $0 -100.00Federal Section §5307 Preventative $0 $862,285 $0 -100.00State Special Needs Grants $0 $575,274 $205,995 -64.19Sales Tax Equalization $66,477 $173,633 $242,898 39.89Other State Operating Grants $0 $57,283 $42,950 -25.02Other Operating Sub-Total $1,943,003 $1,216,856 $1,353,695 11.25Other-Advertising $0 $0 $130,037 -Other-Interest $619,352 $211,992 $383,706 81.00Other-Gain (Loss) on Sale of Assets $2,528 $7,800 $2,147 -72.47Other-MISC $1,321,123 $997,064 $837,805 -15.97Total (Excludes Capital Revenues) $20,493,978 $20,468,134 $18,807,314 -8.11
Everett Transit
Summary of Public Transportation – 2010 Page 31 November 2011
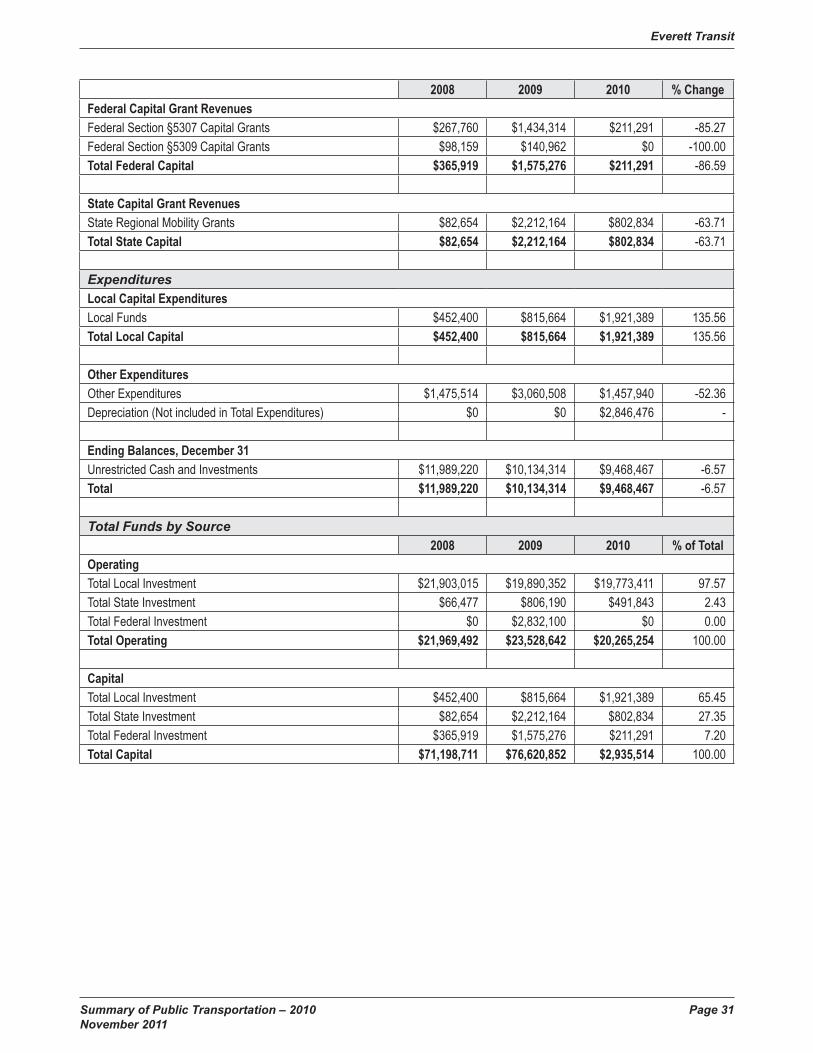
2008 2009 2010 % ChangeFederal Capital Grant RevenuesFederal Section §5307 Capital Grants $267,760 $1,434,314 $211,291 -85.27Federal Section §5309 Capital Grants $98,159 $140,962 $0 -100.00Total Federal Capital $365,919 $1,575,276 $211,291 -86.59
State Capital Grant RevenuesState Regional Mobility Grants $82,654 $2,212,164 $802,834 -63.71Total State Capital $82,654 $2,212,164 $802,834 -63.71
ExpendituresLocal Capital ExpendituresLocal Funds $452,400 $815,664 $1,921,389 135.56Total Local Capital $452,400 $815,664 $1,921,389 135.56
Other ExpendituresOther Expenditures $1,475,514 $3,060,508 $1,457,940 -52.36Depreciation (Not included in Total Expenditures) $0 $0 $2,846,476 -
Ending Balances, December 31Unrestricted Cash and Investments $11,989,220 $10,134,314 $9,468,467 -6.57Total $11,989,220 $10,134,314 $9,468,467 -6.57
Total Funds by Source2008 2009 2010 % of Total
OperatingTotal Local Investment $21,903,015 $19,890,352 $19,773,411 97.57Total State Investment $66,477 $806,190 $491,843 2.43Total Federal Investment $0 $2,832,100 $0 0.00Total Operating $21,969,492 $23,528,642 $20,265,254 100.00
CapitalTotal Local Investment $452,400 $815,664 $1,921,389 65.45Total State Investment $82,654 $2,212,164 $802,834 27.35Total Federal Investment $365,919 $1,575,276 $211,291 7.20Total Capital $71,198,711 $76,620,852 $2,935,514 100.00

Everett Transit
Page 32 Summary of Public Transportation – 2010 November 2011

Summary of Public Transportation – 2010 Page 33 November 2011
King County Metro
Kevin DesmondGeneral Manager201 South Jackson StreetSeattle, WA 98104‑3856206‑553‑3000www.metro.kingcounty.gov
System Snapshot• Service Area: King County
• Congressional District: 7 and parts of 1, 2, 8 and 9
• Legislative District: 5, 11, 33, 34, 36, 37, 41, 43, 45, 46, 47, and 48. Parts of 1, 25, 30, 31, 32, and 39
• Type of Government: County
• Governing Body: King County Council
• Tax Authorized: 0.9 percent total sales and use tax—0.3 percent sales approved in 1972, an additional 0.3 percent sales in 1980, an additional 0.2 percent sales in 2000, and an additional 0.1 percent sales in 2006
• Fares: Adult Off‑Peak – $2.25; One‑Zone Peak– $2.50; Two‑Zone Peak – $3.00– Senior; $0.75– Youth; $1.25– Paratransit; $1.25– Child (under 6); Free
• Intermodal Connections: Metro transit provides service throughout King County. Metro provides service to nearly every major school, business and place of interest in the county. Connections with Sound Transit, Community Transit, Pierce Transit, Amtrak, the City of Seattle monorail, and Washington State Ferries at various transit centers and other locations in the region.
• Transit Development Plan: King County Metro TDP.

King County Metro
Page 34 Summary of Public Transportation – 2010 November 2011
Annual Operating Information
2008 2009 2010 % ChangeFixed Route Services (Direct Operated)Revenue Vehicle Hours 3,085,041 3,063,924 3,032,576 -1.02Total Vehicle Hours 3,511,038 3,477,496 3,445,821 -0.91Revenue Vehicle Miles 34,984,800 34,662,302 34,282,979 -1.09Total Vehicle Miles 43,970,661 43,455,343 43,024,670 -0.99Passenger Trips 118,278,626 110,221,262 108,191,863 -1.84Diesel Fuel Consumed (gallons) 10,229,652 10,424,138 10,275,568 -1.43Electricity Consumed (kWh) 16,277,945 16,917,983 18,258,379 7.92Employees - FTEs 3,098.9 3,086.2 3,172.5 2.80Operating Expenses $434,665,878 $429,308,880 $437,353,984 1.87Farebox Revenues $101,506,510 $111,830,450 $119,717,250 7.05
Fixed Route Services (Purchased Transportation)Revenue Vehicle Hours - 71,947 78,012 8.43Total Vehicle Hours - 79,592 85,557 7.49Revenue Vehicle Miles - 831,493 902,405 8.53Total Vehicle Miles - 1,022,627 1,097,014 7.27Passenger Trips - 846,678 817,030 -3.50Diesel Fuel Consumed (gallons) - 30,901 30,383 -1.68Gasoline Fuel Consumed (gallons) - 138,981 143,684 3.38Employees - FTEs - 3.6 - -100.00Operating Expenses $0 $6,296,965 $7,659,725 21.64Farebox Revenues $0 $200,354 $195,726 -2.31
Light Rail Services (Direct Operated)Revenue Vehicle Hours 11,399 11,207 11,178 -0.26Total Vehicle Hours 11,532 11,340 11,312 -0.25Revenue Vehicle Miles 56,613 60,150 59,964 -0.31Total Vehicle Miles 56,893 60,433 60,248 -0.31Passenger Trips 413,253 451,203 520,933 15.45Electricity Consumed (kWh) 545,440 556,000 555,000 -0.18Employees - FTEs 23.0 18.4 16.5 -10.33Operating Expenses $2,459,635 $2,366,620 $2,267,364 -4.19Farebox Revenues $275,185 $342,835 $288,740 -15.78

King County Metro
Summary of Public Transportation – 2010 Page 35 November 2011
2008 2009 2010 % ChangeDemand Response Services (Purchased Transportation)Revenue Vehicle Hours 686,189 657,222 692,447 5.36Total Vehicle Hours 783,317 742,809 787,996 6.08Revenue Vehicle Miles 10,067,742 9,974,975 10,292,918 3.19Total Vehicle Miles 11,651,625 11,469,647 12,003,833 4.66Passenger Trips 1,145,480 1,142,452 1,257,902 10.11Diesel Fuel Consumed (gallons) 1140089 1,109,007 1,167,105 5.24Gasoline Fuel Consumed (gallons) 33759 26,466 43,646 64.91Employees - FTEs 680.0 650.7 24.5 -96.23Operating Expenses $52,752,281 $51,791,811 $56,713,747 9.50Farebox Revenues $831,048 $850,905 $631,672 -25.76
Vanpooling Services (Direct Operated)Revenue Vehicle Hours 345,169 347,215 294,929 -15.06Total Vehicle Hours 345,169 347,215 294,929 -15.06Revenue Vehicle Miles 11,711,249 11,802,532 11,368,164 -3.68Total Vehicle Miles 11,711,249 11,802,532 11,368,164 -3.68Passenger Trips 3,138,787 3,172,678 2,849,585 -10.18Gasoline Fuel Consumed (gallons) 777,400 807,203 752,717 -6.75Employees - FTEs 37.6 32.7 35.4 8.26Operating Expenses $9,751,345 $8,973,302 $9,101,323 1.43Vanpool Revenue $8,049,283 $9,636,603 $8,728,042 -9.43
RevenuesOperating Related RevenuesSales Tax $445,428,008 $382,354,171 $373,092,691 -2.42Utility Tax $0 $0 $22,173,801 -Farebox Revenues $102,612,743 $113,224,544 $120,833,388 6.72Vanpooling Revenue $8,049,283 $9,636,603 $8,728,042 -9.43Federal Section §5307 Operating $10,436,068 $42,058,091 $46,972,918 11.69Federal Section §5307 Preventative $56,200,000 $44,357,144 $46,042,856 3.80Federal Section §5311 Operating $0 $117,951 $0 -100.00FTA JARC (§5316) Program $1,382,106 $178,109 $181,628 1.98Other Federal Operating $377,754 $53,703 $1,358,597 2429.83State Regional Mobility Operating Grants $244,119 $150,750 $0 -100.00State Special Needs Grants $2,113,887 $2,631,832 $0 -100.00Other State Operating Grants $476,235 $0 $0 -Other Operating Sub-Total $23,155,881 $40,405,924 $10,208,116 -74.74Other-Advertising $6,100,000 $6,398,000 $5,649,779 -11.69Other-Interest $7,300,000 $5,701,000 $4,558,337 -20.04Other-Gain (Loss) on Sale of Assets $0 $14,017,000 $0 -100.00Other-MISC $9,755,881 $14,289,924 $0 -100.00Total (Excludes Capital Revenues) $663,876,084 $675,574,747 $629,592,037 -6.81

King County Metro
Page 36 Summary of Public Transportation – 2010 November 2011
2008 2009 2010 % ChangeFederal Capital Grant RevenuesFederal Section §5307 Capital Grants $10,812,585 $7,545,282 $7,625,404 1.06Federal Section §5309 Capital Grants $5,513,549 $21,230,850 $5,520,023 -74.00Federal STP Grants $1,846,220 $21,448 $0 -100.00CM/AQ and Other Federal Grants $4,517,525 $1,207,536 $1,344,687 11.36Total Federal Capital $22,689,879 $30,005,116 $14,490,114 -51.71
State Capital Grant RevenuesState Regional Mobility Grants $483,329 $1,940,766 $0 -100.00State Special Needs Grants $1,101,045 $180,761 $0 -100.00State Vanpool Grants $2,804,585 $0 $0 -Other State Capital Funds $130,967 $765,045 $0 -100.00Total State Capital $4,519,926 $2,886,572 $0 -100.00
ExpendituresOther ExpendituresOther Expenditures $1,415,747 $12,862,205 $0 -100.00Depreciation (Not included in Total Expenditures) $116,450,879 $102,354,424 -12.11
Debt ServiceInterest $7,904,000 $6,367,000 $6,309,163 -0.91Principal $7,405,000 $8,285,000 $9,490,000 14.54Total Debt Service $15,309,000 $14,652,000 $15,799,163 7.83
Ending Balances, December 31Unrestricted Cash and Investments $177,889,584 $142,100,150 $162,459,630 14.33Debt Service Funds $0 $0 $15,799,923 -Other (Please Explain in Comments Section at End) $202,820,038 $246,191,852 $207,653,131 -15.65Total $380,709,622 $388,292,002 $385,912,684 -0.61
Total Funds by Source2008 2009 2010 % of Total
OperatingTotal Local Investment $580,661,662 $558,483,447 $535,036,038 84.98Total State Investment $2,834,241 $2,782,582 $0 0.00Total Federal Investment $68,395,928 $86,764,998 $94,555,999 15.02Total Operating $651,891,831 $648,031,028 $629,592,037 100.00
CapitalTotal Local Investment $0 $0 $0 0.00Total State Investment $4,519,926 $2,886,572 $0 0.00Total Federal Investment $22,689,879 $30,005,116 $14,490,114 100.00Total Capital $27,209,805 $32,891,688 $14,490,114 100.00

Summary of Public Transportation – 2010 Page 37 November 2011
Pierce Transit
Lynne Griffith Chief Executive Officer3701 96th Street SWLakewood, WA 98499‑0496253‑581‑8000www.piercetransit.org
System Snapshot• Service Area: Central and northern Pierce County, including Gig Harbor and
Key Peninsula areas.
• Congressional District: 6, 8, and 9
• Legislative District: 2, 25, 26, 27, 28, 29, and 31
• Type of Government: PTBA
• Governing Body: Board of Commissioners
• Tax Authorized: 0.6 percent total sales and use tax collected in the public transportation benefit area
• Fares: Adult Fare $1.75; Senior/People with Disabilities/Youth Fare $.75
• Intermodal Connections: Pierce Transit’s service area includes the incorporated cities and towns of Bonney Lake, Buckley, DuPont, Edgewood, Fife, Fircrest, Gig Harbor, Lakewood, Milton, Orting, Pacific, Puyallup, Ruston, Steilacoom, Sumner, Tacoma and University Place, along with the portion of Auburn in Pierce County and some unincorporated areas of Pierce County. Connections with Greyhound, Sound Transit, Amtrak and Intercity Transit are available within the service area.
• Transit Development Plan: Currently under revision by the transit system.

Pierce Transit
Page 38 Summary of Public Transportation – 2010 November 2011
Annual Operating Information
2008 2009 2010 % ChangeFixed Route Services (Direct Operated)Revenue Vehicle Hours 600,858 586,199 563,200 -3.92Total Vehicle Hours 660,593 642,575 618,508 -3.75Revenue Vehicle Miles 7,483,309 7,271,281 6,959,366 -4.29Total Vehicle Miles 8,653,112 8,404,195 8,047,389 -4.25Passenger Trips 14,985,356 14,251,299 14,008,679 -1.70Diesel Fuel Consumed (gallons) 11 - - -Gasoline Fuel Consumed (gallons) 190,824 47,626 45,088 -5.33CNG Fuel Consumed (Therms) 3,106,347 2,421,910 2,868,483 18.44Employees - FTEs 724.0 648.9 602.0 -7.23Operating Expenses $69,340,588 $67,983,187 $70,530,435 3.75Farebox Revenues $11,554,497 $12,796,106 $11,619,743 -9.19
Demand Response Services (Direct Operated)Revenue Vehicle Hours 204,007 212,439 52,118 -75.47Total Vehicle Hours 241,941 250,252 57,864 -76.88Revenue Vehicle Miles 3,010,770 3,059,305 751,410 -75.44Total Vehicle Miles 3,468,749 3,513,980 853,622 -75.71Passenger Trips 451,646 463,324 124,729 -73.08Gasoline Fuel Consumed (gallons) 401,912 472,325 130,855 -72.30Employees - FTEs 70.0 65.4 56.0 -14.37Operating Expenses $17,637,236 $17,806,552 $6,086,477 -65.82Farebox Revenues $337,001 $404,889 $103,634 -74.40
Demand Response Services (Purchased Transportation)Revenue Vehicle Hours - - 149,844 -Total Vehicle Hours - - 167,597 -Revenue Vehicle Miles - - 2,261,378 -Total Vehicle Miles - - 2,609,937 -Passenger Trips - - 321,241 -Gasoline Fuel Consumed (gallons) 0 - 341,403 -Operating Expenses $0 $0 $11,511,162 -Farebox Revenues $0 $0 $266,697 -
Vanpooling Services (Direct Operated)Revenue Vehicle Hours 147,632 134,818 137,846 2.25Total Vehicle Hours 147,632 134,818 137,846 2.25Revenue Vehicle Miles 4,251,364 4,476,811 4,542,494 1.47Total Vehicle Miles 4,251,364 4,476,811 4,542,494 1.47Passenger Trips 852,070 846,040 825,212 -2.46Gasoline Fuel Consumed (gallons) 324,425 338,911 331,119 -2.30Employees - FTEs 32.0 27.5 24.0 -12.73Operating Expenses $4,289,260 $4,097,790 $4,315,981 5.32Vanpool Revenue $2,230,211 $2,539,666 $2,514,731 -0.98

Pierce Transit
Summary of Public Transportation – 2010 Page 39 November 2011
Revenues2008 2009 2010 % Change
Operating Related RevenuesSales Tax $71,752,351 $63,335,030 $65,338,852 3.16Farebox Revenues $11,891,498 $13,200,995 $11,990,074 -9.17Vanpooling Revenue $2,230,211 $2,539,666 $2,514,731 -0.98Federal Section §5307 Operating $0 $4,400,000 $7,434,962 68.98Federal Section §5307 Preventative $7,936,457 $8,406,991 $1,392,028 -83.44State Special Needs Grants $1,483,512 $506,076 $1,012,152 100.00Sales Tax Equalization $0 $0 $85,858 -Other State Operating Grants $156,331 $76,520 $0 -100.00Other Operating Sub-Total $5,045,423 $2,400,090 $3,926,293 63.59Other-Advertising $968,104 $905,896 $1,120,406 23.68Other-Interest $3,220,825 $1,014,361 $346,746 -65.82Other-Gain (Loss) on Sale of Assets $122,190 $91,084 $368,928 305.04Other-MISC $734,304 $388,749 $2,090,213 437.68Total (Excludes Capital Revenues) $100,495,783 $94,865,368 $93,694,950 -1.23
Federal Capital Grant RevenuesFederal Section §5307 Capital Grants $3,172,893 $1,474,753 $6,741,534 357.13CM/AQ and Other Federal Grants $148,056 $96,502 $82,380 -14.63Total Federal Capital $3,320,949 $1,571,255 $6,823,914 334.30
State Capital Grant RevenuesOther State Capital Funds $223,262 $0 $478,620 -Total State Capital $223,262 $0 $478,620 -
ExpendituresLocal Capital ExpendituresLocal Funds $5,191,984 $1,246,058 $1,839,931 47.66Total Local Capital $5,191,984 $1,246,058 $1,839,931 47.66
Other ExpendituresOther Expenditures $1,203,449 $1,562,685 $0 -100.00Depreciation (Not included in Total Expenditures) $14,117,400 $14,005,135 $12,828,624 -8.40
Debt ServiceInterest $77,616 $45,252 $0 -100.00Principal $415,000 $1,335,000 $0 -100.00Total Debt Service $492,616 $1,380,252 $0 -100.00
Ending Balances, December 31Unrestricted Cash and Investments $69,962,213 $68,391,855 $65,244,204 -4.60Capital Reserve Funds $35,314,759 $25,366,574 $25,689,792 1.27Insurance Funds $3,007,462 $2,441,344 $3,027,900 24.03Total $108,284,434 $96,199,773 $93,961,896 -2.33
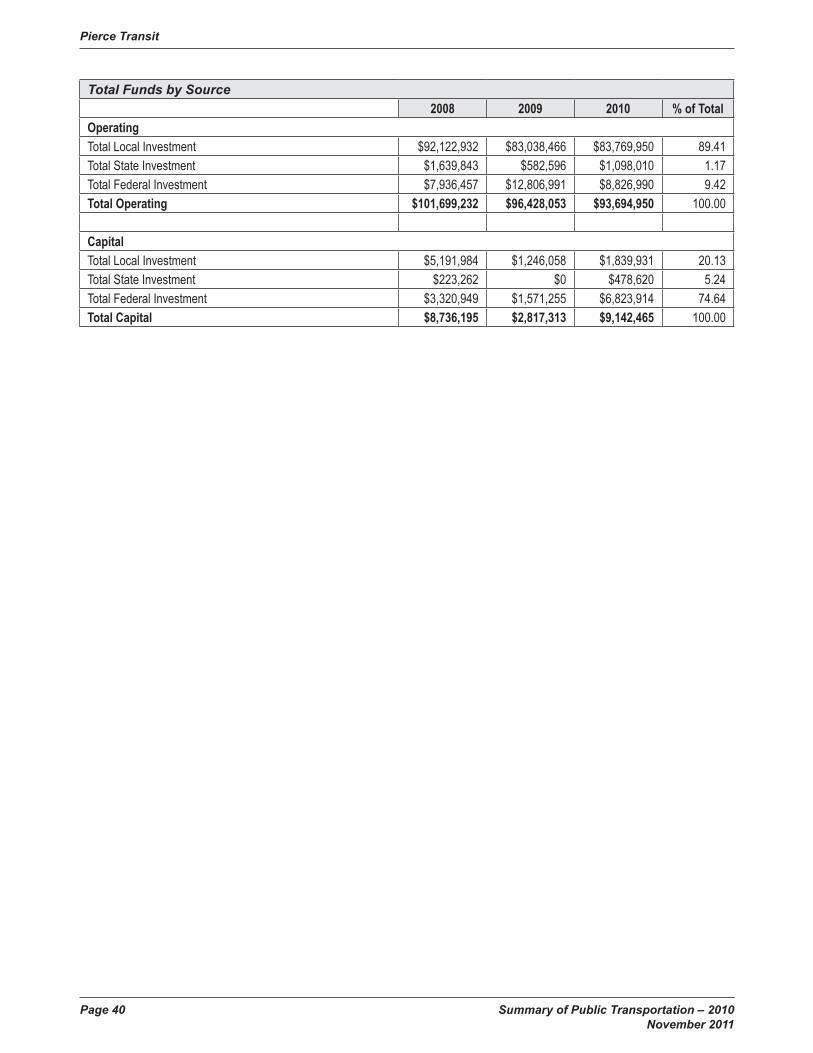
Pierce Transit
Page 40 Summary of Public Transportation – 2010 November 2011
Total Funds by Source2008 2009 2010 % of Total
OperatingTotal Local Investment $92,122,932 $83,038,466 $83,769,950 89.41Total State Investment $1,639,843 $582,596 $1,098,010 1.17Total Federal Investment $7,936,457 $12,806,991 $8,826,990 9.42Total Operating $101,699,232 $96,428,053 $93,694,950 100.00
CapitalTotal Local Investment $5,191,984 $1,246,058 $1,839,931 20.13Total State Investment $223,262 $0 $478,620 5.24Total Federal Investment $3,320,949 $1,571,255 $6,823,914 74.64Total Capital $8,736,195 $2,817,313 $9,142,465 100.00

Summary of Public Transportation – 2010 Page 41 November 2011
Sound Transit
Joni EarlCEO401 South JacksonSeattle, WA 98104 206‑398‑5000www.soundtransit.org
System Snapshot• Service Area: The tax district stretches 76 miles and includes the major cities and
employment centers in Snohomish, King and Pierce counties. It includes 51 cities and about 2.7 million people.
• Congressional District: 1, 2, 6, 7, 8, and 9
• Legislative District: 25
• Type of Government: Regional Transit Authority
• Governing Body: Sound Transit is governed by an 18 member Board, 17 of whom are appointed by the respective member county executives and confirmed by the council of each member county. Membership is based on the population from the portion of each county that lies within Sound Transit’s service area. Representation on the Board includes an elected official representing the largest city in each county and ensures proportional representation from other cities and from unincorporated areas of each county. The final board position is held by the Secretary of Transportation, Washington State Department of Transportation.
• Tax Authorized: Sound Transit’s taxing and service area boundary lines generally follow the urban growth boundaries created by each county in accordance with the state Growth Management Act. On Nov. 5, 1996, voters approved local funding for Sound Move, a regional high‑capacity transit plan that included a 0.4 percent local sales and use tax, a 0.3 percent motor vehicle excise tax, and a 0.8% rental car tax to finance construction and operation of the regional transit system. On Nov. 4, 2008, voters approved additional local funding as part of the Sound Transit 2 (ST2) plan. This transit plan included a new 15‑year construction program of light rail, commuter rail and regional bus service by extending the Sound Move taxes, as well as increasing the local sales and use tax by an additional 0.5 percent to a total of 0.9 percent.
• Fares: On ST Express, Sound Transit employs a zone-based fare structure, consisting of five zones. Trips within Pierce or Snohomish County are one zone. A trip costs more when it crosses a county line, or when crossing a zone boundary within King County. King County is divided into three zones: Seattle/North King County, East King County, and South King County. Single-ride fares for adults are $2.00 for one zone, $2.50 for two zones, and $3.00 for multi‑county trips.
• Transit Development Plan: Sound Transit TDP
• Revised Targets: Sound Transit Revised Ridership Targets

Sound Transit
Page 42 Summary of Public Transportation – 2010 November 2011
Annual Operating Information
2008 2009 2010 % ChangeFixed Route Services (Direct Operated)Revenue Vehicle Hours 429,483 455,500 465,650 2.23Total Vehicle Hours 514,723 549,500 557,016 1.37Revenue Vehicle Miles 8,243,509 8,670,800 9,076,854 4.68Total Vehicle Miles 10,442,179 11,003,200 11,595,069 5.38Passenger Trips 10,502,086 11,142,117 10,461,590 -6.11Diesel Fuel Consumed (gallons) - 2,237,000 2,293,213 2.51CNG Fuel Consumed (Therms) 252,270 205,900 291,110 41.38Employees - FTEs 568.2 504.3 502.2 -0.42Operating Expenses $68,995,224 $71,870,445 $81,390,458 13.25Farebox Revenues $14,772,810 $15,110,545 $15,514,636 2.67
Fixed Route Services (Purchased Transportation)Revenue Vehicle Hours 75,226 80,700 87,210 8.07Total Vehicle Hours 115,898 127,000 136,942 7.83Revenue Vehicle Miles 2,046,858 2,159,800 2,347,355 8.68Total Vehicle Miles 2,445,260 2,736,700 3,059,800 11.81Passenger Trips 2,526,400 2,642,636 2,631,195 -0.43Diesel Fuel Consumed (gallons) - 581,400 642,310 10.48CNG Fuel Consumed (Therms) 95,863 - - -Employees - FTEs - 114.6 137.1 19.63Operating Expenses $12,163,858 $12,326,703 $14,094,123 14.34Farebox Revenues $3,641,733 $3,799,016 $5,331,173 40.33
Commuter Rail Services (Purchased Transportation)Revenue Vehicle Hours 27,006 36,010 38,518 6.96Total Vehicle Hours 33,799 44,218 47,270 6.90Revenue Vehicle Miles 1,039,433 1,399,687 1,506,922 7.66Total Vehicle Miles 1,052,986 1,417,997 1,527,240 7.70Passenger Trips 2,668,623 2,492,362 2,480,052 -0.49Diesel Fuel Consumed (gallons) 1,049,633 1,119,629 1,112,851 -0.61Employees - FTEs 4.0 4.0 33.9 747.50Operating Expenses $31,084,795 $34,020,024 $32,459,887 -4.59Farebox Revenues $8,196,172 $7,766,691 $7,134,458 -8.14
Light Rail Services (Direct Operated)Revenue Vehicle Hours 9,708 9,400 9,724 3.45Total Vehicle Hours 9,888 9,600 9,859 2.70Revenue Vehicle Miles 94,099 89,400 90,168 0.86Total Vehicle Miles 94,499 89,600 90,454 0.95Passenger Trips 926,076 889,620 873,073 -1.86Electricity Consumed (kWh) 418,365 413,000 407,018 -1.45Employees - FTEs 14.0 18.5 15.8 -14.59Operating Expenses $3,046,657 $3,305,619 $3,099,768 -6.23

Sound Transit
Summary of Public Transportation – 2010 Page 43 November 2011
2008 2009 2010 % ChangeLight Rail Services (Purchased Transportation)Revenue Vehicle Hours - 60,500 137,531 127.32Total Vehicle Hours - 65,500 148,952 127.41Revenue Vehicle Miles - 1,113,300 2,586,163 132.30Total Vehicle Miles - 1,131,000 2,685,743 137.47Passenger Trips - 2,501,151 6,958,832 178.23Electricity Consumed (kWh) - 4,812,900 13,327,909 176.92Employees - FTEs - - 190.8 -Operating Expenses $0 $17,433,090 $41,377,642 137.35Farebox Revenues $0 $2,371,968 $9,608,740 305.10
RevenuesOperating Related RevenuesSales Tax $267,855,957 $443,797,922 $506,509,628 14.13MVET $68,620,777 $67,289,938 $65,788,394 -2.23Farebox Revenues $26,610,715 $29,048,220 $37,589,007 29.40FTA JARC (§5316) Program $33,087 $19,384 $123,476 537.00Other Federal Operating $453,674 $428,743 $432,565 0.89Other State Operating Grants $47,604 $230,984 $0 -100.00Other Operating Sub-Total $27,572,294 $15,816,627 $24,003,161 51.76Other-Advertising $1,049,328 $1,009,892 $1,031,963 2.19Other-Interest $24,059,751 $12,359,757 $14,121,924 14.26Other-MISC $2,463,215 $2,446,978 $8,849,274 261.64Total (Excludes Capital Revenues) $391,194,108 $556,631,818 $634,446,231 13.98
Federal Capital Grant RevenuesFederal Section §5307 Capital Grants $24,339,650 $54,502,780 $22,705,212 -58.34Federal Section §5309 Capital Grants $135,495,391 $74,903,749 $128,780,572 71.93CM/AQ and Other Federal Grants $1,901,276 $846,684 $267,596 -68.39Total Federal Capital $161,736,317 $130,253,213 $151,753,380 16.51
State Capital Grant RevenuesState Regional Mobility Grants $0 $4,407,065 $9,638,787 118.71Other State Capital Funds $10,643,052 $10,201,107 $2,323,934 -77.22Total State Capital $10,643,052 $14,608,172 $11,962,721 -18.11

Sound Transit
Page 44 Summary of Public Transportation – 2010 November 2011
Expenditures2008 2009 2010 % Change
Local Capital ExpendituresLocal Funds $3,241,787 $839,751 $0 -100.00Total Local Capital $3,241,787 $839,751 $0 -100.00
Other ExpendituresOther Expenditures $43,933,408 $46,944,505 $0 -100.00Depreciation (Not included in Total Expenditures) $105,426,625 $102,556,487 $113,892,117 11.05
Debt ServiceInterest $55,009,149 $58,693,587 $78,866,807 34.37Principal $27,890,000 $44,810,000 $8,065,000 -82.00Total Debt Service $82,899,149 $103,503,587 $86,931,807 -16.01
Ending Balances, December 31Unrestricted Cash and Investments $304,285,425 $614,301,339 $802,173,844 30.58Operating Reserve $27,863,115 $35,771,891 $37,136,566 3.81Capital Reserve Funds $47,421,696 $73,222,956 $100,525,296 37.29Debt Service Funds $73,830,022 $71,390,177 $85,629,885 19.95Insurance Funds $3,085,487 $3,296,225 $2,812,129 -14.69Other (Please Explain in Comments Section at End) $108,373,109 $246,914,796 $20,152,771 -91.84Total $564,858,854 $1,044,897,384 $1,048,430,491 0.34
Total Funds by Source2008 2009 2010 % of Total
OperatingTotal Local Investment $434,593,151 $602,897,212 $633,890,190 99.91Total State Investment $47,604 $230,984 $0 0.00Total Federal Investment $486,761 $448,127 $556,041 0.09Total Operating $435,127,516 $603,576,323 $634,446,231 100.00
CapitalTotal Local Investment $3,241,787 $839,751 $0 0.00Total State Investment $10,643,052 $14,608,172 $11,962,721 7.31Total Federal Investment $161,736,317 $130,253,213 $151,753,380 92.69Total Capital $175,621,156 $145,701,136 $163,716,101 100.00

Summary of Public Transportation – 2010 Page 45 November 2011
Spokane Transit Authority
E. Susan Meyer CEO1230 West Boone AvenueSpokane, WA 99201509‑325‑6095www.spokanetransit.com
System Snapshot• Service Area: Most of Spokane County
• Congressional District: 5
• Legislative District: 3, 4, 6, and 9
• Type of Government: PTBA
• Governing Body: Ten member Board of Directors; two Spokane County Commissioners, three Spokane City Council Members, two City of Spokane Valley Council Members, two members appointed on a rotating basis by the smaller cities and town of Cheney, Airway Heights, Medical Lake, Liberty Lake, and Town of Millwood; one non‑voting Union Representative.
• Tax Authorized: 0.6 percent total sales and use tax‑0.3 percent sales approved in 1981 and an additional 0.3 percent sales and use tax approved in May 2004 for an effective collection date of October 2004.
• Fares: Effective from 1/1/2010-12/31/2010 our base fare was $1.25 per boarding for fixed route; $.60 reduced fare for fixed route; $.75 per boarding for paratransit.
• Intermodal Connections: STA provides service to the intermodal center during STA service hours to provide connections to intercity bus, Amtrak, and taxi services. STA operates a fixed-route and paratransit service between downtown Spokane and the Spokane International Airport. STA provides scheduled service to all of the public elementary, middle, and high schools in the service area. In addition, STA serves the area’s colleges and universities, including Gonzaga University in Spokane; Whitworth College, north of Spokane; Eastern Washington University in Cheney; the Spokane campuses of Washington State University and Eastern Washington University; Spokane Community College; and Spokane Falls Community College.
• Transit Development Plan: Spokane Transit Authority TDP

Spokane Transit Authority
Page 46 Summary of Public Transportation – 2010 November 2011
Annual Operating Information
2008 2009 2010 % ChangeFixed Route Services (Direct Operated)Revenue Vehicle Hours 414,751 418,247 414,364 -0.93Total Vehicle Hours 443,604 447,279 442,366 -1.10Revenue Vehicle Miles 5,718,006 5,782,329 5,772,668 -0.17Total Vehicle Miles 6,235,562 6,307,479 6,287,383 -0.32Passenger Trips 11,110,476 11,152,841 10,710,528 -3.97Diesel Fuel Consumed (gallons) 1,284,000 1,261,087 1,180,835 -6.36Employees - FTEs 425.5 434.1 436.6 0.57Operating Expenses $43,194,327 $41,537,202 $43,709,912 5.23Farebox Revenues $7,112,748 $7,127,521 $8,382,949 17.61
Demand Response Services (Direct Operated)Revenue Vehicle Hours 91,129 90,765 84,769 -6.61Total Vehicle Hours 107,469 105,928 98,050 -7.44Revenue Vehicle Miles 1,337,188 1,307,371 1,213,471 -7.18Total Vehicle Miles 1,481,129 1,455,799 1,362,977 -6.38Passenger Trips 277,528 277,200 258,640 -6.70Diesel Fuel Consumed (gallons) 140,174 130,608 119,235 -8.71Gasoline Fuel Consumed (gallons) 31,959 43,690 41,841 -4.23Employees - FTEs 103.7 106.1 103.6 -2.36Operating Expenses $7,783,038 $7,595,675 $8,019,464 5.58Farebox Revenues $156,606 $148,645 $321,332 116.17
Demand Response Services (Purchased Transportation)Revenue Vehicle Hours 87,830 84,316 87,975 4.34Total Vehicle Hours 105,667 101,234 110,899 9.55Revenue Vehicle Miles 1,387,765 1,377,786 1,378,972 0.09Total Vehicle Miles 1,621,020 1,579,335 1,623,477 2.79Passenger Trips 238,988 244,378 258,552 5.80Diesel Fuel Consumed (gallons) 164962 121,137 123,988 2.35Gasoline Fuel Consumed (gallons) 11038 54,593 43,206 -20.86Employees - FTEs 59 59.1 64.0 8.38Operating Expenses $4,178,794 $4,047,938 $4,215,627 4.14Farebox Revenues $54,436 $57,433 $82,792 44.15
Vanpooling Services (Direct Operated)Revenue Vehicle Hours 24,267 23,703 24,198 2.09Total Vehicle Hours 24,267 23,703 24,198 2.09Revenue Vehicle Miles 893,380 888,699 907,418 2.11Total Vehicle Miles 893,380 888,699 907,418 2.11Passenger Trips 224,264 209,822 208,480 -0.64Gasoline Fuel Consumed (gallons) 75,030 78,226 83,481 6.72Employees - FTEs 2.5 2.6 2.7 3.85Operating Expenses $633,398 $598,008 $649,500 8.61Vanpool Revenue $538,393 $534,002 $556,453 4.20

Spokane Transit Authority
Summary of Public Transportation – 2010 Page 47 November 2011
Revenues2008 2009 2010 % Change
Operating Related RevenuesSales Tax $44,407,044 $40,913,106 $40,559,096 -0.87Farebox Revenues $7,323,790 $7,333,599 $8,787,073 19.82Vanpooling Revenue $538,393 $534,002 $556,453 4.20Federal Section §5307 Preventative $7,218,723 $7,593,246 $8,207,231 8.09FTA JARC (§5316) Program $95,068 $312,124 $215,393 -30.99State Special Needs Grants $1,402,125 $747,042 $1,045,873 40.00Other Operating Sub-Total $2,481,412 $870,417 $1,105,756 27.04Other-Advertising $0 $250,000 $274,999 10.00Other-Interest $2,001,894 $865,728 $685,445 -20.82Other-Gain (Loss) on Sale of Assets $0 -$705,461 -$200,843 -71.53Other-MISC $479,518 $460,150 $346,155 -24.77Total (Excludes Capital Revenues) $63,466,555 $58,303,536 $60,476,875 3.73
Federal Capital Grant RevenuesFederal Section §5307 Capital Grants $335,271 $7,853,408 $4,033,380 -48.64Federal Section §5309 Capital Grants $384,351 $111,621 $250,446 124.37CM/AQ and Other Federal Grants $5,824 $171,537 2845.35Total Federal Capital $719,622 $7,970,853 $4,455,363 -44.10
State Capital Grant RevenuesState Vanpool Grants $0 $180,406 $260,000 44.12Other State Capital Funds $57,558 $1,456 $242,884 16581.59Total State Capital $57,558 $181,862 $502,884 176.52
ExpendituresLocal Capital ExpendituresLocal Funds $11,418,492 $1,780,817 $3,331,774 87.09Total Local Capital $11,418,492 $1,780,817 $3,331,774 87.09
Other ExpendituresOther Expenditures $5,997,172 $2,705,036 $2,594,148 -4.10Depreciation (Not included in Total Expenditures) $0 $5,840,321 $6,618,455 13.32
Ending Balances, December 31Unrestricted Cash and Investments $33,061,933 $28,863,784 $30,204,955 4.65Operating Reserve $9,260,030 $9,450,757 $9,046,932 -4.27Insurance Funds $5,500,000 $5,500,000 $5,500,000 0.00Total $47,821,963 $43,814,541 $44,751,887 2.14

Spokane Transit Authority
Page 48 Summary of Public Transportation – 2010 November 2011
Total Funds by Source2008 2009 2010 % of Total
OperatingTotal Local Investment $60,747,811 $52,356,160 $53,602,526 84.99Total State Investment $1,402,125 $747,042 $1,045,873 1.66Total Federal Investment $7,313,791 $7,905,370 $8,422,624 13.35Total Operating $69,463,727 $61,008,572 $63,071,023 100.00
CapitalTotal Local Investment $11,418,492 $1,780,817 $3,331,774 40.19Total State Investment $57,558 $181,862 $502,884 6.07Total Federal Investment $719,622 $7,970,853 $4,455,363 53.74Total Capital $12,195,672 $9,933,532 $8,290,021 100.00

Summary of Public Transportation – 2010 Page 49 November 2011
Transit Systems Serving Small Urban Areas
For the purposes of this summary, local public transportation systems serving populations of more than 50,000, but less than 200,000, are classified as serving “small urban areas” by the U.S. Bureau of the Census as of April 1, 2000.
The 11 local public transportation systems and the small urban areas they serve are:
• Asotin County Transit (Asotin County and portions of Lewiston, ID‑WA UZA)
• Ben Franklin Transit (Kennewick‑Richland, WA UZA)
• Cowlitz Transit Authority dba CUBS (Longview, WA‑OR UZA)
• Intercity Transit (Olympia‑Lacey, WA UZA)
• Kitsap Transit (Bremerton, WA UZA)
• Link Transit (Wenatchee, WA UZA)
• City of Selah Transportation Services (Yakima, WA UZA)
• Skagit Transit (Mount Vernon, WA UZA)
• Union Gap Transit (Yakima, WA UZA)
• Whatcom Transportation Authority (Bellingham, WA UZA)
• Yakima Transit (Yakima, WA UZA)
Local public transportation systems in these urbanized areas are eligible to receive Section 5307 formula funding from the Federal Transit Administration. In addition, they may receive Section 5309 Bus Discretionary funding appropriated by Congress for specific projects.
Section 5307 funding may be used to:
• purchase transit-related equipment,
• construct transit-related buildings or improvements,
• offset transit-related preventive maintenance costs, or
• offset net operating expenses.

Transit Systems Serving Small Urban Areas
Page 50 Summary of Public Transportation – 2010 November 2011

Summary of Public Transportation – 2010 Page 51 November 2011
Asotin County Transit
Kim GatesTransit Manager1494 Poplar StreetClarkston, WA 99403509‑758‑3567www.asotincoptba.com
System Snapshot• Service Area: Asotin County
• Congressional District: 5
• Legislative District: 9
• Type of Government: P TBA
• Governing Body: Three member Board of Directors
• Tax Authorized: 0.2 percent sales and use tax, approved in 2004.
• Fares: The base fare is $0.75 per boarding for fixed route, and $1.50 for per boarding Dial-a-Ride services, or 30 rides for $30 on Dial-a-Ride. The fixed route tokens are purchased in advance by local agencies to give a free ride to their employees and/or clients. Fixed route passes are $20.00 and are honored for unlimited rides for the month. Half‑fare applies to cash fares at the time of boarding for seniors, qualified people with disabilities, and Medicare card holders. This half fare and may be utilized before 11:00 am and after 5pm. The Asotin County PTBA and Lewiston Transit Systems have an agreement to honor each others unlimited monthly passes.
• Intermodal Connections: The Nez Perce County Regional Airport located in Lewiston, ID. Garfield County Outreach, based in Pomeroy, provides twice weekly shuttle service to the Clarkston/Lewiston Valley area. From there, passengers are able to connect with Asotin County PTBA’s fixed route services at the Lewiston Community Center in Lewiston, Idaho once an hour. Many of medical facilities and skilled nursing facilities in Asotin County and surrounding area use the Asotin County PTBA’ Paratransit service as their method for transporting clients and patients, in addition to their fleet of shuttle buses. People seeking access to Moscow, Idaho may utilize Valley Transit’s intercity service between Moscow and Lewiston Monday through Friday. The Asotin County PTBA service connects with Lewiston Transit System at the Lewiston Community Center. Appaloosa Express is a new fixed route service that provides public transportation from the Nez Perce Reservation in Lapwai, Idaho. This service travels to other Idaho towns including Culdesac, Orofino, Lenore, Kamiah, Kooskia, and Lewiston. From Lewiston, Idaho, passengers are able to take advantage of fixed route services that Asotin County PTBA provides.
• Transit Development Plan: Asotin County PTBA TDP

Asotin County Transit
Page 52 Summary of Public Transportation – 2010 November 2011
Annual Operating Information
2008 2009 2010 % ChangeFixed Route Services (Direct Operated)Revenue Vehicle Hours 5,822 5,803 8,750 50.78Total Vehicle Hours 7,000 6,241 9,049 44.99Revenue Vehicle Miles 100,169 99,907 131,911 32.03Total Vehicle Miles 102,000 101,407 135,043 33.17Passenger Trips 27,756 32,275 44,334 37.36Gasoline Fuel Consumed (gallons) 18,504 30,546 18,233 -40.31Employees - FTEs 2.0 3.0 6.0 100.00Operating Expenses $281,841 $328,420 $358,783 9.25Farebox Revenues $18,878 $21,316 $22,254 4.40
Demand Response Services (Direct Operated)Revenue Vehicle Hours 2,687 3,321 4,345 30.83Total Vehicle Hours 2,750 3,629 4,690 29.24Revenue Vehicle Miles 36,845 52,181 52,286 0.20Total Vehicle Miles 37,500 53,684 54,291 1.13Passenger Trips 10,418 10,174 10,273 0.97Gasoline Fuel Consumed (gallons) 7,848 7,063 7,881 11.58Employees - FTEs 2.0 3.0 2.5 -16.67Operating Expenses $147,462 $246,279 $291,188 18.24Farebox Revenues $6,297 $6,701 $10,590 58.04
Vanpooling Services (Direct Operated)Revenue Vehicle Hours 1,013 3,120 4,752 52.31Total Vehicle Hours 1,200 3,482 5,027 44.37Revenue Vehicle Miles 60,768 111,958 129,440 15.61Total Vehicle Miles 61,298 114,724 134,668 17.38Passenger Trips 16,186 29,780 35,383 18.81Gasoline Fuel Consumed (gallons) 4,568 8,818 10,415 18.11Employees - FTEs 1.0 3.0 1.0 -66.67Operating Expenses $42,150 $89,911 $45,394 -49.51Vanpool Revenue $30,159 $63,717 $72,117 13.18

Asotin County Transit
Summary of Public Transportation – 2010 Page 53 November 2011
Revenues2008 2009 2010 % Change
Operating Related RevenuesSales Tax $456,690 $491,188 $555,124 13.02Farebox Revenues $25,175 $28,017 $32,844 17.23Vanpooling Revenue $30,159 $63,717 $72,117 13.18Federal Section §5307 Operating $231,080 $464,352 $5,498 -98.82State Rural Mobility Grants $0 $0 $134,201 -State Special Needs Grants $0 $0 $14,912 -Sales Tax Equalization $223,184 $249,163 $0 -100.00Other State Operating Grants $110,021 $0 $0 -Other Operating Sub-Total $1,658 $4,051 $4,196 3.58Other-Interest $1,658 $4,051 $1,696 -58.13Other-MISC $0 $0 $2,500 -Total (Excludes Capital Revenues) $1,077,967 $1,300,488 $818,892 -37.03
Federal Capital Grant RevenuesFederal Section §5307 Capital Grants $300,000 $0 $0 -Total Federal Capital $300,000 $0 $0 -
State Capital Grant RevenuesState Vanpool Grants $110,000 $0 $0 -Total State Capital $110,000 $0 $0 -
ExpendituresLocal Capital ExpendituresLocal Funds $121,000 $419,528 $178,241 -57.51Total Local Capital $121,000 $419,528 $178,241 -57.51
Ending Balances, December 31General Fund $946,615 $584,162 $451,908 -22.64Unrestricted Cash and Investments $356,000 $356,000 $356,000 0.00Total $1,302,615 $940,162 $807,908 -14.07
Total Funds by Source2008 2009 2010 % of Total
OperatingTotal Local Investment $513,682 $586,973 $664,281 81.12Total State Investment $333,205 $249,163 $149,113 18.21Total Federal Investment $231,080 $464,352 $5,498 0.67Total Operating $1,077,967 $1,300,488 $818,892 100.00
CapitalTotal Local Investment $121,000 $419,528 $178,241 100.00Total State Investment $110,000 $0 $0 0.00Total Federal Investment $300,000 $0 $0 0.00Total Capital $531,000 $419,528 $178,241 100.00

Asotin County Transit
Page 54 Summary of Public Transportation – 2010 November 2011
Summary of Public Transportation – 2010 Page 55 November 2011
Ben Franklin Transit
Timothy J. FredricksonGeneral Manager1000 Columbia Park TrailRichland, WA 99352509‑734‑5118www.bft.org
System Snapshot• Service Area: Central Benton and Franklin Counties
• Congressional District: 4
• Legislative District: 8 and 16
• Type of Government: PTBA
• Governing Body: Nine member Board of Directors with one Benton County Commissioner, two Franklin County Commissioners, and one Council Member each from the cities of Benton City, Prosser, Kennewick, Pasco, Richland, and West Richland.
• Tax Authorized: 0.6 percent total sales and use tax—0.3 approved in May 1981 and an additional 0.3 percent approved in March 2002.
• Fares: Adult and Paratransit Cash $1.25, 10‑Ride $10.00, Monthly $22.00. Youth Cash $0.80, 10 Ride $6.00, Monthly $11.25. Freedom monthly pass $44.00 for all hours and services. College Monthly $16.00, Quarterly $45.00.
• Intermodal Connections: Weekday and Saturday Fixed Route Bus Service: All Ben Franklin Transit routes are numbered and each has a printed schedule. Ben Franklin Transit has 24 routes serving Benton City, Kennewick, Pasco, Prosser, Richland, and West Richland. There are five Inter-City routes (which travel between cities) and 19 routes called Locals which do not leave their designated city. During travel, many riders have to transfer between routed buses to get to their destination. Buses are scheduled to arrive at the transit centers at approximately the same time and leave at the same time so transferring from bus to bus is simple to do and easy to understand.
• Transit Development Plan: Ben Franklin Transit TDP

Ben Franklin Transit
Page 56 Summary of Public Transportation – 2010 November 2011
Annual Operating Information
2008 2009 2010 % ChangeFixed Route Services (Direct Operated)Revenue Vehicle Hours 147,017 146,776 132,549 -9.69Total Vehicle Hours 154,981 154,572 139,995 -9.43Revenue Vehicle Miles 2,537,360 2,534,794 2,453,253 -3.22Total Vehicle Miles 2,684,716 2,733,903 2,606,619 -4.66Passenger Trips 3,784,422 3,663,535 3,299,955 -9.92Diesel Fuel Consumed (gallons) 661,573 536,335 475,762 -11.29Employees - FTEs 143.5 145.0 121.1 -16.48Operating Expenses $13,512,037 $12,764,250 $12,731,140 -0.26Farebox Revenues $1,125,487 $1,194,936 $1,303,603 9.09
Demand Response Services (Direct Operated)Revenue Vehicle Hours 149,427 149,191 111,231 -25.44Total Vehicle Hours 158,663 158,160 125,817 -20.45Revenue Vehicle Miles 2,146,194 2,149,032 1,835,847 -14.57Total Vehicle Miles 2,382,848 2,308,811 2,095,692 -9.23Passenger Trips 434,894 432,468 364,803 -15.65Diesel Fuel Consumed (gallons) 240,705 103,916 52,829 -49.16Gasoline Fuel Consumed (gallons) 128,424 318,148 324,113 1.87Employees - FTEs 134.5 122.7 114.9 -6.36Operating Expenses $11,149,642 $10,599,610 $10,227,486 -3.51Farebox Revenues $221,035 $270,828 $283,732 4.76
Demand Response Services (Purchased Transportation)Revenue Vehicle Hours 64,122 61,689 36,281 -41.19Total Vehicle Hours 64,122 61,689 36,281 -41.19Revenue Vehicle Miles 1,199,925 1,147,656 701,903 -38.84Total Vehicle Miles 1,199,925 1,147,656 701,903 -38.84Passenger Trips 234,097 224,042 148,919 -33.53Diesel Fuel Consumed (gallons) - 2,021 15,205 652.35Gasoline Fuel Consumed (gallons) - 11,229 30,409 170.81Operating Expenses $3,796,531 $3,041,980 $2,201,358 -27.63Farebox Revenues $170,704 $135,465 $95,309 -29.64
Vanpooling Services (Direct Operated)Revenue Vehicle Hours 104,489 107,940 109,896 1.81Total Vehicle Hours 104,489 107,940 109,896 1.81Revenue Vehicle Miles 4,408,525 4,548,900 4,962,648 9.10Total Vehicle Miles 4,408,525 4,548,900 4,962,648 9.10Passenger Trips 1,140,777 1,177,060 1,261,068 7.14Diesel Fuel Consumed (gallons) 127,887 30,669 16,925 -44.81Gasoline Fuel Consumed (gallons) 207,351 300,042 318,045 6.00Employees - FTEs 11.2 9.0 7.7 -14.44Operating Expenses $2,651,248 $2,664,299 $2,959,089 11.06Vanpool Revenue $2,005,830 $2,367,733 $2,253,987 -4.80

Ben Franklin Transit
Summary of Public Transportation – 2010 Page 57 November 2011
Revenues2008 2009 2010 % Change
Operating Related RevenuesSales Tax $23,386,739 $22,773,709 $23,897,058 4.93Farebox Revenues $1,517,226 $1,601,229 $1,682,644 5.08Vanpooling Revenue $2,005,830 $2,367,733 $2,253,987 -4.80Federal Section §5307 Operating $0 $3,967,511 $1,096,078 -72.37FTA JARC (§5316) Program $1,427 $0 $0 -Other Federal Operating $17,421 $0 $0 -State Special Needs Grants $1,003,811 $1,056,734 $783,452 -25.86Other Operating Sub-Total $465,514 $236,808 $172,280 -27.25Other-Advertising $100,100 $109,904 $100,000 -9.01Other-Interest $352,849 $100,000 $45,722 -54.28Other-MISC $12,565 $26,904 $26,558 -1.29Total (Excludes Capital Revenues) $28,397,968 $32,003,724 $29,885,499 -6.62
Federal Capital Grant RevenuesFederal Section §5307 Capital Grants $1,409,778 $3,967,511 $3,199,888 -19.35Federal Section §5309 Capital Grants $1,005,035 $382,625 $179,503 -53.09Federal Section §5311 Capital Grants $1,427 $0 $0 -FTA JARC (§5316) Program $17,421 $0 $0 -CM/AQ and Other Federal Grants $0 $176,725 $0 -100.00Total Federal Capital $2,433,661 $4,526,861 $3,379,391 -25.35
State Capital Grant RevenuesState Rural Mobility Grants $0 $315,032 $0 -100.00State Special Needs Grants $0 $774,639 $0 -100.00State Vanpool Grants $757,145 $316,792 $0 -100.00Other State Capital Funds $270,000 $0 $0 -Total State Capital $1,027,145 $1,406,463 $0 -100.00
ExpendituresLocal Capital ExpendituresLocal Funds $897,955 $1,636,052 $2,006,907 22.67Total Local Capital $897,955 $1,636,052 $2,006,907 22.67
Other ExpendituresOther Expenditures $171,641 $0 $0 -Depreciation (Not included in Total Expenditures) $0 $3,638,096 $3,163,320 -13.05
Debt ServiceEnding Balances, December 31Unrestricted Cash and Investments $6,647,662 $3,126,007 $3,529,504 12.91Insurance Funds $500,000 $500,000 $500,000 0.00Total $7,147,662 $3,626,007 $4,029,504 11.13

Ben Franklin Transit
Page 58 Summary of Public Transportation – 2010 November 2011
Total Funds by Source2008 2009 2010 % of Total
OperatingTotal Local Investment $27,546,950 $26,979,479 $28,005,969 93.71Total State Investment $1,003,811 $1,056,734 $783,452 2.62Total Federal Investment $18,848 $3,967,511 $1,096,078 3.67Total Operating $28,569,609 $32,003,724 $29,885,499 100.00
CapitalTotal Local Investment $897,955 $1,636,052 $2,006,907 37.26Total State Investment $1,027,145 $1,406,463 $0 0.00Total Federal Investment $2,433,661 $4,526,861 $3,379,391 62.74Total Capital $4,358,761 $7,569,376 $5,386,298 100.00

Summary of Public Transportation – 2010 Page 59 November 2011
Cowlitz Transit Authority (dba CUBS)
Corey AldrigeTransit Manager254 Oregon WayLongview, WA 98632 360‑442‑5660www.cubs‑bus.com
System Snapshop• Service Area: Cities of Longview and Kelso
• Congressional District: 3
• Legislative District: 19
• Type of Government: PTBA
• Governing Body: Board of Directors
• Tax Authorized: 0.3 percent sales and use tax—0.1 percent sales and use tax approved in November 1987 and an additional 0.2 percent sales and use tax approved in November 2008.
• Fares: $0.60 per boarding for fixed route and paratransit.
• Intermodal Connections: Two hourly routes service the Amtrak depot in Kelso, CUBS connects with intercity bus systems at Greyhound Lines’ stop.
CUBS connects with the rural service provided by Lower Columbia Community Action Council, Columbia County Rider, and Wahkiakum on the Move at the Transit Transfer Facility.
CUBS has designed routes to service local elementary, secondary schools and high schools as well as the Lower Columbia Community College.
• Transit Development Plan: Cowlitz Transit TDP

Cowlitz Transit Authority
Page 60 Summary of Public Transportation – 2010 November 2011
Annual Operating Information
2008 2009 2010 % ChangeFixed Route Services (Direct Operated)Revenue Vehicle Hours 16,920 16,480 16,538 0.35Total Vehicle Hours 16,924 16,787 16,538 -1.48Revenue Vehicle Miles 214,747 212,192 214,702 1.18Total Vehicle Miles 214,803 216,235 218,708 1.14Passenger Trips 361,256 444,789 396,145 -10.94Diesel Fuel Consumed (gallons) 50,081 51,909 50,276 -3.15Employees - FTEs 14.0 14.0 15.0 7.14Operating Expenses $1,546,319 $1,486,564 $1,687,547 13.52Farebox Revenues $125,918 $67,993 $127,443 87.44
Demand Response Services (Purchased Transportation)Revenue Vehicle Hours 15,641 17,147 20,169 17.62Total Vehicle Hours 15,896 17,454 20,169 15.56Revenue Vehicle Miles 153,905 164,559 188,355 14.46Total Vehicle Miles 158,491 170,630 188,355 10.39Passenger Trips 46,895 49,603 55,858 12.61Diesel Fuel Consumed (gallons) 12,378 10,262 9,553 -6.91Gasoline Fuel Consumed (gallons) 9,821 13,511 17,343 28.36Employees - FTEs 10.0 10.0 14.7 47.00Operating Expenses $789,075 $935,938 $1,019,513 8.93Farebox Revenues $5,602 $7,265 $13,892 91.22
RevenuesOperating Related RevenuesSales Tax $1,051,577 $1,962,626 $2,832,264 44.31Farebox Revenues $131,520 $75,258 $141,335 87.80Federal Section §5307 Operating $1,050,000 $430,051 $512,797 19.24State Special Needs Grants $54,940 $44,417 $48,177 8.47Other Operating Sub-Total $115,798 $50,277 $36,630 -27.14Other-Advertising $28,438 $14,717 $12,025 -18.29Other-Interest $46,684 $10,633 $10,552 -0.76Other-Gain (Loss) on Sale of Assets $13,750 $0 $0 -Other-MISC $26,926 $24,927 $14,053 -43.62Total (Excludes Capital Revenues) $2,403,835 $2,562,629 $3,571,203 39.36
Federal Capital Grant RevenuesFederal Section §5307 Capital Grants $403,000 $240,000 $337,172 40.49CM/AQ and Other Federal Grants $0 $68,514 $0 -100.00Total Federal Capital $403,000 $308,514 $337,172 9.29
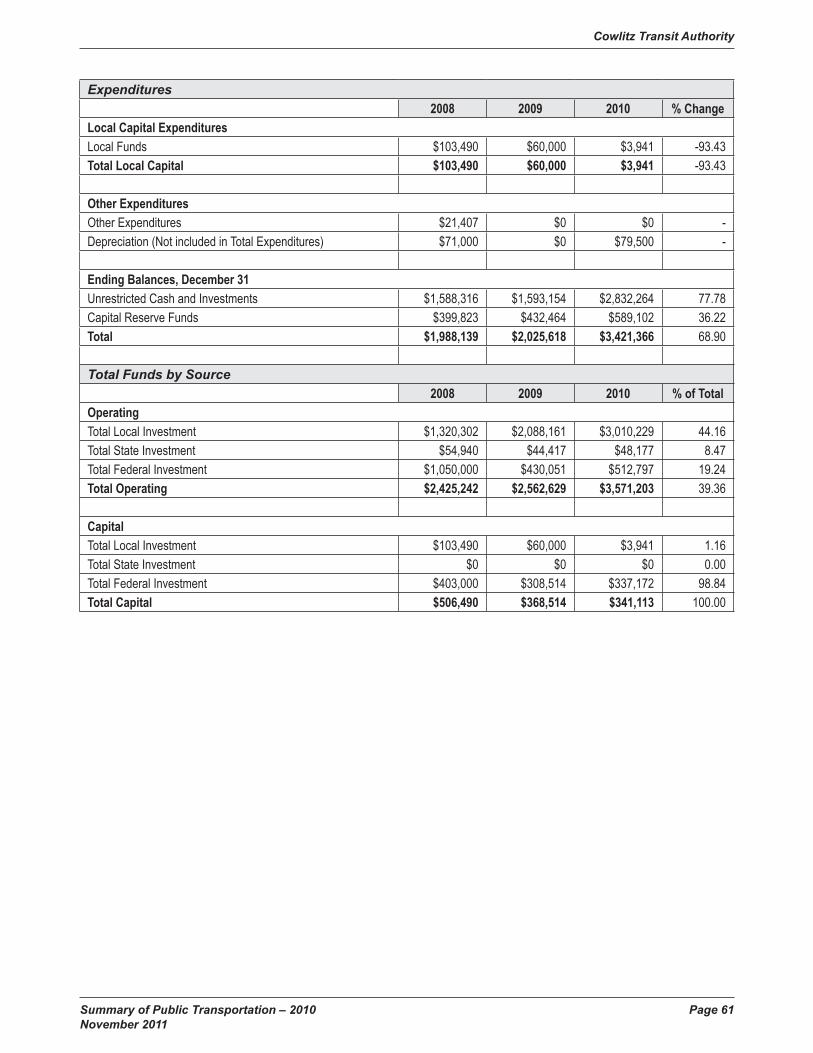
Cowlitz Transit Authority
Summary of Public Transportation – 2010 Page 61 November 2011
Expenditures2008 2009 2010 % Change
Local Capital ExpendituresLocal Funds $103,490 $60,000 $3,941 -93.43Total Local Capital $103,490 $60,000 $3,941 -93.43
Other ExpendituresOther Expenditures $21,407 $0 $0 -Depreciation (Not included in Total Expenditures) $71,000 $0 $79,500 -
Ending Balances, December 31Unrestricted Cash and Investments $1,588,316 $1,593,154 $2,832,264 77.78Capital Reserve Funds $399,823 $432,464 $589,102 36.22Total $1,988,139 $2,025,618 $3,421,366 68.90
Total Funds by Source2008 2009 2010 % of Total
OperatingTotal Local Investment $1,320,302 $2,088,161 $3,010,229 44.16Total State Investment $54,940 $44,417 $48,177 8.47Total Federal Investment $1,050,000 $430,051 $512,797 19.24Total Operating $2,425,242 $2,562,629 $3,571,203 39.36
CapitalTotal Local Investment $103,490 $60,000 $3,941 1.16Total State Investment $0 $0 $0 0.00Total Federal Investment $403,000 $308,514 $337,172 98.84Total Capital $506,490 $368,514 $341,113 100.00

Cowlitz Transit Authority
Page 62 Summary of Public Transportation – 2010 November 2011

Summary of Public Transportation – 2010 Page 63 November 2011
Intercity Transit
Michael HarbourGeneral Manager526 Pattison SE, PO Box 659Olympia, WA 98507‑0659360‑705‑5855www.intercitytransit.com
System Snapshot• Service Area: Cities of Olympia, Lacey, Tumwater, and Yelm and the area approx‑
imating the urban growth areas of these cities that extend into Thurston County.
• Congressional District: 3 and 9
• Legislative District: 2, 20, 22, and 35
• Type of Government: PTBA
• Governing Body: Nine member Transit Authority with one Thurston County Commissioner, one Council Member each from the cities of Olympia, Lacey, Tumwater, and Yelm; three citizen representatives appointed by the Authority and a labor representative.
• Tax Authorized: 0.8 percent total sales and use tax: 0.3 percent approved September 1980, an additional 0.3 percent approved September 2002 and 0.2 percent approved August 2010.
• Fares: $1.00 per boarding fixed route and Dial-A-Lift (para-transit) service. A reduced fare of $.50 on fixed route is available for senior, people with disabilities, and people with Medicaid cards that have a Regional Reduced Fare Permit.
• Intermodal Connections: Intercity Transit maintains Centennial Station, the local Amtrak depot, and provides connections to the station with fixed route bus service. Interstate Greyhound bus station and service is within a block or two of most local service routes in downtown Olympia.
Intercity Transit connects with Pierce Transit, Grays Harbor Transportation, and Mason County Transportation at the Olympia Transit Center and Capital Mall transfer center in Olympia, and with Pierce Transit and Sound Transit at the Lakewood SR 512 Park and Ride Lot and at various stops throughout downtown Tacoma.
Intercity Transit provides service to many of the public schools in the service area, as well as South Puget Sound Community College, The Evergreen State College and Saint Martin’s University. Intercity Transit also has contracts for student and/or employee pass programs with South Puget Sound Community College, The Evergreen State College, Saint Martins University, Washington State (all state agencies in Thurston County), Thurston Regional Planning Council, and Thurston County. Intercity Transit currently manages two park and ride lots in Thurston County.
• Transit Development Plan: Intercity Transit TDP

Intercity Transit
Page 64 Summary of Public Transportation – 2010 November 2011
Annual Operating Information
2008 2009 2010 % ChangeFixed Route Services (Direct Operated)Revenue Vehicle Hours 192,838 194,041 193,012 -0.53Total Vehicle Hours 200,798 202,182 201,130 -0.52Revenue Vehicle Miles 2,579,552 2,604,406 2,604,577 0.01Total Vehicle Miles 2,734,597 2,760,950 2,760,246 -0.03Passenger Trips 4,318,859 4,298,328 4,313,178 0.35Diesel Fuel Consumed (gallons) 642,564 629,141 596,313 -5.22Employees - FTEs 192.0 212.0 213.0 0.47Operating Expenses $19,976,245 $20,829,024 $20,466,991 -1.74Farebox Revenues $1,850,861 $2,306,799 $2,414,920 4.69
Demand Response Services (Direct Operated)Revenue Vehicle Hours 59,325 65,499 66,380 1.35Total Vehicle Hours 63,021 69,549 70,351 1.15Revenue Vehicle Miles 768,350 828,249 841,921 1.65Total Vehicle Miles 841,594 906,832 921,565 1.62Passenger Trips 130,849 148,312 152,977 3.15Diesel Fuel Consumed (gallons) 96,555 100,385 101,762 1.37Gasoline Fuel Consumed (gallons) 3,504 3,541 3,694 4.32Employees - FTEs 70.0 71.0 72.0 1.41Operating Expenses $5,134,911 $5,759,806 $5,830,989 1.24Farebox Revenues $124,936 $149,423 $160,737 7.57
Vanpooling Services (Direct Operated)Revenue Vehicle Hours 79,912 82,797 79,214 -4.33Total Vehicle Hours 79,912 82,797 79,214 -4.33Revenue Vehicle Miles 3,083,780 3,185,107 2,972,366 -6.68Total Vehicle Miles 3,083,780 3,185,107 2,972,366 -6.68Passenger Trips 689,030 680,664 635,099 -6.69Gasoline Fuel Consumed (gallons) 201,680 218,416 197,410 -9.62Employees - FTEs 6.0 8.0 9.0 12.50Operating Expenses $1,447,008 $1,496,499 $1,579,199 5.53Vanpool Revenue $1,128,136 $1,485,139 $1,367,099 -7.95

Intercity Transit
Summary of Public Transportation – 2010 Page 65 November 2011
Revenues2008 2009 2010 % Change
Operating Related RevenuesSales Tax $22,230,829 $20,758,924 $21,153,075 1.90Farebox Revenues $1,975,797 $2,456,222 $2,575,657 4.86Vanpooling Revenue $1,128,136 $1,485,139 $1,367,099 -7.95Federal Section §5307 Operating $10,064 $69,729 $66,489 -4.65Federal Section §5307 Preventative $2,405,749 $2,461,967 $2,670,212 8.46FTA JARC (§5316) Program $137,058 $141,633 $147,338 4.03Other Federal Operating $36,030 $0 $0 -State Special Needs Grants $243,720 $392,661 $301,853 -23.13Other State Operating Grants $690,468 $771,433 $47,294 -93.87Other Operating Sub-Total $1,466,275 $1,016,926 $771,740 -24.11Other-Advertising $341,618 $252,732 $255,358 1.04Other-Interest $943,374 $623,698 $402,557 -35.46Other-Gain (Loss) on Sale of Assets $47,286 $43,943 $13,440 -69.41Other-MISC $133,997 $96,553 $100,385 3.97Total (Excludes Capital Revenues) $30,324,126 $29,554,634 $29,100,757 -1.54
Federal Capital Grant RevenuesFederal Section §5307 Capital Grants $48,998 $362,210 $0 -100.00Federal Section §5309 Capital Grants $0 $0 $3,145,527 -FTA JARC (§5316) Program $35,200 $71,204 $0 -100.00Total Federal Capital $84,198 $433,414 $3,145,527 625.76
State Capital Grant RevenuesState Regional Mobility Grants $0 $771,433 $0 -100.00State Special Needs Grants $80,122 $769,818 $0 -100.00State Vanpool Grants $480,035 $506,010 $0 -100.00Other State Capital Funds $0 $0 $1,872,550 -Total State Capital $560,157 $2,047,261 $1,872,550 -8.53
ExpendituresOther ExpendituresOther Expenditures $275,171 $211,416 $0 -100.00Depreciation (Not included in Total Expenditures) $3,382,969 $4,356,677 $4,531,902 4.02
Ending Balances, December 31Unrestricted Cash and Investments $20,887,607 $20,723,047 $19,153,298 -7.57Total $20,887,607 $20,723,047 $19,153,298 -7.57

Intercity Transit
Page 66 Summary of Public Transportation – 2010 November 2011
Total Funds by Source2008 2009 2010 % of Total
OperatingTotal Local Investment $27,076,208 $25,928,627 $25,867,571 88.89Total State Investment $934,188 $1,164,094 $349,147 1.20Total Federal Investment $2,588,901 $2,673,329 $2,884,039 9.91Total Operating $30,599,297 $29,766,050 $29,100,757 100.00
CapitalTotal Local Investment $0 $0 $0 0.00Total State Investment $560,157 $2,047,261 $1,872,550 37.32Total Federal Investment $84,198 $433,414 $3,145,527 62.68Total Capital $644,355 $2,480,675 $5,018,077 100.00

Summary of Public Transportation – 2010 Page 67 November 2011
Kitsap Transit
Richard M. HayesExecutive Director60 Washington Avenue, Suite 200Bremerton, WA 98337‑1888360‑377‑7086www.kitsaptransit.org
System Snapshot• Service Area: Kitsap County
• Congressional District: 1 and 6
• Legislative District: 23, 26, and 35
• Type of Government: PTBA
• Governing Body: Board of Commissioners
• Tax Authorized: Current authorization is 0.8 percent of sales tax (0.5 percent in 1993 increased to 0.8 in 2001).
• Fares: Base fare is $2.00 per trip for Routed and Paratransit fare ($1.00 reduced fare). $50 for monthly pass.
• Intermodal Connections: Kitsap Transit provides service to all 4 WSF terminals in Kitsap County as well as to the passenger only ferries that operate between Port Orchard and Bremerton and Annapolis and Bremerton. Kitsap Transit also provides service to many area elementary, middle and high Schools as well as both branches of Olympic College. Mason Transit connections are available at the Bremerton Transportation Center and Jefferson Transit meets Kitsap Transit at our Poulsbo Transfer Center.
• Transit Development Plan: Kitsap Transit TDP

Kitsap Transit
Page 68 Summary of Public Transportation – 2010 November 2011
Annual Operating Information
2008 2009 2010 % ChangeFixed Route Services (Direct Operated)Revenue Vehicle Hours 130,566 119,569 104,712 -12.43Total Vehicle Hours 162,748 151,031 135,511 -10.28Revenue Vehicle Miles 2,375,439 2,204,032 1,950,161 -11.52Total Vehicle Miles 2,901,725 2,686,791 2,419,855 -9.94Passenger Trips 4,110,470 3,466,709 2,877,935 -16.98Diesel Fuel Consumed (gallons) 582,733 539,189 476,866 -11.56Employees - FTEs 180.8 162.3 152.6 -5.95Operating Expenses $20,286,896 $18,013,706 $17,589,787 -2.35Farebox Revenues $3,414,453 $4,649,636 $5,935,508 27.66
Demand Response Services (Direct Operated)Revenue Vehicle Hours 112,821 90,152 81,029 -10.12Total Vehicle Hours 125,995 101,429 88,923 -12.33Revenue Vehicle Miles 1,914,683 1,548,692 1,425,401 -7.96Total Vehicle Miles 2,098,580 1,699,407 1,566,841 -7.80Passenger Trips 428,537 352,874 309,031 -12.42Diesel Fuel Consumed (gallons) 226,136 179,410 159,129 -11.30Gasoline Fuel Consumed (gallons) 59 - - -Employees - FTEs 99.8 81.8 76.8 -6.16Operating Expenses $9,548,676 $7,797,241 $7,614,950 -2.34Farebox Revenues $323,069 $349,719 $306,714 -12.30
Vanpooling Services (Direct Operated)Revenue Vehicle Hours 45,056 38,713 37,256 -3.76Total Vehicle Hours 45,056 38,713 37,256 -3.76Revenue Vehicle Miles 1,371,729 1,159,888 1,146,414 -1.16Total Vehicle Miles 1,371,729 1,159,888 1,146,414 -1.16Passenger Trips 312,804 286,858 259,696 -9.47Diesel Fuel Consumed (gallons) 77,205 58,041 21,880 -62.30Gasoline Fuel Consumed (gallons) 12,420 20,728 55,178 166.20Employees - FTEs 8.9 8.9 8.2 -8.00Operating Expenses $1,455,127 $1,392,486 $1,354,908 -2.70Vanpool Revenue $646,680 $846,431 $958,583 13.25

Kitsap Transit
Summary of Public Transportation – 2010 Page 69 November 2011
Revenues2008 2009 2010 % Change
Operating Related RevenuesSales Tax $28,382,349 $25,934,418 $25,758,170 -0.68Farebox Revenues $3,737,522 $4,999,355 $6,242,222 24.86Vanpooling Revenue $646,680 $846,431 $958,583 13.25State Rural Mobility Grants $0 $341,589 $426,451 24.84State Special Needs Grants $0 $2,022,065 $0 -100.00Other State Operating Grants $80,000 $80,000 $82,964 3.71Other Operating Sub-Total $911,964 $870,951 $761,025 -12.62Other-Advertising $56,000 $56,000 $64,842 15.79Other-Interest $261,888 $150,557 $138,342 -8.11Other-Gain (Loss) on Sale of Assets $0 $0 $29,460 -Other-MISC $594,076 $664,394 $528,381 -20.47Total (Excludes Capital Revenues) $34,076,403 $35,094,809 $34,229,415 -2.47
Federal Capital Grant RevenuesFederal Section §5307 Capital Grants $3,944,487 $9,105,683 $3,922,360 -56.92Federal Section §5309 Capital Grants $0 $3,343,329 $0 -100.00FTA JARC (§5316) Program $15,565 $3,475 $0 -100.00CM/AQ and Other Federal Grants $53,999 $0 $189,312 -Total Federal Capital $4,014,051 $12,452,487 $4,111,672 -66.98
State Capital Grant RevenuesState Rural Mobility Grants $50,000 $0 $0 -State Regional Mobility Grants $0 $2,285,229 $61,770 -97.30State Vanpool Grants $121,748 $0 $0 -Total State Capital $171,748 $2,285,229 $61,770 -97.30
ExpendituresLocal Capital ExpendituresLocal Funds $2,168,244 $2,212,703 $1,727,808 -21.91Total Local Capital $2,168,244 $2,212,703 $1,727,808 -21.91
Other ExpendituresOther Expenditures $283,823 $259,344 $0 -100.00Depreciation (Not included in Total Expenditures) $6,446,816 $6,133,825 $6,261,115 2.08
Debt ServiceInterest $799,669 $715,858 $724,826 1.25Principal $2,449,500 $2,544,500 $2,644,500 3.93Total Debt Service $3,249,169 $3,260,358 $3,369,326 3.34
Ending Balances, December 31Unrestricted Cash and Investments $4,835,410 $5,417,394 $6,564,161 21.17Debt Service Funds $1,387,100 $1,397,926 $1,490,099 6.59Total $6,222,510 $6,815,320 $8,054,260 18.18

Kitsap Transit
Page 70 Summary of Public Transportation – 2010 November 2011
Total Funds by Source2008 2009 2010 % of Total
OperatingTotal Local Investment $33,962,338 $32,910,499 $33,720,000 98.51Total State Investment $80,000 $2,443,654 $509,415 1.49Total Federal Investment $0 $0 $0 0.00Total Operating $34,042,338 $35,354,153 $34,229,415 100.00
CapitalTotal Local Investment $2,168,244 $2,212,703 $1,727,808 29.28Total State Investment $171,748 $2,285,229 $61,770 1.05Total Federal Investment $4,014,051 $12,452,487 $4,111,672 69.67Total Capital $6,354,043 $16,950,419 $5,901,250 100.00

Summary of Public Transportation – 2010 Page 71 November 2011
Link Transit
Richard DeRockGeneral Manager2700 Euclid AvenueWenatchee, WA 98801509‑664‑7600www.linktransit.com
System Snapshot• Service Area: Chelan County and western and south Douglas County.
• Congressional District: 4
• Legislative District: 12
• Type of Government: PTBA
• Governing Body: Board of Directors
• Tax Authorized: Link currently receives 4/10th of 1 percent. This was voted in by the citizens of Chelan and the western 1/3 of Douglas County in 1989. Service Began on December 16, 1991. Link has not gone out to the voters to ask for additional sales tax. It has been talked about with the Board, but in our current environment, staff and the Board feel the times are not right yet.
• Fares: One zone $1.25; Two zones $2.50. Day pass: One zone $3.00; Two zones $6.00. Monthly pass: One zone $40; Two zone $80
Annual school zone pass for students (June–Aug): $120
Reduced fares for seniors (65 and older), ADA eligible and medicare card holders can ride at half fare. Wenatchee Valley College: Tuition payments include a $3.25 fee for transit. The ASB card acts as the pass.
• Intermodal Connections: Link Transit’s regional service from Wenatchee travels south to Malaga and Rock Island (10 miles) north to Lake Chelan and Manson (50 miles) and north to Leavenworth (20 miles) and up to Lake Wenatchee (20 miles north of Leavenworth). Within the urban boundaries of Wenatchee and East Wenatchee, Link serves all middle schools and high schools, Wenatchee Valley Community College, the Wenatchee Valley Clinic, Central Washington Hospital, assisted living centers, DSHS, unemployment office and the two malls. Link’s intermodal center, Columbia Center, houses North Western Stagelines and Amtrak. Grant Transit provides service to Columbia Center weekly.
• Transit Development Plan: Link Transit TDP

Link Transit
Page 72 Summary of Public Transportation – 2010 November 2011
Annual Operating Information
2008 2009 2010 % ChangeFixed Route Services (Direct Operated)Revenue Vehicle Hours 60,460 62,353 65,319 4.76Total Vehicle Hours 64,027 67,186 69,154 2.93Revenue Vehicle Miles 1,132,162 1,182,687 1,298,711 9.81Total Vehicle Miles 1,245,059 1,256,926 1,367,379 8.79Passenger Trips 820,723 788,092 829,909 5.31Diesel Fuel Consumed (gallons) 213,852 222,406 209,340 -5.87Employees - FTEs 57.3 58.0 65.5 12.93Operating Expenses $5,796,461 $6,135,449 $6,272,078 2.23Farebox Revenues $448,359 $520,394 $553,301 6.32
Route Deviated Services (Direct Operated)Revenue Vehicle Hours 25,687 25,468 18,645 -26.79Total Vehicle Hours 27,046 27,442 20,484 -25.36Revenue Vehicle Miles 567,001 582,518 417,731 -28.29Total Vehicle Miles 639,466 619,082 479,314 -22.58Passenger Trips 125,038 117,761 129,292 9.79Diesel Fuel Consumed (gallons) 79,050 76,679 66,107 -13.79Employees - FTEs 25.0 24.0 18.9 -21.25Operating Expenses $1,890,044 $1,937,510 $1,769,047 -8.69Farebox Revenues $68,105 $77,760 $90,072 15.83
Demand Response Services (Direct Operated)Revenue Vehicle Hours 25,993 20,884 19,830 -5.05Total Vehicle Hours 27,934 22,010 20,997 -4.60Revenue Vehicle Miles 344,476 216,561 255,657 18.05Total Vehicle Miles 394,496 237,750 267,110 12.35Passenger Trips 69,549 74,995 60,551 -19.26Diesel Fuel Consumed (gallons) 11,434 6,499 8,835 35.94Gasoline Fuel Consumed (gallons) 20,976 12,994 16,025 23.33Employees - FTEs 24.7 23.0 18.5 -19.57Operating Expenses $2,246,707 $1,672,014 $1,671,284 -0.04Farebox Revenues $51,079 $58,839 $40,614 -30.97

Link Transit
Summary of Public Transportation – 2010 Page 73 November 2011
2008 2009 2010 % ChangeDemand Response Services (Purchased Transportation)Revenue Vehicle Hours - - 1,952 -Total Vehicle Hours - - 1,952 -Revenue Vehicle Miles - - 52,037 -Total Vehicle Miles - - 52,037 -Passenger Trips - - 9,403 -Diesel Fuel Consumed (gallons) - - 376 -Gasoline Fuel Consumed (gallons) - - 3,476 -CNG Fuel Consumed (Therms) - - - -Employees - FTEs - - - -Operating Expenses $0 $0 $136,259 -Farebox Revenues $0 $0 $12,328 -
Vanpooling Services (Direct Operated)Revenue Vehicle Hours 1,020 340 - -100.00Total Vehicle Hours 1,020 340 - -100.00Revenue Vehicle Miles 42,075 6,970 - -100.00Total Vehicle Miles 42,075 6,970 - -100.00Passenger Trips 3,060 935 - -100.00Gasoline Fuel Consumed (gallons) 3,861 467 - -100.00Employees - FTEs 1.0 0.1 - -100.00Operating Expenses $14,738 $9,349 $0 -100.00Vanpool Revenue $6,154 $1,953 $0 -100.00
RevenuesOperating Related RevenuesSales Tax $8,793,834 $7,514,737 $7,460,242 -0.73Farebox Revenues $567,543 $656,993 $696,315 5.99Vanpooling Revenue $6,154 $1,953 $0 -100.00Federal Section §5307 Preventative $1,349,624 $1,426,231 $1,431,342 0.36Federal Section §5311 Operating $525,000 $0 $0 -FTA JARC (§5316) Program $112,500 $371,251 $517,500 39.39Other Federal Operating $31,001 $35,583 $121,138 240.44State Rural Mobility Grants $77,768 $38,882 $0 -100.00State Special Needs Grants $342,937 $132,216 $264,432 100.00Other State Operating Grants $105,480 $0 $0 -Other Operating Sub-Total -$5,626 $140,515 $51,734 -63.18Other-Advertising $25,615 $30,944 $36,334 17.42Other-Interest $86,471 $33,795 $12,289 -63.64Other-Gain (Loss) on Sale of Assets -$210,677 $0 -$75,433 -Other-MISC $92,965 $75,776 $78,544 3.65Total (Excludes Capital Revenues) $12,018,301 $10,318,361 $10,542,703 2.17

Link Transit
Page 74 Summary of Public Transportation – 2010 November 2011
2008 2009 2010 % ChangeFederal Capital Grant RevenuesFederal Section §5307 Capital Grants $0 $0 $645,703 -Federal Section §5309 Capital Grants $539,000 $0 $2,457,547 -CM/AQ and Other Federal Grants $0 $0 $1,623,302 -Total Federal Capital $539,000 $0 $4,726,552 -
ExpendituresLocal Capital ExpendituresLocal Funds $800,000 $200,000 $230,000 15.00Total Local Capital $800,000 $200,000 $230,000 15.00
Other ExpendituresDepreciation (Not included in Total Expenditures) $0 $0 $12,763,705 -
Debt ServiceInterest $109,256 $124,259 $90,529 -27.14Principal $176,760 $229,259 $2,880,534 1156.45Total Debt Service $286,016 $353,518 $2,971,063 740.43
Ending Balances, December 31General Fund $1,068,708 $2,047,944 $1,016,356 -50.37Unrestricted Cash and Investments $420,393 $213,304 $679,705 218.66Capital Reserve Funds $252,364 $176,372 $190,433 7.97Contingency Reserve $1,080,000 $1,080,000 $1,080,000 0.00Other (Please Explain in Comments Section at End) $67,547 $0 $0 -Total $2,889,012 $3,517,620 $2,966,494 -15.67
Total Funds by Source2008 2009 2010 % of Total
OperatingTotal Local Investment $9,361,905 $8,314,198 $8,208,291 77.86Total State Investment $526,185 $171,098 $264,432 2.51Total Federal Investment $2,018,125 $1,833,065 $2,069,980 19.63Total Operating $11,906,215 $10,318,361 $10,542,703 100.00
CapitalTotal Local Investment $800,000 $200,000 $230,000 4.64Total State Investment $0 $0 $0 0.00Total Federal Investment $539,000 $0 $4,726,552 95.36Total Capital $1,339,000 $200,000 $4,956,552 100.00

Summary of Public Transportation – 2010 Page 75 November 2011
City of Selah Transportation Service
Frank SweetSelah TransitCity Administrator115 West Naches AvenueSelah, WA 98942509‑698‑7333www.ci.selah.wa.us
System Snapshot• Service Area: City of Selah
• Congressional District: 1
• Legislative District: 1
• Type of Government: City
• Governing Body: City Council
• Tax Authorized: 0.3 percent total sales and use tax approved in July 2007.
• Fares: $0.75 per boarding for fixed route; $1.50 per boarding for paratransit ‑ these fares are charged for the service; however, as part of the agreement with Yakima Transit, Selah does not retain the funds from the fare as partial consideration for a reduced service rate.
• Intermodal Connections: Selah purchases transit services through the city of Yakima’s Yakima Transit. Yakima Transit provides fixed-route, demand response, and vanpool services within the Cities of Yakima and Selah. We provide non‑exclusive fixed-route service to all k-12 schools as well as Perry Technical College and Yakima Valley Community College. Yakima Transit provides connectivity to the Yakima Airport, Greyhound, Central Washington Airporter Shuttle, and Amtrak. Yakima Transit also connects up with all the other transit providers in the area at Minor’s in Union Gap (Pahto Public Passage, Union Gap Transit, & People for People’s Community Connector).
• Transit Development Plan: Information included in the Yakima Transit TDP

City of Selah Transportation Service
Page 76 Summary of Public Transportation – 2010 November 2011
Annual Operating Information
2008 2009 2010 % ChangeFixed Route Services (Purchased Transportation)Revenue Vehicle Hours 2,258 2,276 3,265 43.47Total Vehicle Hours 2,357 2,372 3,495 47.32Revenue Vehicle Miles 34,657 34,657 46,849 35.18Total Vehicle Miles 34,657 34,657 48,800 40.81Passenger Trips 53,602 59,709 64,098 7.35Diesel Fuel Consumed (gallons) 7,455 7,449 10,624 42.62Employees - FTEs 2.6 2.6 2.7 5.45Operating Expenses $108,231 $121,393 $181,272 49.33
Demand Response Services (Purchased Transportation)Revenue Vehicle Hours 1,694 2,226 1,556 -30.10Total Vehicle Hours 1,860 2,530 1,748 -30.90Revenue Vehicle Miles 21,070 21,044 15,677 -25.50Total Vehicle Miles 22,875 24,270 18,016 -25.77Passenger Trips 4,207 4,206 3,320 -21.07Diesel Fuel Consumed (gallons) 404.13 - - -Gasoline Fuel Consumed (gallons) 972.38 2,200 1,678 -23.74Employees - FTEs 0 2.0 0.8 -58.00Operating Expenses $40,741 $49,384 $43,192 -12.54
RevenuesOperating Related RevenuesSales Tax $276,090 $277,279 $281,495 1.52Other Operating Sub-Total $3,485 $2,947 $1,721 -41.60Other-Interest $3,485 $2,947 $1,721 -41.60Total (Excludes Capital Revenues) $279,575 $280,226 $283,216 1.07
State Capital Grant RevenuesOther State Capital Funds $0 $31,166 $0 -100.00Total State Capital $0 $31,166 $0 -100.00
ExpendituresEnding Balances, December 31Unrestricted Cash and Investments $159,826 $298,887 $357,530 19.62Total $159,826 $298,887 $357,530 19.62
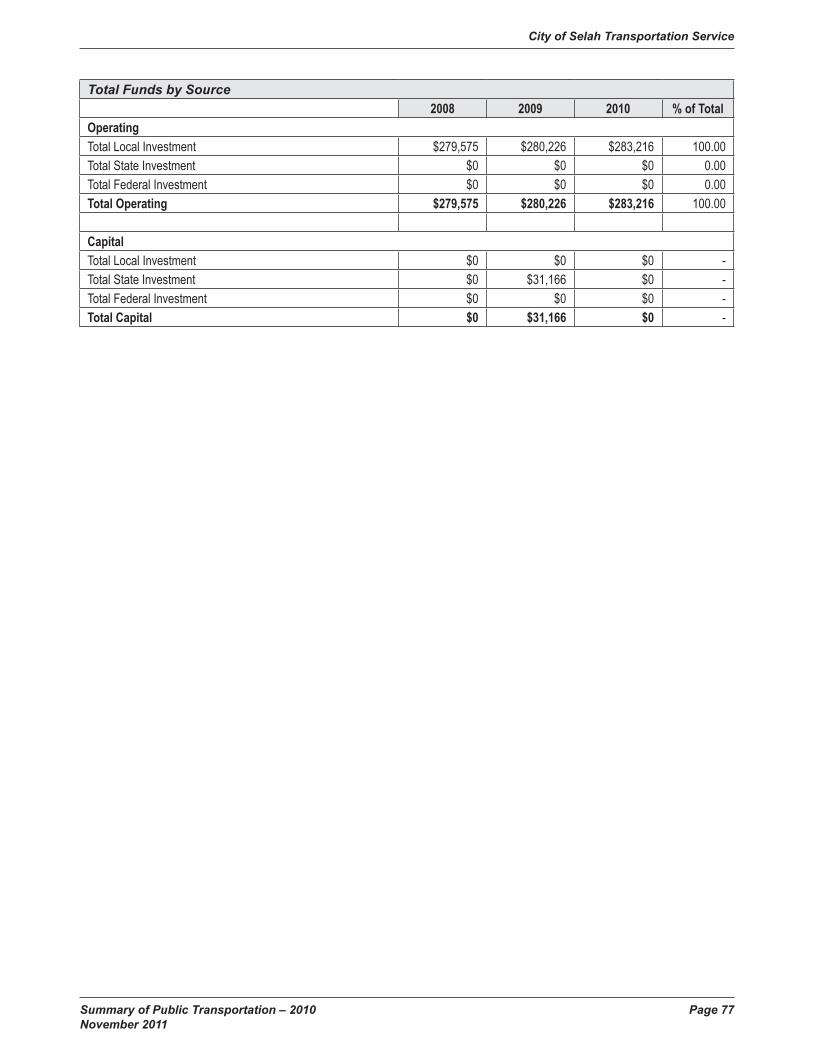
City of Selah Transportation Service
Summary of Public Transportation – 2010 Page 77 November 2011
Total Funds by Source2008 2009 2010 % of Total
OperatingTotal Local Investment $279,575 $280,226 $283,216 100.00Total State Investment $0 $0 $0 0.00Total Federal Investment $0 $0 $0 0.00Total Operating $279,575 $280,226 $283,216 100.00
CapitalTotal Local Investment $0 $0 $0 -Total State Investment $0 $31,166 $0 -Total Federal Investment $0 $0 $0 -Total Capital $0 $31,166 $0 -

City of Selah Transportation Service
Page 78 Summary of Public Transportation – 2010 November 2011

Summary of Public Transportation – 2010 Page 79 November 2011
Skagit Transit
Dale O’Brien Executive Director600 County Shop LaneBurlington, WA 98233360‑757‑8801www.skagittransit.org
System Snapshot• Service Area: Urban and Rural areas in Skagit County as well as connector
service to Bellingham and express commuter service to Everett.
• Congressional District: 2
• Legislative District: 10, 39, and 40
• Type of Government: PTBA
• Governing Body: Board of Directors
• Tax Authorized: 0.2 percent sales tax in PTBA approved in 1993 and an additional 0.2 percent sales tax approved in November 2008.
• Fares: $1.00 standard fare per boarding with a 90 minute transfer. $2.00 for commuter routes. Dial‑a‑Ride is on a Donation basis.
• Intermodal Connections: Skagit Transit provides transportation between towns and cities in Skagit County; Mount Vernon, Burlington, Sedro Woolley, Anacortes, LaConner, Hamilton, Lyman and Concrete. Skagit Transit links with Island Transit and Whatcom Transit to provide connector service between Skagit County, Island County, Whatcom County and Snohomish County (Everett Station). Skagit Transit connects with AMTRAK and Greyhound at Skagit Station in downtown Mount Vernon and with the Washington State Ferry Terminal in Anacortes serving the San Juan Islands.
• Transit Development Plan: Skagit Transit TDP

Skagit Transit
Page 80 Summary of Public Transportation – 2010 November 2011
Annual Operating Information
2008 2009 2010 % ChangeFixed Route Services (Direct Operated)Revenue Vehicle Hours 34,473 38,295 41,762 9.05Total Vehicle Hours 37,062 40,615 45,515 12.06Revenue Vehicle Miles 654,458 703,460 732,132 4.08Total Vehicle Miles 705,409 756,974 800,735 5.78Passenger Trips 501,664 508,212 544,518 7.14Diesel Fuel Consumed (gallons) 123,048 139,362 149,370 7.18Employees - FTEs 39.6 42.5 43.7 2.82Operating Expenses $3,822,378 $4,206,148 $4,358,036 3.61Farebox Revenues $296,629 $343,323 $376,764 9.74
Demand Response Services (Direct Operated)Revenue Vehicle Hours 22,822 28,254 29,492 4.38Total Vehicle Hours 27,424 31,874 32,713 2.63Revenue Vehicle Miles 276,290 328,148 358,703 9.31Total Vehicle Miles 331,738 389,488 422,530 8.48Passenger Trips 58,740 68,016 74,380 9.36Diesel Fuel Consumed (gallons) 35,991 40,931 43,497 6.27Employees - FTEs 29.3 29.7 33.3 12.12Operating Expenses $2,476,676 $2,725,414 $2,866,022 5.16Farebox Revenues $10,968 $13,144 $13,804 5.02
Vanpooling Services (Direct Operated)Revenue Vehicle Hours 19,200 21,600 20,095 -6.97Total Vehicle Hours 19,200 21,600 20,095 -6.97Revenue Vehicle Miles 741,632 795,520 733,993 -7.73Total Vehicle Miles 741,632 795,520 733,993 -7.73Passenger Trips 107,520 100,239 87,300 -12.91Gasoline Fuel Consumed (gallons) 45,875 48,805 43,937 -9.97Employees - FTEs 2.4 2.2 2.0 -9.09Operating Expenses $436,490 $407,002 $411,498 1.10Vanpool Revenue $257,403 $349,570 $308,403 -11.78

Skagit Transit
Summary of Public Transportation – 2010 Page 81 November 2011
Revenues2008 2009 2010 % Change
Operating Related RevenuesSales Tax $4,601,130 $7,154,633 $7,854,632 9.78Farebox Revenues $307,597 $356,467 $390,568 9.57Vanpooling Revenue $257,403 $349,570 $308,403 -11.78Federal Section §5307 Operating $932,630 $1,055,563 $937,584 -11.18Federal Section §5311 Operating $0 $0 $246,976 -FTA JARC (§5316) Program $0 $61,836 $114,008 84.37Other Federal Operating $210,901 $163,446 $89,251 -45.39State Regional Mobility Operating Grants $0 $328,963 $349,245 6.17State Special Needs Grants $169,818 $155,369 $169,625 9.18Other State Operating Grants $560,399 $122,805 $172,617 40.56Other Operating Sub-Total $295,167 $102,683 -$103,781 -201.07Other-Interest $186,025 $48,886 $26,185 -46.44Other-Gain (Loss) on Sale of Assets -$1,494 -$27,652 -$176,496 538.28Other-MISC $110,636 $81,449 $46,530 -42.87Total (Excludes Capital Revenues) $7,335,045 $9,851,335 $10,529,128 6.88
Federal Capital Grant RevenuesFederal Section §5307 Capital Grants $0 $0 $2,517 -Federal Section §5309 Capital Grants $0 $363,573 $7,782 -97.86Federal Section §5311 Capital Grants $0 $0 $93,038 -FTA JARC (§5316) Program $0 $277,467 $0 -100.00Federal STP Grants $0 $0 $24,712 -CM/AQ and Other Federal Grants $222,832 $192,942 $0 -100.00Total Federal Capital $222,832 $833,982 $128,049 -84.65
State Capital Grant RevenuesState Regional Mobility Grants $0 $866,410 $335,978 -61.22State Vanpool Grants $198,497 $38,900 $0 -100.00Other State Capital Funds $1,399,046 $1,574,251 $447,751 -71.56Total State Capital $1,597,543 $2,479,561 $783,729 -68.39
ExpendituresLocal Capital ExpendituresLocal Funds $10,000 $0 $0 -Total Local Capital $10,000 $0 $0 -
Other ExpendituresDepreciation (Not included in Total Expenditures) $896,864 $1,042,614 $1,373,562 31.74

Skagit Transit
Page 82 Summary of Public Transportation – 2010 November 2011
2008 2009 2010 % ChangeEnding Balances, December 31General Fund $2,058,436 $1,337,242 $2,789,882 108.63Unrestricted Cash and Investments $8,219,460 $6,619,814 $5,837,145 -11.82Operating Reserve $981,232 $1,205,980 $1,205,980 0.00Capital Reserve Funds $3,745,894 $3,269,548 $2,477,573 -24.22Contingency Reserve $1,433,898 $2,144,285 $2,150,143 0.27Total $16,438,920 $14,576,869 $14,460,723 -0.80
Total Funds by Source2008 2009 2010 % of Total
OperatingTotal Local Investment $5,461,297 $7,963,353 $8,449,822 80.25Total State Investment $730,217 $607,137 $691,487 6.57Total Federal Investment $1,143,531 $1,280,845 $1,387,819 13.18Total Operating $7,335,045 $9,851,335 $10,529,128 100.00
CapitalTotal Local Investment $10,000 $0 $0 0.00Total State Investment $1,597,543 $2,479,561 $783,729 85.96Total Federal Investment $222,832 $833,982 $128,049 14.04Total Capital $1,830,375 $3,313,543 $911,778 100.00

Summary of Public Transportation – 2010 Page 83 November 2011
Union Gap Transit
Ron DavisChief Operating Officer2001 Oak AvenueYakima, WA 98903509‑539‑3877www.tctransportservices.com
System Snapshot• Service Area: City of Union Gap
• Congressional District: 4
• Legislative District: 14
• Type of Government: City
• Governing Body: City Council
• Tax Authorized: 0.2 percent total sales tax approved in September 2008.
• Fares: Fare Free
• Intermodal Connections: Union Gap Transit provides service between Union Gap and the cities of Yakima and Selah Washington.
We provide service to all Union Gap schools plus connections to Greyhound, Yakima Airport, Yakima Transit, Community Connector for service throughout the lower Yakima Valley, the Yakama Indian Nation Transit Service.
• Transit Development Plan: City of Union Gap Transit TDP

Union Gap Transit
Page 84 Summary of Public Transportation – 2010 November 2011
Annual Operating Information
2008 2009 2010 % ChangeFixed Route Services (Purchased Transportation)Revenue Vehicle Hours 4,051 7,280 7,280 0.00Total Vehicle Hours 4,347 7,880 7,880 0.00Revenue Vehicle Miles 69,073 149,367 165,117 10.54Total Vehicle Miles 71,562 179,239 194,989 8.79Passenger Trips 60,060 80,835 83,500 3.30Diesel Fuel Consumed (gallons) 11,374 - - -Gasoline Fuel Consumed (gallons) 1,659 25,605 24,373 -4.81Employees - FTEs 3.0 4.0 4.0 0.00Operating Expenses $365,886 $275,259 $275,259 0.00
Demand Response Services (Purchased Transportation)Revenue Vehicle Hours 1,498 7,540 7,540 0.00Total Vehicle Hours 1,597 7,690 7,690 0.00Revenue Vehicle Miles 11,706 10,530 23,284 121.12Total Vehicle Miles 12,819 12,767 25,543 100.07Passenger Trips 2,437 3,298 5,260 59.49Diesel Fuel Consumed (gallons) 208 - - -Gasoline Fuel Consumed (gallons) 551 2,127 3,192 50.07Employees - FTEs 5.0 7.0 5.5 -21.43Operating Expenses $33,032 $92,371 $96,228 4.18
RevenuesOperating Related RevenuesSales Tax $444,319 $800,824 $751,429 -6.17Total (Excludes Capital Revenues) $444,319 $800,824 $751,429 -6.17
ExpendituresEnding Balances, December 31General Fund $43,863 $414,430 $0 -100.00Operating Reserve $0 $0 $805,658 -Total $43,863 $414,430 $805,658 94.40
Total Funds by Source2008 2009 2010 % of Total
OperatingTotal Local Investment $444,319 $800,824 $751,429 100.00Total State Investment $0 $0 $0 0.00Total Federal Investment $0 $0 $0 0.00Total Operating $444,319 $800,824 $751,429 100.00
CapitalTotal Local Investment $0 $0 $0 -Total State Investment $0 $0 $0 -Total Federal Investment $0 $0 $0 -Total Capital $0 $0 $0 -

Summary of Public Transportation – 2010 Page 85 November 2011
Whatcom Transportation Authority
Richard WalshGeneral Manager 4111 Bakerview SpurBellingham, WA 98226360‑527‑4720www.ridewta.com
System Snapshot• Service Area: Whatcom County
• Congressional District: 2
• Legislative District: 40 and 42
• Type of Government: PTBA
• Governing Body: Board of Directors (local elected officials)
• Tax Authorized: 0.6 percent total sales tax—0.3 percent approved in 1983 and an additional 0.3 percent approved in 2002.
• Fares: $1.00 per boarding (Fixed Route and Paratransit).
• Intermodal Connections: WTA provides service throughout Whatcom County and between Bellingham and Mt Vernon. Service is provided to Western Washington University, Whatcom Community College, and Bellingham Technical College as well as most public schools in Bellingham. Connections to Amtrak, Greyhound, and the Alaska State Ferry are provided at the Fairhaven Transportation Center. Connections to the Lummi Island ferry are provided at Gooseberry Point.
• Transit Development Plan: Whatcom Transportation Authority TDP

Whatcom Transportation Authority
Page 86 Summary of Public Transportation – 2010 November 2011
Annual Operating Information
2008 2009 2010 % ChangeFixed Route Services (Direct Operated)Revenue Vehicle Hours 139,100 140,217 135,061 -3.68Total Vehicle Hours 145,200 148,693 143,783 -3.30Revenue Vehicle Miles 1,902,962 1,915,082 1,847,124 -3.55Total Vehicle Miles 2,083,704 2,085,352 2,015,689 -3.34Passenger Trips 4,945,900 5,623,158 4,720,951 -16.04Diesel Fuel Consumed (gallons) 415,892 429,899 413,162 -3.89Gasoline Fuel Consumed (gallons) 11,460 - - -Employees - FTEs 162.2 172.0 119.0 -30.81Operating Expenses $15,397,926 $15,161,260 $14,812,684 -2.30Farebox Revenues $1,273,068 $1,384,476 $2,308,795 66.76
Demand Response Services (Direct Operated)Revenue Vehicle Hours 56,400 57,393 55,801 -2.77Total Vehicle Hours 62,000 62,850 61,440 -2.24Revenue Vehicle Miles 776,200 788,852 762,520 -3.34Total Vehicle Miles 868,700 877,899 849,188 -3.27Passenger Trips 184,200 186,330 173,891 -6.68Gasoline Fuel Consumed (gallons) 127,737 133,963 126,701 -5.42Employees - FTEs 66.5 68.0 48.0 -29.41Operating Expenses $5,851,304 $6,254,583 $6,082,945 -2.74Farebox Revenues $144,926 $159,458 $14,247 -91.07
Vanpooling Services (Direct Operated)Revenue Vehicle Hours 11,194 9,729 12,834 31.91Total Vehicle Hours 11,267 9,784 12,834 31.17Revenue Vehicle Miles 571,889 509,074 664,762 30.58Total Vehicle Miles 575,656 511,877 664,762 29.87Passenger Trips 93,882 99,290 99,217 -0.07Gasoline Fuel Consumed (gallons) 31,038 38,600 43,762 13.37Employees - FTEs 0.7 1.3 0.3 -76.92Operating Expenses $298,707 $227,751 $226,925 -0.36Vanpool Revenue $163,135 $186,338 $225,128 20.82

Whatcom Transportation Authority
Summary of Public Transportation – 2010 Page 87 November 2011
Revenues2008 2009 2010 % Change
Operating Related RevenuesSales Tax $19,565,285 $17,844,828 $17,911,874 0.38Farebox Revenues $1,417,994 $1,543,934 $2,323,042 50.46Vanpooling Revenue $163,135 $186,338 $225,128 20.82State Special Needs Grants $460,864 $542,069 $331,787 -38.79Other State Operating Grants $194,063 $183,426 $212,660 15.94Other Operating Sub-Total $1,735,494 $1,047,489 $211,638 -79.80Other-Advertising $75,057 $55,012 $54,849 -0.30Other-Interest $1,095,511 $554,003 $275,394 -50.29Other-Gain (Loss) on Sale of Assets $12,097 -$151,781 -$128,683 -15.22Other-MISC $552,829 $590,255 $10,078 -98.29Total (Excludes Capital Revenues) $23,536,835 $21,348,084 $21,216,129 -0.62
Federal Capital Grant RevenuesFederal Section §5307 Capital Grants $575,448 $4,832,386 $1,655,804 -65.74Federal Section §5309 Capital Grants $0 $0 $1,859,670 -Federal Section §5310 Capital Grants $0 $0 $617,463 -Total Federal Capital $575,448 $4,832,386 $4,132,937 -14.47
State Capital Grant RevenuesState Vanpool Grants $0 $156,000 $0 -100.00Total State Capital $0 $156,000 $0 -100.00
ExpendituresLocal Capital ExpendituresLocal Funds $1,371,110 $2,096,405 $1,178,404 -43.79Total Local Capital $1,371,110 $2,096,405 $1,178,404 -43.79
Other ExpendituresDepreciation (Not included in Total Expenditures) $2,986,476 $3,558,566 $3,502,174 -1.58
Ending Balances, December 31Unrestricted Cash and Investments $14,071,997 $11,836,111 $8,229,773 -30.47Operating Reserve $4,331,407 $6,000,497 $6,076,480 1.27Capital Reserve Funds $5,934,013 $4,501,758 $4,574,469 1.62Insurance Funds $1,083,754 $637,090 $2,479,677 289.22Total $25,421,170 $22,975,456 $21,360,399 -7.03

Whatcom Transportation Authority
Page 88 Summary of Public Transportation – 2010 November 2011
Total Funds by Source2008 2009 2010 % of Total
OperatingTotal Local Investment $22,881,908 $20,622,589 $20,671,682 97.43Total State Investment $654,927 $725,495 $544,447 2.57Total Federal Investment $0 $0 $0 0.00Total Operating $23,536,835 $21,348,084 $21,216,129 100.00
CapitalTotal Local Investment $1,371,110 $2,096,405 $1,178,404 22.19Total State Investment $0 $156,000 $0 0.00Total Federal Investment $575,448 $4,832,386 $4,132,937 77.81Total Capital $1,946,558 $7,084,791 $5,311,341 100.00

Summary of Public Transportation – 2010 Page 89 November 2011
Yakima Transit
Donald B. Cooper City Manager129 North 2nd StreetYakima, WA 98901509‑575‑6040www.ci.yakima.wa.us
System Snapshot• Service Area: City of Yakima
• Congressional District: 1
• Legislative District: 1
• Type of Government: City
• Governing Body: Yakima City Council
• Tax Authorized: 0.3 percent total sales and use tax approved in November 1980.
• Fares: $0.75 per boarding for fixed route; $1.50 per boarding for paratransit.
• Intermodal Connections: Yakima Transit provides fixed-route, demand response, and vanpool services within the Cities of Yakima and Selah. We provide non‑exclusive fixed-route service to all K-12 schools as well as Perry Technical College and Yakima Valley Community College. Yakima Transit provides connectivity to the Yakima Airport, Greyhound, Central Washington Airporter Shuttle, and Amtrak. Yakima Transit also connects up with all the other transit providers in the area at Minor’s in Union Gap (Pahto Public Passage, Union Gap Transit, and People for People’s Community Connector).
• Transit Development Plan: Yakima Transit TDP

Yakima Transit
Page 90 Summary of Public Transportation – 2010 November 2011
Annual Operating Information
2008 2009 2010 % ChangeFixed Route Services (Direct Operated)Revenue Vehicle Hours 50,547 49,145 54,840 11.59Total Vehicle Hours 50,815 50,882 56,834 11.70Revenue Vehicle Miles 739,690 699,120 778,941 11.42Total Vehicle Miles 744,806 744,478 807,138 8.42Passenger Trips 1,348,178 1,289,315 1,312,116 1.77Diesel Fuel Consumed (gallons) 166,902 159,963 174,366 9.00Employees - FTEs 46.4 50.0 55.4 10.84Operating Expenses $5,546,078 $5,421,696 $5,760,027 6.24Farebox Revenues $395,355 $495,585 $430,497 -13.13
Demand Response Services (Purchased Transportation)Revenue Vehicle Hours 38,715 45,641 40,994 -10.18Total Vehicle Hours 42,511 51,862 46,061 -11.19Revenue Vehicle Miles 481,601 431,460 413,087 -4.26Total Vehicle Miles 522,865 497,593 474,720 -4.60Passenger Trips 96,160 86,234 87,484 1.45Diesel Fuel Consumed (gallons) 9237 - - -Gasoline Fuel Consumed (gallons) 22226 47,311 44,225 -6.52Employees - FTEs 40 38.0 36.0 -5.26Operating Expenses $1,487,657 $1,309,235 $1,330,026 1.59Farebox Revenues $172,055 $110,008 $96,047 -12.69
Vanpooling Services (Direct Operated)Revenue Vehicle Hours 11,731 10,664 12,116 13.62Total Vehicle Hours 11,731 10,664 12,116 13.62Revenue Vehicle Miles 527,915 475,879 545,236 14.57Total Vehicle Miles 527,915 475,879 545,236 14.57Passenger Trips 97,900 91,552 101,768 11.16Diesel Fuel Consumed (gallons) 9,850 8,253 8,867 7.44Gasoline Fuel Consumed (gallons) 23,672 23,384 26,863 14.88Employees - FTEs 2.0 2.0 1.0 -50.00Operating Expenses $295,255 $280,570 $330,517 17.80Vanpool Revenue $208,776 $192,486 $225,310 17.05
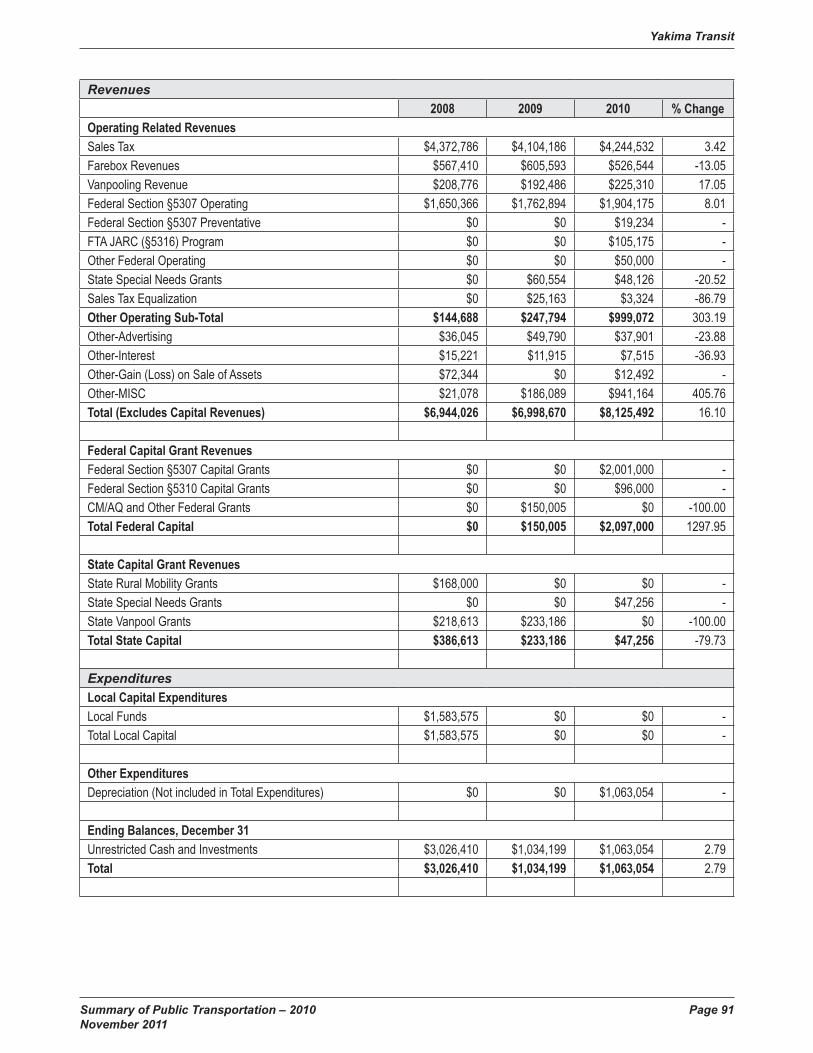
Yakima Transit
Summary of Public Transportation – 2010 Page 91 November 2011
Revenues2008 2009 2010 % Change
Operating Related RevenuesSales Tax $4,372,786 $4,104,186 $4,244,532 3.42Farebox Revenues $567,410 $605,593 $526,544 -13.05Vanpooling Revenue $208,776 $192,486 $225,310 17.05Federal Section §5307 Operating $1,650,366 $1,762,894 $1,904,175 8.01Federal Section §5307 Preventative $0 $0 $19,234 -FTA JARC (§5316) Program $0 $0 $105,175 -Other Federal Operating $0 $0 $50,000 -State Special Needs Grants $0 $60,554 $48,126 -20.52Sales Tax Equalization $0 $25,163 $3,324 -86.79Other Operating Sub-Total $144,688 $247,794 $999,072 303.19Other-Advertising $36,045 $49,790 $37,901 -23.88Other-Interest $15,221 $11,915 $7,515 -36.93Other-Gain (Loss) on Sale of Assets $72,344 $0 $12,492 -Other-MISC $21,078 $186,089 $941,164 405.76Total (Excludes Capital Revenues) $6,944,026 $6,998,670 $8,125,492 16.10
Federal Capital Grant RevenuesFederal Section §5307 Capital Grants $0 $0 $2,001,000 -Federal Section §5310 Capital Grants $0 $0 $96,000 -CM/AQ and Other Federal Grants $0 $150,005 $0 -100.00Total Federal Capital $0 $150,005 $2,097,000 1297.95
State Capital Grant RevenuesState Rural Mobility Grants $168,000 $0 $0 -State Special Needs Grants $0 $0 $47,256 -State Vanpool Grants $218,613 $233,186 $0 -100.00Total State Capital $386,613 $233,186 $47,256 -79.73
ExpendituresLocal Capital ExpendituresLocal Funds $1,583,575 $0 $0 -Total Local Capital $1,583,575 $0 $0 -
Other ExpendituresDepreciation (Not included in Total Expenditures) $0 $0 $1,063,054 -
Ending Balances, December 31Unrestricted Cash and Investments $3,026,410 $1,034,199 $1,063,054 2.79Total $3,026,410 $1,034,199 $1,063,054 2.79

Yakima Transit
Page 92 Summary of Public Transportation – 2010 November 2011
Total Funds by Source2008 2009 2010 % of Total
OperatingTotal Local Investment $5,293,660 $5,150,059 $5,995,458 73.79Total State Investment $0 $85,717 $51,450 0.63Total Federal Investment $1,650,366 $1,762,894 $2,078,584 25.58Total Operating $6,944,026 $6,998,670 $8,125,492 100.00
CapitalTotal Local Investment $1,583,575 $0 $0 0.00Total State Investment $386,613 $233,186 $47,256 2.20Total Federal Investment $0 $150,005 $2,097,000 97.80Total Capital $1,970,188 $383,191 $2,144,256 100.00
Summary of Public Transportation – 2010 Page 93 November 2011
Transit Systems Serving Rural Areas
For the purposes of this summary, local public transportation systems serving populations of fewer than 50,000 are “rural,” according to the U.S. Bureau of the Census as of April 1, 2000.
The 12 local public transportation systems and the rural areas they serve are:
• Clallam Transit (Clallam County)
• Columbia County Public Transportation (Columbia County)
• Garfield County Public Transportation (Garfield County)
• Grant Transit Authority (Grant County)
• Grays Harbor Transportation Authority (Grays Harbor County)
• Island Transit (Island County)
• Jefferson Transit Authority (Jefferson County)
• Mason County Transportation Authority (Mason County)
• Pacific Transit (Pacific County)
• Pullman Transit (city of Pullman)
• Twin Transit (cities of Centralia and Chehalis)
• Valley Transit (cities of Walla Walla and College Place and vicinity)
Local public transportation systems in rural areas are eligible to receive Section 5311 formula funding from the Federal Transit Administration (FTA) through WSDOT. In addition, they may receive FTA Section 5309 Bus Discretionary funding appropriated by Congress for specific projects.
FTA Section 5311 funding may be used by local public transportation systems to:
• purchase transit-related equipment,
• construct minor transit-related improvements, or
• offset net operating expenses.
FTA Section 5309 Bus and Bus‑Related funding may be used to purchase:
• buses,
• bus-related equipment,
• paratransit vehicles, and
• may be used for the construction of bus-related facilities.

Transit Systems Serving Rural Areas
Page 94 Summary of Public Transportation – 2010 November 2011

Summary of Public Transportation – 2010 Page 95 November 2011
Clallam Transit System
Terry G. WeedGeneral Manager 830 West Lauridsen BoulevardPort Angeles, WA 98363360‑452‑1315www.clallamtransit.com
System Snapshot• Service Area: Clallam County
• Congressional District: 6
• Legislative District: 24
• Type of Government: PTBA
• Governing Body: 8 member board (2 elected officials each from County, Forks, Sequim, and Port Angeles)
• Tax Authorized: 0.6 percent total sales and use tax‑ 0.3 percent sales tax rate when CTS started in October 1980 and an additional 0.3 percent sales and use tax effective January 2001.
• Fares: $1.00 per boarding for fixed route and $0.50 reduced fare for senior 65+, youth 6‑19, people with disabilities; additional $0.50 per boarding for premium routes #14 & #30 (Forks and Sequim to Port Angeles); additional $1.00 per boarding for general public dial‑a‑ride service.
• Intermodal Connections: Clallam Transit connects at the Port Angeles Transportation Center with the Black Ball Coho Ferry to Victoria and the Olympic Dungeness Line to Kingston, Seattle, and Sea‑Tac International Airport. In addition, CTS connects with Jefferson Transit at the Sequim Transit Center for east bound trips to Port Townsend, Poulsbo, and eventually connecting with Mason Transit and with the Jefferson Transit Olympic Connection at the Forks Transit Center to reach the Quinault and Grays Harbor.
• Transit Development Plan: Clallam Transit System TDP

Clallam Transit System
Page 96 Summary of Public Transportation – 2010 November 2011
Annual Operating Information
2008 2009 2010 % ChangeFixed Route Services (Direct Operated)Revenue Vehicle Hours 46,343 47,121 47,962 1.78Total Vehicle Hours 49,953 50,731 51,936 2.38Revenue Vehicle Miles 981,020 1,023,343 990,005 -3.26Total Vehicle Miles 1,100,997 1,116,207 1,084,304 -2.86Passenger Trips 1,027,623 968,033 918,230 -5.14Diesel Fuel Consumed (gallons) 210,822 207,950 194,308 -6.56Employees - FTEs 64.4 65.5 64.8 -1.07Operating Expenses $5,918,461 $5,860,326 $5,698,715 -2.76Farebox Revenues $571,981 $550,105 $608,056 10.53
Demand Response Services (Direct Operated)Revenue Vehicle Hours 29,979 30,741 27,127 -11.76Total Vehicle Hours 31,369 32,131 28,354 -11.76Revenue Vehicle Miles 504,731 503,644 510,136 1.29Total Vehicle Miles 531,433 530,318 528,283 -0.38Passenger Trips 68,443 67,911 59,094 -12.98Diesel Fuel Consumed (gallons) 51,850 50,285 48,681 -3.19Gasoline Fuel Consumed (gallons) 2,967 1,606 2,054 27.90Employees - FTEs 23.5 22.0 22.0 0.00Operating Expenses $1,590,674 $1,613,568 $1,635,449 1.36Farebox Revenues $152,604 $126,952 $39,915 -68.56
Vanpooling Services (Direct Operated)Revenue Vehicle Miles 414,518 468,275 479,091 2.31Total Vehicle Miles 414,518 468,275 479,091 2.31Passenger Trips 72,140 79,313 81,649 2.95Gasoline Fuel Consumed (gallons) 30,704 33,884 35,722 5.42Employees - FTEs 1.0 1.0 1.0 0.00Operating Expenses $170,415 $174,435 $194,595 11.56Vanpool Revenue $167,710 $192,654 $197,396 2.46

Clallam Transit System
Summary of Public Transportation – 2010 Page 97 November 2011
Revenues2008 2009 2010 % Change
Operating Related RevenuesSales Tax $6,250,857 $5,582,568 $5,835,791 4.54Farebox Revenues $724,585 $677,057 $647,971 -4.30Vanpooling Revenue $167,710 $192,654 $197,396 2.46Federal Section §5311 Operating $0 $75,000 $150,000 100.00Other Federal Operating $0 $0 $6,341 -State Rural Mobility Grants $0 $107,000 $0 -100.00State Special Needs Grants $155,880 $0 $54,595 -Other State Operating Grants $0 $84,205 $0 -100.00Other Operating Sub-Total $351,941 $184,369 $150,488 -18.38Other-Advertising $31,161 $21,962 $26,935 22.64Other-Interest $235,855 $124,042 $85,809 -30.82Other-Gain (Loss) on Sale of Assets $4,216 $10,155 $2,765 -72.77Other-MISC $80,709 $28,210 $34,979 24.00Total (Excludes Capital Revenues) $7,650,973 $6,902,853 $7,042,582 2.02
Federal Capital Grant RevenuesFederal Section §5309 Capital Grants $453,868 $961 $1,676 74.40Federal Section §5311 Capital Grants $0 $1,279,233 $11,351 -99.11Federal STP Grants $118,206 $29,291 $178,000 507.70Total Federal Capital $572,074 $1,309,485 $191,027 -85.41
State Capital Grant RevenuesState Vanpool Grants $0 $0 $75,162 -Total State Capital $0 $0 $75,162 -
ExpendituresLocal Capital ExpendituresLocal Funds $4,792,465 $425,027 $147,048 -65.40Total Local Capital $4,792,465 $425,027 $147,048 -65.40
Other ExpendituresDepreciation (Not included in Total Expenditures) $941,260 $907,665 $900,450 -0.79
Ending Balances, December 31Operating Reserve $1,900,000 $1,500,000 $1,200,000 -20.00Working Capital $595,143 $697,537 $795,295 14.01Capital Reserve Funds $2,000,000 $1,523,000 $1,450,000 -4.79Other (Please Explain in Comments Section at End) $357,714 $401,339 $429,311 6.97Total $4,852,857 $4,121,876 $3,874,606 -6.00

Clallam Transit System
Page 98 Summary of Public Transportation – 2010 November 2011
Total Funds by Source2008 2009 2010 % of Total
OperatingTotal Local Investment $7,495,093 $6,636,648 $6,831,646 97.00Total State Investment $155,880 $191,205 $54,595 0.78Total Federal Investment $0 $75,000 $156,341 2.22Total Operating $7,650,973 $6,902,853 $7,042,582 100.00
CapitalTotal Local Investment $4,792,465 $425,027 $147,048 35.58Total State Investment $0 $0 $75,162 18.19Total Federal Investment $572,074 $1,309,485 $191,027 46.23Total Capital $5,364,539 $1,734,512 $413,237 100.00

Summary of Public Transportation – 2010 Page 99 November 2011
Columbia County Public TransportationStephanie Guettinger General Manager507 Cameron StreetDayton, WA 99328509‑382‑1647www.columbiaco.com/index.aspx?nid=204
System Snapshot• Service Area: Columbia County as well as to citizens in the communities of
Waitsburg, Dixie and Prescott in neighboring Walla Walla County.
• Congressional District: 5
• Legislative District: 16
• Type of Government: County
• Governing Body: 5 Member board (the three County Commissioners and the Mayors of Dayton and Starbuck).
• Tax Authorized: 0.4 percent total sales tax which was approved in November 2005.
• Fares: The base fare structure for Columbia County Public Transportation is as follows:
– Inside Dayton city limits; $1.50 per boarding and $1.00 per day for seniors and people with disabilities
– Outside Dayton City Limits (up to 10 miles); $5.00 round trip ($3.00 one way) and $3.00 for seniors and disabled round trip ($1.50 one way)
– Starbuck to Dayton; all ages $3.00
– Dayton and Waitsburg to Walla Walla for all ages; Round trip $7.50; one way $5.00
– Monthly pass rates for students and workers who commute daily are available
• Intermodal Connections: Columbia County Public Transportation (CCPT) is the only transportation available to the citizens of Columbia County including Dayton, Starbuck and Huntsville, as well as to the citizens in the outlying communities of Walla Walla County including Waitsburg, Dixie and Prescott.
CCPT connects to Garfield County Transportation, Valley Transit in Walla Walla, the Walla Walla Airport; the Grapeline in Walla Walla to connect with the Pasco Airport, Amtrak, and Greyhound Bus Lines.
CCPT provides transportation of students to all of the area public schools in Dayton, Waitsburg, and Walla Walla as well to students attending the three area colleges located in Walla Walla.
• Transit Development Plan: Columbia County Public Transportation TDP

Columbia County Public Transportation
Page 100 Summary of Public Transportation – 2010 November 2011
Annual Operating Information
2008 2009 2010 % ChangeDemand Response Services (Direct Operated)Revenue Vehicle Hours 7,400 8,700 9,954 14.41Total Vehicle Hours 7,500 8,744 10,000 14.36Revenue Vehicle Miles 165,000 202,000 235,529 16.60Total Vehicle Miles 167,000 204,195 237,529 16.32Passenger Trips 41,630 45,400 53,063 16.88Diesel Fuel Consumed (gallons) 10,624 11,965 15,877 32.70Gasoline Fuel Consumed (gallons) 5,458 5,956 5,919 -0.62Employees - FTEs 8.5 12.0 13.8 14.58Operating Expenses $654,426 $660,641 $788,876 19.41Farebox Revenues $63,131 $65,560 $75,879 15.74
Vanpooling Services (Direct Operated)Revenue Vehicle Hours 3,055 4,200 3,907 -6.98Total Vehicle Hours 3,080 4,300 3,975 -7.56Revenue Vehicle Miles 154,200 168,000 175,801 4.64Total Vehicle Miles 158,000 171,693 178,801 4.14Passenger Trips 32,000 31,500 34,426 9.29Gasoline Fuel Consumed (gallons) 11,595 11,422 12,586 10.19Employees - FTEs 0.20 0.25 0.25 0.00Operating Expenses $69,244 $62,674 $81,050 29.32Vanpool Revenue $97,254 $91,205 $105,542 15.72
RevenuesOperating Related RevenuesSales Tax $179,716 $188,986 $210,998 11.65Farebox Revenues $63,131 $65,560 $75,879 15.74Vanpooling Revenue $97,254 $91,205 $105,542 15.72Federal Section §5311 Operating $179,152 $194,889 $0 -100.00Other Federal Operating $0 $33,288 $179,166 438.23State Rural Mobility Grants $99,337 $123,691 $320,945 159.47State Special Needs Grants $18,238 $12,281 $0 -100.00Sales Tax Equalization $43,595 $48,259 $32,067 -33.55Other Operating Sub-Total $128,236 $164,287 $161,658 -1.60Other-Interest $0 $0 $4,148 -Other-MISC $128,236 $164,287 $157,510 -4.13Total (Excludes Capital Revenues) $808,659 $922,446 $1,086,255 17.76
Federal Capital Grant RevenuesFederal Section §5309 Capital Grants $48,589 $0 $73,076 -Total Federal Capital $48,589 $0 $73,076 -

Columbia County Public Transportation
Summary of Public Transportation – 2010 Page 101 November 2011
2008 2009 2010 % ChangeState Capital Grant RevenuesState Special Needs Grants $0 $0 $59,409 -Total State Capital $0 $0 $59,409 -
ExpendituresLocal Capital ExpendituresLocal Funds $25,517 $5,644 $58,468 935.93Total Local Capital $25,517 $5,644 $58,468 935.93
Ending Balances, December 31General Fund $121,277 $118,890 $54,611 -54.07Operating Reserve $37,190 $37,459 $40,588 8.35Working Capital $102,148 $253,129 $377,756 49.23Capital Reserve Funds $71,510 $123,461 $200,964 62.78Total $332,125 $532,939 $673,919 26.45
Total Funds by Source2008 2009 2010 % of Total
OperatingTotal Local Investment $468,337 $510,038 $554,077 46.49Total State Investment $161,170 $217,519 $532,178 44.65Total Federal Investment $276,406 $286,094 $105,542 8.86Total Operating $905,913 $1,013,651 $1,191,797 100.00
CapitalTotal Local Investment $25,517 $5,644 $58,468 30.62Total State Investment $0 $0 $59,409 31.11Total Federal Investment $48,589 $0 $73,076 38.27Total Capital $74,106 $5,644 $190,953 100.00

Columbia County Public Transportation
Page 102 Summary of Public Transportation – 2010 November 2011

Summary of Public Transportation – 2010 Page 103 November 2011
Garfield County Public Transportation
Jan ZorbCoordinator695 Main StreetPO Box 213Pomeroy, WA 99347509‑843‑3563
System Snapshot• Service Area: Garfield County
• Congressional District: 5
• Legislative District: 9
• Type of Government: UTBA
• Governing Body: Commissioners
• Tax Authorized: Our system does not receive any sales and use tax because we are unincooporated and we do not have enough business in the outlying area to benefit our passing and additional tax and use. Garfield County contributes .08 in funding which is greater than the allowable tax.
• Fares: We operate on a donation bases. The suggested donation is Local $2.00 and Lewiston $5.00.
• Intermodal Connections: Garfield County Transportation provides services locally and to Lewiston/Clarkston Valley, we transport to Walla Walla Community College in Clarkston and make connections with Northwest Trails, Lewiston/Nes Perce Regional Airport, Lewiston Transit, and Asotin County PTBA. We travel to Dusty to connect with the Columbia County Transit for services into Walla Walla. We connect with COAST for elder services and SMS for Medicaid transportation.
• Transit Development Plan: Garfield County Public Transportation TDP

Garfield County Public Transportation
Page 104 Summary of Public Transportation – 2010 November 2011
Annual Operating Information
2008 2009 2010 % ChangeDemand Response Services (Direct Operated)Revenue Vehicle Hours 3,216 2,799 2,254 -19.47Total Vehicle Hours 3,230 2,834 2,294 -19.05Revenue Vehicle Miles 32,037 25,207 13,608 -46.01Total Vehicle Miles 32,537 25,517 13,810 -45.88Passenger Trips 12,085 11,166 9,496 -14.96Gasoline Fuel Consumed (gallons) 4,174 3,874 3,370 -13.01Employees - FTEs 2.6 3.0 3.0 0.00Operating Expenses $122,600 $124,000 $103,574 -16.47Farebox Revenues $4,697 $4,000 $3,834 -4.15
RevenuesOperating Related RevenuesFarebox Revenues $4,697 $4,000 $3,834 -4.15Federal Section §5311 Operating $0 $0 $48,302 -State Rural Mobility Grants $0 $0 $43,458 -Other State Operating Grants $72,479 $71,000 $0 -100.00Other Operating Sub-Total $9,119 $7,000 $4,538 -35.17Other-MISC $9,119 $7,000 $4,538 -35.17Total (Excludes Capital Revenues) $86,295 $82,000 $100,132 22.11
ExpendituresEnding Balances, December 31General Fund $47,123 $57,158 $58,534 2.41Capital Reserve Funds $50,185 $58,919 $62,419 5.94Total $97,308 $116,077 $120,953 4.20
Total Funds by Source2008 2009 2010 % of Total
OperatingTotal Local Investment $13,816 $11,000 $8,372 8.36Total State Investment $72,479 $71,000 $43,458 43.40Total Federal Investment $0 $0 $48,302 48.24Total Operating $86,295 $82,000 $100,132 100.00
CapitalTotal Local Investment $0 $0 $0 -Total State Investment $0 $0 $0 -Total Federal Investment $0 $0 $0 -Total Capital $0 $0 $0 -

Summary of Public Transportation – 2010 Page 105 November 2011
Grant Transit Authority
Greg WrightTransit Manager8392 West Westover BoulevardMoses Lake, WA 98837509‑765‑0898www.gta‑ride.com
System Snapshot• Service Area: Grant County
• Congressional District: 1
• Legislative District: 1
• Type of Government: PTBA
• Governing Body: Nine member Board of Directors comprised of one County Commissioner, two Mayors representing the communities of Warden and Wilson Creek, six City Council Members representing the communities of Quincy, Ephrata, Soap Lake, Coulee City, Electric City, and Moses Lake.
• Tax Authorized: 0.2 percent local sales tax approved November 1996. There has been no change since.
• Fares: $1.00 per boarding fixed-route; $0.50 per boarding for paratransit.
• Intermodal Connections: Grant Transit Authority provides service and connections to the following facilities: Amtrak depot in Ephrata, Grant County International Airport in Moses Lake, NW Trailways in Moses Lake and Ephrata, Greyhound/Ernie’s Texaco in Moses Lake, Columbia Station (Link Transit) in Wenatchee. Grant Transit provides service to Big Bend Community College in Moses Lake and three park and ride lots in Grant County.
• Transit Development Plan: Grant Transit Authority TDP

Grant Transit Authority
Page 106 Summary of Public Transportation – 2010 November 2011
Annual Operating Information
2008 2009 2010 % ChangeFixed Route Services (Purchased Transportation)Revenue Vehicle Hours 4,355 4,277 4,381 2.43Total Vehicle Hours 5,496 5,400 5,497 1.80Revenue Vehicle Miles 119,203 116,991 115,068 -1.64Total Vehicle Miles 127,585 125,253 123,291 -1.57Passenger Trips 29,149 32,067 36,244 13.03Diesel Fuel Consumed (gallons) 58,122 59,012 31,455 -46.70Employees - FTEs 11.0 12.0 8.0 -33.33Operating Expenses $1,277,508 $1,017,540 $793,834 -21.98Farebox Revenues $33,222 $28,135 $30,898 9.82
Route Deviated Services (Purchased Transportation)Revenue Vehicle Hours 31,543 30,193 25,324 -16.13Total Vehicle Hours 34,731 33,833 29,986 -11.37Revenue Vehicle Miles 938,592 902,577 779,492 -13.64Total Vehicle Miles 968,325 942,123 815,965 -13.39Passenger Trips 214,794 187,983 159,264 -15.28Diesel Fuel Consumed (gallons) 95,484 86,449 104,748 21.17Employees - FTEs 17.0 18.0 18.0 0.00Operating Expenses $1,550,936 $1,622,771 $1,784,322 9.96Farebox Revenues $21,728 $48,886 $74,633 52.67
Demand Response Services (Purchased Transportation)Revenue Vehicle Hours 12,793 9,960 7,199 -27.72Total Vehicle Hours 16,961 13,857 10,360 -25.24Revenue Vehicle Miles 229,966 164,872 121,386 -26.38Total Vehicle Miles 289,135 211,047 159,003 -24.66Passenger Trips 30,212 27,059 20,157 -25.51Gasoline Fuel Consumed (gallons) 20,653 22,018 9,838 -55.32Employees - FTEs 14.0 15.0 13.0 -13.33Operating Expenses $1,207,864 $1,153,415 $804,784 -30.23Farebox Revenues $36,634 $33,009 $31,521 -4.51
Vanpooling Services (Direct Operated)Revenue Vehicle Miles 118,545 152,120 227,015 49.23Total Vehicle Miles 118,545 152,120 227,015 49.23Passenger Trips 26,071 32,360 39,952 23.46Gasoline Fuel Consumed (gallons) 8,425 10,609 14,658 38.17Employees - FTEs 1.0 1 - -100.00Operating Expenses $30,571 $28,061 $178,049 534.51Vanpool Revenue $48,933 $45,071 $100,561 123.12

Grant Transit Authority
Summary of Public Transportation – 2010 Page 107 November 2011
Revenues2008 2009 2010 % Change
Operating Related RevenuesSales Tax $3,358,611 $2,759,250 $2,328,265 -15.62Farebox Revenues $91,584 $110,030 $137,052 24.56Vanpooling Revenue $48,933 $45,071 $100,561 123.12FTA JARC (§5316) Program $84,792 $65,971 $0 -100.00Other Federal Operating $14,524 $0 $0 -State Rural Mobility Grants $101,210 $33,848 $67,780 100.25State Special Needs Grants $212,420 $76,325 $191,240 150.56Other State Operating Grants $80,012 $0 $2,330 -Other Operating Sub-Total $268,890 $157,073 $228,064 45.20Other-Interest $213,537 $118,515 $66,969 -43.49Other-MISC $55,353 $38,558 $161,095 317.80Total (Excludes Capital Revenues) $4,260,976 $3,247,568 $3,055,292 -5.92
Federal Capital Grant RevenuesFederal Section §5309 Capital Grants $0 $470,913 $222,346 -52.78Federal Section §5311 Capital Grants $0 $142,276 $2,767,246 1844.98Total Federal Capital $0 $613,189 $2,989,592 387.55
State Capital Grant RevenuesState Vanpool Grants $120,715 $51,205 $0 -100.00Total State Capital $120,715 $51,205 $0 -100.00
ExpendituresOther ExpendituresDepreciation (Not included in Total Expenditures) $378,148 $430,041 $387,175 -9.97
Ending Balances, December 31Unrestricted Cash and Investments $4,117,827 $2,830,086 $1,645,579 -41.85Operating Reserve $800,000 $800,000 $800,000 0.00Total $4,917,827 $3,630,086 $2,445,579 -32.63
Total Funds by Source2008 2009 2010 % of Total
OperatingTotal Local Investment $3,768,018 $3,071,424 $2,793,942 91.45Total State Investment $393,642 $110,173 $261,350 8.55Total Federal Investment $99,316 $65,971 $0 0.00Total Operating $4,260,976 $3,247,568 $3,055,292 100.00
CapitalTotal Local Investment $0 $0 $0 0.00Total State Investment $120,715 $51,205 $0 0.00Total Federal Investment $0 $613,189 $2,989,592 100.00Total Capital $120,715 $664,394 $2,989,592 100.00

Grant Transit Authority
Page 108 Summary of Public Transportation – 2010 November 2011

Summary of Public Transportation – 2010 Page 109 November 2011
Grays Harbor Transportation Authority
Mark CarlinGeneral Manager705 30th StreetHoquiam, WA 98550 360‑532‑2770www.ghtransit.com
System Snapshot• Service Area: Grays Harbor County
• Congressional District: 6
• Legislative District: 19, 24, and 35
• Type of Government: County
• Governing Body: Six member Board of Directors comprised of three County Commissioners, Mayor of Aberdeen, Mayor of Hoquiam, and a mayor selected by all other mayors in the county.
• Tax Authorized: 0.6 percent total sales and use tax. 0.3 approved in November 1974 and 0.3 approved in February 2000.
• Fares: Base fare is $1.00 per boarding for fixed route and $1.00 per boarding for (door to door) paratransit service.
• Intermodal Connections: Grays Harbor Transit connects with Jefferson Transit in Amanda Park at Lake Quinault and with Pacific Transit in Aberdeen. Grays Harbor Transit also connects with Pierce Transit, Mason Transit, Intercity Transit, and Greyhound in Olympia. Grays Harbor Transit connects with Amtrack and Twin Transit in Centrailia twice weekly, Monday and Friday. Grays Harbor Transit provides service to all public elementary, middle and high schools within Aberdeen Hoquiam, and Cosmopolis as well as many of the other schools throughout the county. Grays Harbor Transit services Grays Harbor College every 30 minutes from 7:10 a.m. to 8:40 p.m. Grays Harbor Transit provides service to most seinor centers in the county by either fixed route or dial-a-ride service.
• Transit Development Plan: Grays Harbor Transit TDP

Grays Harbor Transportation Authority
Page 110 Summary of Public Transportation – 2010 November 2011
Annual Operating Information
2008 2009 2010 % ChangeFixed Route Services (Direct Operated)Revenue Vehicle Hours 60,326 52,574 48,461 -7.82Total Vehicle Hours 69,266 66,125 62,130 -6.04Revenue Vehicle Miles 1,208,707 1,191,870 983,763 -17.46Total Vehicle Miles 1,228,424 1,214,016 1,047,722 -13.70Passenger Trips 1,247,651 1,162,282 873,800 -24.82Diesel Fuel Consumed (gallons) 227,271 224,823 190,911 -15.08Employees - FTEs 59.0 59.0 59.0 0.00Operating Expenses $4,656,769 $4,758,827 $4,043,109 -15.04Farebox Revenues $402,974 $436,026 $532,477 22.12
Demand Response Services (Direct Operated)Revenue Vehicle Hours 42,454 44,083 29,237 -33.68Total Vehicle Hours 42,454 44,083 29,237 -33.68Revenue Vehicle Miles 590,815 465,305 455,700 -2.06Total Vehicle Miles 590,815 465,305 455,700 -2.06Passenger Trips 144,597 139,903 109,658 -21.62Diesel Fuel Consumed (gallons) 53,640 52,156 47,314 -9.28Gasoline Fuel Consumed (gallons) 1,214 7,150 10,288 43.89Employees - FTEs 17.0 17.0 16.0 -5.88Operating Expenses $2,734,928 $2,916,700 $3,050,065 4.57Farebox Revenues $72,299 $69,952 $109,658 56.76
Vanpooling Services (Direct Operated)Revenue Vehicle Hours 3,255 6,171 7,713 24.99Total Vehicle Hours 3,255 6,171 7,713 24.99Revenue Vehicle Miles 124,956 224,756 281,783 25.37Total Vehicle Miles 124,956 224,756 281,783 25.37Passenger Trips 37,985 52,486 72,254 37.66Gasoline Fuel Consumed (gallons) 7,709 15,850 19,924 25.70Employees - FTEs 0.5 0.5 1.0 100.00Operating Expenses $54,981 $64,284 $86,756 34.96Vanpool Revenue $45,609 $71,269 $90,466 26.94

Grays Harbor Transportation Authority
Summary of Public Transportation – 2010 Page 111 November 2011
Revenues2008 2009 2010 % Change
Operating Related RevenuesSales Tax $5,976,188 $5,110,116 $5,220,830 2.17Farebox Revenues $475,273 $505,978 $642,135 26.91Vanpooling Revenue $45,609 $71,269 $90,466 26.94Federal Section §5311 Operating $625,000 $546,060 $467,119 -14.46State Rural Mobility Grants $0 $52,988 $105,977 100.00State Special Needs Grants $176,116 $180,470 $184,824 2.41Sales Tax Equalization $614,402 $429,800 $414,506 -3.56Other State Operating Grants $22,463 $0 $0 -Other Operating Sub-Total $136,739 $49,915 $34,736 -30.41Other-Advertising $33,987 $10,091 $7,523 -25.45Other-Interest $89,595 $30,218 $11,690 -61.31Other-MISC $13,157 $9,606 $15,523 61.60Total (Excludes Capital Revenues) $8,071,790 $6,946,596 $7,160,593 3.08
Federal Capital Grant RevenuesFederal Section §5309 Capital Grants $89,059 $0 $0 -Federal Section §5311 Capital Grants $0 $477,455 $0 -100.00CM/AQ and Other Federal Grants $0 $1,279,878 $178,722 -86.04Total Federal Capital $89,059 $1,757,333 $178,722 -89.83
State Capital Grant RevenuesState Vanpool Grants $67,080 $44,988 $119,043 164.61Total State Capital $67,080 $44,988 $119,043 164.61
ExpendituresLocal Capital ExpendituresLocal Funds $0 $268,347 $55,657 -79.26Total Local Capital $0 $268,347 $55,657 -79.26
Other ExpendituresOther Expenditures $197,067 $195,241 $0 -100.00Depreciation (Not included in Total Expenditures) $0 $0 $713,555 -
Ending Balances, December 31General Fund $994,335 $1,479,994 $1,540,771 4.11Unrestricted Cash and Investments $2,400,000 $1,140,000 $1,140,000 0.00Insurance Funds $166,343 $166,343 $166,343 0.00Total $3,560,678 $2,786,337 $2,847,114 2.18

Grays Harbor Transportation Authority
Page 112 Summary of Public Transportation – 2010 November 2011
Total Funds by Source2008 2009 2010 % of Total
OperatingTotal Local Investment $6,830,876 $5,932,519 $5,988,167 83.63Total State Investment $812,981 $663,258 $705,307 9.85Total Federal Investment $625,000 $546,060 $467,119 6.52Total Operating $8,268,857 $7,141,837 $7,160,593 100.00
CapitalTotal Local Investment $0 $268,347 $55,657 15.75Total State Investment $67,080 $44,988 $119,043 33.68Total Federal Investment $89,059 $1,757,333 $178,722 50.57Total Capital $156,139 $2,070,668 $353,422 100.00

Summary of Public Transportation – 2010 Page 113 November 2011
Island Transit
Martha M. RoseExecutive Director19758 State Route 20 Coupeville, WA 98239360‑678‑7771www.islandtransit.org
System Snapshot• Service Area: Island County
• Congressional District: 2
• Legislative District: 10
• Type of Government: PTBA
• Governing Body: Board of Directors
• Tax Authorized: Voters approved .3 percent tax in 1983. In 2000, the voters approved an addition .3 percent tax bringing the total tax to .6 percent until 2009 when the voters again approved an addition .3 percent. Island Transit now collects .9 percent sales tax.
• Fares: Island Transit does not collect farebox revenue.
• Intermodal Connections: Island Transit provides service to both WSF ferry terminals on Whidbey Island. In addition, we provide service into Mt. Vernon Station and Everett Station providing links to Skagit Transit, Whatcom Transit, Community Transit, Everett Transit, Sound Transit, and Amtrak.
• Transit Development Plan: Island Transit TDP

Island Transit
Page 114 Summary of Public Transportation – 2010 November 2011
Annual Operating Information
2008 2009 2010 % ChangeFixed Route Services (Direct Operated)Revenue Vehicle Hours 36,321 34,832 35,349 1.48Total Vehicle Hours 48,971 48,623 49,732 2.28Revenue Vehicle Miles 1,090,817 1,127,965 1,134,752 0.60Total Vehicle Miles 1,153,527 1,188,172 1,195,900 0.65Passenger Trips 699,553 672,298 672,667 0.05Diesel Fuel Consumed (gallons) 206,619 159,641 148,873 -6.75Gasoline Fuel Consumed (gallons) - 7,252 - -100.00Employees - FTEs 24.0 24.0 24.0 0.00Operating Expenses $4,572,225 $4,756,191 $5,156,426 8.42
Route Deviated Services (Direct Operated)Revenue Vehicle Hours 25,576 24,819 25,087 1.08Total Vehicle Hours 42,098 40,948 41,199 0.61Revenue Vehicle Miles 634,238 639,545 619,248 -3.17Total Vehicle Miles 741,499 734,912 713,418 -2.92Passenger Trips 385,104 346,188 354,000 2.26Diesel Fuel Consumed (gallons) 65,399 97,844 119,412 22.04Gasoline Fuel Consumed (gallons) 1,201 4,445 1,633 -63.26Employees - FTEs 14.0 14.0 19.0 35.71Operating Expenses $2,802,331 $2,915,085 $3,160,390 8.42
Demand Response Services (Direct Operated)Revenue Vehicle Hours 17,717 18,464 20,274 9.80Total Vehicle Hours 19,280 20,113 22,018 9.47Revenue Vehicle Miles 239,233 249,171 281,710 13.06Total Vehicle Miles 301,745 315,138 354,085 12.36Passenger Trips 41,036 43,883 45,132 2.85Diesel Fuel Consumed (gallons) 23,572 14,010 12,553 -10.40Gasoline Fuel Consumed (gallons) 575 14,007 17,701 26.37Employees - FTEs 9.0 9.0 11.0 22.22Operating Expenses $769,154 $826,879 $914,881 10.64
Vanpooling Services (Direct Operated)Revenue Vehicle Hours - - 37,028 -Total Vehicle Hours - - 37,028 -Revenue Vehicle Miles 1,025,683 1,334,858 1,187,396 -11.05Total Vehicle Miles 1,028,102 1,338,163 1,190,995 -11.00Passenger Trips 211,772 237,252 218,224 -8.02Gasoline Fuel Consumed (gallons) 63,612 81,117 72,229 -10.96Employees - FTEs 2.0 2.0 2.0 0.00Operating Expenses $336,582 $296,536 $464,552 56.66Vanpool Revenue $387,526 $490,500 $448,231 -8.62

Island Transit
Summary of Public Transportation – 2010 Page 115 November 2011
Revenues2008 2009 2010 % Change
Operating Related RevenuesSales Tax $5,265,972 $4,756,061 $6,384,629 34.24Vanpooling Revenue $387,526 $490,500 $448,231 -8.62Federal Section §5311 Operating $0 $0 $4,564 -State Regional Mobility Operating Grants $0 $362,485 $400,109 10.38State Special Needs Grants $164,406 $172,821 $198,062 14.61Sales Tax Equalization $1,444,027 $1,356,251 $1,531,998 12.96Other State Operating Grants $1,110,213 $944,944 $809,756 -14.31Other Operating Sub-Total $246,934 $258,378 $62,920 -75.65Other-Interest $131,230 $164,736 $25,491 -84.53Other-MISC $115,704 $93,642 $37,429 -60.03Total (Excludes Capital Revenues) $8,619,078 $8,341,440 $9,840,269 17.97
Federal Capital Grant RevenuesFederal Section §5309 Capital Grants $274,053 $934,810 $456,347 -51.18Federal Section §5311 Capital Grants $257,736 $642,216 $805,384 25.41Total Federal Capital $531,789 $1,577,026 $1,261,731 -19.99
State Capital Grant RevenuesState Rural Mobility Grants $295,364 $0 $494,023 -Other State Capital Funds $396,049 $489,272 $0 -100.00Total State Capital $691,413 $489,272 $494,023 0.97
ExpendituresLocal Capital ExpendituresLocal Funds $318,461 $0 $505,136 -Total Local Capital $318,461 $0 $505,136 -
Other ExpendituresDepreciation (Not included in Total Expenditures) $0 $0 $1,339,308 -
Ending Balances, December 31General Fund $3,433,328 $2,226,552 $2,278,890 2.35Operating Reserve $1,345,846 $1,345,846 $1,445,846 7.43Capital Reserve Funds $3,993,770 $2,654,155 $2,018,839 -23.94Total $8,772,944 $6,226,553 $5,743,575 -7.76

Island Transit
Page 116 Summary of Public Transportation – 2010 November 2011
Total Funds by Source2008 2009 2010 % of Total
OperatingTotal Local Investment $5,900,432 $5,504,939 $6,895,780 70.08Total State Investment $2,718,646 $2,836,501 $2,939,925 29.88Total Federal Investment $0 $0 $4,564 0.05Total Operating $8,619,078 $8,341,440 $9,840,269 100.00
CapitalTotal Local Investment $318,461 $0 $505,136 22.34Total State Investment $691,413 $489,272 $494,023 21.85Total Federal Investment $531,789 $1,577,026 $1,261,731 55.81Total Capital $1,541,663 $2,066,298 $2,260,890 100.00

Summary of Public Transportation – 2010 Page 117 November 2011
Jefferson Transit Authority
Tammi RubertGeneral Manger1615 West Simms WayPort Townsend, WA 98368‑3090360‑385‑4777www.jeffersontransit.com
System Snapshot• Service Area: Jefferson County
• Congressional District: 6
• Legislative District: 24
• Type of Government: PTBA
• Governing Body: Five member Board of Directors comprised of three Jefferson County Commissioners and two City Council Members from Port Townsend.
• Tax Authorized: 0.6 percent total sales and use tax—0.3 percent approved in November 1980, and an additional 0.3 percent approved in September 2000. (In February 2011 another 0.3 percent was added).
• Fares: East Jefferson County $1.50 for a day pass on fixed and deviated routes ($1.00 for senior, youth, disabled); $1.00 for ADA paratransit service per ride. West Jefferson County $0.75 for a Day pass; $0.50 for an adult one way pass and $0.25 for senior, youth, and people with disabilities one way pass.
• Intermodal Connections: Jefferson Transit provides local connecting service to the Port Townsend/Keystone Ferry Terminal and with Kitsap Transit in Poulsbo six days a week (no Sunday service). Jefferson Transit also provides connections with Clallam Transit in Sequim six days a week (no Sunday service). There is route‑deviated service connecting with Mason Transit in Brinnon six days a week (no Sunday service). Jefferson Transit provides route‑deviated service between Amanda Park and Forks along Highway 101 on the west side of the Olympic Peninsula six days a week (no Sunday service). This service, by connecting with Grays Harbor Transportation and Clallam Transit, completes the Olympic Peninsula loop, making it possible to travel the entire length of Highway 101 in Washington State using public transportation.
• Transit Development Plan: Jefferson Transit TDP

Jefferson Transit Authority
Page 118 Summary of Public Transportation – 2010 November 2011
Annual Operating Information
2008 2009 2010 % ChangeFixed Route Services (Direct Operated)Revenue Vehicle Hours 17,760 17,494 16,830 -3.80Total Vehicle Hours 18,165 17,946 17,166 -4.35Revenue Vehicle Miles 384,223 374,042 387,558 3.61Total Vehicle Miles 392,998 383,652 391,046 1.93Passenger Trips 295,178 290,659 155,659 -46.45Diesel Fuel Consumed (gallons) 67,035 65,519 83,755 27.83Employees - FTEs 23.9 23.3 13.8 -40.82Operating Expenses $2,106,374 $1,949,492 $1,472,440 -24.47Farebox Revenues $129,770 $125,313 $127,310 1.59
Route Deviated Services (Direct Operated)Revenue Vehicle Hours 6,444 6,378 5,659 -11.27Total Vehicle Hours 6,592 6,538 5,771 -11.73Revenue Vehicle Miles 278,220 270,317 237,704 -12.06Total Vehicle Miles 284,611 277,182 256,622 -7.42Passenger Trips 52,468 50,278 44,808 -10.88Diesel Fuel Consumed (gallons) 49,029 33,388 30,115 -9.80Gasoline Fuel Consumed (gallons) 1,989 6,290 5,824 -7.41Employees - FTEs 9.4 9.3 2.5 -72.69Operating Expenses $826,261 $750,757 $854,711 13.85Farebox Revenues $20,727 $19,847 $17,954 -9.54
Demand Response Services (Direct Operated)Revenue Vehicle Hours 7,774 7,105 7,031 -1.04Total Vehicle Hours 9,113 9,600 8,235 -14.22Revenue Vehicle Miles 84,132 81,658 84,640 3.65Total Vehicle Miles 98,998 110,392 110,127 -0.24Passenger Trips 20,914 17,876 17,428 -2.51Diesel Fuel Consumed (gallons) 6,795 6,590 5,526 -16.15Gasoline Fuel Consumed (gallons) 2,371 2,638 3,548 34.50Employees - FTEs 8.9 8.4 3.5 -57.86Operating Expenses $737,282 $685,588 $776,695 13.29Farebox Revenues $83,925 $54,517 $10,917 -79.98
Vanpooling Services (Direct Operated)Revenue Vehicle Hours 1,385 1,914 2,451 28.06Total Vehicle Hours 1,385 1,914 2,831 47.91Revenue Vehicle Miles 62,322 86,142 127,529 48.05Total Vehicle Miles 62,797 86,388 129,642 50.07Passenger Trips 11,432 12,926 16,974 31.32Diesel Fuel Consumed (gallons) 20 226 - -100.00Gasoline Fuel Consumed (gallons) 3,981 4,971 7,847 57.86Operating Expenses $34,110 $37,906 $31,280 -17.48Vanpool Revenue $37,811 $50,338 $67,974 35.04

Jefferson Transit Authority
Summary of Public Transportation – 2010 Page 119 November 2011
Revenues2008 2009 2010 % Change
Operating Related RevenuesSales Tax $2,415,514 $2,268,939 $2,132,036 -6.03Farebox Revenues $234,422 $199,677 $156,181 -21.78Vanpooling Revenue $37,811 $50,338 $67,974 35.04Federal Section §5311 Operating $563,804 $655,911 $785,628 19.78State Rural Mobility Grants $137,102 $17,500 $35,000 100.00State Special Needs Grants $135,049 $105,628 $98,780 -29.27Sales Tax Equalization $0 $139,654 $94,115 -84.48Other State Operating Grants $11,636 $606,261 $0 -100.00Other Operating Sub-Total $97,934 $149,472 $49,946 -66.59Other-Advertising $26,394 $5,395 $12,814 137.52Other-Interest $21,133 $7,841 $3,197 -59.23Other-Gain (Loss) on Sale of Assets $11,544 $8,565 $1,742 -79.66Other-MISC $38,863 $127,671 $32,193 -74.78Total (Excludes Capital Revenues) $3,633,272 $4,193,380 $3,419,660 -18.45
Federal Capital Grant RevenuesFederal Section §5309 Capital Grants $52,703 $0 $0 -Federal Section §5311 Capital Grants $0 $29,401 $486,664 1555.26Federal STP Grants $0 $0 $147,976 -Total Federal Capital $52,703 $29,401 $634,640 2058.57
State Capital Grant RevenuesState Rural Mobility Grants $0 $0 $205,718 -State Vanpool Grants $0 $44,504 $0 -100.00Total State Capital $0 $44,504 $205,718 362.25
ExpendituresOther ExpendituresOther Expenditures $591,766 $0 -100.00Depreciation (Not included in Total Expenditures) $468,582 $438,406 $407,882 -6.96
Ending Balances, December 31Unrestricted Cash and Investments $440,381 $328,973 $222,935 -32.23Capital Reserve Funds $304,787 $460,689 $130,998 -71.56Total $745,168 $789,662 $353,933 -55.18

Jefferson Transit Authority
Page 120 Summary of Public Transportation – 2010 November 2011
Total Funds by Source2008 2009 2010 % of Total
OperatingTotal Local Investment $2,785,681 $3,260,192 $2,406,137 70.36Total State Investment $283,787 $869,043 $227,895 6.66Total Federal Investment $563,804 $655,911 $785,628 22.97Total Operating $3,633,272 $4,785,146 $3,419,660 100.00
CapitalTotal Local Investment $0 $0 $0 0.00Total State Investment $0 $44,504 $205,718 24.48Total Federal Investment $52,703 $29,401 $634,640 75.52Total Capital $52,703 $73,905 $840,358 100.00

Summary of Public Transportation – 2010 Page 121 November 2011
Mason County Transportation Authority
Dave O’ConnellGeneral Manager790 East John’s Prairie RoadShelton, WA 98584360‑426‑9434www.masontransit.org
System Snapshot• Service Area: Mason County
• Congressional District: 3 and 6
• Legislative District: 35
• Type of Government: PTBA
• Governing Body: Board of Directors
• Tax Authorized: 0.6 percent total sales tax—.02 percent sales approved in 1991 and an additional 0.4 percent sales tax approved in September of 2001.
• Fares: One‑way out of county fares only at $1.50 per adults and youth, $.50 for seniors and people with disabilities.
• Intermodal Connections: Mason Transit provides service throughout Mason County with direct connections to Jefferson, Kitsap and Thurston Counties. Service includes transfers to Washington State Ferries via our Kitsap County route. Regional service from Shelton to Brinnon allows riders to reach destinations in Jefferson, Island, Skagit and Whatcom Counties. Direct connections with Intercity Transit, Grays Harbor Transit, Pierce Transit, Jefferson Transit, Kitsap Transit, and Squaxin Transit.
• Transit Development Plan: Mason Transit TDP

Mason County Transportation Authority
Page 122 Summary of Public Transportation – 2010 November 2011
Annual Operating Information
2008 2009 2010 % ChangeRoute Deviated Services (Direct Operated)Revenue Vehicle Hours 32,345 33,654 40,254 19.61Total Vehicle Hours 32,345 33,654 40,254 19.61Revenue Vehicle Miles 610,071 570,277 584,236 2.45Total Vehicle Miles 610,071 570,277 584,236 2.45Passenger Trips 374,380 397,282 394,322 -0.75Diesel Fuel Consumed (gallons) 85,495 86,476 98,216 13.58Employees - FTEs 18.7 16.1 22.7 41.34Operating Expenses $2,241,680 $2,881,164 $3,655,547 26.88Farebox Revenues $269,125 $531,091 $294,686 -44.51
Route Deviated Services (Purchased Transportation)Revenue Vehicle Hours - - 1,643 -Total Vehicle Hours - - 1,643 -Revenue Vehicle Miles - - 31,934 -Total Vehicle Miles - - 31,934 -Passenger Trips - - 10,810 -Diesel Fuel Consumed (gallons) - - - -Employees - FTEs - - - -Operating Expenses $0 $0 $199,576 -Farebox Revenues $0 $0 $0 -
Demand Response Services (Direct Operated)Revenue Vehicle Hours 24,790 29,244 24,665 -15.66Total Vehicle Hours 24,790 29,244 24,665 -15.66Revenue Vehicle Miles 350,348 363,072 327,504 -9.80Total Vehicle Miles 455,134 416,989 327,504 -21.46Passenger Trips 58,581 55,481 52,296 -5.74Diesel Fuel Consumed (gallons) 46,713 46,564 32,021 -31.23Employees - FTEs 14.3 13.9 19.3 39.25Operating Expenses $1,894,994 $1,643,238 $2,049,492 24.72Farebox Revenues $0 $0 $0 -
Vanpooling Services (Direct Operated)Revenue Vehicle Miles 277,580 288,653 289,317 0.23Total Vehicle Miles 277,580 288,653 289,317 0.23Passenger Trips 53,114 57,236 48,255 -15.69Gasoline Fuel Consumed (gallons) 21,324 22,901 21,953 -4.14Employees - FTEs 0.5 0.5 0.5 0.00Operating Expenses $1,528,611 $1,276,047 $0 -100.00Vanpool Revenue $171,009 $431,917 $209,950 -51.39

Mason County Transportation Authority
Summary of Public Transportation – 2010 Page 123 November 2011
Revenues2008 2009 2010 % Change
Operating Related RevenuesSales Tax $3,523,750 $3,123,326 $3,168,563 1.45Farebox Revenues $269,125 $531,091 $294,686 -44.51Vanpooling Revenue $171,009 $431,917 $209,950 -51.39Federal Section §5311 Operating $1,880,925 $1,154,806 $336,083 -70.90State Rural Mobility Grants $0 $0 $1,017,379 -State Special Needs Grants $0 $0 $260,128 -Sales Tax Equalization $1,487,729 $0 $0 -Other State Operating Grants $170,430 $95,385 $0 -100.00Other Operating Sub-Total $0 $0 $54,942 -Other-Interest $0 $0 $22,092 -Other-Gain (Loss) on Sale of Assets $0 $0 $32,850 -Total (Excludes Capital Revenues) $7,502,968 $5,336,525 $5,341,731 0.10
Federal Capital Grant RevenuesFederal Section §5311 Capital Grants $88,213 $0 $274,400 -Federal STP Grants $0 $204,110 $17,701 -91.33Total Federal Capital $88,213 $204,110 $292,101 43.11
State Capital Grant RevenuesState Vanpool Grants $120,521 $75,185 $0 -100.00Total State Capital $120,521 $75,185 $0 -100.00
ExpendituresLocal Capital ExpendituresLocal Funds $0 $0 $520,280 -Total Local Capital $0 $0 $520,280 -
Other ExpendituresOther Expenditures $0 $47,307 $0 -100.00Depreciation (Not included in Total Expenditures) $0 $0 $744,520 -
Debt ServiceInterest $52,972 $50,962 $4,754,649 9229.79Principal $48,133 $50,144 $18,569,162 36931.67Total Debt Service $101,105 $101,106 $23,323,811 22968.67
Ending Balances, December 31Unrestricted Cash and Investments $5,843,367 $5,775,132 $4,360,111 -24.50Operating Reserve $0 $0 $1,500,000 -Capital Reserve Funds $0 $0 $1,628,000 -Debt Service Funds $100,000 $100,000 $794,061 694.06Other (Please Explain in Comments Section at End) $0 $0 $167,878 -Total $5,943,367 $5,875,132 $8,450,050 43.83

Mason County Transportation Authority
Page 124 Summary of Public Transportation – 2010 November 2011
Total Funds by Source2008 2009 2010 % of Total
OperatingTotal Local Investment $3,963,884 $4,133,641 $3,728,141 69.79Total State Investment $1,658,159 $95,385 $1,277,507 23.92Total Federal Investment $1,880,925 $1,154,806 $336,083 6.29Total Operating $7,502,968 $5,383,832 $5,341,731 100.00
CapitalTotal Local Investment $0 $0 $520,280 64.04Total State Investment $120,521 $75,185 $0 0.00Total Federal Investment $88,213 $204,110 $292,101 35.96Total Capital $208,734 $279,295 $812,381 100.00

Summary of Public Transportation – 2010 Page 125 November 2011
Pacific Transit System
Tim RussDirector216 North 2nd StreetRaymond, WA 98577‑2406360‑875‑9418www.pacifictransit.org
System Snapshot• Service Area: Pacific County
• Congressional District: 3
• Legislative District: 19
• Type of Government: PTBA
• Governing Body: 7 Board members
• Tax Authorized: 0.3 percent approved in 1980.
• Fares: $.35 for Dial‑A Ride; $.50 for Fixed route
• Intermodal Connections: Grays Harbor Transit in Aberdeen, Washington/Sunset Transit in Astoria, Oregon/Wahkiakum Shuttle in Naselle, Washington.
• Transit Development Plan: Pacific Transit TDP

Pacific Transit System
Page 126 Summary of Public Transportation – 2010 November 2011
Annual Operating Information
2008 2009 2010 % ChangeFixed Route Services (Direct Operated)Revenue Vehicle Hours 12,085 12,771 12,922 1.18Total Vehicle Hours 12,408 13,126 13,295 1.29Revenue Vehicle Miles 318,865 331,278 337,617 1.91Total Vehicle Miles 327,171 340,122 346,986 2.02Passenger Trips 109,202 99,016 92,488 -6.59Diesel Fuel Consumed (gallons) 43,666 44,305 45,019 1.61Employees - FTEs 9.9 9.9 6.0 -39.39Operating Expenses $802,898 $818,762 $832,595 1.69Farebox Revenues $24,311 $23,058 $31,086 34.82
Demand Response Services (Direct Operated)Revenue Vehicle Hours 7,185 7,112 7,205 1.31Total Vehicle Hours 8,074 7,991 8,096 1.31Revenue Vehicle Miles 92,555 90,732 90,855 0.14Total Vehicle Miles 103,645 101,604 101,856 0.25Passenger Trips 15,196 13,439 13,295 -1.07Diesel Fuel Consumed (gallons) 695 304 35 -88.49Gasoline Fuel Consumed (gallons) 10,456 11,460 9.60Employees - FTEs 3.8 3.8 3.9 2.63Operating Expenses $522,016 $497,575 $505,982 1.69Farebox Revenues $15,544 $14,131 $5,271 -62.70
RevenuesOperating Related RevenuesSales Tax $812,962 $688,940 $671,982 -2.46Farebox Revenues $39,855 $37,189 $36,357 -2.24Federal Section §5311 Operating $250,000 $337,890 $201,560 -40.35State Rural Mobility Grants $338,230 $155,780 $261,560 67.90State Special Needs Grants $32,461 $31,077 $62,155 100.00Sales Tax Equalization $240,251 $168,010 $0 -100.00Other State Operating Grants $51,827 $16,194 $178,606 1002.91Other Operating Sub-Total $0 $0 $6,949 -Other-Interest $0 $0 $6,949 -Total (Excludes Capital Revenues) $1,765,586 $1,435,080 $1,419,169 -1.11
Federal Capital Grant RevenuesFederal Section §5309 Capital Grants $0 $105,136 $0 -100.00Federal STP Grants $30,000 $0 $0 -Total Federal Capital $30,000 $105,136 $0 -100.00

Pacific Transit System
Summary of Public Transportation – 2010 Page 127 November 2011
Expenditures2008 2009 2010 % Change
Other ExpendituresDepreciation (Not included in Total Expenditures) $0 $0 $198,702 -
Ending Balances, December 31General Fund $189,398 $68,330 $80,592 17.95Capital Reserve Funds $1,869,685 $1,954,120 $2,007,928 2.75Total $2,059,083 $2,022,450 $2,088,520 3.27
Total Funds by Source2008 2009 2010 % of Total
OperatingTotal Local Investment $852,817 $726,129 $715,288 50.40Total State Investment $662,769 $371,061 $502,321 35.40Total Federal Investment $250,000 $337,890 $201,560 14.20Total Operating $1,765,586 $1,435,080 $1,419,169 100.00
CapitalTotal Local Investment $0 $0 $0 -Total State Investment $0 $0 $0 -Total Federal Investment $30,000 $105,136 $0 -Total Capital $30,000 $105,136 $0 -

Pacific Transit System
Page 128 Summary of Public Transportation – 2010 November 2011

Summary of Public Transportation – 2010 Page 129 November 2011
Pullman Transit
Rod ThorntonManager775 NW Guy StreetPullman, WA 99163509‑338‑3248www.pullmantransit.com
System Snapshot• Service Area: City of Pullman
• Congressional District: 5
• Legislative District: 9
• Type of Government: City
• Governing Body: City Council
• Tax Authorized: We are funded through a 2% local utility tax that was approved by voters in 1978.
• Fares: Fixed Route Fare is $0.50 per boarding for adults and $0.30 per boarding fro youth, seniors, and disabled. Paratransit fare is $0.40 per boarding, with a premimun fare of $3 to the airport.
• Intermodal Connections: Pullman Transit provides service only within the city limits of Pullman. We do provide tripper servcie to the local school district, but most of our service is centered around providing access to Wasnington State University and the Pullman communities.
• Transit Development Plan: Pullman Transit TDP

Pullman Transit
Page 130 Summary of Public Transportation – 2010 November 2011
Annual Operating Information
2008 2009 2010 % ChangeFixed Route Services (Direct Operated)Revenue Vehicle Hours 21,865 22,822 24,496 7.34Total Vehicle Hours 22,630 24,203 25,430 5.07Revenue Vehicle Miles 304,019 318,728 339,996 6.67Total Vehicle Miles 315,182 338,010 353,482 4.58Passenger Trips 1,307,468 1,332,178 1,420,148 6.60Diesel Fuel Consumed (gallons) 75,188 111,621 112,058 0.39Employees - FTEs 19.6 25.4 24.8 -2.17Operating Expenses $2,099,307 $2,501,292 $2,535,296 1.36Farebox Revenues $1,285,751 $1,485,459 $1,661,239 11.83
Demand Response Services (Direct Operated)Revenue Vehicle Hours 7,911 8,320 7,384 -11.25Total Vehicle Hours 8,555 8,993 7,924 -11.89Revenue Vehicle Miles 63,900 68,979 66,214 -4.01Total Vehicle Miles 69,769 74,549 71,296 -4.36Passenger Trips 18,255 16,540 16,310 -1.39Diesel Fuel Consumed (gallons) 883 1,327 1,046 -21.18Gasoline Fuel Consumed (gallons) 6,056 9,605 11,850 23.37Employees - FTEs 6.4 6.3 7.1 12.70Operating Expenses $635,883 $523,010 $641,037 22.57Farebox Revenues $7,058 $6,188 $5,971 -3.51
RevenuesOperating Related RevenuesUtility Tax $1,122,403 $1,146,509 $1,088,968 -5.02Farebox Revenues $1,292,809 $1,491,647 $1,667,210 11.77Federal Section §5311 Operating $400,000 $475,000 $550,000 15.79State Special Needs Grants $56,694 $54,356 $41,769 -23.16Sales Tax Equalization $151,408 $43,103 $47,979 11.31Other Operating Sub-Total $6,636 $8,896 $5,038 -43.37Other-MISC $6,636 $8,896 $5,038 -43.37Total (Excludes Capital Revenues) $3,029,950 $3,219,511 $3,400,964 5.64
Federal Capital Grant RevenuesFederal Section §5309 Capital Grants $0 $0 $1,288,200 -CM/AQ and Other Federal Grants $0 $147,857 $0 -100.00Total Federal Capital $0 $147,857 $1,288,200 771.25
State Capital Grant RevenuesState Rural Mobility Grants $0 $0 $339,000 -Total State Capital $0 $0 $339,000 -

Pullman Transit
Summary of Public Transportation – 2010 Page 131 November 2011
Expenditures2008 2009 2010 % Change
Local Capital ExpendituresLocal Funds $117,777 $41,425 $536,313 1194.66Total Local Capital $117,777 $41,425 $536,313 1194.66
Ending Balances, December 31Operating Reserve $355,574 $378,000 $445,000 17.72Working Capital $0 $423,000 $342,000 -19.15Capital Reserve Funds $372,955 $0 $0 -Other (Please Explain in Comments Section at End) $728,529 $0 $0 -Total $1,457,058 $801,000 $787,000 -1.75
Total Funds by Source2008 2009 2010 % of Total
OperatingTotal Local Investment $2,421,848 $2,647,052 $2,761,216 81.19Total State Investment $208,102 $97,459 $89,748 2.64Total Federal Investment $400,000 $475,000 $550,000 16.17Total Operating $3,029,950 $3,219,511 $3,400,964 100.00
CapitalTotal Local Investment $117,777 $41,425 $536,313 24.79Total State Investment $0 $0 $339,000 15.67Total Federal Investment $0 $147,857 $1,288,200 59.54Total Capital $117,777 $189,282 $2,163,513 100.00

Pullman Transit
Page 132 Summary of Public Transportation – 2010 November 2011

Summary of Public Transportation – 2010 Page 133 November 2011
Twin Transit
Rob LafontaineGeneral Manager 212 East Locust StreetCentralia, WA 98531360‑330‑2072
System Snapshot• Service Area: Cities of Centralia and Chehalis in Lewis County.
• Congressional District: 3
• Legislative District: 20
• Type of Government: PTBA
• Governing Body: Three member board of directors comprised of one Lewis County Commissioner and an elected official from each of the cities of Centralia and Chehalis.
• Tax Authorized: 0.2 percent total sales and use tax—0.1% approved in November 1985 and an additional 0.1% approved in November 2004.
• Fares: $1.00 per boarding for route deviated service and paratransit service.
• Intermodal Connections: Twin Transit provides deviated route service to all local public and private schools, including Centralia College. Connections with Amtrak, Greyhound, CAPS Transit, Greys Harbor Transit and Rural Transit are available at the Amtrak Depot.
• Transit Development Plan: Twin Transit TDP

Twin Transit
Page 134 Summary of Public Transportation – 2010 November 2011
Annual Operating Information
2008 2009 2010 % ChangeRoute Deviated Services (Direct Operated)Revenue Vehicle Hours 25,002 24,335 26,260 7.91Total Vehicle Hours 25,594 24,909 26,754 7.41Revenue Vehicle Miles 362,060 319,167 438,343 37.34Total Vehicle Miles 369,450 325,678 442,871 35.98Passenger Trips 304,711 306,131 219,842 -28.19Diesel Fuel Consumed (gallons) 43,900 46,516 25,717 -44.71Gasoline Fuel Consumed (gallons) - - 25,980 -Employees - FTEs 23.2 23.2 23.2 0.00Operating Expenses $1,376,391 $1,347,859 $1,404,515 4.20Farebox Revenues $76,547 $76,415 $75,938 -0.62
Demand Response Services (Direct Operated)Revenue Vehicle Hours 2,772 3,348 3,563 6.42Total Vehicle Hours 3,027 3,656 3,634 -0.60Revenue Vehicle Miles 43,003 50,291 53,491 6.36Total Vehicle Miles 45,583 53,308 54,560 2.35Passenger Trips 12,050 11,681 11,890 1.79Diesel Fuel Consumed (gallons) 5,426 6,343 - -100.00Gasoline Fuel Consumed (gallons) - - 3,211 -Employees - FTEs 2.2 2.3 2.3 0.00Operating Expenses $170,116 $183,799 $209,870 14.18Farebox Revenues $4,029 $10,420 $9,385 -9.93
RevenuesOperating Related RevenuesSales Tax $1,580,501 $1,292,340 $1,229,185 -4.89Farebox Revenues $80,576 $86,835 $85,323 -1.74Federal Section §5311 Operating $91,403 $37,410 $0 -100.00State Special Needs Grants $98,435 $193,988 $214,867 10.76Other Operating Sub-Total $87,542 $40,936 $32,578 -20.42Other-Advertising $17,658 $14,675 $0 -100.00Other-Interest $63,980 $20,441 $0 -100.00Other-MISC $5,904 $5,820 $32,578 459.76Total (Excludes Capital Revenues) $1,938,457 $1,651,509 $1,561,953 -5.42
Federal Capital Grant RevenuesFederal Section §5310 Capital Grants $0 $0 $315,909 -Federal Section §5311 Capital Grants $0 $0 $96,000 -Total Federal Capital $0 $0 $411,909 -
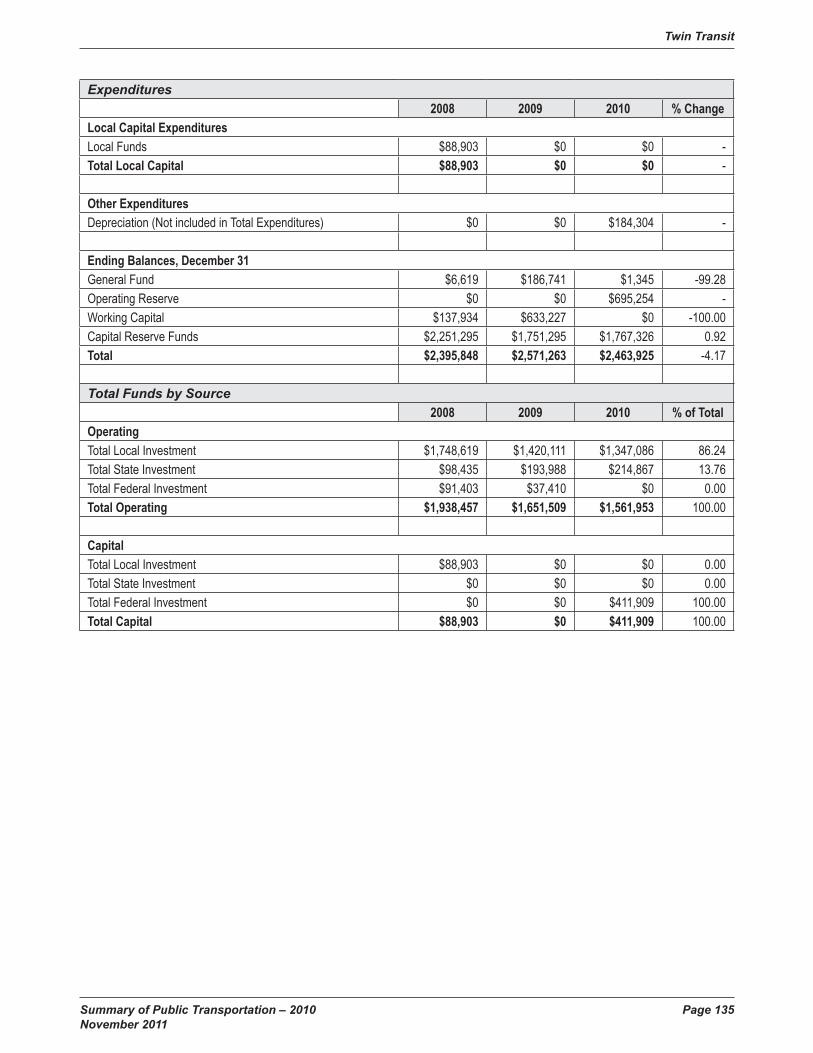
Twin Transit
Summary of Public Transportation – 2010 Page 135 November 2011
Expenditures2008 2009 2010 % Change
Local Capital ExpendituresLocal Funds $88,903 $0 $0 -Total Local Capital $88,903 $0 $0 -
Other ExpendituresDepreciation (Not included in Total Expenditures) $0 $0 $184,304 -
Ending Balances, December 31General Fund $6,619 $186,741 $1,345 -99.28Operating Reserve $0 $0 $695,254 -Working Capital $137,934 $633,227 $0 -100.00Capital Reserve Funds $2,251,295 $1,751,295 $1,767,326 0.92Total $2,395,848 $2,571,263 $2,463,925 -4.17
Total Funds by Source2008 2009 2010 % of Total
OperatingTotal Local Investment $1,748,619 $1,420,111 $1,347,086 86.24Total State Investment $98,435 $193,988 $214,867 13.76Total Federal Investment $91,403 $37,410 $0 0.00Total Operating $1,938,457 $1,651,509 $1,561,953 100.00
CapitalTotal Local Investment $88,903 $0 $0 0.00Total State Investment $0 $0 $0 0.00Total Federal Investment $0 $0 $411,909 100.00Total Capital $88,903 $0 $411,909 100.00

Twin Transit
Page 136 Summary of Public Transportation – 2010 November 2011

Summary of Public Transportation – 2010 Page 137 November 2011
Valley Transit
Richard FondahnGeneral Manager1401 West Rose StreetWalla Walla, WA 99362 509‑525‑9140www.valleytransit.com
System Snapshot• Service Area: Walla Walla/College Place Area
• Congressional District: 5
• Legislative District: 16
• Type of Government: PTBA
• Governing Body: Eight member Board of Directors comprised of two Walla Walla County Commissioners, three Walla Walla City Council Members, two City of College Place City Council Members, and one non‑voting Amalgemated Transit Union Local 757 Member Representative.
• Tax Authorized: 0.6 percent total sales and use tax—0.3 percent sales and use tax approved in March 1980 and an additional 0.03 percent sales and use tax approved in February 2010.
• Fares: $0.50 per boarding. Monthly passes are available for $20.00 per month. Reduced fare passes are available for persons with special transportation needs for $10.00 per month. Job Access passes are available for qualified participants for $12.00 per month.
• Intermodal Connections: Valley Transit maintains connections with other rural transportation providers. These connections provide intercity passenger service to the cities of Dayton, Waitsburg, and Pasco Washington. Connections with rural transportation providers operating in Oregon provide intercity passenger service to the cities of Milton‑Freewater, Pendleton and La Grande Oregon. Valley Transit’s fixed-routes also provide connections to the regional airport upon passenger request.
Valley Transit provides service to all public and private elementary, middle, and high schools in Walla Walla and College Place. Valley Transit also serves Walla Walla Community College, Whitman College, Walla Walla University, and all hospitals and medical clinics in Walla Walla and College Place.
• Transit Development Plan: Valley Transit TDP

Valley Transit
Page 138 Summary of Public Transportation – 2010 November 2011
Annual Operating Information
2008 2009 2010 % ChangeFixed Route Services (Direct Operated)Revenue Vehicle Hours 25,338 25,329 25,352 0.09Total Vehicle Hours 26,351 26,319 26,352 0.13Revenue Vehicle Miles 293,454 284,444 284,974 0.19Total Vehicle Miles 302,954 290,920 294,598 1.26Passenger Trips 719,049 667,542 632,742 -5.21Diesel Fuel Consumed (gallons) 61,999 58,533 56,790 -2.98CNG Fuel Consumed (Therms) 8,069 10,917 13,381 22.57Employees - FTEs 26.3 26.0 26.7 2.69Operating Expenses $2,032,327 $2,037,644 $2,115,885 3.84Farebox Revenues $112,846 $164,656 $237,032 43.96
Route Deviated Services (Direct Operated)Revenue Vehicle Hours 2,881 2,641 2,850 7.91Total Vehicle Hours 3,648 3,405 3,600 5.73Revenue Vehicle Miles 31,191 32,119 31,583 -1.67Total Vehicle Miles 32,110 34,000 32,386 -4.75Passenger Trips 34,787 30,363 31,965 5.28Diesel Fuel Consumed (gallons) 4,667 4,406 6,332 43.71CNG Fuel Consumed (Therms) 2,037 2,030 605 -70.20Employees - FTEs 1.8 1.8 2.3 27.78Operating Expenses $218,428 $219,702 $209,217 -4.77Farebox Revenues $5,549 $7,319 $11,974 63.60
Demand Response Services (Direct Operated)Revenue Vehicle Hours 12,632 12,779 13,245 3.65Total Vehicle Hours 13,623 13,735 14,195 3.35Revenue Vehicle Miles 150,578 148,546 154,289 3.87Total Vehicle Miles 152,158 150,000 156,233 4.16Passenger Trips 46,098 38,689 41,310 6.77CNG Fuel Consumed (Therms) 29,102 26,961 27,184 0.83Employees - FTEs 10.3 10.4 10.0 -3.85Operating Expenses $1,038,809 $1,044,923 $906,183 -13.28Farebox Revenues $7,321 $10,977 $15,475 40.98
Vanpooling Services (Direct Operated)Revenue Vehicle Hours 46 635 1,118 76.06Total Vehicle Hours 48 635 1,132 78.27Revenue Vehicle Miles 2,229 31,134 56,711 82.15Total Vehicle Miles 2,253 31,134 56,761 82.31Passenger Trips 630 9,034 9,638 6.69Gasoline Fuel Consumed (gallons) 224 2,130 3,729 75.07Employees - FTEs 0.1 0.1 0.2 100.00Operating Expenses $5,820 $13,166 $26,049 97.85Vanpool Revenue $1,285 $14,078 $26,070 85.18

Valley Transit
Summary of Public Transportation – 2010 Page 139 November 2011
Revenues2008 2009 2010 % Change
Operating Related RevenuesSales Tax $2,195,327 $1,980,720 $2,776,414 40.17Farebox Revenues $125,716 $182,952 $264,481 44.56Vanpooling Revenue $1,285 $14,078 $26,070 85.18Federal Section §5311 Operating $567,330 $345,257 $692,800 100.66Other Federal Operating $0 $6,137 $0 -100.00State Rural Mobility Grants $113,813 $108,131 $59,514 -44.96State Special Needs Grants $124,380 $66,499 $60,454 -9.09Other State Operating Grants $0 $11,862 $7,779 -34.42Other Operating Sub-Total $228,463 $102,359 -$72,750 -171.07Other-Advertising $13,257 $12,119 $4,375 -63.90Other-Interest $152,897 $41,084 $14,860 -63.83Other-Gain (Loss) on Sale of Assets $0 $0 -$119,292 -Other-MISC $62,309 $49,156 $27,307 -44.45Total (Excludes Capital Revenues) $3,356,314 $2,817,995 $3,814,762 35.37
Federal Capital Grant RevenuesFederal Section §5309 Capital Grants $0 $0 $95,204 -Federal Section §5311 Capital Grants $0 $0 $1,193,858 -Total Federal Capital $0 $0 $1,289,062 -
State Capital Grant RevenuesState Vanpool Grants $110,385 $130,000 $0 -100.00Total State Capital $110,385 $130,000 $0 -100.00
ExpendituresLocal Capital ExpendituresLocal Funds $441,180 $0 $102,565 -Total Local Capital $441,180 $0 $102,565 -
Other ExpendituresDepreciation (Not included in Total Expenditures) $0 $567,863 $560,318 -1.33
Ending Balances, December 31Unrestricted Cash and Investments $448,726 $227,468 $195,454 -14.07Operating Reserve $824,000 $835,000 $843,000 0.96Working Capital $331,000 $331,000 $331,000 0.00Capital Reserve Funds $2,469,976 $2,598,823 $2,828,421 8.83Total $4,073,702 $3,992,291 $4,197,875 5.15

Valley Transit
Page 140 Summary of Public Transportation – 2010 November 2011
Total Funds by Source2008 2009 2010 % of Total
OperatingTotal Local Investment $2,550,791 $2,280,109 $2,994,215 78.49Total State Investment $238,193 $186,492 $127,747 3.35Total Federal Investment $567,330 $351,394 $692,800 18.16Total Operating $3,356,314 $2,817,995 $3,814,762 100.00
CapitalTotal Local Investment $441,180 $0 $102,565 7.37Total State Investment $110,385 $130,000 $0 0.00Total Federal Investment $0 $0 $1,289,062 92.63Total Capital $551,565 $130,000 $1,391,627 100.00

Summary of Public Transportation – 2010 Page 141 November 2011
Community Transportation Providers
In Washington State, the term public transportation describes a wide range of services. The most easily recognizable services are those provided by the state’s 30 transit systems. In 2010, approximately 86 percent of the state’s population resided within the service boundaries of a transit system. However, transit systems are unable to meet everyone’s needs. Some people need to travel places where transit systems do not serve, or at times of the day in which there is no service. Others are unable to use transit systems because of their age or abilities, and some people with low incomes are unable to purchase the transportation they need. Community and Brokered Transportation Providers in Washington State help fill these gaps.
Since 1989, Washington State has used a brokerage system to provide non‑emergency medical transportation (NEMT) for eligible Medicaid clients. Transportation brokers link riders to transportation providers. The brokers determine riders’ eligibility and arrange the most appropriate and cost effective transportation services for the riders’ needs. Transportation services used by the brokers include public bus, gas vouchers, client and volunteer mileage reimbursement, non-profit providers, tribal governments, taxi, cabulance, ferry, and commercial bus and air. The state is divided into 13 service regions and currently contracts with eight brokers. In 2010, the brokers coordinated nearly 3.4 million trips for Medicaid clients. This shows an increase of almost 5 percent over the more than 3.2 million trips during 2005.
Community Transportation Providers are private, non-profit, or governmental agencies that provide core transportation services for individuals with special needs and the general public in rural and urban areas. With a focus on the transportation needs of low‑income, elderly, youth, veterans and their families and people with disabilities, Community Transportation Providers coordinate transportation services for access to health care, nutrition, employment, training, education, social services, and other vital community resources. Community Transportation Providers partner with a network of transportation service providers, employers, and human service agencies that may include health care providers, senior services, veteran services, community colleges, workforce partners, services for people with disabilities, and other social service agencies.
For communities that have limited or no transit service, community transportation provides the general public and people that have special needs with transportation options and access to services that maintain their dignity and independence while decreasing the need for institutional care.
Washington State’s public transportation systems increase quality of life for everyone in the state. Public transportation eases congestion on the roads and improves air quality. Public transportation gives people access to jobs, improves the economy, and decreases reliance on public assistance. The service helps people maintain and improve their wellbeing by getting people to health related services and educational opportunities. Public transportation encourages people to lead active lives.

Community Transportation Providers
Page 142 Summary of Public Transportation – 2010 November 2011
The most reliable 2010 data available to WSDOT regarding the Community Transportation Providers comes from the Federal Transit Administration’s reporting requirements for recipients of FTA §5311 funds. For 2010, 14 Community Transportation Providers received FTA §5311 grant money and were required to report their annual data through WSDOT to the FTA’s NTD data base. WSDOT, then submits the data that is collected from the §5311 grant recipients directly to the NTD.
Special Needs Populations2010 Washington State Population: 6,724,540 (U.S. Census).
People With Disability in Washington: 791,733 (11.8 percent of the total population)
People Over 65: 810,075 (12.0 percent of the total population)
People Within 150 Percent of Poverty (aka low income): 1,439,450 (21.4 percent of the total population)
Because these categories overlap, they cannot be totaled to capture a count of the state’s entire special needs population as this would yield too high a number. For example; 29.9 percent of people with a disability are within 150 percent of poverty and 38.8 percent of people with a disability are over 65.
Community VolunteersAs nonprofit, community service organizations, Community Transportation Providers attract community members who volunteer their service by sharing their time and use of their personal vehicles for providing trips to special needs individuals.
RidershipRidership is the amount of service provided as measured by the number of passenger trips. In 2010, the 14 featured Community Transportation Providers in Washington State provided a total of 465,616 passenger trips.
Revenue Vehicle HoursRevenue vehicle hours are the measurements in hours that providers operate each vehicle in fixed route services (not including the time to or from the assigned route) or make demand response services available. The Community Transportation Providers that are included in this report clocked more than 174,512 hours of vehicles revenue service for the 2010 reporting year.
Revenue Vehicle MilesRevenue vehicle miles are the measurements in miles that providers operate each vehicle (not including the distance to or from assigned fixed routes). This measurement includes the miles of volunteer vehicles. The Community transportation providers featured in this report drove over 3,580,687 revenue vehicle miles.

Community Transportation Providers
Summary of Public Transportation – 2010 Page 143 November 2011
FundingOperating Revenue
In 2010 the combined total operating revenue for the featured 14 Community Transportation Providers’ was $8.4 million. Federal contributions amounted to $3 million (36 percent), followed by $2.8 million in state funds (33.8 percent), $1.7 million in contract revenues, $621,188 in local funds and $168,595 in farebox revenue. Unlike transit systems, Community Transportation Providers receive no operating revenues from dedicated, local taxes.
Capital Funds
Washington State invested $115,736 in capital to the 14 featured Community Transportation Providers in 2010. This investment helped leverage an additional $1.6 million from federal and local sources.

Community Transportation Providers
Page 144 Summary of Public Transportation – 2010 November 2011
Performance MeasurementsPerformance measures in this analysis are based on statewide averages. The data shows predictable trends based on service areas which vary depending on whether they are urban, small city, or rural communities. Urban systems are typically able to provide more trips per hour because of greater population densities. Rural systems typically have proportionately larger revenue vehicle hours and miles of service due to greater service area to serve a more dispersed population. Likewise, they may have proportionately larger expenses per trip such as vehicle maintenance. Historically, WSDOT analysis of transit systems in the Washington State Summary of Public Transportation has grouped data into categories according to the size of communities served in order to better evaluate comparable systems. However, the overwhelming majority of these Community Transportation Providers serve rural areas. Therefore, this analysis relies on a single statewide average.
Service EffectivenessCommon measures of transportation provider service effectiveness are passenger trips per revenue vehicle hour and passenger trips per revenue vehicle mile. These indicators show the degree to which the service is utilized compared to the amount of service provided.
• Passenger trips per revenue vehicle hour reflects the number of passengers a community transportation provider transports in an hour of service.
• Passenger trips per revenue vehicle mile reflects the average number of passengers that a community transportation provider transports each mile of service.
Community Transportation Providers serving rural areas will typically have lower values on these performance measures due to less population density, less frequent vehicle operation, and smaller sized vehicles.

Community Transportation Providers
Summary of Public Transportation – 2010 Page 145 November 2011
Cost EfficiencyCommon measures of transportation provider cost efficiency are operating costs per revenue vehicle hour, operating costs per revenue vehicle mile, and operating costs per passenger trip. (Operating costs include administrative costs in this analysis.) These indicators measure the economy of a community transportation provider in supplying service.
• Operating costs per passenger trip reflects annual operating and administrative costs as a function of the number of passenger trips a community transportation provider transports.
• Operating costs per revenue vehicle hour reflects the overall operating and administrative costs per number of hours a community transportation provider supplies revenue service.
• Operating costs per revenue vehicle mile reflects the overall operating and administrative costs per number of miles a community transportation provider supplies revenue service.
Costs are directly related to the size of the community transportation provider and the nature of the area served. A provider’s service range impacts the number of miles and hours that vehicles are in revenue service. These factors affect fuel consumption as does the size of the vehicle. Community transportation providers that rely heavily on volunteer drivers may have lower operating costs.

Community Transportation Providers
Page 146 Summary of Public Transportation – 2010 November 2011
2010 Annual Operating Information
Operating CapitalTotal Annual ExpensesTotal Annual Expenses $8,421,307 $1,787,394 Sources of Revenue Funds ExpendedFare Revenues $168,595 $0Contract Revenues $1,737,883 $0Local Funds $621,188 $295,640 State Funds $2,843,370 $115,736 Federal AssistanceFederal Section §5309 Capital Program Funds $0 $49,090 Federal Section §5310 Capital Funds $649,886 $835,434 Federal Section §5311 Other than Urbanized Area Formula Funds $1,427,257 $118,335 Federal Section §5311 Tribal Transit Funds $62,667 $0ARRA §5311 Other than Urbanized Area Formula Funds $0 $327,311 FTA JARC (§5316) Program Funds $220,049 $45,848 Other Federal Funds $683,232 $0Total Federal Assistance $3,043,092 $1,376,018 Other Funds $7,180 $0Total Annual Revenues Expended $8,421,307 $1,787,394
Vehicles
Number of Vehicles in Total Fleet
Number of ADA
Accessible Vehicles in
Fleet % ADA
Compliant Total 161 154 95.7Other ResourcesNumber of volunteer drivers 40 Number of personal vehicles in service 36
Service Data
Annual Vehicle
Revenue Miles
Annual Vehicle
Revenue Hours
Regular Unlinked
Passenger Trips
Sponsored Unlinked
TripsBus 1,340,736 67,222 276,327 - Demand Response 2,239,951 107,290 184,567 4,722 Total 3,580,687 174,512 460,894 4,722
Performance Measures 2005* 2010 % Change Operating Cost per Passenger Trip $19.80 $18.01 -9.07Operating Cost per Revenue Vehicle Hour $38.08 $48.19 26.53Operating Cost per Revenue Vehicle Mile $2.17 $2.35 8.53
*2005 figures are based on a sample of the data that was available from the 2005 Summary of Community and Brokered Transportation. The transportation providers sampled had data for both 2005 and 2010 reporting years. The 2005 publication stated the following statewide averages for 33 providers: Cost/Trip = $11.60; Cost/Vehicle Hour = $41.37 and Cost/Vehicle Mile = $2.23 respectively.

Summary of Public Transportation – 2010 Page 147 November 2011
HopeSource TransportationBob RicheyTransportation Manager 700 E. Mountain View, Suite 501Ellensburg, WA 98926509‑925‑1448www.hopesource.us
System Snapshot• Operating Name: HopeSource
• Service Range: Kittitas County
• Congressional District: 4
• Legislative District: 13
• Planning Region: Quad County RTPO
• Medicaid Brokerage Region: 8
• Type of Agency: Nonprofit
• Governing Body: Board of Directors with membership from community, elected official, and representative sectors.
• Types of Service and Eligibility: Fixed route and demand response for the general public. Demand response for seniors, youth, people with disabilities, and people with low‑incomes including their employment‑related needs.
• Days of Service: Monday through Sunday.
Current OperationsHopeSource currently provides intercity service between Cle Elum and Ellensburg with five round trips each day Monday through Friday. Intercity service is also provided between Kittitas and Ellensburg twice a day. HopeSource also provides a fixed route service operating seven days a week within the City of Ellensburg.
Revenue Service VehiclesTwelve ADA accessible vehicles: ten 14‑passenger cutaways (minibuses), one 7‑passenger van, and one 5‑passenger minivan.

HopeSource Transportation
Page 148 Summary of Public Transportation – 2010 November 2011
2010 Annual Operating Information
Operating CapitalTotal Annual ExpensesTotal Annual Expenses $586,226 $49,090
Sources of Revenue Funds ExpendedFare Revenues $3,458 $0Local Funds $73,011 $0State Funds $310,035 $0
Federal AssistanceFederal Section §5309 Capital Program Funds $0 $49,090 Federal Section §5311 Other than Urbanized Area Formula Funds $199,723 $0Total Federal Assistance $199,723 $49,090 Total Annual Revenues Expended $586,226 $49,090
Vehicles
Number of Vehicles in Total Fleet
Number of ADA
Accessible Vehicles in
Fleet Total 4 4
Service Data
Annual Vehicle
Revenue Miles
Annual Vehicle
Revenue Hours
Regular Unlinked
Passenger Trips
Bus 72,361 6,960 42,215 Demand Response 224,760 10,400 21,512 Total 297,121 17,360 63,727
Performance Measures 2005 2010 % ChangeOperating Cost per Passenger Trip $20.42 $9.20 -54.96Operating Cost per Revenue Vehicle Hour $47.39 $33.77 -28.74Operating Cost per Revenue Vehicle Mile $3.42 $1.97 -42.25

Summary of Public Transportation – 2010 Page 149 November 2011
Klickitat County Senior ServicesSharon CarterDirector115 West Court, MS‑CH‑21Goldendale, WA 98620509‑773‑3060www.klickitatcounty.org/senior
System Snapshot• Operating Name: Klickitat County Senior Services dba Mt. Adams
Transportation Service (MATS)
• Service Range: Klickitat County with adjacent destinations in the Columbia River Gorge and Yakima as well as Portland and Vancouver for medical appointments.
• Congressional District: 4
• Legislative District: 15
• Planning Region: Southwest Washington Regional Transportation Council
• Medicaid Brokerage Region: 7
• Type of Agency: General Purpose Government
• Governing Body: Klickitat County
• Types of Service and Eligibility: Dial‑a‑Ride and volunteer drivers for the general public
• Days of Service: Monday through Friday, weekends for essential medical services only.
• Base Fare: $1.00 local.
Current OperationsMt. Adams Transportation Services (MATS) provides Medicaid, public, and senior transportation for medical appointments, employment (limited), social service appointments, educational opportunities, and grocery shopping. This service is designed to enable Klickitat County residents who lack transportation resources to meet their basic needs.
Revenue Service VehiclesSix ADA accessible cutaways (minibuses) and five minivans (four are ADA accessible).
Intermodal ConnectionsAmtrak
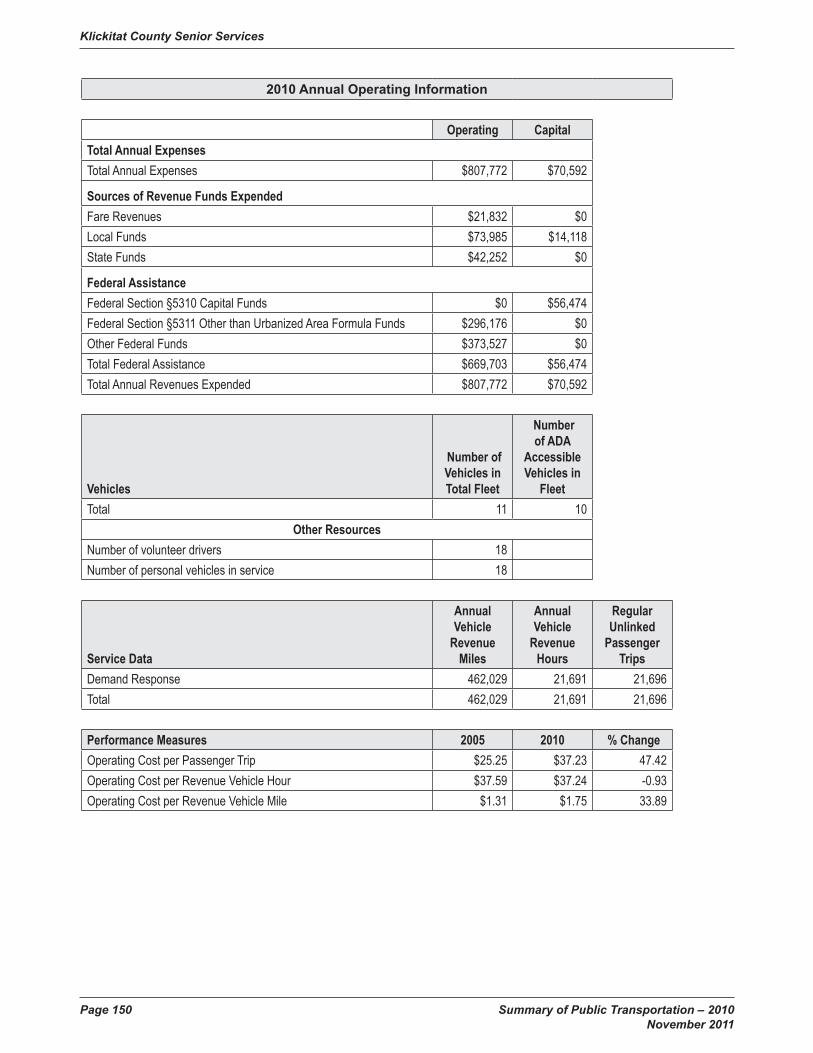
Klickitat County Senior Services
Page 150 Summary of Public Transportation – 2010 November 2011
2010 Annual Operating Information
Operating CapitalTotal Annual ExpensesTotal Annual Expenses $807,772 $70,592
Sources of Revenue Funds ExpendedFare Revenues $21,832 $0Local Funds $73,985 $14,118 State Funds $42,252 $0
Federal AssistanceFederal Section §5310 Capital Funds $0 $56,474Federal Section §5311 Other than Urbanized Area Formula Funds $296,176 $0Other Federal Funds $373,527 $0Total Federal Assistance $669,703 $56,474 Total Annual Revenues Expended $807,772 $70,592
Vehicles
Number of Vehicles in Total Fleet
Number of ADA
Accessible Vehicles in
Fleet Total 11 10
Other ResourcesNumber of volunteer drivers 18 Number of personal vehicles in service 18
Service Data
Annual Vehicle
Revenue Miles
Annual Vehicle
Revenue Hours
Regular Unlinked
Passenger Trips
Demand Response 462,029 21,691 21,696 Total 462,029 21,691 21,696
Performance Measures 2005 2010 % Change Operating Cost per Passenger Trip $25.25 $37.23 47.42Operating Cost per Revenue Vehicle Hour $37.59 $37.24 -0.93Operating Cost per Revenue Vehicle Mile $1.31 $1.75 33.89

Summary of Public Transportation – 2010 Page 151 November 2011
L.E.W.I.S. Mountain Highway TransitDouglas H. HaydenExecutive DirectorPO Box 789123 Main AvenueMorton, WA 98356360‑496‑5404www.piercecountyrides.com/media/pdf/lewismthwytransit.pdf
System Snapshot• Operating Name: White Pass Community Services Coalition
dba L.E.W.I.S. Mountain Highway Transit
• Service Range: Eastern Lewis County into Centralia/Chehalis
• Congressional District: 3
• Legislative District: 20
• Planning Region: Southwest Washington RTPO
• Medicaid Brokerage Region: 6
• Type of Agency: Nonprofit
• Governing Body: Six member board of directors.
• Types of Service and Eligibility: Fixed‑route, intercity service for general public and deviated‑route service and demand response for passengers with disabilities. Shuttle service for seniors and passengers with disabilities.
• Days of Service: Monday through Friday for fixed route and dial-a-ride. Tuesdays and Thursdays for shuttle.
• Base Fare: Regular fare $3.00 per boarding; seniors/people with disabilities fare $1.50 per boarding
Current OperationsFixed‑route deviated service through Lewis County’s rural eastern communities. Route runs between Packwood, Randle, Glenoma, Morton, Mossyrock, Silver Creek, Salkum, Ethel, Onalaska to Centralia. Connections in Centralia: Centralia Community College, Amtrak Station, Lewis County Mall (site of DSHS-WorkFirst and Employment Security’s WorkSource programs), Wal*Mart, Lewis County Courthouse, and Juvenile Justice Center.
Revenue Service VehiclesTen ADA accessible cutaways (minibuses) and two ADA accessible buses.

L.E.W.I.S. Mountain Highway Transit
Page 152 Summary of Public Transportation – 2010 November 2011
2010 Annual Operating Information
Operating CapitalTotal Annual ExpensesTotal Annual Expenses $323,698 $0
Sources of Revenue Funds ExpendedFare Revenues $10,463 $0Local Funds $9,561 $0State Funds $196,628 $0
Federal AssistanceFederal Section §5311 Other than Urbanized Area Formula Funds $107,046 $0Total Federal Assistance $107,046 $0Total Annual Revenues Expended $323,698 $0
Vehicles
Number of Vehicles in Total Fleet
Number of ADA
Accessible Vehicles in
Fleet Total 12 12
Service Data
Annual Vehicle
Revenue Miles
Annual Vehicle
Revenue Hours
Regular Unlinked
Passenger Trips
Bus 121,203 3,616 6,899 Demand Response 14,168 729 730 Total 135,371 4,345 7,629
Performance Measures 2005 2010 % Change Operating Cost per Passenger Trip $60.81 $42.43 -30.23Operating Cost per Revenue Vehicle Hour $154.16 $74.50 -51.67Operating Cost per Revenue Vehicle Mile $4.46 $2.39 -46.40

Summary of Public Transportation – 2010 Page 153 November 2011
Lower Columbia Community Action Council Michael TorresProgram Director1526 Commerce AvenueLongview, WA 98632360‑425‑3430www.lowercolumbiacap.org
System Snapshot• Operating Name: Lower Columbia Community Action Council (CAP)• Service Range: Longview to Chehalis, Longview to Vancouver.• Congressional District: 3• Legislative Districts: 18, 19, 20, and 49• Planning Regions: Southwest Washington RTPO and Cowlitz‑Wahkiakum
Council of Governments• Medicaid Brokerage Region: 7• Type of Agency: Nonprofit• Governing Body: 12‑member Board of Directors.• Types of Service and Eligibility: Fixed‑route service for the general public and
demand response for senior citizens and people with disabilities.• Days of Service: Monday through Saturday• Base Fare: $1.00
Current Operations• Six round trips Weekdays and two round trips Saturday between Longview and
Vancouver (Salmon Creek Park and Ride) with stops in Kalama, and Woodland.• Four round trips Weekdays between Longview and Chehalis (Walmart) with stops
in Castle Rock and Exit 63 near Toledo/Winlock.• Paratransit services in the Longview/Kelso area. Demand response services for
seniors living in Cowlitz and Wahkiakum Counties.• Transportation for private pay clients.• Rides for seniors provided by volunteer drivers as a Retired Senior Volunteer
Program (RSVP) agency.• Medicaid client transportation services.
Revenue Service VehiclesEight vehicles total, Six ADA accessible cutaways (minibuses), One ADA accessible van and one 6‑passenger minivan.
Intermodal ConnectionsCommunity Urban Bus Service (CUBS) in Longview/Kelso, L.E.W.I.S. Mountain Transit in Lewis County, C‑TRAN in Clark County, Twin Transit in Lewis County, Greyhound Bus Lines in Kelso and Amtrak in Kelso.

Lower Columbia Community Action Council
Page 154 Summary of Public Transportation – 2010 November 2011
2010 Annual Operating Information
Operating CapitalTotal Annual ExpensesTotal Annual Expenses $518,508 $108,976 Sources of Revenue Funds ExpendedFare Revenues $32,795 $0Local Funds $8,549 $21,794 State Funds $172,679 $0Federal AssistanceFederal Section §5310 Capital Funds $0 $41,334 Federal Section §5311 Other than Urbanized Area Formula Funds $95,804 $0FTA JARC (§5316) Program Funds $0 $45,848 Other Federal Funds $208,681 $0Total Federal Assistance $304,485 $87,182
Vehicles
Number of Vehicles in Total Fleet
Number of ADA
Accessible Vehicles in
Fleet Total 8 7 Other ResourcesNumber of volunteer drivers 8 Number of personal vehicles in service 8
Service Data
Annual Vehicle
Revenue Miles
Annual Vehicle
Revenue Hours
Regular Unlinked
Passenger Trips
Sponsored Unlinked
TripsBus 179,715 4,821 33,217 - Demand Response 145,923 5,019 - 4,722 Total 325,638 9,840 33,217 4,722
Performance Measures 2005 2010 % Change Operating Cost per Passenger Trip $14.73 $13.67 -7.20Operating Cost per Revenue Vehicle Hour $16.50 $52.69 219.33Operating Cost per Revenue Vehicle Mile $0.83 $1.59 92.34

Summary of Public Transportation – 2010 Page 155 November 2011
Makah Public TransitPatty ManuelAssistant General ManagerPO Box 115150 Resort DriveNeah Bay, WA 98357360‑645‑3100www.makah.com/transit.htm
System Snapshot• Operating Name: Makah Public Transit
• Service Range: Neah Bay village and surrounding housing areas
• Congressional District: 6
• Legislative District: 24
• Planning Region: Peninsula RTPO
• Medicaid Brokerage Region: 5
• Type of Agency: Tribal Government
• Governing Body: Makah Indian Tribal Council
• Types of Service and Eligibility: 16-mile fixed route service available to the general public. Demand response for people with disabilities and seniors aged 62 and older.
• Days of Service: Monday through Friday
• Base Fare: Youth aged six and under, seniors aged 62 and over, and people with disabilities – free. Adults – $0.25.
Current OperationsFixed route service for the general public from community subdivisions to primary destinations such as the General Store, Post Office, Makah Tribal Business Offices, Senior Citizens Programs, Social and Health Services, Indian Health Services, USDA Commodities Program, and connection service to Clallam Transit.
Revenue Service VehiclesTwo 25‑passenger, ADA accessible cutaways (minibuses).
Intermodal ConnectionsClallam Transit

Makah Public Transit
Page 156 Summary of Public Transportation – 2010 November 2011
2010 Annual Operating Information
Operating CapitalTotal Annual ExpensesTotal Annual Expenses $128,981 $117,674
Sources of Revenue Funds ExpendedFare Revenues $359 $0Local Funds $64,311 $0
Federal AssistanceFederal Section §5311 Other than Urbanized Area Formula Funds $64,311 $0ARRA §5311 Other than Urbanized Area Formula Funds $0 $117,674 Total Federal Assistance $64,311 $117,674 Total Annual Revenues Expended $128,981 $117,674
Vehicles
Number of Vehicles in Total Fleet
Number of ADA
Accessible Vehicles in
Fleet Total 2 2
Service Data
Annual Vehicle
Revenue Miles
Annual Vehicle
Revenue Hours
Regular Unlinked
Passenger Trips
Bus 22,469 1,497 3,632 Total 22,469 1,497 3,632
Performance Measures 2005 2010 % Change Operating Cost per Passenger Trip $67.54 $35.51 -47.42Operating Cost per Revenue Vehicle Hour $4.10 $86.16 1999.49Operating Cost per Revenue Vehicle Mile $5.31 $5.74 8.18

Summary of Public Transportation – 2010 Page 157 November 2011
Okanogan County Transportation and NutritionLeanne WhitenerExecutive DirectorPO Box 711, 431 5th Avenue WestOmak, WA 98841509‑826‑4391www.octn.org/
System Snapshot• Operating Name: Okanogan County Transportation and Nutrition• Service Range: Okanogan County• Congressional District: 5• Legislative District: 12• Planning Region: North Central RTPO• Medicaid Brokerage Region: 9• Type of Agency: Nonprofit• Governing Body: Board of Directors• Types of Service and Eligibility: Intercity, demand response, and deviated fixed
route for the general public• Days of Service: Monday through Friday• Base Fare: Seniors – suggested donation; people with disabilities – $1.50 for
all day; general public – $1.00 per intercity boarding. Fares based on location of boarding and destination.
Current Operations• Door-to-door, dial-a-ride service provided within six small communities of
Okanogan County (Omak, Okanogan, Oroville, Tonasket, Twisp, and Brewster).• Deviated fixed route service in Omak/Okanogan area.• Intercity trips to Wenatchee from Omak, Okanogan, Oroville, Tonasket, Twisp,
and Brewster twice monthly to provide access to services, goods, and other forms of transportation.
• Intercity trips to Omak/Okanogan area once a month from Oroville, Tonasket, Twisp, and Brewster.
• Intercity, employment-related transportation for low-income and/or people with disabilities.
• Two daily round trips, Monday through Thursday from Omak to Bridgeport/Brewster and Three daily round trips, Monday through Friday from Omak and Oroville.
Revenue Service VehiclesThirteen ADA accessible cutaways (minibuses): one 11‑passenger and twelve 15‑passenger.
Intermodal ConnectionsNorthwest Trailways

Okanogan County Transportation and Nutrition
Page 158 Summary of Public Transportation – 2010 November 2011
2010 Annual Operating Information
Operating CapitalTotal Annual ExpensesTotal Annual Expenses $555,967 $168,506
Sources of Revenue Funds ExpendedFare Revenues $48,562 $0Contract Revenues $168,848 $0Local Funds $13,959 $51,984 State Funds $223,770 $0
Federal AssistanceFederal Section §5310 Capital Funds $0 $116,522 Federal Section §5311 Other than Urbanized Area Formula Funds $62,615 $0FTA JARC (§5316) Program Funds $38,213 $0Total Federal Assistance $100,828 $116,522 Total Annual Revenues Expended $555,967 $168,506
Vehicles
Number of Vehicles in Total Fleet
Number of ADA
Accessible Vehicles in
Fleet Total 13 13
Service Data
Annual Vehicle
Revenue Miles
Annual Vehicle
Revenue Hours
Regular Unlinked
Passenger Trips
Bus 151,181 14,857 54,631 Demand Response 23,227 1,690 8,222 Total 174,408 16,547 62,853
Performance Measures 2005 2010 % Change Operating Cost per Passenger Trip $16.74 $8.85 -47.16Operating Cost per Revenue Vehicle Hour $53.91 $33.60 -37.68Operating Cost per Revenue Vehicle Mile $3.53 $3.19 -9.71

Summary of Public Transportation – 2010 Page 159 November 2011
People For People – Moses LakeJeff RailtonEastern Region Operations Manager843 Kittleson RoadMoses Lake, WA 98837509‑765‑9249www.pfp.org
System Snapshot• Operating Name: People For People – Moses Lake• Service Range: Grant, Adams, and Lincoln Counties• Congressional Districts: 4 and 5• Legislative Districts: 7, 9, 12, and 13• Planning Region: Quad County RTPO• Medicaid Brokerage Region: 11 (1C)• Type of Agency: Nonprofit• Governing Body: Nine‑member volunteer Board of Directors.• Types of Service and Eligibility: Demand response and deviated/fixed route
service for persons with special needs as well as the general public. Contractor for Grant Transit Authority providing fixed route/demand response service in Grant County.
• Days of Service: Weekedays – Paratransit; Monday through Saturday – Grant County fixed route/ADA
• Base Fare: People For People is fare free (Donations are accepted)
Current OperationsFor seniors to access nutrition sites, health care, social services, recreation, and educational opportunities. Weekly trips to city centers for seniors and other residents in Adams County and for shopping and personal business. For persons with disabilities to sheltered workshops, job training, social services, health care, shopping facilities, and community activities. For low‑income residents of Grants, Lincoln, and Adams counties for employment and employment‑related services. For Grant County special needs individuals to access basic services. Community Connectors from rural communities to Spokane and Moses Lake. Health Shuttle to Wenatchee from Moses Lake, Ephrata and Quincy for cancer treatment and medical care.
Revenue Service VehiclesThirty‑four vehicles for service in Grant, Adams, and Lincoln counties. All are ADA accessible: one 32 passenger coach; thirty 14‑passenger cutaways (minibuses) and three 5-passenger minivans. PFP also operates twelve 30+ passenger buses owned by Grant Transit Authority.
Intermodal ConnectionsGrant Transit Authority, Link Transit, Spokane Transit Authority, Northwestern Trailways, Greyhound, Amtrak and Special Mobility Services

People For People – Moses Lake
Page 160 Summary of Public Transportation – 2010 November 2011
2010 Annual Operating Information
Operating CapitalTotal Annual ExpensesTotal Annual Expenses $1,433,480 $0
Sources of Revenue Funds ExpendedFare Revenues $5,587 $0Contract Revenues $751,693 $0State Funds $592,604 $0
Federal AssistanceFederal Section §5311 Other than Urbanized Area Formula Funds $25,259 $0FTA JARC (§5316) Program Funds $58,337 $0Total Federal Assistance $83,596 $0Total Annual Revenues Expended $1,433,480 $0
Vehicles
Number of Vehicles in Total Fleet
Number of ADA
Accessible Vehicles in
Fleet Total 31 31
Service Data
Annual Vehicle
Revenue Miles
Annual Vehicle
Revenue Hours
Regular Unlinked
Passenger Trips
Bus 99,786 4,577 10,680 Demand Response 384,455 22,671 45,416 Total 484,241 27,248 56,096
Performance Measures 2005 2010 % Change Operating Cost per Passenger Trip $19.03 $25.55 34.31Operating Cost per Revenue Vehicle Hour $44.77 $52.61 17.51Operating Cost per Revenue Vehicle Mile $2.06 $2.96 43.82

Summary of Public Transportation – 2010 Page 161 November 2011
People For People – YakimaGracie SextonTransportation Operations Manager304 West Lincoln AvenueYakima, WA 98902509‑248‑6726www.pfp.org
System Snapshot• Operating Name: People For People – Yakima• Service Range: Yakima County• Congressional District: 4• Legislative Districts: 13, 14, and 15• Planning Region: Yakima Valley Conference of Governments• Type of Agency: Nonprofit• Governing Body: Nine‑member volunteer Board of Directors.• Types of Service and Eligibility: Demand response for seniors and persons with
disabilities living in Yakima County; intercity service for special needs and general public; deviated fixed route and demand response.
• Days of Service: Monday–Friday, 5:00 a.m. to 6:00 p.m.• Base Fare: Fare Free
Current Operations• Transportation for senior citizens to nutrition sites, medical services, mental health
services, and human services in Yakima County.• Transportation for people with disabilities to job training, human services, medical
appointments, access to shopping facilities, and other community activities.• Transportation for WorkFirst clients and people living at the poverty level.• Demand response and deviated/fixed route services for the general public living
in rural areas of Yakima who do not qualify for other public transportation or special needs transportation services.
• Community Connector route, providing intercity service within the I-82 Corridor between Yakima and Prosser with access to Yakima Transit and Ben‑Franklin Transit.
Revenue Service VehiclesThirty‑one vehicles for Yakima County service; includes two vans and 29 cutaways. All vehicles are ADA accessible.
Intermodal ConnectionsBen‑Franklin Transit, Yakima Transit, Greyhound, Pahto Public Passage and Airporter Shuttle.

People For People – Yakima
Page 162 Summary of Public Transportation – 2010 November 2011
2010 Annual Operating Information
Operating CapitalTotal Annual ExpensesTotal Annual Expenses $1,795,689 $915,000
Sources of Revenue Funds ExpendedContract Revenues $547,835 $0Local Funds $0 $178,160 State Funds $380,723 $115,736
Federal AssistanceFederal Section §5310 Capital Funds $649,886 $621,104 Federal Section §5311 Other than Urbanized Area Formula Funds $93,746 $0FTA JARC (§5316) Program Funds $123,499 $0Total Federal Assistance $867,131 $621,104 Total Annual Revenues Expended $1,795,689 $915,000
Vehicles
Number of Vehicles in Total Fleet
Number of ADA
Accessible Vehicles in
Fleet Total 33 32
Service Data
Annual Vehicle
Revenue Miles
Annual Vehicle
Revenue Hours
Regular Unlinked
Passenger Trips
Bus 387,454 17,328 79,079 Demand Response 274,537 15,833 17,812 Total 661,991 33,161 96,891
Performance Measures 2005 2010 % Change Operating Cost per Passenger Trip $22.23 $18.53 -16.63Operating Cost per Revenue Vehicle Hour $68.04 $54.15 -20.42Operating Cost per Revenue Vehicle Mile $3.62 $2.71 -25.04

Summary of Public Transportation – 2010 Page 163 November 2011
Rural Resources Community ActionKelly ScalfTransportation Division Director956 South MainColville, WA 99114509‑685‑6108www.ruralresources.org
System Snapshot• Operating Name: Rural Resources Community Action• Service Range: Stevens, Ferry, and Pend Oreille Counties• Congressional District: 5• Legislative District: 7• Planning Region: North East Washington RTPO• Medicaid Brokerage Region: 10• Type of Agency: Nonprofit• Governing Body: Board of directors• Types of Service and Eligibility: General public transportation; senior
transportation; and Head Start transportation for preschool aged, low‑income children in Colville, Newport, and Kettle Falls.
• Days of Service: Weekdays, some volunteer transportation is available evenings and weekends.
• Base Fare: Commuter service – $0.50 per trip. All other services are donation based (suggested level $0.50 for local trips and $5.00 for intercity trips).
Current Operations• Two, fixed-route Commuter Services twice daily between Kettle Falls and Colville
and between Colville and Chewelah.• Dial-a-Ride services operate Monday through Thursday in Ferry County between
Curlew and Republic; and in Pend Oreille County from Cusick/Usk to Newport and weekdays in Stevens County between Colville and Kettle Falls.
• Bi-weekly trips to Kettle Falls, Colville, and Chewelah to provide access to medical facilities, social services, shopping, libraries, and recreation.
• Senior transportation for medical transportation and nutritional support to meal sites and shopping.
Revenue Service VehiclesThirteen vehicles total. Seven 14‑passenger ADA accessible cutaways (minibuses). Six school buses for Head Start transportation. Three are ADA accessible, lift-equipped.
Intermodal ConnectionsThe Goldline intercity bus and volunteer drivers support limited access to intermodal connections.

Rural Resources Community Action
Page 164 Summary of Public Transportation – 2010 November 2011
2010 Annual Operating Information
Operating CapitalTotal Annual ExpensesTotal Annual Expenses $521,535 $0
Sources of Revenue Funds ExpendedFare Revenues $2,719 $0Contract Revenues $24,850 $0Local Funds $98,344 $0State Funds $154,560 $0
Federal AssistanceFederal Section §5311 Other than Urbanized Area Formula Funds $132,858 $0Other Federal Funds $101,024 $0Total Federal Assistance $233,882 $0Other Funds $7,180 $0Total Annual Revenues Expended $521,535 $0
Vehicles
Number of Vehicles in Total Fleet
Number of ADA
Accessible Vehicles in
Fleet Total 13 9 Other ResourcesNumber of volunteer drivers 10 Number of personal vehicles in service 10
Service Data
Annual Vehicle
Revenue Miles
Annual Vehicle
Revenue Hours
Regular Unlinked
Passenger Trips
Bus 41,851 1,446 4,170 Demand Response 249,996 10,828 19,602 Total 291,847 12,274 23,772
Performance Measures 2005 2010 % Change Operating Cost per Passenger Trip $22.07 $21.94 -0.61Operating Cost per Revenue Vehicle Hour $42.46 $42.49 0.06Operating Cost per Revenue Vehicle Mile $1.96 $1.79 -8.66

Summary of Public Transportation – 2010 Page 165 November 2011
Skamania County Senior ServicesMarilyn Butler, DirectorBreAnna Porter, Assistant DirectorPO Box 369710 SW Rock Creek DriveStevenson, WA 98648509‑427‑3990www.skamaniacounty.org/senior‑services
System Snapshot• Operating Name: Skamania County Senior Services• Service Range: Skamania County and a 50‑mile radius outside the county borders• Congressional Districts: 3• Legislative District: 15 and 17• Planning Region: Southwest Washington Regional Transportation Council• Medicaid Brokerage Region: 7• Type of Agency: General Purpose Government• Governing Body: Three member board of county commissioners• Types of Service and Eligibility: Demand response transportation for Skamania
County residents and Route‑Deviated Transit• Days of Service: Primarily Monday‑Friday • Base Fare: Transit $1.00 (in county); $2.00 (out of county). Demand Response
$2.00 (in county); $4.00 (out of county). Demand Response (age 60 and over) Donations requested.
Current OperationsTransportation services are available for seniors, persons with disabilities, Medicaid recipients, and the general public.
Demand response provides access to medical and social service appointments, and essential shopping.
Transit provides a route‑deviated service, Monday through Friday, between Skamania County and Fisher’s Landing Transit Center in Vancouver, Washington.
Revenue Service VehiclesEleven vehicles total: Two 18-passenger transit buses (ADA accessible), One 18‑passenger demand response bus (ADA accessible), Four 5‑passenger minivans (ADA accessible), One 7‑passenger full size van (ADA accessible), Two 6‑passenger minivans (non ADA accessible)
Intermodal ConnectionsTri‑met (Portland, Oregon) and C‑TRAN (Vancouver, Washington).

Skamania County Senior Services
Page 166 Summary of Public Transportation – 2010 November 2011
2010 Annual Operating Information
Operating CapitalTotal Annual ExpensesTotal Annual Expenses $441,715 $0
Sources of Revenue Funds ExpendedFare Revenues $19,545 $0Local Funds $145,338 $0State Funds $220,307 $0
Federal AssistanceFederal Section §5311 Other than Urbanized Area Formula Funds $56,525 $0Other Federal Funds $56,525 $0Total Federal Assistance $441,715 $0
Vehicles
Number of Vehicles in Total Fleet
Number of ADA
Accessible Vehicles in
Fleet Total 9 9
Service Data
Annual Vehicle
Revenue Miles
Annual Vehicle
Revenue Hours
Regular Unlinked
Passenger Trips
Bus 80,272 3,139 13,959 Demand Response 166,293 6,710 10,356 Total 246,565 9,849 24,315
Performance Measures 2005 2010 % Change Operating Cost per Passenger Trip $20.25 $18.17 -10.29Operating Cost per Revenue Vehicle Hour $31.42 $44.85 42.74Operating Cost per Revenue Vehicle Mile $1.54 $1.79 16.33

Summary of Public Transportation – 2010 Page 167 November 2011
Special Mobility Services, Inc.Dave “Hutch” HutchissonSupervisorNorth 707 NapaSpokane, WA 99202509‑534‑7171www.sms1.org
System Snapshot• Operating Name: Special Mobility Services, Inc.• Service Range: Spokane County; Newport; Davenport; Ritzville;
Priest River, Idaho• Congressional District: 5• Legislative Districts: 3, 4, 6, and 7• Planning Regions: Spokane Regional Transportation Council, Northeast
Washington RTPO, and Quad‑County RTPO• Medicaid Brokerage Regions: 10, 11, 12, and 13• Type of Agency: Nonprofit• Governing Body: Five‑member Board of Directors.• Types of Service and Eligibility: Fixed route, deviated route, and demand
response, for the general public.• Days of Service: Five days a week• Base Fare: Varies by route
Current OperationsFixed Route Services• Ritzville/Spokane Shuttle: operates Thursdays.• Davenport/Spokane Shuttle: operates Mondays, Wednesdays, and Fridays.
Deviated Fixed Route• Deer Park/Spokane Shuttle: operates weekdays.• Newport/Spokane/Newport/Priest River, ID Shuttle: operates twice daily,
weekdays except Tuesdays.
Demand Response• Service for residents living north of STA’s service area, including the communities
of Deer Park, Elk, Chattaroy, and Colbert.• Spokane County Mental Health: twenty-four hours a day, seven days a week
service for crisis response emergency transportation.

Special Mobility Services, Inc.
Page 168 Summary of Public Transportation – 2010 November 2011
Revenue Service VehiclesNine 14-passenger ADA accessible minibuses and two 7-passenger cars, equipped for secure transports
Intermodal ConnectionsNortheast Rural Resources with the Newport Shuttle once a week. People for People services coordinate with the Davenport and Ritzville Shuttles. Greyhound and Amtrak in Spokane

Special Mobility Services, Inc.
Summary of Public Transportation – 2010 Page 169 November 2011
2010 Annual Operating Information
Operating CapitalTotal Annual ExpensesTotal Annual Expenses $603,720 $0
Sources of Revenue Funds ExpendedFare Revenues $20,227 $0Contract Revenues $244,657 $0Local Funds $21,098 $0State Funds $243,687 $0
Federal AssistanceFederal Section §5311 Other than Urbanized Area Formula Funds $74,050 $0Total Federal Assistance $74,050 $0Total Annual Revenues Expended $603,720 $0
Vehicles
Number of Vehicles in Total Fleet
Number of ADA
Accessible Vehicles in
Fleet Total 12 12
Service Data
Annual Vehicle
Revenue Miles
Annual Vehicle
Revenue Hours
Regular Unlinked
Passenger Trips
Bus 136,995 6,334 19,004 Demand Response 60,575 3,497 1,911 Total 197,570 9,831 20,915
Performance Measures 2005 2010 % Change Operating Cost per Passenger Trip $14.70 $28.87 96.41Operating Cost per Revenue Vehicle Hour $38.60 $61.41 59.07Operating Cost per Revenue Vehicle Mile $2.00 $3.06 53.00

Special Mobility Services, Inc.
Page 170 Summary of Public Transportation – 2010 November 2011

Summary of Public Transportation – 2010 Page 171 November 2011
Spokane Indian Tribe
Dena MosesTransit ManagerPO Box 217Wellpinit, WA 99040509‑455‑6549www.spokanetribe.com
System Snapshot• Operating Name: Spokane Indian Tribe DBA: The Moccasin Express
• Service Range: The Spokane Indian Reservation, off reservation to Reardan
• Congressional District: 5
• Legislative District: 7
• Planning Region: Northeast Washington RTPO
• Medicaid Brokerage Region: 12
• Type of Agency: Tribal Government
• Governing Body: The Spokane Tribe of Indians is a sovereign government body led by the Spokane Tribal Business Council. The Council consists of the Tribal Chairman, Vice Chairman, Tribal Secretary and two Council members.
• Types of Service and Eligibility: Deviated Fixed Route for Spokane Indian Tribal members.
• Days of Service: Monday through Friday from 6:00 a.m. to 6:30 p.m.
• Base Fare: $1.00 per one‑way trip. Discounted bus passes are available for $10.00 for students and seniors $20.00 for 30 one‑way trips.
Current OperationsService to: West End Community Center, Two Rivers Casino, Wellpinit, New House Lane Youth Center, Ford Cluster, Ford Post Office, Kurts Korner, Boardman, Kokanee as well as Sherwood Loop. Service is also provided to Readan daily.
Revenue Service VehiclesTwo 14‑passenger ADA accessible minibuses.
Intermodal ConnectionsThe Moccasin Express meets with SMS from Lincoln County daily and a phone call a day ahead assures a seat on the SMS to Spokane .

Spokane Indian Tribe
Page 172 Summary of Public Transportation – 2010 November 2011
2010 Annual Operating Information
Operating CapitalTotal Annual ExpensesTotal Annual Expenses $39,297 $357,556
Sources of Revenue Funds ExpendedLocal Funds $0 $29,584 State Funds $16,966 $0
Federal AssistanceFederal Section §5311 Other than Urbanized Area Formula Funds $16,966 $118,335 Federal Section §5311 Tribal Transit Funds $5,365 $0ARRA §5311 Other than Urbanized Area Formula Funds $0 $209,637 Total Federal Assistance $22,331 $327,972 Total Annual Revenues Expended $39,297 $357,556
Vehicles
Number of Vehicles in Total Fleet
Number of ADA
Accessible Vehicles in
Fleet Total 2 2
Service Data
Annual Vehicle
Revenue Miles
Annual Vehicle
Revenue Hours
Regular Unlinked
Passenger Trips
Bus 14,577 539 143 Total 14,577 539 143

Summary of Public Transportation – 2010 Page 173 November 2011
Squaxin Island Tribe
David LopemanChairman10 SE Squaxin LaneShelton, WA 98584360‑426‑9781www.squaxinisland.org
System Snapshot• Operating Name: Squaxin Island Tribe
• Service Range: Kamilche, Mason County; Elma, Grays Harbor County; and Steamboat Island, Thurston County
• Congressional District: 6
• Legislative District: 35
• Planning Region: Peninsula RTPO
• Medicaid Brokerage Region: 6
• Type of Agency: Tribal Government
• Governing Body: Tribal Council consisting of seven members who are elected during annual general body meetings and serve staggered terms.
• Types of Service and Eligibility: Fixed route and demand response for Squaxin Island Tribal members and Mason County service area residents with disabilities.
• Days of Service: Monday through Friday
• Base Fare: Free
Current Operations• Fixed route service with route deviations offered.
• Connect Squaxin Tribal Community with Mason County transit hub which offers service to Shelton and Olympia.
• One trip daily to Elma that connects with Grays Harbor Transit. A second trip is available by request.
• Contracted with Mason County Transportation Authority to provide dial-a-ride services within the service range.
Revenue Service VehiclesFour vehicles total, all ADA accessible minibuses with seating capacities of 12, 15, 16, and 22 respectively.
Intermodal ConnectionsIntercity Transit, Grays Harbor County Transit, and Mason County Transportation Authority.

Squaxin Island Tribe
Page 174 Summary of Public Transportation – 2010 November 2011
2010 Annual Operating Information
Operating CapitalTotal Annual ExpensesTotal Annual Expenses $156,278 $0
Sources of Revenue Funds ExpendedFare Revenues $78,838 $0
Federal AssistanceFederal Section §5311 Other than Urbanized Area Formula Funds $20,138 $0Federal Section §5311 Tribal Transit Funds $57,302 $0Total Federal Assistance $77,440 $0Total Annual Revenues Expended $156,278 $0
Vehicles
Number of Vehicles in Total Fleet
Number of ADA
Accessible Vehicles in
Fleet Total 4 4
Service Data
Annual Vehicle
Revenue Miles
Annual Vehicle
Revenue Hours
Regular Unlinked
Passenger Trips
Bus 32,872 2,108 8,698 Total 32,872 2,108 8,698
Performance Measures 2005 2010 % Change Operating Cost per Passenger Trip $21 .33 $17 .97 -15 .77Operating Cost per Revenue Vehicle Hour $105 .72 $74 .14 -29 .87Operating Cost per Revenue Vehicle Mile $6 .17 $4 .75 -22 .91

Summary of Public Transportation – 2010 Page 175 November 2011
Thurston Regional Planning Council
Karen ParkhurstSenior Planner2424 Heritage Court SW, Suite AOlympia, WA 98502‑6031360‑956‑7575www.trpc.org
System Snapshot• Operating Name: Rural and Tribal Transportation Program (R/T) operated by
Thurston Regional Planning Council and TOGETHER!• Service Range: Nisqually Reservation and surrounding rural areas of Yelm and
Rainier and the Confederated Tribes of the Chehalis Reservation and adjacent rural communities of Tenino, Bucoda, and Rochester.
• Congressional Districts: 3 and 9• Legislative Districts: 20, 22, and 35• Medicaid Brokerage Region: 6• Type of Agency: Special District• Governing Body: 21‑member intergovernmental board (representatives from local
government jurisdictions and other organizations including the Nisqually Tribe and the Confederated Tribes of the Chehalis Reservation.
• Types of Service and Eligibility: Route deviated and demand response service for the general public focusing on low‑income clients and special needs clients.
• Days of Service: Monday through Friday• Base Fare: $1 per one‑way trip. Accept passes/transfers from Intercity and Twin
Transit and state employee STAR Pass in lieu of fare.
Current OperationsR/T connects rural residents to the urban core areas to access jobs, education, and services. R/T feeds into the service areas of Intercity Transit (Thurston County) and Twin Transit (Lewis County). R/T also coordinates with Mason, Grays Harbor, and Pierce counties and the Squaxin Indian Tribe. R/T provides connections to communities along the I‑5 corridor to the north via Intercity, Sound, Pierce and other Transits, to Greyhound services in Olympia, and AMTRAK in Olympia. R/T coordinates with Senior Services for South Sound for transportation to adult day care and other elder programs. R/T connects veterans to services in the urban cores, with emphasis on the new facility in Lewis County and connections to services in Pierce County.
Revenue Service VehiclesSeven ADA accessible cutaway (minibus), TRPC does not own the vehicles or directly provide the service.
Intermodal ConnectionsIntercity Transit in Thurston County and Twin Transit in Lewis County.

Thurston Regional Planning Council
Page 176 Summary of Public Transportation – 2010 November 2011
2010 Annual Operating Information
Operating CapitalTotal Annual ExpensesTotal Annual Expenses $508,442 $0
Sources of Revenue Funds ExpendedFare Revenues $3,048 $0Local Funds $34,195 $0State Funds $289,159 $0
Federal AssistanceFederal Section §5311 Other than Urbanized Area Formula Funds $182,040 $0Total Federal Assistance $182,040 $0Total Annual Revenues Expended $508,442 $0
Vehicles
Number of Vehicles in Total Fleet
Number of ADA
Accessible Vehicles in
Fleet Total 7 7
Service Data
Annual Vehicle
Revenue Miles
Annual Vehicle
Revenue Hours
Regular Unlinked
Passenger Trips
Demand Response 233,988 8,222 37,310 Total 233,988 8,222 37,310
Performance Measures 2005 2010 % Change Operating Cost per Passenger Trip $13.73 $13.63 -0.77Operating Cost per Revenue Vehicle Hour $59.14 $61.84 4.56Operating Cost per Revenue Vehicle Mile $2.06 $2.17 5.72

Summary of Public Transportation – 2010 Page 177 November 2011
Medicaid Transportation Brokers
Medicaid is a federal entitlement program that pays for basic health services for people with low‑income and long‑term care for seniors and people with disabilities. Congress established Medicaid in 1965 by enacting the Medical Assistance Program under Title XIX of the Social Security Act (Public Law 89‑97). States administer their own Medicaid programs and establish their own eligibility standards, benefits packages, payment rates and rules consistent with federal requirements. The federal government requires states to provide nonemergency medical transportation (NEMT) for those Medicaid clients that could not otherwise access medical facilities and services.
In 1989 Washington State established a brokerage model to cost-effectively provide NEMT services for people eligible for medical assistance under the Medicaid State Plan, who need access to health‑care services and have no other means of transportation. In 2010 the state’s NEMT services were provided by the Medical Purchasing Administration (MPA) of Department of Social and Health Services (DSHS). The Health Care Authority (HCA) took over program administration on July 1, 2011 and provided the data for this report.
The MPA identified 13 regions based on travel patterns of citizens seeking health-care services, then contracted with a network of eight regional brokers to provide services. The regional brokers are neutral third parties that arrange cost‑effective transportation access to covered medical services for eligible clients by contracting with transportation service providers and assuring compliance with all contract standards.
Medicaid Transportation Providers review requests for transportation to medical services and preauthorizes the most cost‑effective method that meets the clients’ mobility status and personal capabilities. These brokers are prohibited from directly providing transportation services in their contracted region. Brokers receive an administrative fee plus reimbursement for direct trip costs. Brokers coordinate the trip, confirm eligibility, contract with and monitor transportation providers and reimburse the direct cost for the trip. NEMT services provided nearly 3.4 million trips in 2010.
Medicaid Transportation provides access to essential health care services. By having regional Brokers, NEMT successfully connects thousands of Washington citizens each day to dialysis and chemotherapy, as well as routine doctor’s appointments for preventive health care services.

Medicaid Transportation Brokers
Page 178 Summary of Public Transportation – 2010 November 2011
Brokers of Medicaid Transportation – 2010Brokers Brokerage Regions Counties ServedCOAST Region 13 Asotin, Garfield, WhitmanHopelink Region 3 KingHuman Services Council Region 7 Clark, Cowlitz, Klickitat, Skamania,
WahkiakumNorthwest Regional Council Region 1 Island, San Juan, Skagit, WhatcomParatransit Services
Region 2 SnohomishRegion 4 PierceRegion 5 Clallam, Jefferson, Kitsap, north MasonRegion 6 Grays Harbor, Pacific, Thurston, Lewis,
south MasonPeople For People Region 8 Benton, Columbia, Franklin, Kittitas, Walla
Walla, YakimaSpecial Mobility Services, Inc.
Region 10 Ferry, Stevens, Pend OreilleRegion 11 Lincoln, Grant, AdamsRegion 12 Spokane
Trancare Region 9 Chelan, Douglas, Okanogan
RidershipRidership is the amount of service provided as measured by the number of passenger trips. In 2010 brokers of Medicaid transportation arranged nearly 3.4 million NEMT trips. Community transportation providers supplied more than half of these passenger trips, and transit systems provided almost 46 percent of the trips. The majority of transit system-supplied trips occurred on fixed routes.
In 2010 transit systems provided about 6 million trips with demand response and deviated fixed route services. Included in that number are the trips provided by transit systems that are reported in their sections.
Cost EfficiencyOperating costs per passenger trip reflect annual operating and administrative costs as a function of the number of NEMT trips provided.
Costs are directly related to the size and nature of the service area as well as the trip mode. A provider’s service range affects the distance and time needed per trip. These factors affect fuel consumption, as does the size of the vehicle. The trip mode also affects cost per trip; for example, a trip provided by a local transit agency certainly costs less than overnight air travel with accommodations and meals.

Medicaid Transportation Brokers
Summary of Public Transportation – 2010 Page 179 November 2011
Statewide
All Regions Passenger Trips ExpensesMode 2005 2010 % Change 2005 2010 % ChangePublic Bus 973,063 1,351,385 38.88 $2,581,148 $4,291,814 66.28Ambulatory 1,264,694 1,045,988 -17.29 $27,693,125 $34,094,287 23.11Non-Ambulatory 397,974 375,979 -5.53 $14,104,325 $16,450,621 16.64Public Bus-ADA 252,062 201,120 -20.21 $293,461 $388,762 32.47Voucher 260,932 333,773 27.92 $1,247,191 $2,975,968 138.61Mileage 26,590 21,182 -20.34 $212,509 $284,859 34.05Volunteer-Agency 34,593 29,084 -15.93 $1,624,681 $2,066,195 27.18Volunteer-Broker 20,118 29,774 48.00 $779,809 $1,396,669 79.10Airline 556 180 -67.63 $112,370 $52,471 -53.30Commercial Bus 165 194 17.58 $5,655 $11,027 94.99Train 151 596 294.70 $4,259 $28,540 570.12Ferry 8,383 7,189 -14.24 $51,418 $168,111 226.95Foster Parent 111 - - $251 $0 -Ancillary - - - $76,357 $310,462 306.6Service Total 3,239,392 3,396,444 4.8 $48,786,559 $62,519,786 28.1Admin - - - $8,255,307 $9,902,384 20.0Out of State 93 30 -67.7 $33,837 $28,346 -16.2Meals & Lodging/in 22,253 39,415 77.1 $830,359 $1,750,928 110.9Meals & Lodging/oos 655 369 -43.7 $23,642 $10,022 -57.6Vehicle Modification 8 - - $12,996 $0 -Subtotal - - - $9,143,145 $11,691,679 27.9Grand Total 3,239,485 3,396,474 - $57,929,704 $74,211,465 28.1
ModeCost per Trip
2005 2010 % ChangePublic Bus $2.65 $3.18 19.7Ambulatory $21.90 $32.60 48.9Non-Ambulatory $35.44 $43.75 23.5Public Bus-ADA $1.16 $1.93 66.0Voucher $4.78 $8.92 86.5Mileage $7.99 $13.45 68.3Volunteer-Agency $46.97 $71.04 51.3Volunteer-Broker $38.76 $46.91 21.0Service Total $15.06 $18.41 22.2Admin. Costs $2.55 $2.92 14.4Grand Total $17.88 $21.85 22.2

Medicaid Transportation Brokers
Page 180 Summary of Public Transportation – 2010 November 2011

Summary of Public Transportation – 2010 Page 181 November 2011
COAST
Karl JohansonExecutive DirectorP.O Box 107, 210 South MainColfax, WA 99111509‑397‑4611www.coa‑hs.org
System Snapshot• Operating Name: Council on Aging and Human Services dba COAST• Service Area: Medicaid Brokerage Region 13 – Whitman, Garfield, and Asotin
Counties• Congressional District: 5• Legislative District: 9• Planning Regions: Palouse RTPO and Lewis‑Clark Valley MPO• Type of Agency: Nonprofit• Governing Body: Fourteen‑member board, elected by existing board members
throughout Whitman County.
Current OperationsCOAST was the Medicaid transportation broker in Region 13 which served Whitman, Garfield, and Asotin Counties through December 31st 2010. COAST also served five counties in Idaho and provided the following services:• Brokerage services for Medicaid clients in Region 13 (Whitman, Garfield and
Asotin counties) in Washington.• Provides demand response routes to and from specific communities to Spokane,
Clarkston/Lewiston, and Moscow/Pullman service centers.• Provides employment-related transportation for low-income Garfield county residents.• Contracts with area partners to provide transportation for older persons and persons
with disabilities in Whitman, Asotin, and Garfield Counties and the southern region of Spokane County.
• Provides bi-monthly, demand response trips from isolated rural communities to urban service centers as well as daily routes linking Colfax and Pullman, and flexible routed services in communities of Clarkston, Pullman, and Colfax.
• Coordinates volunteer drivers including the Community Van program which provides expanded access for all citizens of the City of Palouse and nearby Town of Garfield.
• Operates a regional dispatch/information center serving the counties of Whitman, Asotin, Garfield and the southern part of Spokane County in Washington as well as Nez Perce, Idaho, Clearwater, Lewis, and Latah counties in Idaho.
Intermodal ConnectionsCOAST makes active connections with all of the existing public transit systems and providers in the area.
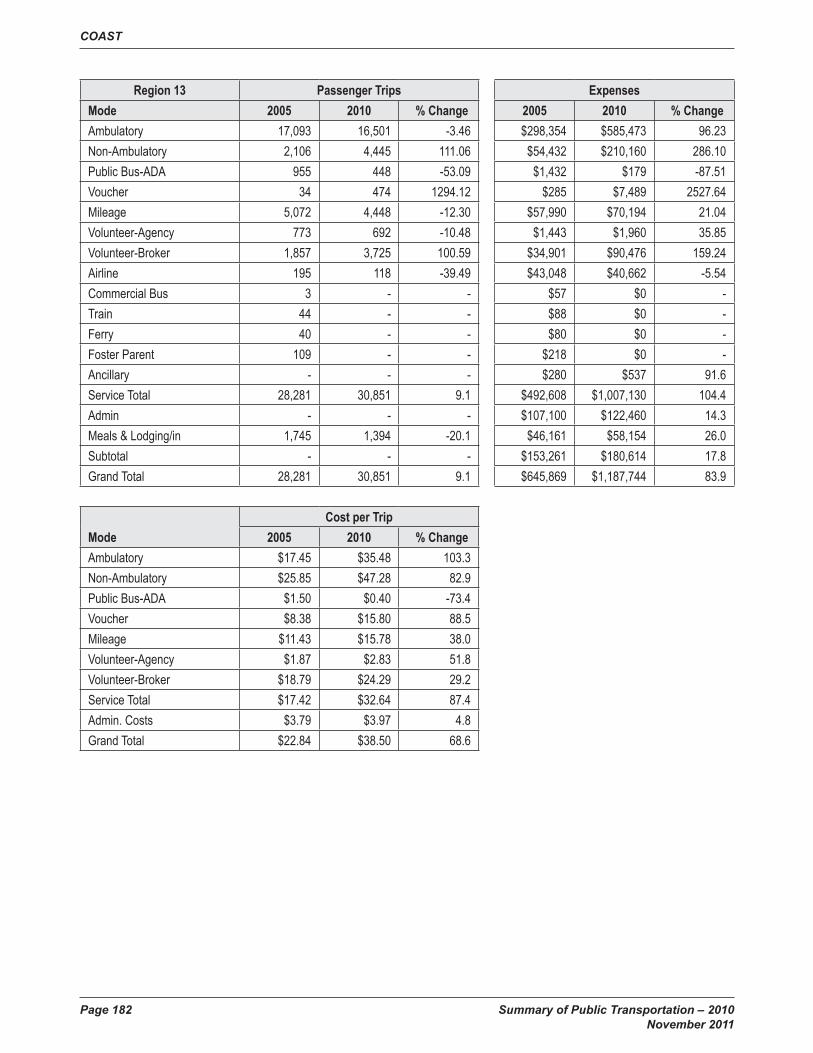
COAST
Page 182 Summary of Public Transportation – 2010 November 2011
Region 13 Passenger Trips ExpensesMode 2005 2010 % Change 2005 2010 % ChangeAmbulatory 17,093 16,501 -3.46 $298,354 $585,473 96.23Non-Ambulatory 2,106 4,445 111.06 $54,432 $210,160 286.10Public Bus-ADA 955 448 -53.09 $1,432 $179 -87.51Voucher 34 474 1294.12 $285 $7,489 2527.64Mileage 5,072 4,448 -12.30 $57,990 $70,194 21.04Volunteer-Agency 773 692 -10.48 $1,443 $1,960 35.85Volunteer-Broker 1,857 3,725 100.59 $34,901 $90,476 159.24Airline 195 118 -39.49 $43,048 $40,662 -5.54Commercial Bus 3 - - $57 $0 -Train 44 - - $88 $0 -Ferry 40 - - $80 $0 -Foster Parent 109 - - $218 $0 -Ancillary - - - $280 $537 91.6Service Total 28,281 30,851 9.1 $492,608 $1,007,130 104.4Admin - - - $107,100 $122,460 14.3Meals & Lodging/in 1,745 1,394 -20.1 $46,161 $58,154 26.0Subtotal - - - $153,261 $180,614 17.8Grand Total 28,281 30,851 9.1 $645,869 $1,187,744 83.9
ModeCost per Trip
2005 2010 % ChangeAmbulatory $17.45 $35.48 103.3Non-Ambulatory $25.85 $47.28 82.9Public Bus-ADA $1.50 $0.40 -73.4Voucher $8.38 $15.80 88.5Mileage $11.43 $15.78 38.0Volunteer-Agency $1.87 $2.83 51.8Volunteer-Broker $18.79 $24.29 29.2Service Total $17.42 $32.64 87.4Admin. Costs $3.79 $3.97 4.8Grand Total $22.84 $38.50 68.6
Summary of Public Transportation – 2010 Page 183 November 2011
Hopelink
Francois LarriveeDirector of Brokerage Services14812 Main StreetBellevue, WA 98007‑5245425‑943‑6770www.hopelink.org
System Snapshot• Operating Name: Hopelink
• Service Area: Medicaid Brokerage Region 3 – King County
• Congressional Districts: 2, 7, and 8
• Legislative Districts: 5, 11, 30, 32, 33, 34, 36, 37, 41, 43, 44, 45, 46, 47, and 48
• Planning Region: Puget Sound Regional Council
• Type of Agency: Nonprofit
• Governing Body: Community Action Agency Structure—one third of the members represent clients, one third of the members represent the community at large, and one third represent government.
Current OperationsSpecial needs transportation brokerage for King County through contracts with DSHS for Medicaid Brokerage Region 3 as well as additional brokerage contracts held with three school districts (Enumclaw, Kent, and Tahoma), Harborview Medical Center, Northwest Kidney Center, Lifelong Aids Alliance, and Boyer Children’s Clinic.
Intermodal ConnectionsKing County Metro; Washington State Ferry System; Commercial air, bus, and train services.

Hopelink
Page 184 Summary of Public Transportation – 2010 November 2011
Region 3 Passenger Trips ExpensesMode 2005 2010 % Change 2005 2010 % ChangePublic Bus 304,046 431,120 41.79 $786,157 $1,588,811 102.10Ambulatory 555,408 406,654 -26.78 $10,383,354 $11,482,975 10.59Non-Ambulatory 162,314 144,898 -10.73 $5,186,028 $6,074,783 17.14Public Bus-ADA 992 - - $17,539 $0 -Voucher 152,648 110,265 -27.77 $381,752 $478,909 25.45Mileage 2,510 2 -99.92 $7,895 $73 -99.08Volunteer-Agency 939 853 -9.16 $5,628 $5,571 -1.01Airline 1 10 900.00 $222 $2,272 923.38Commercial Bus 19 10 -47.37 $666 $470 -29.50Train 2 7 250.00 $30 $366 1120.00Ferry 136 272 100.00 $1,534 $99,242 6369.47Ancillary - - - $74,513 $308,818 314.4Service Total 1,179,015 1,094,091 -7.2 $16,845,318 $20,042,288 19.0Admin - - - $2,990,400 $3,243,054 8.4Out of State 6 - - $1,616 $0 -Meals & Lodging/in 1,531 2,370 54.8 $56,253 $86,437 53.7Meals & Lodging/oos 72 - - $1,232 $0 -Vehicle Modification 1 - - $5,429 $0 -Subtotal - - - $3,054,930 $3,329,491 9.0Grand Total 1,179,021 1,094,091 -7.2 $19,900,248 $23,371,779 17.4
ModeCost per Trip
2005 2010 % ChangePublic Bus $2.59 $3.69 42.5Ambulatory $18.70 $28.24 51.0Non-Ambulatory $31.95 $41.92 31.2Public Bus-ADA $17.68 $0 -Voucher $2.50 $4.34 73.7Mileage $3.15 $36.36 1056.0Volunteer-Agency $5.99 $6.53 9.0Service Total $14.29 $18.32 28.2Admin. Costs $2.54 $2.96 16.9Grand Total $16.88 $21.36 26.6

Summary of Public Transportation – 2010 Page 185 November 2011
Human Services Council
Colleen Kuhn, Executive DirectorBJ Jacobson, Transportation Services Manager201 NE 73rd Street, Suite 101Vancouver, WA 98665360‑694‑6577www.hsc‑wa.org
System Snapshot• Operating Name: Human Services Council
• Service Area: Medicaid Region 7 – Wahkiakum, Cowlitz, Skamania, Clark, and Klickitat Counties
• Congressional District: 3
• Legislative Districts: 15, 17, 18, and 49
• Planning Regions: Southwest Washington RTPO and Southwest Washington Regional Transportation Council
• Type of Agency: Nonprofit
• Governing Body: Board of Directors consisting of 11 members representative of public and private agencies and volunteers in the fields of health, welfare, recreation, schools, business, labor, and other community groups
Current OperationsHuman Services Council provides the broker services for the following:
• Medicaid transportation for Clark, Cowlitz, Klickitat, Skamania and Wahkiakum Counties.
• Employment transportation for low-income residents of Clark County.
• Reserve-A-Ride transportation for low-income, elderly and disabled residents of Clark, Cowlitz and Wahkiakum Counties.
• Sponsor-A-Ride transportation for low-income, elderly and disabled residents of Clark County.

Human Services Council
Page 186 Summary of Public Transportation – 2010 November 2011
Region 7 Passenger Trips ExpensesMode 2005 2010 % Change 2005 2010 % ChangePublic Bus 73,893 174,183 135.72 $65,205 $232,626 256.76Ambulatory 72,999 106,818 46.33 $1,565,966 $3,596,110 129.64Non-Ambulatory 25,427 37,461 47.33 $893,343 $1,649,851 84.68Public Bus-ADA 27,180 27,397 0.80 $18,611 $60,248 223.72Voucher 13,552 24,091 77.77 $88,850 $266,399 199.83Mileage 44 38 -13.64 $1,422 $2,155 51.55Volunteer-Agency 9,032 6,268 -30.60 $322,410 $386,850 19.99Commercial Bus 12 - - $337 $0 -Train 102 575 463.73 $4,065 $27,586 578.63Service Total 222,241 376,831 69.6 $2,960,209 $6,221,825 110.2Admin - - - $699,372 $933,024 33.4Out of State 4 - - $1,945 $0 -Meals & Lodging/in 975 2,059 111.2 $59,582 $124,417 108.8Meals & Lodging/oos 235 - - $5,314 $0 -Subtotal - - - $766,213 $1,057,441 38.0Grand Total 222,245 376,831 69.6 $3,726,422 $7,279,266 95.3
ModeCost per Trip
2005 2010 % ChangePublic Bus $0.88 $1.34 51.3Ambulatory $21.45 $33.67 56.9Non-Ambulatory $35.13 $44.04 25.4Public Bus-ADA $0.68 $2.20 221.2Voucher $6.56 $11.06 68.7Mileage $32.32 $56.71 75.5Volunteer-Agency $35.70 $61.72 72.9Service Total $13.32 $16.51 24.0Admin. Costs $3.15 $2.48 -21.3Grand Total $16.77 $19.32 15.2

Summary of Public Transportation – 2010 Page 187 November 2011
Northwest Regional Council
Victoria DoerperExecutive Director600 Lakeway Drive, Suite 100Bellingham, WA 98225360‑676‑6749www.nwrcwa.org
System Snapshot• Operating Name: Northwest Regional Council
• Service Area: Medicaid Region 1 – San Juan, Island, Whatcom, and Skagit Counties
• Congressional District: 2
• Legislative Districts: 10, 39, 40, and 42
• Planning Regions: Whatcom Council of Governments, Skagit MPO, and Skagit‑Island RTPO
• Type of Agency: Quasi-governmental Entity
• Governing Body: Council composed of two elected officials from each member county (Island, San Juan, Skagit and Whatcom).
Current Operations• Medicaid transportation broker for Whatcom, Skagit, Island, and San Juan Counties.
Intermodal Connections• Greyhound
• County Connector (inter-county transit connection)
• West-Isle Air
• Washington State Ferry Service

Northwest Regional Council
Page 188 Summary of Public Transportation – 2010 November 2011
Region 1 Passenger Trips ExpensesMode 2005 2010 % Change 2005 2010 % ChangePublic Bus 40,042 41,013 2.42 $48,235 $78,710 63.18Ambulatory 43,512 38,476 -11.57 $985,192 $1,136,377 15.35Non-Ambulatory 6,104 4,174 -31.62 $246,699 $291,128 18.01Public Bus-ADA 73,632 61,497 -16.48 $39,860 $75,686 89.88Voucher 9,430 14,652 55.38 $62,373 $149,121 139.08Mileage 677 1,271 87.74 $3,824 $16,280 325.72Volunteer-Agency 812 517 -36.33 $35,907 $29,471 -17.92Airline 4 12 200.00 $860 $642 -25.35Commercial Bus 6 4 -33.33 $107 $129 20.09Ferry 1,902 2,860 50.37 $17,452 $37,377 114.17Foster Parent 2 - - $33 $0 -Ancillary - - - $85 $308 262.4Service Total 176,123 164,476 -6.6 $1,440,627 $1,815,227 26.0Admin - - - $448,791 $714,964 59.3Out of State 6 - - $3,034 $0 -Meals & Lodging/in 1,396 3,473 148.8 $76,086 $137,583 80.8Meals & Lodging/oos 33 - $2,057 $- -Subtotal - - - $529,968 $852,547 60.9Grand Total 176,129 164,476 -6.6 $1,970,595 $2,667,774 35.4
ModeCost per Trip
2005 2010 % ChangePublic Bus $1.20 $1.92 59.3Ambulatory $22.64 $29.53 30.4Non-Ambulatory $40.42 $69.75 72.6Public Bus-ADA $0.54 $1.23 127.3Voucher $6.61 $10.18 53.9Mileage $5.65 $12.81 126.8Volunteer-Agency $44.22 $57.00 28.9Service Total $8.18 $11.04 34.9Admin. Costs $2.55 $4.35 70.6Grand Total $11.19 $16.22 45.0

Summary of Public Transportation – 2010 Page 189 November 2011
Paratransit Services
David BakerPresident/Chief Executive Office4810 Auto Center Way, Suite ZBremerton, WA 98312‑4309800‑933‑3468www.paratransit.net
System Snapshot• Operating Name: Paratransit Services
• Service Range: Medicaid Brokerage Region 2 – Snohomish County; Region 4 – Pierce County; Region 5 – Clallam, Jefferson, Kitsap, and north Mason Counties; Region 6 – Grays Harbor, Pacific, south Mason, Thurston, Lewis Counties
• Congressional Districts: 1, 2, 3, 6, 7, 8, and 9
• Legislative Districts: 1, 2, 10, 19, 20, 21, 22, 23, 24, 25, 26, 27, 28, 29, 31, 32, 35, 38, 39, and 44
• Planning Regions: Puget Sound Regional Council, Peninsula RTPO, Thurston Regional Planning Council, and Southwest Washington RTPO
• Type of Agency: Nonprofit
• Governing Body: Nine‑member Board of Directors comprised of a diverse group of community and business leaders.
Current Operations• Broker of Medicaid transportation and interpreter services for ten counties in
northwestern Washington with a total service area of 14,707 square miles and a population of over 2 million people.
• Operate accessible public transit systems in Alaska, Washington State, Oregon, and Northern California.
Intermodal ConnectionsIn Pierce County, the Beyond the Borders program provides linkages to the Roy “Y” transit center.
In Snohomish County, Paratransit Services has established a feeder route from Community Transit fixed route to the Island Crossing Methadone Clinic, Monday through Friday from 6:00 a.m. to 9:00 p.m.
Paratransit Services provides linkages for our Medicaid transportation clients whenever possible to all fixed route systems in Pierce, Snohomish, Clallam, Jefferson, Thurston, Kitsap, Lewis, Pacific, Grays Harbor, and Mason Counties.

Paratransit Services
Page 190 Summary of Public Transportation – 2010 November 2011
Region 2 Passenger Trips ExpensesMode 2005 2010 % Change 2005 2010 % ChangePublic Bus 39,765 100,097 151.72 $113,047 $422,990 274.17Ambulatory 123,916 105,610 -14.77 $2,628,963 $2,868,981 9.13Non-Ambulatory 31,739 46,064 45.13 $1,175,823 $1,646,696 40.05Public Bus-ADA 262 - - $652 $0 -Voucher 1,717 17,086 895.11 $6,389 $95,315 1391.86Mileage 5,586 4,162 -25.49 $25,862 $24,098 -6.82Volunteer-Agency 2,618 3,553 35.71 $91,777 $250,778 173.25Commercial Bus 9 1 -88.89 $232 $39 -83.19Ferry 2 - - $16 $0 -Service Total 205,614 276,573 34.51 $4,042,761 $5,308,896 31.3Admin - - - $428,496 $584,938 36.5Meals & Lodging/in 468 1,069 128.4 $28,987 $66,573 129.7Subtotal - - - $457,483 $651,511 42.4Grand Total 205,614 276,573 34.5 $4,500,244 $5,960,407 32.4
ModeCost per Trip
2005 2010 % ChangePublic Bus $2.84 $4.23 48.6Ambulatory $21.22 $27.17 28.0Non-Ambulatory $37.05 $35.75 -3.5Public Bus-ADA $2.49 $0 -Voucher $3.72 $5.58 49.9Mileage $4.63 $5.79 25.1Volunteer-Agency $35.06 $70.58 101.3Service Total $19.66 $19.20 -2.4Admin. Costs $2.08 $2.11 1.5Grand Total $21.89 $21.55 -1.5
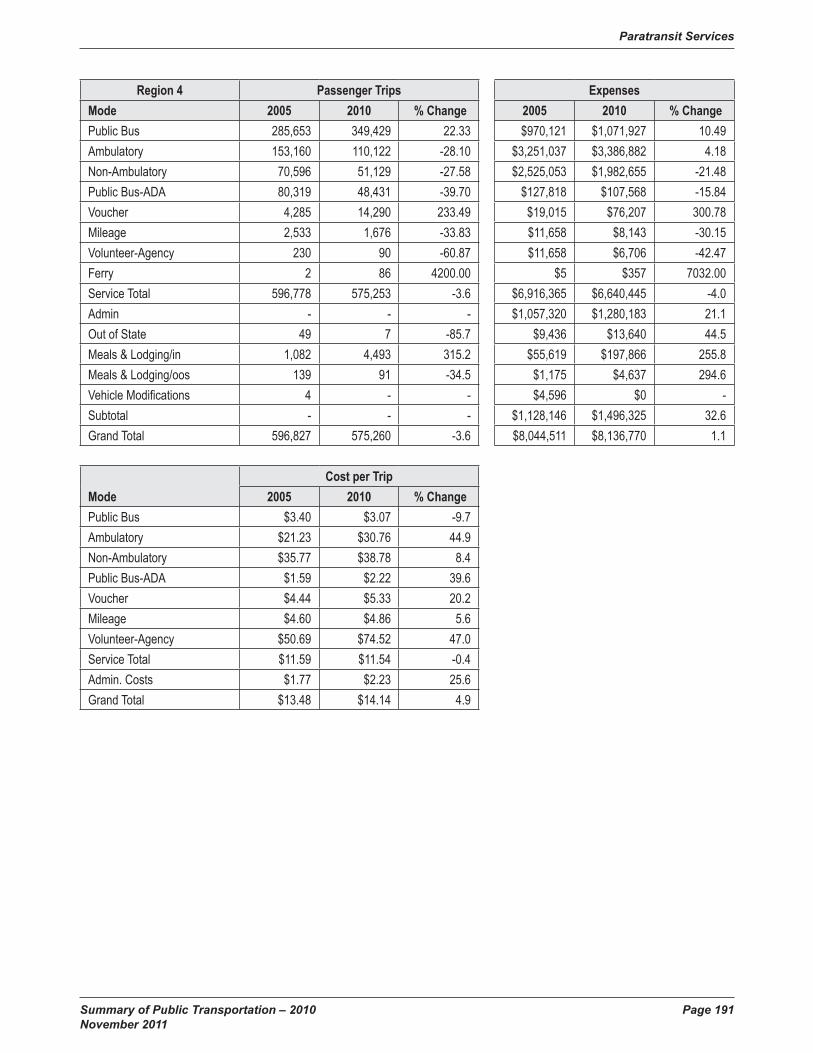
Paratransit Services
Summary of Public Transportation – 2010 Page 191 November 2011
Region 4 Passenger Trips ExpensesMode 2005 2010 % Change 2005 2010 % ChangePublic Bus 285,653 349,429 22.33 $970,121 $1,071,927 10.49Ambulatory 153,160 110,122 -28.10 $3,251,037 $3,386,882 4.18Non-Ambulatory 70,596 51,129 -27.58 $2,525,053 $1,982,655 -21.48Public Bus-ADA 80,319 48,431 -39.70 $127,818 $107,568 -15.84Voucher 4,285 14,290 233.49 $19,015 $76,207 300.78Mileage 2,533 1,676 -33.83 $11,658 $8,143 -30.15Volunteer-Agency 230 90 -60.87 $11,658 $6,706 -42.47Ferry 2 86 4200.00 $5 $357 7032.00Service Total 596,778 575,253 -3.6 $6,916,365 $6,640,445 -4.0Admin - - - $1,057,320 $1,280,183 21.1Out of State 49 7 -85.7 $9,436 $13,640 44.5Meals & Lodging/in 1,082 4,493 315.2 $55,619 $197,866 255.8Meals & Lodging/oos 139 91 -34.5 $1,175 $4,637 294.6Vehicle Modifications 4 - - $4,596 $0 -Subtotal - - - $1,128,146 $1,496,325 32.6Grand Total 596,827 575,260 -3.6 $8,044,511 $8,136,770 1.1
ModeCost per Trip
2005 2010 % ChangePublic Bus $3.40 $3.07 -9.7Ambulatory $21.23 $30.76 44.9Non-Ambulatory $35.77 $38.78 8.4Public Bus-ADA $1.59 $2.22 39.6Voucher $4.44 $5.33 20.2Mileage $4.60 $4.86 5.6Volunteer-Agency $50.69 $74.52 47.0Service Total $11.59 $11.54 -0.4Admin. Costs $1.77 $2.23 25.6Grand Total $13.48 $14.14 4.9

Paratransit Services
Page 192 Summary of Public Transportation – 2010 November 2011
Region 5 Passenger Trips ExpensesMode 2005 2010 % Change 2005 2010 % ChangePublic Bus 47,608 57,883 21.58 $203,439 $167,061 -17.88Ambulatory 44,777 61,695 37.78 $1,480,519 $2,712,801 83.23Non-Ambulatory 8,534 13,304 55.89 $321,787 $681,631 111.83Public Bus-ADA 17,518 4,200 -76.02 $28,854 $20,349 -29.48Voucher 11,167 15,695 40.55 $91,969 $152,962 66.32Mileage 1,171 3,922 234.93 $10,583 $34,501 226.01Volunteer-Agency 459 413 -10.02 $25,234 $29,852 18.30Commercial Bus 19 1 -94.74 $519 $74 -85.74Train 2 - - $49 $0 -Ferry 6,195 3,971 -35.90 $31,598 $31,135 -1.46Service Total 137,450 161,084 17.2 $2,194,551 $3,830,367 74.5Admin - - - $467,472 $555,964 18.9Out of State - 2 - $0 $959 -Meals & Lodging/in 1,561 3,082 97.4 $46,619 $147,044 215.4Meals & Lodging/oos - 10 - $0 $775 -Vehicle Modifications - - - $0 $0 -Subtotal - - - $514,091 $704,742 37.1Grand Total 137,450 161,086 17.2 $2,708,642 $4,535,109 67.4
ModeCost per Trip
2005 2010 % ChangePublic Bus $4.27 $2.89 -32.5Ambulatory $33.06 $43.97 33.0Non-Ambulatory $37.71 $51.24 35.9Public Bus-ADA $1.65 $4.85 194.2Voucher $8.24 $9.75 18.3Mileage $9.04 $8.80 -2.7Volunteer-Agency $54.98 $72.28 31.5Service Total $15.97 $23.78 48.9Admin. Costs $3.40 $3.45 1.5Grand Total $19.71 $28.15 42.9
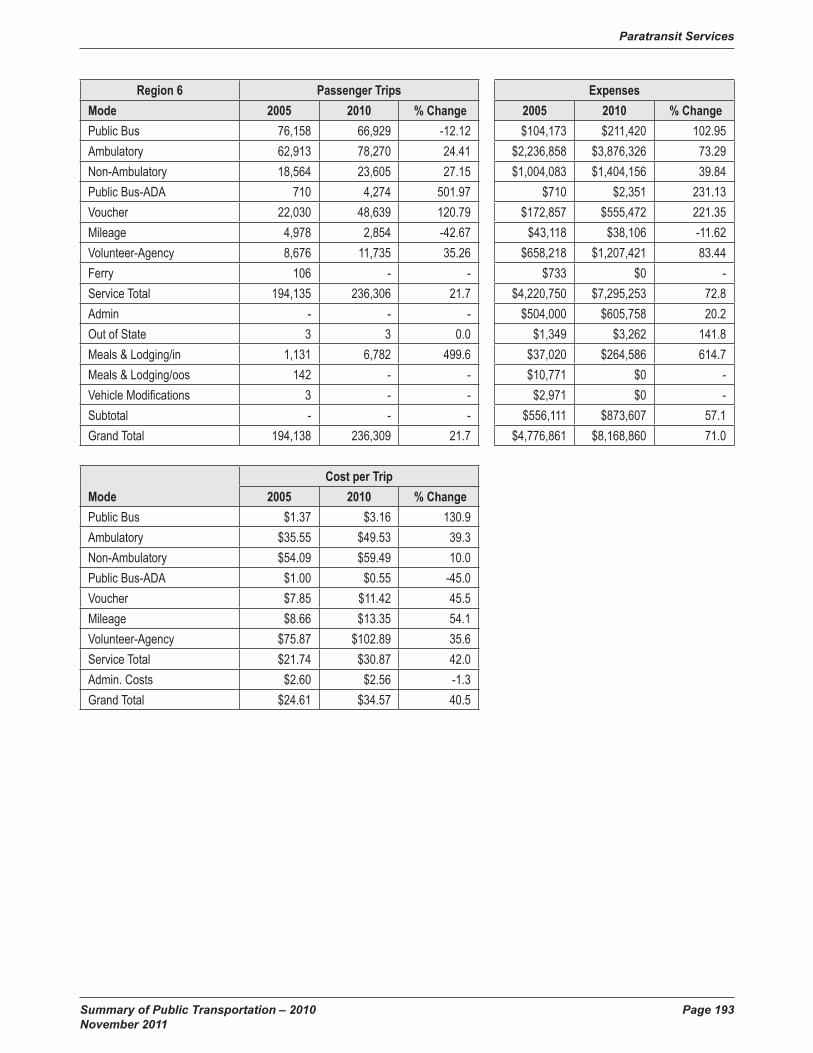
Paratransit Services
Summary of Public Transportation – 2010 Page 193 November 2011
Region 6 Passenger Trips ExpensesMode 2005 2010 % Change 2005 2010 % ChangePublic Bus 76,158 66,929 -12.12 $104,173 $211,420 102.95Ambulatory 62,913 78,270 24.41 $2,236,858 $3,876,326 73.29Non-Ambulatory 18,564 23,605 27.15 $1,004,083 $1,404,156 39.84Public Bus-ADA 710 4,274 501.97 $710 $2,351 231.13Voucher 22,030 48,639 120.79 $172,857 $555,472 221.35Mileage 4,978 2,854 -42.67 $43,118 $38,106 -11.62Volunteer-Agency 8,676 11,735 35.26 $658,218 $1,207,421 83.44Ferry 106 - - $733 $0 -Service Total 194,135 236,306 21.7 $4,220,750 $7,295,253 72.8Admin - - - $504,000 $605,758 20.2Out of State 3 3 0.0 $1,349 $3,262 141.8Meals & Lodging/in 1,131 6,782 499.6 $37,020 $264,586 614.7Meals & Lodging/oos 142 - - $10,771 $0 -Vehicle Modifications 3 - - $2,971 $0 -Subtotal - - - $556,111 $873,607 57.1Grand Total 194,138 236,309 21.7 $4,776,861 $8,168,860 71.0
ModeCost per Trip
2005 2010 % ChangePublic Bus $1.37 $3.16 130.9Ambulatory $35.55 $49.53 39.3Non-Ambulatory $54.09 $59.49 10.0Public Bus-ADA $1.00 $0.55 -45.0Voucher $7.85 $11.42 45.5Mileage $8.66 $13.35 54.1Volunteer-Agency $75.87 $102.89 35.6Service Total $21.74 $30.87 42.0Admin. Costs $2.60 $2.56 -1.3Grand Total $24.61 $34.57 40.5

Paratransit Services
Page 194 Summary of Public Transportation – 2010 November 2011

Summary of Public Transportation – 2010 Page 195 November 2011
People For People
Marcy DurbinBrokering Manager304 West LincolnYakima, WA 98902‑2656509‑248‑67931‑800‑233‑1624www.pfp.org
System Snapshot• Operating Name: People For People
• Service Area: Medicaid Broker Region 2 – Benton, Columbia, Franklin, Kittitas, Walla Walla, Yakima and Counties
• Congressional District: 4
• Legislative Districts: 13, 14, and 15
• Planning Regions: Quad County RTPO, Yakima Valley Conference of Governments, and Benton‑Franklin‑Walla Walla RTPO.
• Type of Agency: Nonprofit
• Governing Body: Nine‑member volunteer Board of Directors comprised of leaders that represent the diverse populations and communities that People For People serve.
Current OperationsThe Broker serves communities in six counties by arranging transportation and related services for people of all ages that have current Washington State Department of Social and Health Services Medicaid Provider One Identification card and need transportation to covered non-emergency medical services. Verification for proper eligibility is confirmed and then the most cost-effective, appropriate transportation is coordinated.
A primary goal of these services is to assist clients with gas vouchers or mileage reimbursement if they have their own transportation resources and provide valid driver’s license, insurance and registration. If that is not possible, transportation is arranged using contracted providers such as local transit and paratransit providers, volunteer driver programs, public transportation (Greyhound, train), non-profit providers, cabulance and taxi companies.
People For People ensures that the lowest cost, most appropriate ride is arranged for the client. Trips may be shared with other riders.

People For People
Page 196 Summary of Public Transportation – 2010 November 2011
Region 8 Passenger Trips ExpensesMode 2005 2010 % Change 2005 2010 % ChangePublic Bus 4,037 10,000 147.71 $6,170 $14,677 137.87Ambulatory 64,643 64,861 0.34 $2,174,677 $3,265,106 50.14Non-Ambulatory 20,268 18,871 -6.89 $850,643 $1,000,314 17.60Public Bus-ADA 26,414 23,597 -10.66 $18,800 $53,411 184.10Voucher 7,431 14,004 88.45 $83,951 $265,127 215.81Mileage 3,395 2,647 -22.03 $42,839 $86,375 101.63Volunteer-Agency 4 - - $22 $0 -Volunteer-Broker 3,095 1,477 -52.28 $203,743 $144,059 -29.29Commercial Bus 9 33 266.67 $337 $1,833 443.92Service Total 129,296 135,490 4.8 $3,381,182 $4,830,900 42.9Admin - - - $561,588 $570,766 1.6Out of State - 9 - $0 $4,066 -Meals & Lodging/in 5,467 6,931 26.8 $180,380 $279,159 54.8Meals & Lodging/oos - 192 - $0 $1,644 -Subtotal - - - $741,968 $855,635 15.3Grand Total 129,296 135,499 4.8 $4,123,150 $5,686,536 37.9
ModeCost per Trip
2005 2010 % ChangePublic Bus $1.53 $1.47 -4.0Ambulatory $33.64 $50.34 49.6Non-Ambulatory $41.97 $53.01 26.3Public Bus-ADA $0.71 $2.26 218.0Voucher $11.30 $18.93 67.6Mileage $12.62 $32.63 158.6Volunteer-Agency $5.50 $0 -Volunteer-Broker $65.83 $97.53 48.2Service Total $26.15 $35.66 36.3Admin. Costs $4.34 $4.21 -3.0Grand Total $31.89 $41.97 31.6
Summary of Public Transportation – 2010 Page 197 November 2011
Special Mobility Services, Inc.
Rusty KoontzRegional ManagerMedical Transportation Assistance Unit3102 East Trent, Suite 210Spokane, WA 99202‑3800509‑532‑9505www.sms1.org
System Snapshot • Operating Name: Special Mobility Services, Inc.
• Service Area: Medicaid Brokerage Region 10 – Ferry, Stevens, and Pend Oreille Counties; Region 11 – Grant, Lincoln, and Adams Counties; Region 12 – Spokane County; Region 13 – Whitman, Garfield and Asotin Counties
• Congressional Districts: 4 and 5
• Legislative Districts: 4, 6, 7, 9, 12, and 13
• Planning Regions: Northeast Washington RTPO, Spokane Regional Transportation Council, and Quad‑County RTPO
• Type of Agency: Nonprofit
• Governing Body: Five‑member board of directors
Current OperationsBrokers transportation for Medicaid clients in Regions 10 (Ferry, Stevens, and Pend Oreille Counties), 11 (Grant, Lincoln, and Adams Counties), 12 (Spokane County), and 13 (Whitman, Garfield and Asotin Counties).
Intermodal ConnectionsClients may use local transportation to connect to intercity bus, rail, or air for out‑of‑area appointments.

Special Mobility Services, Inc.
Page 198 Summary of Public Transportation – 2010 November 2011
Region 10 Passenger Trips ExpensesMode 2005 2010 % Change 2005 2010 % ChangePublic Bus 870 62 -92.87 $731 $113 -84.54Ambulatory 5,635 718 -87.26 $134,491 $24,993 -81.42Non-Ambulatory 2,655 1,673 -36.99 $273,820 $216,690 -20.86Public Bus-ADA 31 - - $233 $0 -Voucher 11,744 17,131 45.87 $116,251 $214,484 84.50Mileage 8 112 1300.00 $394 $4,279 985.94Volunteer-Agency 8,309 3,013 -63.74 $330,441 $91,981 -72.16Volunteer-Broker - 4,063 - $- $139,757 -Airline 69 - - $12,455 $0 -Commercial Bus 4 39 875.00 $174 $2,058 1082.56Ancillary - - - $7 $0 -Service Total 29,325 26,811 -8.6 $868,997 $694,354 -20.1Admin - - - $94,776 $139,404 47.1Out of State 2 - - $247 $0 -Meals & Lodging/in 506 477 -5.7 $20,771 $25,526 22.9Meals & Lodging/oos 2 - - $130 $0 -Subtotal - - - $115,924 $164,930 42.3Grand Total 29,327 26,811 -8.6 $984,921 $859,284 -12.8
ModeCost per Trip
2005 2010 % ChangePublic Bus $0.84 $1.82 116.9Ambulatory $23.87 $34.81 45.8Non-Ambulatory $103.13 $129.52 25.6Public Bus-ADA $7.52 $0 -Voucher $9.90 $12.52 26.5Mileage $49.25 $38.20 -22.4Volunteer-Agency $39.77 $30.53 -23.2Volunteer-Broker $0 $34.40 -Service Total $29.63 $25.90 -12.6Admin. Costs $3.23 $5.20 60.9Grand Total $33.58 $32.05 -4.6

Special Mobility Services, Inc.
Summary of Public Transportation – 2010 Page 199 November 2011
Region 11 Passenger Trips ExpensesMode 2005 2010 % Change 2005 2010 % ChangePublic Bus 402 1,068 165.67 $629 $2,958 370.27Ambulatory 17,439 8,099 -53.56 $902,881 $317,501 -64.83Non-Ambulatory 6,638 5,402 -18.62 $353,911 $310,104 -12.38Public Bus-ADA 51 308 503.92 $1,275 $474 -62.82Voucher 5,962 16,523 177.14 $69,114 $233,729 238.18Mileage 616 50 -91.88 $6,924 $569 -91.78Volunteer-Agency 1,102 297 -73.05 $96,965 $10,017 -89.67Volunteer-Broker - 4,603 - $0 $233,939 -Airline 2 - - $494 $0 -Commercial Bus 6 11 83.33 $150 $412 174.33Service Total 32,218 36,361 12.9 $1,432,343 $1,109,703 -22.5Admin - - - $108,336 $169,884 56.8Out of State 4 - - $3,535 $0 -Meals & Lodging/in 2,327 1,603 -31.1 $47,463 $69,214 45.8Subtotal - - - $159,334 $239,098 50.1Grand Total 32,222 36,361 12.8 $1,591,677 $1,348,801 -15.3
ModeCost per Trip
2005 2010 % ChangePublic Bus $1.56 $2.77 77.0Ambulatory $51.77 $39.20 -24.3Non-Ambulatory $53.32 $57.41 7.7Public Bus-ADA $25.00 $1.54 -93.8Voucher $11.59 $14.15 22.0Mileage $11.24 $11.38 1.2Volunteer-Agency $87.99 $33.73 -61.7Volunteer-Broker $0 $50.82 -Service Total $44.46 $30.52 -31.4Admin. Costs $3.36 $4.67 38.9Grand Total $49.40 $37.09 -24.9

Special Mobility Services, Inc.
Page 200 Summary of Public Transportation – 2010 November 2011
Region 12 Passenger Trips ExpensesMode 2005 2010 % Change 2005 2010 % ChangePublic Bus 99,636 119,469 19.91 $282,536 $500,309 77.08Ambulatory 94,661 35,676 -62.31 $1,555,049 $601,289 -61.33Non-Ambulatory 40,212 20,485 -49.06 $1,040,807 $605,089 -41.86Public Bus-ADA 20,034 25,911 29.34 $35,488 $61,956 74.58Voucher 10,959 17,584 60.45 $36,288 $98,397 171.15Mileage - - - $0 $88 -Volunteer-Agency 1,639 1,653 0.85 $44,978 $45,586 1.35Volunteer-Broker - 1,677 $0 $45,446 -Airline 284 40 -85.92 $55,101 $8,896 -83.86Commercial Bus 48 81 68.75 $2,304 $5,087 120.77Train - 6 - $0 $372 -Ancillary - - - $917 $21 -97.7Service Total 267,473 222,582 -16.8 $3,053,468 $1,972,534 -35.4Admin - - - $544,920 $687,648 26.2Out of State 18 9 -50.0 $7,139 $6,419 -10.1Meals & Lodging/in 1,787 1,045 -41.5 $92,795 $63,294 -31.8Meals & Lodging/oos 16 76 375.0 $2,393 $2,966 23.9Subtotal - - - $647,247 $760,326 17.5Grand Total 267,491 222,591 -16.8 $3,700,715 $2,732,860 -26.2
ModeCost per Trip
2005 2010 % ChangePublic Bus $2.84 $4.19 47.7Ambulatory $16.43 $16.85 2.6Non-Ambulatory $25.88 $29.54 14.1Public Bus-ADA $1.77 $2.39 35.0Voucher $3.31 $5.60 69.0Volunteer-Agency $27.44 $27.58 0.5Volunteer-Broker $0 $27.10 -Service Total $11.42 $8.86 -22.4Admin. Costs $2.04 $3.09 51.6Grand Total $13.83 $12.28 -11.3

Summary of Public Transportation – 2010 Page 201 November 2011
Trancare
Adnan Abou AmmoDirector225 Ohme Garden RoadWenatchee, WA 98801‑9047509‑667‑2727www.trancare.org
System Snapshot• Operating Name: Trancare
• Volunteer Transportation and Interpreter Services Brokerage Okanogan, Chelan, and Douglas Counties
• Congressional District: 4
• Legislative Districts: 7 and 12
• Planning Regions: North Central RTPO and Wenatchee Valley Transportation Council
• Type of Agency: Nonprofit
• Governing Body: Board of Directors
Current OperationsVolunteer Transportation and Interpreter Services Brokerage in Region 9 (Chelan, Douglas, and Okanogan Counties).
Intermodal ConnectionsLink Transit at the Columbia Station in Wenatchee.

Trancare
Page 202 Summary of Public Transportation – 2010 November 2011
Region 9 Passenger Trips ExpensesMode 2005 2010 % Change 2005 2010 % ChangePublic Bus 953 132 -86.15 $705 $214 -69.65Ambulatory 8,538 12,488 46.26 $95,784 $239,473 150.01Non-Ambulatory 2,817 4,468 58.61 $177,896 $377,363 112.13Public Bus-ADA 3,964 5,057 27.57 $2,189 $6,541 198.81Voucher 9,973 23,339 134.02 $118,097 $382,356 223.76Volunteer-Broker 15,166 14,229 -6.18 $541,165 $742,992 37.29Airline 1 - - $190 $0 -Commercial Bus 30 14 -53.33 $772 $927 20.11Train 1 8 700.00 $27 $216 700.74Ancillary - - - $555 $779 40.4Service Total 41,443 59,735 44.1 $937,380 $1,750,863 86.8Admin - - - $242,736 $294,336 21.3Out of State 1 - - $5,536 $0 -Meals & Lodging/in 2,277 4,637 103.6 $82,623 $231,076 179.7Meals & Lodging/oos 16 - - $570 $0 -Subtotal - - - $331,465 $525,412 58.5Grand Total 41,444 59,735 44.1 $1,268,845 $2,276,275 79.4
ModeCost per Trip
2005 2010 % ChangePublic Bus $0.74 $1.62 119.2Ambulatory $11.22 $19.18 70.9Non-Ambulatory $63.15 $84.46 33.7Public Bus-ADA $0.55 $1.29 134.2Voucher $11.84 $16.38 38.3Volunteer-Broker $35.68 $52.22 46.3Service Total $22.62 $29.31 29.6Admin. Costs $5.86 $4.93 -15.9Grand Total $30.62 $38.11 24.5

Summary of Public Transportation – 2010 Page 203 November 2011
Travel Washington – Rural Intercity Bus Program
Travel Washington (the rural intercity bus program in Washington state) connects rural communities with larger urban centers and provides connections to the national intercity transportation network (bus, rail, airline and ferry systems). Travel Washington promotes regional travel, tourism and mobility options and generates local economic activity. More importantly, the program allows rural residents to have access to the services in urban centers.
The Travel Washington Program uses federal 5311(f) formula funds and private in‑kind matching funds as funding sources. The private, in‑kind matching funds are provided by Greyhound Bus Lines. Beginning as a Federal Transit Administration (FTA) approved pilot‑project in 2006, the Travel Washington rural intercity bus program was the first in the nation to promote this public-private partnership.
Each bus route is named, branded and marketed based on the products produced in the region where it operates (e.g., the Grape Line operates in the wine country of southeast Washington). The bus service is provided by private, local bus companies who are awarded contracts through the competitive bidding process. Local drivers and managers, fuel, supplies and ticket agents are utilized along each of the regional bus routes, promoting local businesses and providing local employment.
Passengers that utilize these services are as varied as the regions they live in. College students in Walla Walla, workers commuting to Spokane from Deer Park, elderly residents going to Pasco for medical appointments and Canadian tourists from Victoria going to Seattle comprise the ridership base for the Travel Washington network.
The Gold Line and Apple Line coaches take part in the annual Northeast Washington Fair and Omak Stampede parades. The Dungeness Line, based in Port Angeles also takes part in the Dungeness Crab Festival. These activities raise the awareness about the service, and also promote local community “ownership” of the service.

Travel Washington – Rural Intercity Bus Program
Page 204 Summary of Public Transportation – 2010 November 2011
2010 Annual Operating Information
Federal Assistance Operating CapitalFederal Section §5311 Other than Urbanized Area Formula Funds $1,056,656 $0ARRA §5311 Other than Urbanized Area Formula Funds $0 $1,371,771 Total Federal Assistance $1,056,656 $1,371,771
Service Data
Annual Vehicle
Revenue Miles
Regular Unlinked
Passenger Trips
Intercity Bus 462,422 32,674

Summary of Public Transportation – 2010 Page 205 November 2011
Apple Line
Cleto AchabalPresidentSouth 4611 Ben Franklin LaneSpokane, WA 99224‑5648509‑838‑4029www.northwesterntrailways.comwww.appleline.us
System Snapshot• Operating Name: Northwestern Stage Lines, Inc. dba Northwestern Trailways• Service Range: Inter‑regional, intercity• Congressional Districts: Statewide• Legislative Districts: Statewide• Planning Regions: Statewide• Medicaid Brokerage Region: Statewide• Type of Agency: For Profit• Governing Body: Three‑member board of directors• Types of Service and Eligibility: Fixed route and charter for general public• Days of Service: Daily• Base Fare: Mileage‑based fare structure. For general reference only: one‑way
trips from one to 35 miles – $14.00; 350 miles – $57.00.
Current Operations• Daily intercity bus service in three corridors: Between Spokane and Seattle/Tacoma
via Wenatchee and Everett; Between Spokane and Boise, Idaho via CDA, Potlatch, Pullman, Moscow, and Lewiston; Between Omak and Wenatchee/Ellensburg along Highway 97.
• Amtrak Thruway bus provider.• Charter service throughout the United States and Canada.
Revenue Service Vehicles25 total vehicles, 15 of which are ADA accessible: 14 are 56‑passenger buses, 4 are 47‑passenger buses and 7 are mini‑buses.
Intermodal ConnectionsAmtrak, Community Transit (Everett), Grant Transit (Moses Lake), Grays Harbor Transit (Olympia), Greyhound, Gray Line (Seattle), Kittitas County (Ellensburg), Link (Wenatchee), Metro (Seattle), NE Washington Rural Resources, Olympic Van (Port Angeles), Okanogan County (Omak), Pacific Trails (Tualitin, Oregon), Pierce Transit (Tacoma), Powder River (Gillette), Pullman Transit (Pullman), Rimrock Trailways (Billings, Montana) and Spokane Transit (Spokane).

Apple Line
Page 206 Summary of Public Transportation – 2010 November 2011
2010 Annual Operating Information
Federal Assistance Operating CapitalFederal Section §5311 Other than Urbanized Area Formula Funds $185,453 $0ARRA §5311 Other than Urbanized Area Formula Funds $0 $155,966 Total Federal Assistance $185,453 $155,966
Service Data
Annual Vehicle
Revenue Miles
Regular Unlinked
Passenger Trips
Intercity Bus 127,750 9,796

Summary of Public Transportation – 2010 Page 207 November 2011
Dungeness Line
Jack HeckmanPresident111 East Front StreetPort Angeles, WA 98362360‑417‑0700www.dungenessline.us
System Snapshot• Operating Name: Heckman Motors dba Olympic Bus Lines
• Service Range: Port Angeles to Seattle
• Congressional District: 6
• Legislative District: 24
• Planning Regions: Peninsula RTPO and Puget Sound Regional Council
• Medicaid Brokerage Region: 5
• Type of Agency: For Profit
• Governing Body: Corporate standard
• Types of Service and Eligibility: Fixed‑route for general public.
• Days of Service: 7 days a week
• Base Fare: One way trip to/from Kingston/Edmonds $37; one way trip to/from Seattle $39; one way to/from SeaTac $49.
Current OperationsOlympic Bus Lines has twice daily scheduled service with flag stops by reservation.
Revenue Service VehiclesFour vehicles total: three 27‑passenger ADA accessible buses, one 15‑passenger ADA accessible minibus.
Intermodal ConnectionsClallam Transit at Port Angeles Gateway Transit Center; Jefferson Transit at Port Townsend Haines Place Park and Ride; Seattle Metro; Kitsap Transit connection at Kingston Ferry; Kingston Ferry; Black Ball Transport ferry with service between Port Angeles and Victoria, B.C.; Fairchild International Airport, Port Angeles; SeaTac Airport; Greyhound (Seattle) and Amtrak (Edmonds and Seattle).

Dungeness Line
Page 208 Summary of Public Transportation – 2010 November 2011
2010 Annual Operating Information
Federal Assistance Operating CapitalFederal Section §5311 Other than Urbanized Area Formula Funds $485,541 $0ARRA §5311 Other than Urbanized Area Formula Funds $0 $423,868 Total Federal Assistance $485,541 $423,868
Service Data
Annual Vehicle
Revenue Miles
Regular Unlinked
Passenger Trips
Intercity Bus 162,077 14,229
Summary of Public Transportation – 2010 Page 209 November 2011
Grape Line
Richard JohnsonPresident1416 Whitehorn StreetFerndale, WA 98248‑8923360‑543‑ 9369www.grapeline.us
System Snapshot• Operating Name: CWA, Inc. dba Travel Washington Grape Line • Service Range: Between Walla Walla and Pasco• Congressional District: 4 and 5• Legislative District: 16• Planning Regions: Benton‑Franklin‑Walla Walla RTPO• Medicaid Brokerage Region: 8• Type of Agency: For Profit• Governing Body: Corporate standard• Types of Service and Eligibility: Fixed‑route for general public.• Days of Service: 7 days a week• Base Fare: One way trip to/from Pasco – Walla Walla $7
Current OperationsTravel Washington Grape Lines operates three roundtrips daily between the Walla Walla Airport, Walla Walla Transit Center, College Place, Touchet, Wallula, Burbank, Pasco Intermodal, Pasco Transit and Pasco’s Airport. Tickets may be purchased online, from the drivers or at Walla Walla Transit Center, Pasco Intermodal and through NBTA Interline Member Carriers and Amtrak.
Revenue Service VehiclesThree 27 passenger ADA accessible 2009 GMC C5500 / TurtleTop Odyssey XL.
Intermodal ConnectionsWalla Walla Airport Walla Walla Transit Center Greyhound Valley Transit Pasco Airport Pasco Transit Ben Franklin Transit Pasco Intermodal Greyhound Amtrak

Grape Line
Page 210 Summary of Public Transportation – 2010 November 2011
2010 Annual Operating Information
Federal Assistance Operating CapitalFederal Section §5311 Other than Urbanized Area Formula Funds $354,814 $0ARRA §5311 Other than Urbanized Area Formula Funds $0 $356,985 Total Federal Assistance $354,814 $356,985
Service Data
Annual Vehicle
Revenue Miles
Regular Unlinked
Passenger Trips
Intercity Bus 131,271 7,920

Summary of Public Transportation – 2010 Page 211 November 2011
Gold Line
Richard JohnsonPresident1416 Whitehorn StreetFerndale, WA 98248‑8923360‑543‑9369www.gold‑line.us
System Snapshot• Operating Name: CWA, Inc. dba Travel Washington Gold Line • Service Range: Between Kettle Falls and Spokane• Congressional District: 5• Legislative Districts: 3, 4, 6, and 7• Planning Regions: Spokane Regional Transportation Council and the Northeast
Washington Regional Transportation Planning Organization• Medicaid Brokerage Regions: 10 and 12• Type of Agency: For Profit• Governing Body: Corporate standard• Types of Service and Eligibility: Fixed‑route for general public.• Days of Service: 7 days a week• Base Fare: One way trip to/from Spokane $20; one way to/from Spokane
International Airport $25.
Current OperationsTravel Washington Gold Line has twice daily scheduled service between Kettle Falls, Colville, Chewelah, Chewelah Casino, Loon Lake, Deer Park, North Spokane (Hastings Road Park and Ride Lot), Spokane Intermodal, Spokane Transit Plaza, and the Spokane International Airport. Tickets may be purchased online, from the drivers, sales agents at Kettle Falls, Colville, Chewelah, Spokane Intermodal, and through Amtrak and NBTA Interline Bus Carriers.
Revenue Service VehiclesThree 27 passenger ADA accessible 2009 GMC C5500 / TurtleTop Odyssey XL.
Intermodal ConnectionsSpokane International Airport Spokane Transit Plaza Spokane Intermodal Greyhound Northwestern Trailways Amtrak North Spokane – Hastings Road Park and Ride Spokane Transit Colville Rural Resources

Gold Line
Page 212 Summary of Public Transportation – 2010 November 2011
2010 Annual Operating Information
Federal Assistance Operating CapitalFederal Section §5311 Other than Urbanized Area Formula Funds $30,848 $0 ARRA §5311 Other than Urbanized Area Formula Funds $0 $434,952 Total Federal Assistance $30,848 $434,952
Service Data
Annual Vehicle
Revenue Miles
Regular Unlinked
Passenger Trips
Intercity Bus 41,324 729

Summary of Public Transportation – 2010 Page 213 November 2011
Ferry Systems in Washington State
Ferry systems in Washington State have not been reported in the Summary of Public Transportation since 1996 and at that time, only the Washington State Ferries was included.
This publication includes the Washington State Ferries which now operates 22 ferry vessels, as well as data and information from four additional ferry systems.
*With the exception of the Kitsap Transit Foot Ferry which in past publications has been included under Kitsap Transit in the Small Urban Transit section.
King County Ferry DistrictIn April 2007, the King County Ferry District (KCFD) was created to expand transportation options through water taxi services. King County Council members are the Ferry District Board of Supervisors.
The KCFD funds and oversees the operations of two existing water taxi services. The KCFD contracts with the King County Marine Division for operations. The KCFD also took over the water taxi service between West Seattle and Downtown Seattle (previously the Elliott Bay Water Taxi).
Kitsap Transit Foot FerryThe Kitsap Transit Foot Ferry provides service between the Bremerton, Port Orchard and Annapolis Ferry Docks on weekdays and between Port Orchard and Bremerton.
Lummi Island FerryWhatcom County Public Works Ferry Division is responsible for the operation and maintenance of the Whatcom Chief. This ferry serves Lummi Island residents, visitors, and businesses, transporting over 197,980 passengers during 2010.
Pierce County Ferry SystemPierce County took responsibility for the Steilacoom to Anderson and McNeil Island ferry route in 1938. The ferry system is the lifeline for Anderson and Ketron Island residents and visitors. It has seen a passenger use growth from 34,000 in 1968 to 199,261 in 2010.

Ferry Systems in Washington State
Page 214 Summary of Public Transportation – 2010 November 2011
Washington State FerriesWashington State Ferries (WSF) began in 1951 as the Washington Toll Bridge Authority, taking over the operation of the privately owned and operated Puget Sound Navigation Company. In 1974, the Authority added the facilities and vessels associated with the Port Townsend‑Keystone route, owned and operated by Black Ball Transport, Inc. Creation of the Washington State Department of Transportation in 1977 (previously Department of Highways) included assuming the Toll Bridge Authority and WSF became one of its Divisions.
Washington State Ferries operates the largest ferry fleet in the United States. 22 ferries cross Puget Sound and its inland waterways, carrying over 23 million passengers. From Tacoma, Washington, to Sidney, British Columbia, Washington State Ferries travel up and down the Sound, acting as a marine highway for commercial users, tourists and daily commuters.

Ferry Systems in Washington State
Summary of Public Transportation – 2010 Page 215 November 2011
Annual Operating Information
2010Passenger Ferry ServicesRevenue Vessel Hours 139,476 Total Vessel Hours 140,254 Revenue Vessel Miles 1,016,063 Total Vessel Miles 1,026,932 Passenger Trips 23,609,171 Diesel Fuel Consumed (gallons) 17,248,950 Employees - FTEs 1,871.9 Operating Expenses $219,442,928Farebox Revenues $40,534,047
RevenuesOperating Related RevenuesLocal Funds (Directly Generated - Property Taxes) $1,216,195MVET $106,813Farebox Revenues $40,534,047Federal Section §5307 Operating $1,266,467Other State Operating Grants $57,095,891Other Operating Sub-Total $119,305,361Other-Interest $7,924Other-MISC $119,297,437Total (Excludes Capital Revenues) $219,524,774
Federal Capital Grant RevenuesFederal Section §5307 Capital Grants $33,862Federal Section §5309 Capital Grants $6,226,414CM/AQ and Other Federal Grants $8,917,886Total Federal Capital $15,178,162
State Capital Grant RevenuesOther State Capital Funds $116,521,144Total State Capital $116,521,144

Ferry Systems in Washington State
Page 216 Summary of Public Transportation – 2010 November 2011
Expenditures2010
Local Capital ExpendituresLocal Funds $345,234Total Local Capital $345,234
Other ExpendituresOther Expenditures $602,242Depreciation $614,473Total (Non-Capital) Expenditures $1,216,715
Debt ServiceInterest $32,011Principal $0Total Debt Service $32,011
Total Funds by Source2010 % of Total
OperatingTotal Local Investment $161,764,658 73.49Total State Investment $57,095,891 25.94Total Federal Investment $1,266,467 0.58Total Operating $220,127,016 100.00
CapitalTotal Local Investment $345,234 0.26Total State Investment $116,521,144 88.24Total Federal Investment $15,178,162 11.49Total Capital $132,044,540 100.00

Summary of Public Transportation – 2010 Page 217 November 2011
King County Ferry DistrictAnne NorisClerk of the King County Council and Ferry District Board516 Third Avenue, Room 1200Seattle, WA 98104206‑296‑1020www.kingcountyferries.org
System Snapshot• Service Area: King County/Puget Sound – Downtown Seattle to Vashon Island
• Congressional District: 7
• Legislative District: 34
• Type of Government: Special Purpose District
• Governing Body: Ferry Board of Supervisors
• Tax Authorized: Property Tax Levy $1,183,252 (approximately 1/3 cent per $1000 Assessed Value)
• Fares: Vashon Island $4.50
Intermodal ConnectionsThe King County Ferry between Vashon Island and Downtown Seattle connects to Metro Transit.

King County Ferry District
Page 218 Summary of Public Transportation – 2010 November 2011
Annual Operating Information
2010Passenger Ferry Services (Purchased Transportation)Revenue Vessel Hours 1,421 Total Vessel Hours 1,421 Revenue Vessel Miles 28,410 Total Vessel Miles 29,640 Passenger Trips 153,634 Diesel Fuel Consumed (gallons) 89,321 Employees - FTEs 7.5 Operating Expenses $1,523,203Farebox Revenues $444,807
RevenuesOperating Related RevenuesSales Tax $0Local Funds (Directly Generated - Property Taxes) $1,216,195Utility Tax $0MVET $0Farebox Revenues $444,807Other State Operating Grants $527,111Total (Excludes Capital Revenues) $2,188,113
Federal Capital Grant RevenuesFederal Section §5307 Capital Grants $15,690Total Federal Capital $15,690
State Capital Grant RevenuesOther State Capital Funds $136,745Total State Capital $136,745
Expenditures2010
Local Capital ExpendituresLocal Funds $0Total Local Capital $0
Other ExpendituresOther Expenditures $602,242Total $602,242

King County Ferry District
Summary of Public Transportation – 2010 Page 219 November 2011
Total Funds by Source2010 % of Total
OperatingTotal Local Investment $2,263,244 81.11Total State Investment $527,111 18.89Total Federal Investment $0 0.00Total Operating $2,790,355 100.00
CapitalTotal Local Investment $0 0.00Total State Investment $136,745 89.71Total Federal Investment $15,690 10.29Total Capital $152,435 100.00

King County Ferry District
Page 220 Summary of Public Transportation – 2010 November 2011

Summary of Public Transportation – 2010 Page 221 November 2011
Kitsap Transit Foot FerryRichard M. HayesExecutive Director60 Washington Avenue, Suite 200Bremerton, WA 983371888360‑377‑7086www.kitsaptransit.org
System Snapshot• Service Area: Kitsap County
• Congressional District: 1 and 6
• Legislative District: 23, 26, 35
• Type of Government: PTBA
• Governing Body: Board of Commissioners
• Tax Authorized: Current authorization is 0.8 percent of sales tax (0.5 percent in 1993 increased to 0.8 in 2001).
• Fares: Base fare is $2.00 per trip for Routed and Paratransit fare ($1.00 reduced fare); $50 for monthly pass.
• Intermodal Connections: The Kitsap Transit Foot Ferry provides service between the Bremerton, Port Orchard, and Annapolis Ferry Docks on weekdays and between Port Orchard and Bremerton on Saturdays. Kitsap Transit provides connections to all four WSF terminals in Kitsap County and provides service to many area elementary, middle, and high Schools as well as both branches of Olympic College. Mason Transit connections are available at the Bremerton Transportation Center and Jefferson Transit meets Kitsap Transit at our Poulsbo Transfer Center.

Kitsap Transit Foot Ferry
Page 222 Summary of Public Transportation – 2010 November 2011
Annual Operating Information2008 2009 2010 % Change
Passenger Ferry Services (Purchased Transportation)Revenue Vessel Hours 6,699 5,982 5,869 -1.89Total Vessel Hours 6,795 6,106 5,969 -2.24Revenue Vessel Miles 48,998 45,064 44,448 -1.37Total Vessel Miles 50,023 46,304 45,452 -1.84Passenger Trips 525,455 473,926 444,296 -6.25Diesel Fuel Consumed (gallons) 47,073 42,849 42,658 -0.45Employees - FTEs 5.0 10.6 10.4 -1.89Operating Expenses $1,886,367 $1,804,442 $1,811,449 0.39Farebox Revenues $300,442 $548,627 $751,773 37.03
See the Kitsap Transit section for agency information.
RevenuesOperating Related RevenuesFarebox Revenues $300,442 $548,627 $751,773 37.03Total (Excludes Capital Revenues) $300,442 $548,627 $751,773 37.03
Total Funds by Source2008 Data 2009 Data 2010 Data % of Total
OperatingTotal Local Investment $300,442 $548,627 $751,773 100.00Total State Investment $0 $0 $0 0.00Total Federal Investment $0 $0 $0 0.00Total Operating $300,442 $548,627 $751,773 100.00
CapitalTotal Local Investment $0 $0 $0 -Total State Investment $0 $0 $0 -Total Federal Investment $0 $0 $0 -Total Capital $0 $0 $0 -

Summary of Public Transportation – 2010 Page 223 November 2011
Lummi Island FerryPublic Works Administration322 N. Commercial Street, Suite 210Bellingham, WA 98225360‑676‑6692www.co.whatcom.wa.us/publicworks/ferry/index.jsp
System Snapshot• Service Area: Service to Lummi Island from Bellingham.
• Congressional District: 2
• Legislative District: 42
• Type of Government: County
• Governing Body: Whatcom County Executive and County Council
• Tax Authorized: Motor Vehicle Fuel Tax (Ferry Deficit Reimbursement) of
• Intermodal Connections: Connects Lummi Island to the City of Bellingham 365 days a year.
Fares Cost Surcharge TotalRate Basis – Roundtrips
Passenger/Pedestrian $4.00 $3.00 $7.00 1 round tripChild Under 12 Free $0.00 Free 1 round tripCommuter $40.00 $75.00 $115.00 25 round tripsNeeds Based Passenger $17.00 $75.00 $92.00 25 round tripsComplete fare structure: www.co.whatcom.wa.us/publicworks/ferry/pdf/012311rates.pdf

Lummi Island Ferry
Page 224 Summary of Public Transportation – 2010 November 2011
Annual Operating Information
2010Passenger Ferry Services (Purchased Transportation)Passenger Trips 197,980 Operating Expenses 2,593,833 Farebox Revenues $1,021,866
RevenuesOperating Related RevenuesFarebox Revenues $1,021,866Other Operating Sub-Total $1,290,541Other-Interest $7,924Other-MISC $1,282,617Total (Excludes Capital Revenues) $2,312,407Other-MISC includes County Road Fund transfer and Ferry Deficit Reimbursement.
Total Funds by Source2010 % of Total
OperatingTotal Local Investment $2,312,407 100.0Total State Investment $0 0.0Total Federal Investment $0 0.0Total Operating $2,312,407 100.0
CapitalTotal Local Investment $0 -Total State Investment $0 -Total Federal Investment $0 -Total Capital $0 -

Summary of Public Transportation – 2010 Page 225 November 2011
Pierce County Ferry SystemDeb WallaceAirport and Ferry Administrator9850 64th Street WestUniversity Place, WA 98467253‑798‑4638www.co.pierce.wa.us/pc/abtus/ourorg/pwu/ferry/ferrymain.htm
System Snapshot• Service Area: Steilacoom, Anderson Island, and Ketron Island.
• Congressional District: 9
• Legislative District: 28
• Type of Government: County
• Governing Body: Executive and County Council
• Tax Authorized: 6.5% State Sales and Use Tax plus 2.8% Local City/County Sales and Use Tax
• Intermodal Connections: The Pierce County Ferry connects to Pierce Transit.
• Fares:
Winter Peak (May 15–Sept 15)Adults $ 4.70 $ 4.70
Child Under 5 Free FreeCommuter (x5) $ 18.50 $ 18.50Disabled/Senior $ 2.40 $ 2.40Youth (15-18) $ 3.40 $ 3.40

Pierce County Ferry System
Page 226 Summary of Public Transportation – 2010 November 2011
Annual Operating Information
2010Passenger Ferry Services (Purchased Transportation)Revenue Vessel Hours 5,579 Total Vessel Hours 5,579 Revenue Vessel Miles 40,430 Total Vessel Miles 43,697 Passenger Trips 199,261 Diesel Fuel Consumed (gallons) 135,778 Employees - FTEs - Operating Expenses $4,970,443Farebox Revenues $1,912,685
RevenuesOperating Related RevenuesMVET $106,813Farebox Revenues $1,912,685Federal Section §5307 Operating $1,266,467Other State Operating Grants $441,965Other Operating Sub-Total $2,102,321Other-MISC $2,102,321Total (Excludes Capital Revenues) $5,830,251
State Capital Grant RevenuesOther State Capital Funds $26,122Total State Capital $26,122
ExpendituresLocal Capital ExpendituresLocal Funds $32,754Total Local Capital $32,754
Other ExpendituresDepreciation (Not included in Total Expenditures) $614,473
Debt ServiceInterest $32,011Total Debt Service $32,011

Pierce County Ferry System
Summary of Public Transportation – 2010 Page 227 November 2011
Total Funds by Source2010 % of Total
OperatingTotal Local Investment $4,121,819 70.70Total State Investment $441,965 7.58Total Federal Investment $1,266,467 21.72Total Operating $5,830,251 100.00
CapitalTotal Local Investment $32,754 55.63Total State Investment $26,122 44.37Total Federal Investment $0 0.00Total Capital $58,876 100.00
Pierce County Ferry System
Page 228 Summary of Public Transportation – 2010 November 2011

Summary of Public Transportation – 2010 Page 229 November 2011
Washington State FerriesDavid MoseleyAssistant Secretary2901 Third Avenue Suite 500Seattle, WA 98121‑3014206‑515‑3400www.wsdot.wa.gov/ferries
• Service Area: Puget Sound, including: Sidney, Orcas, Shaw, Lopez, Anacortes, Coupville, Port Townsend, Clinton, Mukilteo, Kingston, Edmonds, Seattle, Bainbridge Island, Bremerton, Fauntleroy, Vashon, Southworth, Tahlequah, and Pt. Defiance.
• Fares: www.wsdot.wa.gov/ferries/fares
• Schedules: www.wsdot.com/ferries/schedule
• Intermodal Connections: In Island and Kitsap Counties and on Vashon Island, transit service is timed and linked with ferry schedules. In downtown Seattle, there is very frequent transit service, but not specifically linked to ferry schedules. New intermodal connections issues will emerge with the construction of new intermodal ferry terminals in Mukilteo and Edmonds, that may have connections to commuter rail services.
Jumbo Mark II Jumbo
Puyallup | Tacoma | Wenatchee Spokane | Walla Walla
Super Issaquah 130
Elwha | Hyak | Kaleetan | Yakima Cathlamet | Chelan | Issaquah | Kitsap | Kittitas
Issaquah Evergreen State
Sealth Evergreen State | Klahowya | Tillikum
Kwa-di Tabil Rhododendron
Chetzemoka | Saish Rhododendon
Hiyu
Hiyu

Washington State Ferries
Page 230 Summary of Public Transportation – 2010 November 2011
Annual Operating Information
2010Passenger Ferry ServicesRevenue Vessel Hours 126,607 Total Vessel Hours 127,285 Revenue Vessel Miles 902,775 Total Vessel Miles 908,143 Passenger Trips 22,614,000 Diesel Fuel Consumed (gallons) 16,981,193 Employees - FTEs 1,854 Operating Expenses $208,544,000Farebox Revenues $36,402,916
RevenuesOperating Related RevenuesFarebox Revenues $36,402,916Other State Operating Grants $56,126,815Other Operating Sub-Total $115,912,499Other-MISC (Other Fare Related Revenues) $115,912,499Total (Excludes Capital Revenues) $208,442,230
Federal Capital Grant RevenuesFederal Section §5307 Capital Grants $18,172Federal Section §5309 Capital Grants $6,226,414CM/AQ and Other Federal Grants $8,917,886Total Federal Capital $15,162,472
State Capital Grant RevenuesOther State Capital Funds $116,358,277Total State Capital $116,358,277
ExpendituresLocal Capital ExpendituresLocal Funds $312,480Total Local Capital $312,480

Washington State Ferries
Summary of Public Transportation – 2010 Page 231 November 2011
Total Funds by Source2010 % of Total
OperatingTotal Local Investment $152,315,415 73.07Total State Investment $56,126,815 26.93Total Federal Investment $0 0.00Total Operating $208,442,230 100.00
CapitalTotal Local Investment $312,480 0.24Total State Investment $116,358,277 88.26Total Federal Investment $15,162,472 11.50Total Capital $131,833,229 100.00

Washington State Ferries
Page 232 Summary of Public Transportation – 2010 November 2011
Summary of Public Transportation – 2010 Page 233 November 2011
Seattle Center MonorailThomas DittyGeneral Manager370 Thomas Street, Suite 200Seattle, WA 98109206‑905‑2600www.seatlemonorail.com
System Snapshot• Service Area: Downtown Seattle from Seattle Center station to Westlake Center
Mall station.
• Congressional District: 7
• Legislative District: 36 and 43
• Ownership: Owned by the City of Seattle, operated by Seattle Monorail Services.
• Fares: One‑way fare – Adults (12 and older) $2.25; Reduced Rate: Disabled/Senior/Active Military $1.00; Youth (5‑12) $1.00; Unlimited Monthly $45.00; Unlimited Monthly Reduced Rate $20.00
The Seattle Monorail has been a Seattle icon since the 1962 World’s Fair. The Seattle Center Monorail is a privately run business with independent leadership and staff. The monorail is not government funded or subsidized.
Today, the monorail carries approximately 1.5 million riders every year. The monorail has become an important fixture in Seattle for locals, who use it during major festivals and sporting events.
Seattle Center Monorail is the nation’s only fully self-sufficient public transportation system.
A Brief History of the Seattle Center Monorail
• The Seattle Center Monorail was built for the 1962 Seattle World’s Fair to link the fairgrounds and downtown amenities.
• Construction began in April of 1961 by ALWEG Rapid Transit Systems, who received the bid when it offered to underwrite the entire cost of construction.
• Opened to the public on March 24, 1962, before the start of the World’s Fair. The trains carried more than eight million guests during the six months of the fair. The full initial capital cost of the system ($3.5 million) was recovered and a profit was realized by ALWEG before the end of the fair.
• Following the Fair, the monorail system was turned over to Century 21 Corporation at no cost. Century 21 sold the system to the City of Seattle in 1965 for $600,000.

Seattle Center Monorail
Page 234 Summary of Public Transportation – 2010 November 2011
Annual Operating Information
2010Monorail Services (Purchased Transportation)Revenue Vehicle Hours 19,447Total Vehicle Hours 19,447Revenue Vehicle Miles 201,932Total Vehicle Miles 201,932Passenger Trips 1,793,161Electricity Consumed (Kwh) 617,018Employees - FTEs 16.0Operating Expenses $2,709,895Farebox Revenues $3,053,436
RevenuesOperating Related RevenuesFarebox Revenues $3,053,436Other-Advertising $5,493Total (Excludes Capital Revenues) $3,058,929
Federal Capital Grant RevenuesFederal Section §5307 Capital Grants $478,759Total Federal Capital $478,759
ExpendituresDebt ServiceInterest $3,569Total $3,569
Comments: Books close on December 31st and concession payments are paid out to the City based on our agreement.
Total Funds by Source2010 % of Total
OperatingTotal Local Investment $3,058,929 100.00Total State Investment $0 0.00Total Federal Investment $0 0.00Total Operating $3,058,929 100.00
CapitalTotal Local Investment $0 0.00Total State Investment $0 0.00Total Federal Investment $478,759 100.00Total Capital $478,759 100.00

Summary of Public Transportation – 2010 Page 235 November 2011
Statewide Operations Summary
2007 2008 2009 2010 % ChangeAnnual Operating InformationService Area Population 5,565,605 5,660,120 5,730,940 5,808,470 1.35
Fixed Route ServicesRevenue Vehicle Hours 6,097,394 6,532,845 6,613,074 6,505,048 -1.63Total Vehicle Hours 6,960,659 7,446,142 7,545,410 7,423,047 -1.62Revenue Vehicle Miles 83,413,193 90,519,458 91,649,982 90,105,804 -1.68Total Vehicle Miles 101,178,669 109,840,079 111,390,149 109,596,559 -1.61Passenger Trips 176,373,343 203,811,136 194,912,291 187,696,208 -3.70Diesel Fuel Consumed (gallons) 19,014,119 19,332,228 22,226,491 21,671,301 -2.50Gasoline Fuel Consumed (gallons) 205,603 203,943 250,010 231,378 -7.45CNG Fuel Consumed (Therms) 3,213,209 3,481,053 2,638,738 3,172,974 20.25Electricity Consumed (Kwh) 15,662,605 16,277,945 16,917,983 18,258,379 7.92Employees FTEs 6,717.7 7,066.6 6,943.5 6,927.3 -0.23Operating Expenses $741,883,054 $861,334,834 $863,655,065 $883,842,808 2.34Farebox Revenues $128,970,330 $173,051,246 $187,465,492 $201,842,038 7.67
Commuter Rail ServicesRevenue Vehicle Hours 19,329 27,006 36,010 59,420 65.01Total Vehicle Hours 24,177 33,799 44,218 68,441 54.78Revenue Vehicle Miles 743,207 1,039,433 1,399,687 1,657,054 18.39Total Vehicle Miles 752,902 1,052,986 1,417,997 1,677,942 18.33Passenger Trips 2,156,652 2,668,623 2,492,362 3,874,058 55.44Diesel Fuel Consumed (gallons) 920,095 1,049,633 1,119,629 2,074,869 85.32Employees FTEs 4.0 4.0 4.0 66.2 1555.00Operating Expenses $24,851,744 $31,084,795 $34,020,024 $37,827,019 11.19Farebox Revenues $6,731,888 $8,196,172 $7,766,691 $7,134,458 -8.14
Light Rail ServicesRevenue Vehicle Hours 10,034 21,107 81,109 158,433 95.33Total Vehicle Hours 10,228 21,420 86,357 170,123 97.00Revenue Vehicle Miles 97,115 150,712 1,262,886 2,736,295 116.67Total Vehicle Miles 97,369 151,392 1,281,030 2,836,445 121.42Passenger Trips 919,013 1,339,329 3,841,974 8,352,838 117.41Electricity Consumed (Kwh) 420,006 963,805 5,781,957 14,289,927 147.15Employees FTEs 36.0 37.0 44.5 223.1 401.35Operating Expenses $3,376,195 $5,506,292 $23,105,329 $46,744,774 102.31Farebox Revenues $0 $275,185 $2,714,803 $9,897,480 264.57
Summary of Statewide Statistics

Summary of Statewide Statistics
Page 236 Summary of Public Transportation – 2010 November 2011
2007 2008 2009 2010 % ChangeRoute Deviated ServicesRevenue Vehicle Hours 150,092 117,935 117,295 145,722 24.24Total Vehicle Hours 174,491 137,323 136,896 169,691 23.96Revenue Vehicle Miles 3,384,521 2,482,781 2,413,943 3,140,271 30.09Total Vehicle Miles 3,613,866 2,677,207 2,561,131 3,356,746 31.06Passenger Trips 1,336,912 1,276,488 1,248,003 1,344,303 7.72Diesel Fuel Consumed (gallons) 435,888 327,540 345,309 450,647 30.51Gasoline Fuel Consumed (gallons) 938 3,190 10,735 33,437 211.48CNG Fuel Consumed (Therms) 1,791 2,037 2,030 605 -70.20Employees FTEs 139.6 92.1 88.4 106.6 20.69Operating Expenses $12,490,440 $9,355,135 $10,052,077 $13,037,325 29.70Farebox Revenues $485,567 $440,053 $712,432 $565,257 -20.66
Demand Response ServicesRevenue Vehicle Hours 1,893,897 2,031,447 2,003,165 1,926,249 -3.84Total Vehicle Hours 2,143,075 2,280,752 2,238,721 2,159,084 -3.56Revenue Vehicle Miles 28,177,783 30,050,584 29,400,985 28,769,457 -2.15Total Vehicle Miles 31,909,543 34,160,565 33,236,093 32,863,554 -1.12Passenger Trips 4,746,662 4,885,240 4,799,152 4,675,676 -2.57Diesel Fuel Consumed (gallons) 2,331,547 2,591,477 2,364,288 2,331,770 -1.38Gasoline Fuel Consumed (gallons) 790,655 1,082,175 1,382,225 1,378,828 -0.25CNG Fuel Consumed (Therms) 22,310 29,102 26,961 27,184 0.83Employees FTEs 1,621.1 1,736.2 1,691.5 1,015.3 -39.98Operating Expenses $142,385,614 $158,079,726 $153,512,114 $160,321,997 4.44Farebox Revenues $3,288,112 $3,632,720 $3,625,137 $3,484,162 -3.89
Vanpooling ServicesRevenue Vehicle Hours N/A 885,547 880,108 869,464 -1.21Total Vehicle Hours N/A 885,647 880,625 870,201 -1.18Revenue Vehicle Miles 30,046,749 34,593,978 35,563,842 35,540,446 -0.07Total Vehicle Miles 30222514 34,604,463 35,576,655 35,554,436 -0.06Passenger Trips 5,699,182 7,960,088 8,083,452 7,745,157 -4.19Diesel Fuel Consumed (gallons) 160,079 214,962 97,189 47,672 -50.95Gasoline Fuel Consumed (gallons) 1,907,489 2,139,980 2,353,666 2,326,092 -1.17Employees FTEs 104.5 126.6 122.2 116.5 -4.64Operating Expenses $21,269,209 $26,996,898 $25,958,491 $25,825,329 -0.51Vanpooling Revenue $15,274,455 $18,327,217 $22,209,338 $21,107,839 -4.96

Summary of Statewide Statistics
Summary of Public Transportation – 2010 Page 237 November 2011
Revenues2007 2008 2009 2010 % Change
Annual Operating Related RevenuesSales Tax $1,091,983,882 $74,574,064 $1,165,623,542 $1,228,451,855 5.39Utility Tax $1,032,527 $1,122,403 $1,146,509 $23,262,769 1929.01MVET $72,402,877 $68,620,777 $67,289,938 $65,788,394 -2.23Farebox Revenues $139,475,897 $185,595,377 $202,284,555 $222,923,395 10.20Vanpooling Revenue $15,274,455 $18,327,217 $22,209,338 $21,107,839 -4.96Federal Section §5307 Operating $11,227,204 $14,208,878 $56,572,650 $62,000,843 9.60Federal Section §5307 Preventive $57,311,778 $80,579,601 $74,589,125 $67,758,967 -9.16Federal Section §5311 Operating $3,891,509 $5,082,614 $3,940,174 $3,483,032 -11.60FTA JARC (§5316) Program $1,349,926 $2,073,581 $1,410,324 $1,710,370 21.27Other Federal Operating $5,791,690 $1,155,675 $864,159 $4,738,145 448.30State Rural Mobility Grants $1,228,079 $867,460 $872,409 $2,472,265 183.38State Regional Mobility Operating Grants $0 $244,119 $1,403,870 $3,327,998 137.06State Special Needs Grants $7,596,315 $9,372,507 $10,158,613 $6,776,386 -33.29Sales Tax Equalization $2,658,610 $4,047,889 $2,633,036 $2,452,745 -6.85Other State Operating Grants $4,359,477 $4,269,911 $3,098,682 $1,915,187 -38.19Other Operating Sub-Total $97,702,360 $73,881,540 $68,948,174 $53,178,857 -22.87Total $1,513,286,584 $544,023,613 $1,683,045,099 $1,771,349,047 5.25
Federal Capital RevenuesFederal Section §5307 Capital Grants $20,575,109 $64,895,457 $105,452,270 $66,962,985 -36.50Federal Section §5309 Capital Grants $126,462,965 $149,132,327 $107,608,808 $145,055,619 34.80Federal Section §5310 Capital Grants $0 $0 $0 $1,029,372 -Federal Section §5311 Capital Grants $2,540,940 $347,376 $2,093,126 $5,727,941 173.65FTA JARC (§5316) Program $290,461 $186,392 $352,146 $0 -100.00Federal STP Grants $963,573 $2,448,294 $254,849 $368,389 44.55CM/AQ and Other Federal Grants $6,864,126 $7,884,766 $3,137,895 $6,076,359 93.64Total Federal Capital $157,697,174 $224,894,612 $218,899,094 $225,220,665 2.89
State Capital RevenuesState Rural Mobility Grants $424,104 $513,364 $315,032 $1,038,741 229.73State Regional Mobility Grants $0 $2,599,137 $14,573,173 $12,696,439 -12.88State Special Needs Grants $558,124 $1,181,167 $1,725,218 $106,665 -93.82State Sales Tax Equilization $0 $0 $0 $0 -State Vanpool Grants $2,723,279 $5,543,234 $2,507,716 $454,205 -81.89Other State Capital Funds $8,525,678 $13,603,794 $13,211,537 $5,365,739 -59.39Total State Capital $12,231,185 $23,440,696 $32,332,676 $19,661,789 -39.19
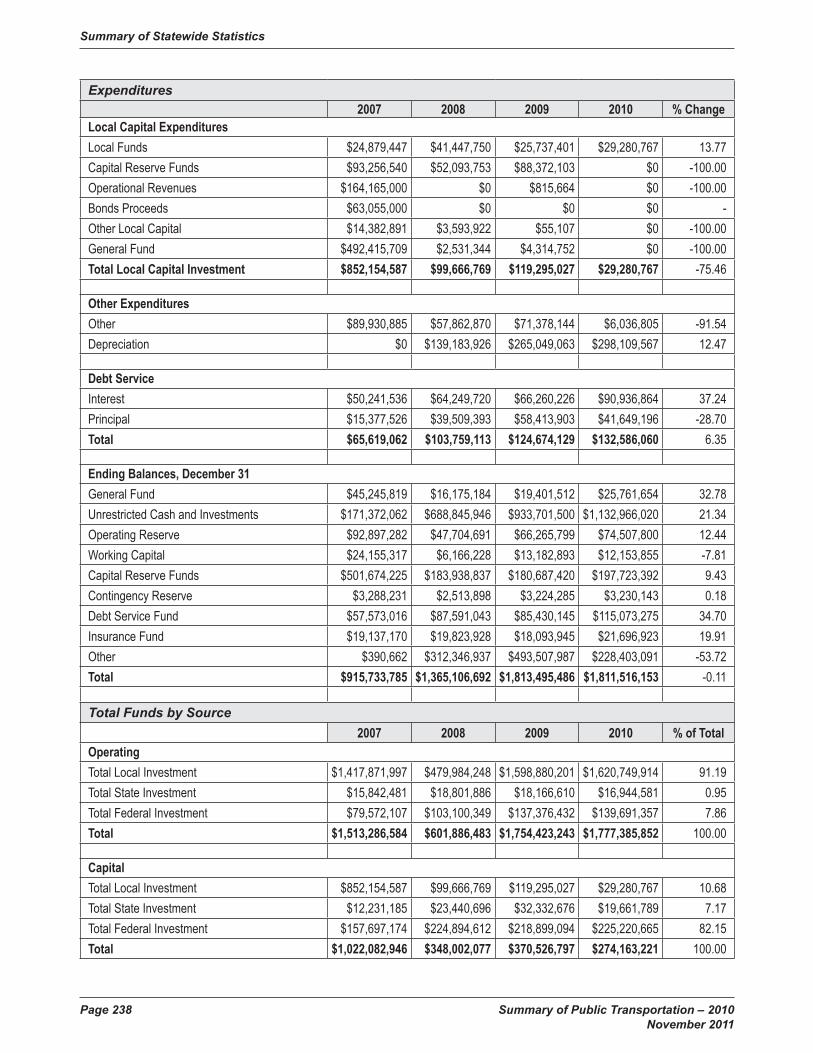
Summary of Statewide Statistics
Page 238 Summary of Public Transportation – 2010 November 2011
Expenditures2007 2008 2009 2010 % Change
Local Capital ExpendituresLocal Funds $24,879,447 $41,447,750 $25,737,401 $29,280,767 13.77Capital Reserve Funds $93,256,540 $52,093,753 $88,372,103 $0 -100.00Operational Revenues $164,165,000 $0 $815,664 $0 -100.00Bonds Proceeds $63,055,000 $0 $0 $0 -Other Local Capital $14,382,891 $3,593,922 $55,107 $0 -100.00General Fund $492,415,709 $2,531,344 $4,314,752 $0 -100.00Total Local Capital Investment $852,154,587 $99,666,769 $119,295,027 $29,280,767 -75.46
Other ExpendituresOther $89,930,885 $57,862,870 $71,378,144 $6,036,805 -91.54Depreciation $0 $139,183,926 $265,049,063 $298,109,567 12.47
Debt ServiceInterest $50,241,536 $64,249,720 $66,260,226 $90,936,864 37.24Principal $15,377,526 $39,509,393 $58,413,903 $41,649,196 -28.70Total $65,619,062 $103,759,113 $124,674,129 $132,586,060 6.35
Ending Balances, December 31General Fund $45,245,819 $16,175,184 $19,401,512 $25,761,654 32.78Unrestricted Cash and Investments $171,372,062 $688,845,946 $933,701,500 $1,132,966,020 21.34Operating Reserve $92,897,282 $47,704,691 $66,265,799 $74,507,800 12.44Working Capital $24,155,317 $6,166,228 $13,182,893 $12,153,855 -7.81Capital Reserve Funds $501,674,225 $183,938,837 $180,687,420 $197,723,392 9.43Contingency Reserve $3,288,231 $2,513,898 $3,224,285 $3,230,143 0.18Debt Service Fund $57,573,016 $87,591,043 $85,430,145 $115,073,275 34.70Insurance Fund $19,137,170 $19,823,928 $18,093,945 $21,696,923 19.91Other $390,662 $312,346,937 $493,507,987 $228,403,091 -53.72Total $915,733,785 $1,365,106,692 $1,813,495,486 $1,811,516,153 -0.11
Total Funds by Source2007 2008 2009 2010 % of Total
OperatingTotal Local Investment $1,417,871,997 $479,984,248 $1,598,880,201 $1,620,749,914 91.19Total State Investment $15,842,481 $18,801,886 $18,166,610 $16,944,581 0.95Total Federal Investment $79,572,107 $103,100,349 $137,376,432 $139,691,357 7.86Total $1,513,286,584 $601,886,483 $1,754,423,243 $1,777,385,852 100.00
CapitalTotal Local Investment $852,154,587 $99,666,769 $119,295,027 $29,280,767 10.68Total State Investment $12,231,185 $23,440,696 $32,332,676 $19,661,789 7.17Total Federal Investment $157,697,174 $224,894,612 $218,899,094 $225,220,665 82.15Total $1,022,082,946 $348,002,077 $370,526,797 $274,163,221 100.00

Summary of Statewide Statistics
Summary of Public Transportation – 2010 Page 239 November 2011
Stat
ewid
e O
pera
ting
Stat
istic
s
2010
Fixe
d Ro
ute
Syst
em
Cate
gory
Serv
ice
Area
Po
pulat
ion
Reve
nue
Vehi
cle
Hour
s
Tota
l Ve
hicle
Ho
urs
Reve
nue
Vehi
cle
Miles
Tota
l Ve
hicle
Mi
lesPa
ssen
ger
Trip
sEm
ploy
ees
(FTE
)Op
erat
ing
Cost
sFa
rebo
x Re
venu
es
Pass
enge
r Tr
ips/
Reve
nue
Hour
Pass
enge
r Tr
ips/
Reve
nue
Mile
Reve
nue
Hour
s/ FT
E
Oper
atin
g Co
sts/
Reve
nue
Hour
Oper
atin
g Co
sts/
Reve
nue
Mile
Oper
atin
g Co
sts/
Pass
enge
r Tr
ip
Fare
box
Reco
very
Ra
tioAs
otin C
ounty
PTB
ASm
Urb
an21
,700
8,75
0 9,
049
131,9
11
135,0
43
44,33
4 6.
0 $3
58,78
3$2
2,254
5.10.3
41,4
58$4
1.00
$2.72
$8.09
6.20%
Ben F
rank
lin Tr
ansit
Sm U
rban
222,3
92 13
2,549
13
9,995
2,
453,2
53
2,60
6,619
3,
299,9
55
121.1
$1
2,731
,140
$1,30
3,603
24.9
1.35
1,095
$96.0
5$5
.19$3
.8610
.24%
Clall
am Tr
ansit
Sys
temRu
ral
70,10
0 47
,962
51,93
6 99
0,005
1,
084,3
04
918,2
30
64.8
$5,69
8,715
$608
,056
19.1
0.93
740
$118
.82$5
.76$6
.2110
.67%
Comm
unity
Tran
sitUr
ban
516,0
99 49
9,045
63
8,693
8,
425,1
38 1
1,856
,477
8,97
9,937
68
1.2
$79,4
85,72
6$1
6,379
,554
18.0
1.07
733
$159
.28$9
.43$8
.8520
.61%
Cowl
itz Tr
ansit
Auth
ority
(CUB
S)Sm
Urb
an47
,880
16,53
8 16
,538
214,7
02
218,7
08
396,1
45
15.0
$1,68
7,547
$127
,443
24.0
1.85
1,103
$102
.04$7
.86$4
.267.5
5%C-
TRAN
Urba
n36
6,951
256,4
28
279,4
32
3,93
1,152
4,
618,0
39
6,31
7,040
25
3.5
$28,2
35,74
8$6
,793,5
1124
.61.6
11,0
11$1
10.11
$7.18
$4.47
24.06
%Ev
erett
Tran
sitUr
ban
103,0
19 12
9,722
13
8,290
1,
610,6
76
1,79
8,188
2,
289,7
29
117.0
$1
4,240
,793
$1,20
6,313
17.7
1.42
1,109
$109
.78$8
.84$6
.228.4
7%Gr
ant T
rans
itRu
ral
87,70
0 4,
381
5,49
7 11
5,068
12
3,291
36
,244
8.0
$793
,834
$30,8
988.3
0.31
548
$181
.20$6
.90$2
1.90
3.89%
Gray
s Har
bor T
rans
Auth
ority
Rura
l72
,797
48,46
1 62
,130
983,7
63
1,04
7,722
87
3,800
59
.0 $4
,043,1
09$5
32,47
718
.00.8
982
1$8
3.43
$4.11
$4.63
13.17
%Int
ercit
y Tra
nsit
Sm U
rban
156,0
70 19
3,012
20
1,130
2,
604,5
77
2,76
0,246
4,
313,1
78
213.0
$2
0,466
,991
$2,41
4,920
22.3
1.66
906
$106
.04$7
.86$4
.7511
.80%
Islan
d Tra
nsit
Rura
l81
,100
35,34
9 49
,732
1,13
4,752
1,
195,9
00
672,6
67
24.0
$5,15
6,426
$019
.00.5
91,4
73$1
45.87
$4.54
$7.67
N/A
Jeffe
rson T
rans
it Auth
ority
Rura
l29
,300
16,83
0 17
,166
387,5
58
391,0
46
155,6
59
13.8
$1,47
2,440
$127
,310
9.20.4
01,2
20$8
7.49
$3.80
$9.46
8.65%
King
Cou
nty M
etro
Urba
n1,9
31,24
9 3,
110,5
88
3,53
1,378
35,1
85,38
4 44
,121,6
84
09,00
8,893
3,
172.5
$44
5,013
,709
$119
,912,9
7635
.03.1
098
0$1
43.06
$12.6
5$4
.0826
.95%
Kitsa
p Tra
nsit
Sm U
rban
248,3
00 10
4,712
13
5,511
1,
950,1
61
2,41
9,855
2,
877,9
35
152.6
$1
7,589
,787
$5,93
5,508
27.5
1.48
686
$167
.98$9
.02$6
.1133
.74%
Link T
rans
itSm
Urb
an10
6,154
65,31
9 69
,154
1,29
8,711
1,
367,3
79
829,9
09
65.5
$6,27
2,078
$553
,301
12.7
0.64
997
$96.0
2$4
.83$7
.568.8
2%Pa
cific T
rans
itRu
ral
22,10
0 12
,922
13,29
5 33
7,617
34
6,986
92
,488
6.0
$832
,595
$31,0
867.2
0.27
2,154
$64.4
3$2
.47$9
.003.7
3%Pi
erce
Tran
sitUr
ban
758,5
10 56
3,200
61
8,508
6,
959,3
66
8,04
7,389
14
,008,6
79
602.0
$7
0,530
,435
$11,6
19,74
324
.92.0
193
6$1
25.23
$10.1
3$5
.0316
.47%
Pullm
an Tr
ansit
Rura
l29
,799
24,49
6 25
,430
339,9
96
353,4
82
1,42
0,148
24
.8 $2
,535,2
96$1
,661,2
3958
.04.1
898
8$1
03.50
$7.46
$1.79
65.52
%Ci
ty of
Selah
Tran
s Ser
vice
Sm U
rban
7,147
3,26
5 3,
495
46,84
9 48
,800
64,09
8 2.
7 $1
81,27
2$0
19.6
1.37
1,205
$55.5
2$3
.87$2
.83N/
ASk
agit T
rans
itSm
Urb
an10
4,293
41,76
2 45
,515
732,1
32
800,7
35
544,5
18
43.7
$4,35
8,036
$376
,764
13.0
0.74
956
$104
.35$5
.95$8
.008.6
5%Sp
okan
e Tra
nsit A
uthor
ityUr
ban
398,4
61 41
4,364
44
2,366
5,
772,6
68
6,28
7,383
10
,710,5
28
436.6
$4
3,709
,912
$8,38
2,949
25.8
1.86
949
$105
.49$7
.57$4
.0819
.18%
Union
Gap
Tran
sitSm
Urb
an6,0
47 7,
280
7,88
0 16
5,117
19
4,989
83
,500
4.0
$275
,259
$011
.50.5
11,8
20$3
7.81
$1.67
$3.30
N/A
Valle
y Tra
nsit
Rura
l50
,054
25,35
2 26
,352
284,9
74
294,5
98
632,7
42
26.7
$2,11
5,885
$237
,032
25.0
2.22
950
$83.4
6$7
.42$3
.3411
.20%
Wha
tcom
Tran
s Auth
ority
Sm U
rban
195,2
72 13
5,061
14
3,783
1,
847,1
24
2,01
5,689
4,
720,9
51
119.0
$1
4,812
,684
$2,30
8,795
35.0
2.56
1,135
$109
.67$8
.02$3
.1415
.59%
Yakim
a Tra
nsit
Sm U
rban
91,19
6 54
,840
56,83
4 77
8,941
80
7,138
1,
312,1
16
55.4
$5,76
0,027
$430
,497
23.9
1.68
990
$105
.03$7
.39$4
.397.4
7%Ur
baniz
edTo
tals
4,074
,289
4,97
3,347
5,
648,6
67 6
1,884
,384
76,72
9,160
151
,314,8
06
5,26
2.8 $
681,2
16,32
3$1
64,29
5,046
30.4
2.45
945
$136
.97$1
1.01
$4.50
24.12
%Sm
all U
rban
Total
s1,2
06,45
1 76
3,088
82
8,884
12,2
23,47
8 13
,375,2
01
18,48
6,639
79
8.0
$84,4
93,60
4$1
3,473
,085
24.2
1.51
956
$110
.73$6
.91$4
.5715
.95%
Rura
lTo
tals
442,9
50 21
5,753
25
1,538
4,
573,7
33
4,83
7,329
4,
801,9
78
227.1
$2
2,648
,300
$3,22
8,098
22.3
1.05
950
$104
.97$4
.95$4
.7214
.25%
Stat
ewid
e Fixe
d Ro
ute
Tota
ls5,7
23,69
0 5,
952,1
88
6,72
9,089
78,6
81,59
5 94
,941,6
90 1
74,60
3,423
6,
288.0
$78
8,358
,227
$180
,996,2
2929
.32.2
294
7$1
32.45
$10.0
2$4
.5222
.96%
Soun
d Tra
nsit
Urba
n2,7
34,76
4 55
2,860
69
3,958
11,4
24,20
9 14
,654,8
69
13,09
2,785
63
9.3
$95,4
84,58
1$2
0,845
,809
23.7
1.15
865
$172
.71$8
.36$7
.2921
.83%

Summary of Statewide Statistics
Page 240 Summary of Public Transportation – 2010 November 2011
2010
Rou
te-D
eviat
edSy
stem
Ca
tego
ry
Serv
ice
Area
Po
pulat
ion
Reve
nue
Vehi
cle
Hour
s
Tota
l Ve
hicle
Ho
urs
Reve
nue
Vehi
cle
Miles
Tota
l Ve
hicle
Mi
lesPa
ssen
ger
Trip
sEm
ploy
ees
(FTE
)Op
erat
ing
Cost
sFa
rebo
x Re
venu
es
Pass
enge
r Tr
ips/
Reve
nue
Hour
Pass
enge
r Tr
ips/
Reve
nue
Mile
Reve
nue
Hour
s/FTE
Oper
atin
g Co
sts/
Reve
nue
Hour
Oper
atin
g Co
sts/
Reve
nue
Mile
Oper
atin
g Co
sts/
Pass
enge
r Tr
ip
Fare
box
Reco
very
Ra
tio
Gran
t Tra
nsit
Rura
l87
,700
25,32
4 29
,986
779,4
92
815,9
65
159,2
64
18.0
$1,78
4,322
$74,6
336.3
0.20
1,407
$70.4
6$2
.29$1
1.20
4.18%
Islan
d Tra
nsit
Rura
l81
,100
25,08
7 41
,199
619,2
48
713,4
18
354,0
00
19.0
$3,16
0,390
$014
.10.5
71,3
20$1
25.98
$5.10
$8.93
N/A
Jeffe
rson T
rans
it Auth
ority
Rura
l29
,300
5,65
9 5,
771
237,7
04
256,6
22
44,80
8 2.
5 $8
54,71
1$1
7,954
7.90.1
92,2
28$1
51.04
$3.60
$19.0
72.1
0%
Link T
rans
itSm
Urb
an10
6,154
18,64
5 20
,484
417,7
31
479,3
14
129,2
92
18.9
$1,76
9,047
$90,0
726.9
0.31
987
$94.8
8$4
.23$1
3.68
5.09%
Maso
n Cou
nty Tr
ans A
uthor
ityRu
ral
57,10
0 41
,897
41,89
7 61
6,170
61
6,170
40
5,132
22
.7 $3
,855,1
23$2
94,68
69.7
0.66
1,846
$92.0
1$6
.26$9
.527.6
4%
Twin
Tran
sitRu
ral
22,75
5 26
,260
26,75
4 43
8,343
44
2,871
21
9,842
23
.2 $1
,404,5
15$7
5,938
8.40.5
01,1
32$5
3.48
$3.20
$6.39
5.41%
Valle
y Tra
nsit
Rura
l50
,054
2,85
0 3,
600
31,58
3 32
,386
31,96
5 2.
3 $2
09,21
7$1
1,974
11.2
1.01
1,239
$73.4
1$6
.62$6
.555.7
2%
Stat
ewid
e Rou
te D
eviat
edTo
tals
346,4
63
145,7
22
169,6
91
3,14
0,271
3,
356,7
46
1,34
4,303
10
6.6
$13,0
37,32
5$5
65,25
79.2
0.54
1,366
$89.4
7$4
.15$9
.704.3
4%

Summary of Statewide Statistics
Summary of Public Transportation – 2010 Page 241 November 2011
2010
Dem
and
Resp
onse
Syst
em
Cate
gory
Serv
ice
Area
Po
pulat
ion
Reve
nue
Vehi
cle
Hour
s
Tota
l Ve
hicle
Ho
urs
Reve
nue
Vehi
cle
Miles
Tota
l Ve
hicle
Mi
lesPa
ssen
ger
Trip
sEm
ploy
ees
(FTE
)Op
erat
ing
Cost
sFa
rebo
x Re
venu
es
Pass
enge
r Tr
ips/
Reve
nue
Hour
Pass
enge
r Tr
ips/
Reve
nue
Mile
Reve
nue
Hour
s/FTE
Oper
atin
g Co
sts/
Reve
nue
Hour
Oper
atin
g Co
sts/
Reve
nue
Mile
Oper
atin
g Co
sts/
Pass
enge
r Tr
ip
Fare
box
Reco
very
Ra
tio
Asoti
n Cou
nty P
TBA
Sm U
rban
21,70
0 4,
345
4,69
0 52
,286
54,29
1 10
,273
2.5
$291
,188
$10,5
902.4
0.20
1,738
$67.0
2$5
.57$2
8.34
3.64%
Ben F
rank
lin Tr
ansit
Sm U
rban
222,3
92 14
7,512
16
2,098
2,
537,7
50
2,79
7,595
51
3,722
11
4.9
$12,4
28,84
4$3
79,04
13.5
0.20
1,284
$84.2
6$4
.90$2
4.19
3.05%
Clall
am Tr
ansit
Sys
temRu
ral
70,10
0 27
,127
28,35
4 51
0,136
52
8,283
59
,094
22.0
$1,63
5,449
$39,9
152.2
0.12
1,233
$60.2
9$3
.21$2
7.68
2.44%
Colum
bia C
ounty
Pub
lic Tr
ans
Rura
l4,1
50 9,
954
10,00
0 23
5,529
23
7,529
53
,063
13.8
$788
,876
$75,8
795.3
0.23
724
$79.2
5$3
.35$1
4.87
9.62%
Comm
unity
Tran
sitUr
ban
516,0
99 99
,012
114,3
50
1,77
8,032
2,
194,8
78
217,6
48
98.8
$8,52
2,739
$280
,741
2.20.1
21,0
02$8
6.08
$4.79
$39.1
63.2
9%
Cowl
itz Tr
ansit
Auth
ority
(CUB
S)Sm
Urb
an47
,880
20,16
9 20
,169
188,3
55
188,3
55
55,85
8 14
.7 $1
,019,5
13$1
3,892
2.80.3
01,3
72$5
0.55
$5.41
$18.2
51.3
6%
C-TR
ANUr
ban
366,9
51 80
,555
87,97
3 1,
253,4
77
1,43
6,388
21
8,104
80
.4 $7
,800,9
55$3
36,94
22.7
0.17
1,002
$96.8
4$6
.22$3
5.77
4.32%
Ever
ett Tr
ansit
Urba
n10
3,019
43,79
1 46
,511
518,0
59
570,6
65
113,5
81
40.0
$3,84
5,805
$104
,512
2.60.2
21,0
95$8
7.82
$7.42
$33.8
62.7
2%
Garfie
ld Co
unty
Publi
c Tra
nsRu
ral
775
2,25
4 2,
294
13,60
8 13
,810
9,49
6 3.
0 $1
03,57
4$3
,834
4.20.7
075
1$4
5.95
$7.61
$10.9
13.7
0%
Gran
t Tra
nsit
Rura
l87
,700
7,19
9 10
,360
121,3
86
159,0
03
20,15
7 13
.0 $8
04,78
4$3
1,521
2.80.1
755
4$1
11.79
$6.63
$39.9
33.9
2%
Gray
s Har
bor T
rans
Auth
ority
Rura
l72
,797
29,23
7 29
,237
455,7
00
455,7
00
109,6
58
16.0
$3,05
0,065
$109
,658
3.80.2
41,8
27$1
04.32
$6.69
$27.8
13.6
0%
Inter
city T
rans
itSm
Urb
an15
6,070
66,38
0 70
,351
841,9
21
921,5
65
152,9
77
72.0
$5,83
0,989
$160
,737
2.30.1
892
2$8
7.84
$6.93
$38.1
22.7
6%
Islan
d Tra
nsit
Rura
l81
,100
20,27
4 22
,018
281,7
10
354,0
85
45,13
2 11
.0 $9
14,88
1$0
2.20.1
61,8
43$4
5.13
$3.25
$20.2
7N/
A
Jeffe
rson T
rans
it Auth
ority
Rura
l29
,300
7,03
1 8,
235
84,64
0 11
0,127
17
,428
3.5
$776
,695
$10,9
172.5
0.21
1,986
$110
.47$9
.18$4
4.57
1.41%
King
Cou
nty M
etro
Urba
n1,9
31,24
9 69
2,447
78
7,996
10,2
92,91
8 12
,003,8
33
1,25
7,902
24
.5 $5
6,713
,747
$631
,672
1.80.1
228
,263
$81.9
0$5
.51$4
5.09
1.11%
Kitsa
p Tra
nsit
Sm U
rban
248,3
00 81
,029
88,92
3 1,
425,4
01
1,56
6,841
30
9,031
76
.8 $7
,614,9
50$3
06,71
43.8
0.22
1,055
$93.9
8$5
.34$2
4.64
4.03%
Link T
rans
itSm
Urb
an10
6,154
21,78
2 22
,949
307,6
94
319,1
47
69,95
4 18
.5 $1
,807,5
43$5
2,942
3.20.2
31,1
77$8
2.98
$5.87
$25.8
42.9
3%
Maso
n Cou
nty Tr
ans A
uthor
ityRu
ral
57,10
0 24
,665
24,66
5 32
7,504
32
7,504
52
,296
19.3
$2,04
9,492
$02.1
0.16
1,278
$83.0
9$6
.26$3
9.19
N/A
Pacifi
c Tra
nsit
Rura
l22
,100
7,20
5 8,
096
90,85
5 10
1,856
13
,295
3.9
$505
,982
$5,27
11.8
0.15
1,847
$70.2
3$5
.57$3
8.06
1.04%
Pier
ce Tr
ansit
Urba
n75
8,510
201,9
62
225,4
61
3,01
2,788
3,
463,5
59
445,9
70
56.0
$17,5
97,63
9$3
70,33
12.2
0.15
3,606
$87.1
3$5
.84$3
9.46
2.10%
Pullm
an Tr
ansit
Rura
l29
,799
7,38
4 7,
924
66,21
4 71
,296
16,31
0 7.
1 $6
41,03
7$5
,971
2.20.2
51,0
40$8
6.81
$9.68
$39.3
0.93
%
City
of Se
lah Tr
ans S
ervic
e1Sm
Urb
an7,1
47 1,
556
1,74
8 15
,677
18,01
6 3,
320
0.8
$43,1
92$0
2.10.2
1N/
A$2
7.76
$2.76
$13.0
1N/
A
Skag
it Tra
nsit
Sm U
rban
104,2
93 29
,492
32,71
3 35
8,703
42
2,530
74
,380
33.3
$2,86
6,022
$13,8
042.5
0.21
886
$97.1
8$7
.99$3
8.53
.48%
Spok
ane T
rans
it Auth
ority
Urba
n39
8,461
172,7
44
208,9
49
2,59
2,443
2,
986,4
54
517,1
92
167.6
$1
2,235
,091
$404
,124
3.00.2
01,0
31$7
0.83
$4.72
$23.6
63.3
0%
Twin
Tran
sitRu
ral
22,75
5 3,
563
3,63
4 53
,491
54,56
0 11
,890
2.3
$209
,870
$9,38
53.3
0.22
1,549
$58.9
0$3
.92$1
7.65
4.47%
Union
Gap
Tran
sitSm
Urb
an6,0
47 7,
540
7,69
0 23
,284
25,54
3 5,
260
5.5
$96,2
28$0
0.70.2
31,3
71$1
2.76
$4.13
$18.2
9N/
A
Valle
y Tra
nsit
Rura
l50
,054
13,24
5 14
,195
154,2
89
156,2
33
41,31
0 10
.0 $9
06,18
3$1
5,475
3.10.2
71,3
25$6
8.42
$5.87
$21.9
41.7
1%
Wha
tcom
Tran
s Auth
ority
Sm U
rban
195,2
72 55
,801
61,44
0 76
2,520
84
9,188
17
3,891
48
.0 $6
,082,9
45$1
4,247
3.10.2
31,1
63$1
09.01
$7.98
$34.9
8.23
%
Yakim
a Tra
nsit
Sm U
rban
91,19
6 40
,994
46,06
1 41
3,087
47
4,720
87
,484
36.0
$1,33
0,026
$96,0
472.1
0.21
1,139
$32.4
4$3
.22$1
5.20
7.22%
Urba
nized
Total
s4,0
74,28
9 1,
290,5
11
1,47
1,240
19,4
47,71
7 22
,655,7
77
2,77
0,397
46
7.3 $
106,7
15,97
6$2
,128,3
222.1
0.14
2,762
$82.6
9$5
.49$3
8.52
1.99%
Small
Urb
anTo
tals
1,206
,451
476,6
00
518,8
32
6,92
6,678
7,
637,7
91
1,45
6,150
42
3.0
$39,4
11,44
0$1
,048,0
143.1
0.21
1,127
$82.6
9$5
.69$2
7.07
2.66%
Rura
lTo
tals
527,7
30 15
9,138
16
9,012
2,
395,0
62
2,56
9,986
44
9,129
12
4.9
$12,3
86,88
8$3
07,82
62.8
0.19
1,274
$77.8
4$5
.17$2
7.58
2.49%
Stat
ewid
e Dem
and
Resp
onse
Tota
ls5,8
08,47
0 1,
926,2
49
2,15
9,084
28,7
69,45
7 32
,863,5
54
4,67
5,676
1,
015.3
$15
8,514
,304
$3,48
4,162
2.40.1
61,8
97$8
2.29
$5.51
$33.9
02.2
0%1 Th
e City
of S
elah c
ontra
cts w
ith Y
akim
a Tra
nsit f
or de
mand
resp
onse
servi
ces.
The
rider
ship
numb
ers a
re es
timate
s pro
vided
by Y
akim
a Tra
nsit.
The o
pera
ting c
ost r
epre
sents
the c
ontra
cted a
moun
t paid
to Y
akim
a Tra
nsit b
y Sela
h Tra
nsit.
Far
ebox
reve
nue f
or
Selah
servi
ce is
repo
rted b
y Yak
ima a
s par
t of th
eir fa
rebo
x rev
enue
s.

Summary of Statewide Statistics
Page 242 Summary of Public Transportation – 2010 November 2011
2010
Van
pool
Syst
em
Cate
gory
Serv
ice
Area
Po
pulat
ion
Reve
nue
Vehi
cle
Miles
Tota
l Ve
hicle
Mi
lesPa
ssen
ger
Trip
sEm
ploy
ees
(FTE
)Op
erat
ing
Cost
sFa
rebo
x Re
venu
es
Pass
enge
r Tr
ips/
Reve
nue
Mile
Oper
atin
g Co
sts/
Pass
enge
r Tr
ip
Fare
box
Reco
very
Ra
tioAs
otin C
ounty
PTB
ASm
Urb
an21
,700
129,4
40
134,6
68
35,38
3 1.
0 $4
5,394
$72,1
170.2
7$1
.2815
8.87%
Ben F
rank
lin Tr
ansit
Sm U
rban
222,3
92 4,
962,6
48
4,96
2,648
1,
261,0
68
7.7
$2,95
9,089
$2,25
3,987
0.25
$2.35
76.17
%Cl
allam
Tran
sit S
ystem
Rura
l70
,100
479,0
91
479,0
91
81,64
9 1.
0 $1
94,59
5$1
97,39
60.1
7$2
.3810
1.44%
Colum
bia C
ounty
Pub
lic Tr
ans
Rura
l4,1
50 17
5,801
17
8,801
34
,426
0.3
$81,0
50$1
05,54
20.2
0$2
.3513
0.22%
Comm
unity
Tran
sitUr
ban
516,0
99 4,
664,4
37
4,66
4,437
84
3,551
19
.9 $3
,693,7
38$2
,605,0
990.1
8$4
.3870
.53%
C-TR
ANUr
ban
366,9
51 78
,431
78,43
1 17
,426
0.3
$94,9
26$4
6,697
1.21
$1.00
49.19
%Gr
ant T
rans
itRu
ral
87,70
0 22
7,015
22
7,015
39
,952
- $1
78,04
9$1
00,56
10.1
8$4
.4656
.48%
Gray
s Har
bor T
rans
Auth
ority
Rura
l72
,797
281,7
83
281,7
83
72,25
4 1.
0 $8
6,756
$90,4
660.2
6$1
.2010
4.28%
Inter
city T
rans
itSm
Urb
an15
6,070
2,97
2,366
2,
972,3
66
635,0
99
9.0
$1,57
9,199
$1,36
7,099
0.21
$2.49
86.57
%Isl
and T
rans
itRu
ral
81,10
0 1,
187,3
96
1,19
0,995
21
8,224
2.
0 $4
64,55
2$4
48,23
10.1
8$2
.1396
.49%
Jeffe
rson T
rans
it Auth
ority
Rura
l29
,300
127,5
29
129,6
42
16,97
4 -
$31,2
80$6
7,974
0.13
$1.84
217.3
1%Ki
ng C
ounty
Metr
oUr
ban
1,931
,249
11,36
8,164
11
,368,1
64
2,84
9,585
35
.4 $9
,101,3
23$8
,728,0
420.2
5$3
.1995
.90%
Kitsa
p Tra
nsit
Sm U
rban
248,3
00 1,
146,4
14
1,14
6,414
25
9,696
8.
2 $1
,354,9
08$9
58,58
30.2
3$5
.2270
.75%
Maso
n Cou
nty Tr
ans A
uthor
ityRu
ral
57,10
0 28
9,317
28
9,317
48
,255
0.5
$0$2
09,95
00.1
7$0
.00-
Pier
ce Tr
ansit
Urba
n75
8,510
4,54
2,494
4,
542,4
94
825,2
12
24.0
$4,31
5,981
$2,51
4,731
0.18
$5.23
58.27
%Sk
agit T
rans
itSm
Urb
an10
4,293
733,9
93
733,9
93
87,30
0 2.
0 $4
11,49
8$3
08,40
30.1
2$4
.7174
.95%
Spok
ane T
rans
it Auth
ority
Urba
n39
8,461
907,4
18
907,4
18
208,4
80
2.7
$649
,500
$556
,453
0.23
$3.12
85.67
%Va
lley T
rans
itRu
ral
50,05
4 56
,711
56,76
1 9,
638
0.2
$26,0
49$2
6,070
0.17
$2.70
100.0
8%W
hatco
m Tr
ans A
uthor
itySm
Urb
an19
5,272
664,7
62
664,7
62
99,21
7 0.
3 $2
26,92
5$2
25,12
80.1
5$2
.2999
.21%
Yakim
a Tra
nsit
Sm U
rban
91,19
6 54
5,236
54
5,236
10
1,768
1.
0 $3
30,51
7$2
25,31
00.1
9$3
.2568
.17%
Urba
nized
Total
s3,9
71,27
021
,560,9
4421
,560,9
444,7
44,25
482
.3$1
7,855
,468
$14,4
51,02
20.2
2$3
.7680
.93%
Small
Urb
anTo
tals
1,039
,223
11,15
4,859
11,16
0,087
2,479
,531
29.2
$6,90
7,530
$5,41
0,627
0.22
$2.79
78.33
%Ru
ral
Total
s45
2,301
2,824
,643
2,833
,405
521,3
725.0
$1,06
2,331
$1,24
6,190
0.18
$2.04
117.3
1%St
atew
ide V
anpo
ol To
tals
Tota
ls5,4
62,79
435
,540,4
46
35,55
4,436
7,
745,1
57
116.5
$25,8
25,32
9$2
1,107
,839
0.22
$3.33
81.73
%

Summary of Statewide Statistics
Summary of Public Transportation – 2010 Page 243 November 2011
2010
Com
mut
er R
ail S
ervic
esSy
stem
Ca
tego
ry
Serv
ice
Area
Po
pulat
ion
Reve
nue
Vehi
cle
Hour
s
Tota
l Ve
hicle
Ho
urs
Reve
nue
Vehi
cle
Miles
Tota
l Ve
hicle
Mi
lesPa
ssen
ger
Trip
sEm
ploy
ees
(FTE
)Op
erat
ing
Cost
sFa
rebo
x Re
venu
es
Pass
enge
r Tr
ips/
Reve
nue
Mile
Oper
atin
g Co
sts/
Pass
enge
r Tr
ip
Fare
box
Reco
very
Ra
tioSo
und T
rans
itUr
ban
2,734
,764
38,51
8 47
,270
1,50
6,922
1,
527,2
40
2,48
0,052
33
.9 $3
2,459
,887
$7,13
4,458
1.65
$13.0
921
.98%
Stat
ewid
e Com
mut
er R
ail To
tals
38,51
8 47
,270
1,50
6,922
1,
527,2
40
2,48
0,052
33
.9 $3
2,459
,887
$7,13
4,458
1.65
$13.0
921
.98%
2010
Lig
ht R
ail S
ervic
esSy
stem
Ca
tego
ry
Serv
ice
Area
Po
pulat
ion
Reve
nue
Vehi
cle
Hour
s
Tota
l Ve
hicle
Ho
urs
Reve
nue
Vehi
cle
Miles
Tota
l Ve
hicle
Mi
lesPa
ssen
ger
Trip
sEm
ploy
ees
(FTE
)Op
erat
ing
Cost
sFa
rebo
x Re
venu
es
Pass
enge
r Tr
ips/
Reve
nue
Mile
Oper
atin
g Co
sts/
Pass
enge
r Tr
ip
Fare
box
Reco
very
Ra
tioKi
ng C
ounty
Metr
oUr
ban
1,931
,249
11,17
8 11
,312
59,96
4 60
,248
520,9
33
16.5
$2,26
7,364
$288
,740
8.69
$4.35
12.73
%So
und T
rans
itUr
ban
2,734
,764
147,2
55
158,8
11
2,67
6,331
2,
776,1
97
7,83
1,905
20
6.6$4
4,477
,410
$9,60
8,740
2.93
$5.68
21.60
%St
atew
ide L
ight
Rail
Tota
ls15
8,433
170,1
232,7
36,29
52,8
36,44
58,3
52,83
822
3.1$4
6,744
,774
$9,89
7,480
3.05
$5.60
21.17
%So
urce
: Was
hingto
n Stat
e Tra
nsit A
ssoc
iation
and W
ashin
gton S
tate D
epar
tmen
t of T
rans
porta
tion

Summary of Statewide Statistics
Page 244 Summary of Public Transportation – 2010 November 2011
Stat
ewid
e Fi
nanc
ial S
tatis
tics
2010
Rev
enue
sSa
les o
r Lo
cal T
ax
Fare
Rev
enue
(a
ll mod
es
exce
pt va
npoo
l)Va
npoo
l Re
venu
e
Fede
ral
Oper
atin
g Re
venu
e
Stat
e Op
erat
ing
Reve
nue
Othe
r Op
erat
ing
Reve
nue
Fede
ral
Capi
tal
Reve
nue
Stat
e Ca
pita
l Re
venu
e
Loca
l Ca
pita
l Re
venu
eTo
tal R
even
ueAs
otin C
ounty
PTB
A$5
55,12
4$3
2,844
$72,1
17$5
,498
$149
,113
$4,19
6$0
$0$1
78,24
1$9
97,13
3Be
n Fra
nklin
Tran
sit$2
3,897
,058
$1,68
2,644
$2,25
3,987
$1,09
6,078
$783
,452
$172
,280
$3,37
9,391
$0$2
,006,9
07$3
5,271
,797
Clall
am Tr
ansit
Sys
tem$5
,835,7
91$6
47,97
1$1
97,39
6$1
56,34
1$5
4,595
$150
,488
$191
,027
$75,1
62$1
47,04
8$7
,455,8
19Co
lumbia
Cou
nty P
ublic
Tran
s$2
10,99
8$7
5,879
$105
,542
$179
,166
$353
,012
$161
,658
$73,0
76$5
9,409
$58,4
68$1
,277,2
08Co
mmun
ity Tr
ansit
$62,6
33,94
7$1
6,660
,295
$2,60
5,099
$8,63
6,696
$2,99
7,621
$8,63
2,259
$10,7
89,10
7$1
,857,0
70$1
3,890
,070
$128
,702,1
64Co
wlitz
Tran
sit A
uthor
ity$2
,832,2
64$1
41,33
5$0
$512
,797
$48,1
77$3
6,630
$337
,172
$0$3
,941
$3,91
2,316
C-TR
AN$2
2,008
,102
$7,13
0,453
$46,6
97$5
,236,6
49$1
,122,3
82$3
24,21
5$6
,029,1
36$0
$1,04
6,835
$42,9
44,46
9Ev
erett
Tran
sit$1
5,650
,951
$1,31
0,825
$0$0
$491
,843
$1,35
3,695
$211
,291
$802
,834
$1,92
1,389
$21,7
42,82
8Ga
rfield
Coun
ty Pu
blic T
rans
$0$3
,834
$0$4
8,302
$43,4
58$4
,538
$0$0
$0$1
00,13
2Gr
ant T
rans
it$2
,328,2
65$1
37,05
2$1
00,56
1$0
$261
,350
$228
,064
$2,98
9,592
$0$0
$6,04
4,884
Gray
s Har
bor T
rans
Auth
ority
$5,22
0,830
$642
,135
$90,4
66$4
67,11
9$7
05,30
7$3
4,736
$178
,722
$119
,043
$55,6
57$7
,514,0
15Int
ercit
y Tra
nsit
$21,1
53,07
5$2
,575,6
57$1
,367,0
99$2
,884,0
39$3
49,14
7$7
71,74
0$3
,145,5
27$1
,872,5
50$0
$34,1
18,83
4Isl
and T
rans
it$6
,384,6
29$0
$448
,231
$4,56
4$2
,939,9
25$6
2,920
$1,26
1,731
$494
,023
$505
,136
$12,1
01,15
9Je
fferso
n Tra
nsit A
uthor
ity$2
,132,0
36$1
56,18
1$6
7,974
$785
,628
$227
,895
$49,9
46$6
34,64
0$2
05,71
8$0
$4,26
0,018
King
Cou
nty M
etro
$395
,266,4
92$1
20,83
3,388
$8,72
8,042
$94,5
55,99
9$0
$10,2
08,11
6$1
4,490
,114
$0$0
$644
,082,1
51Ki
tsap T
rans
it$2
5,758
,170
$6,24
2,222
$958
,583
$0$5
09,41
5$7
61,02
5$4
,111,6
72$6
1,770
$1,72
7,808
$40,1
30,66
5Lin
k Tra
nsit
$7,46
0,242
$696
,315
$0$2
,069,9
80$2
64,43
2$5
1,734
$4,72
6,552
$0$2
30,00
0$1
5,499
,255
Maso
n Cou
nty Tr
ans A
uthor
ity$3
,168,5
63$2
94,68
6$2
09,95
0$3
36,08
3$1
,277,5
07$5
4,942
$292
,101
$0$5
20,28
0$6
,154,1
12Pa
cific T
rans
it$6
71,98
2$3
6,357
$0$2
01,56
0$5
02,32
1$6
,949
$0$0
$0$1
,419,1
69Pi
erce
Tran
sit$6
5,338
,852
$11,9
90,07
4$2
,514,7
31$8
,826,9
90$1
,098,0
10$3
,926,2
93$6
,823,9
14$4
78,62
0$1
,839,9
31$1
02,83
7,415
Pullm
an Tr
ansit
$1,08
8,968
$1,66
7,210
$0$5
50,00
0$8
9,748
$5,03
8$1
,288,2
00$3
39,00
0$5
36,31
3$5
,564,4
77Se
lah Tr
ansit
$281
,495
$0$0
$0$0
$1,72
1$0
$0$0
$283
,216
Skag
it Tra
nsit
$7,85
4,632
$390
,568
$308
,403
$1,38
7,819
$691
,487
-$10
3,781
$128
,049
$783
,729
$0$1
1,440
,906
Spok
ane T
rans
it Auth
ority
$40,5
59,09
6$8
,787,0
73$5
56,45
3$8
,422,6
24$1
,045,8
73$1
,105,7
56$4
,455,3
63$5
02,88
4$3
,331,7
74$6
8,766
,896
Twin
Tran
sit$1
,229,1
85$8
5,323
$0$0
$214
,867
$32,5
78$4
11,90
9$0
$0$1
,973,8
62Un
ion G
ap Tr
ansit
$751
,429
$0$0
$0$0
$0$0
$0$0
$751
,429
Valle
y Tra
nsit
$2,77
6,414
$264
,481
$26,0
70$6
92,80
0$1
27,74
7-$
72,75
0$1
,289,0
62$0
$102
,565
$5,20
6,389
Wha
tcom
Tran
s Auth
ority
$17,9
11,87
4$2
,323,0
42$2
25,12
8$0
$544
,447
$211
,638
$4,13
2,937
$0$1
,178,4
04$2
6,527
,470
Yakim
a Tra
nsit
$4,24
4,532
$526
,544
$225
,310
$2,07
8,584
$51,4
50$9
99,07
2$2
,097,0
00$4
7,256
$0$1
0,269
,748
Subt
otals
$745
,204,9
96$1
85,33
4,388
$21,1
07,83
9$1
39,13
5,316
$16,9
44,58
1$2
9,175
,696
$73,4
67,28
5$7
,699,0
68$2
9,280
,767
$1,24
7,349
,936
Soun
d Tra
nsit
$572
,298,0
22$3
7,589
,007
$0$5
56,04
1$0
$24,0
03,16
1$1
51,75
3,380
$11,9
62,72
1$0
$798
,162,3
32St
atew
ide R
even
ue To
tals
$1,31
7,503
,018
$222
,923,3
95$2
1,107
,839
$139
,691,3
57$1
6,944
,581
$53,1
78,85
7$2
25,22
0,665
$19,6
61,78
9$2
9,280
,767
$2,04
5,512
,268

Summary of Statewide Statistics
Summary of Public Transportation – 2010 Page 245 November 2011
2009
Ope
ratin
g an
d Ca
pita
l Exp
ense
sFi
xed
Rout
eRo
ute
Devia
ted
Dem
and
Resp
onse
Vanp
ool
Pass
enge
r Fe
rryCo
mm
uter
Ra
ilLi
ght R
ailDe
bt S
ervic
eDe
prec
iatio
nOt
her
Capi
tal
Expe
nses
Tota
l Ann
ual
Expe
nses
Asoti
n Cou
nty P
TBA
$358
,783
$0$2
91,18
8$4
5,394
$0$0
$0$0
$0$0
$178
,241
$873
,606
Ben F
rank
lin Tr
ansit
$12,7
31,14
0$0
$12,4
28,84
4$2
,959,0
89$0
$0$0
$0$3
,163,3
20$0
$5,38
6,298
$36,6
68,69
1
Clall
am Tr
ansit
Sys
tem$5
,698,7
15$0
$1,63
5,449
$194
,595
$0$0
$0$0
$900
,450
$0$4
13,23
7$8
,842,4
46
Colum
bia C
ounty
Pub
lic Tr
ans
$0$0
$788
,876
$81,0
50$0
$0$0
$0$0
$0$1
90,95
3$1
,060,8
79
Comm
unity
Tran
sit$7
9,485
,726
$0$8
,522,7
39$3
,693,7
38$0
$0$0
$190
,890
$15,6
50,18
1$1
,558,2
49$2
6,536
,247
$135
,637,7
70
Cowl
itz Tr
ansit
Auth
ority
$1,68
7,547
$0$1
,019,5
13$0
$0$0
$0$0
$79,5
00$0
$341
,113
$3,12
7,673
C-TR
AN$2
8,235
,748
$0$7
,800,9
55$9
4,926
$0$0
$0$0
$5,74
4,744
$426
,468
$7,07
5,971
$49,3
78,81
2
Ever
ett Tr
ansit
$14,2
40,79
3$0
$3,84
5,805
$0$0
$0$0
$0$2
,846,4
76$1
,457,9
40$2
,935,5
14$2
5,326
,528
Garfie
ld Co
unty
Publi
c Tra
ns$0
$0$1
03,57
4$0
$0$0
$0$0
$0$0
$0$1
03,57
4
Gran
t Tra
nsit
$793
,834
$1,78
4,322
$804
,784
$178
,049
$0$0
$0$0
$387
,175
$0$2
,989,5
92$6
,937,7
56
Gray
s Har
bor T
rans
Auth
ority
$4,04
3,109
$0$3
,050,0
65$8
6,756
$0$0
$0$0
$713
,555
$0$3
53,42
2$8
,246,9
07
Inter
city T
rans
it$2
0,466
,991
$0$5
,830,9
89$1
,579,1
99$0
$0$0
$0$4
,531,9
02$0
$5,01
8,077
$37,4
27,15
8
Islan
d Tra
nsit
$5,15
6,426
$3,16
0,390
$914
,881
$464
,552
$0$0
$0$0
$1,33
9,308
$0$2
,260,8
90$1
3,296
,447
Jeffe
rson T
rans
it Auth
ority
$1,47
2,440
$854
,711
$776
,695
$31,2
80$0
$0$0
$0$4
07,88
2$0
$840
,358
$4,38
3,366
King
Cou
nty M
etro
$445
,013,7
09$0
$56,7
13,74
7$9
,101,3
23$0
$0$2
,267,3
64$1
5,799
,163
$102
,354,4
24$0
$14,4
90,11
4$6
45,73
9,844
Kitsa
p Tra
nsit
$17,5
89,78
7$0
$7,61
4,950
$1,35
4,908
$0$0
$0$3
,369,3
26$6
,261,1
15$0
$5,90
1,250
$42,0
91,33
6
Link T
rans
it$6
,272,0
78$1
,769,0
47$1
,807,5
43$0
$0$0
$0$2
,971,0
63$1
2,763
,705
$0$4
,956,5
52$3
0,539
,988
Maso
n Cou
nty Tr
ans A
uthor
ity$0
$3,85
5,123
$2,04
9,492
$0$0
$0$0
$23,3
23,81
1$7
44,52
0$0
$812
,381
$30,7
85,32
7
Pacifi
c Tra
nsit
$832
,595
$0$5
05,98
2$0
$0$0
$0$0
$198
,702
$0$0
$1,53
7,279
Pier
ce Tr
ansit
$70,5
30,43
5$0
$17,5
97,63
9$4
,315,9
81$0
$0$0
$0$1
2,828
,624
$0$9
,142,4
65$1
14,41
5,144
Pullm
an Tr
ansit
$2,53
5,296
$0$6
41,03
7$0
$0$0
$0$0
$0$0
$2,16
3,513
$5,33
9,846
Selah
Tran
sit$1
81,27
2$0
$43,1
92$0
$0$0
$0$0
$0$0
$0$2
24,46
4
Skag
it Tra
nsit
$4,35
8,036
$0$2
,866,0
22$4
11,49
8$0
$0$0
$0$1
,373,5
62$0
$911
,778
$9,92
0,896
Spok
ane T
rans
it Auth
ority
$43,7
09,91
2$0
$12,2
35,09
1$6
49,50
0$0
$0$0
$0$6
,618,4
55$2
,594,1
48$8
,290,0
21$7
4,097
,127
Twin
Tran
sit$0
$1,40
4,515
$209
,870
$0$0
$0$0
$0$1
84,30
4$0
$411
,909
$2,21
0,598
Union
Gap
Tran
sit$2
75,25
9$0
$96,2
28$0
$0$0
$0$0
$0$0
$0$3
71,48
7
Valle
y Tra
nsit
$2,11
5,885
$209
,217
$906
,183
$26,0
49$0
$0$0
$0$5
60,31
8$0
$1,39
1,627
$5,20
9,279
Wha
tcom
Tran
s Auth
ority
$14,8
12,68
4$0
$6,08
2,945
$226
,925
$0$0
$0$0
$3,50
2,174
$0$5
,311,3
41$2
9,936
,069
Yakim
a Tra
nsit
$5,76
0,027
$0$1
,330,0
26$3
30,51
7$0
$0$0
$0$1
,063,0
54$0
$2,14
4,256
$10,6
27,88
0
Subt
otals
$788
,358,2
27$1
3,037
,325
$158
,514,3
04$2
5,825
,329
$0$0
$2,26
7,364
$45,6
54,25
3$1
84,21
7,450
$6,03
6,805
$110
,447,1
20$1
,334,3
58,17
7
Soun
d Tra
nsit
$95,4
84,58
1$0
$1,80
7,693
$0$0
$32,4
59,88
7$4
4,477
,410
$86,9
31,80
7$1
13,89
2,117
$0$1
63,71
6,101
$538
,769,5
96
Stat
ewid
e Obl
igat
ion
Tota
ls$8
83,84
2,808
$13,0
37,32
5$1
60,32
1,997
$25,8
25,32
9$0
$32,4
59,88
7$4
6,744
,774
$132
,586,0
60$2
98,10
9,567
$6,03
6,805
$274
,163,2
21$1
,873,1
27,77
3

Summary of Statewide Statistics
Page 246 Summary of Public Transportation – 2010 November 2011

Summary of Public Transportation – 2010 Page 247 November 2011
Appendix 1 Glossary
§5311(f)See Intercity Bus Program.
§5316See Job Access and Reverse Commute Program.
ADA (Americans with Disabilities Act of 1990)Federal civil rights law that assures persons with disabilities get equal opportunity to fully participate in society, the ability to live independently, and the ability to be economically sufficient.
ADA AccessibleMeeting the requirements of the Americans with Disabilities Act (ADA) of 1990 42 USC §§ 12101 et. seq. which requires facilities, vehicles, services, and certain information materials meet guidelines in order to be available to persons with disabilities.
Capital CostsThe expenses related to the purchase of equipment having a useful life of more than one year and an acquisition cost which equals the lesser of $5,000 or the capitalization level established by the government unit or the organization for financial statement purposes.
Capital ExpenseNonrecurring or infrequently recurring costs of long-term assets, such as land, guideways, stations, buildings, and vehicles. These items must have a useful life of at least one year, and are subject to depreciation and inventory records.
Contract RevenuesReimbursement by any organization, government, agency, or company, as a result of a formal contractual agreement with the transportation service operator for trips provided to a specific passenger or group of passengers.
Commuter Rail ServicePublic transportation service characterized by an electric or diesel propelled railway for urban passenger train service. Service must be operated on a regular basis consisting of local short‑distance travel operating between a central urbanized area and outlying areas.
County Transportation Authority (CTA)A municipal corporation of the state of Washington, created pursuant to Chapter 36.57 RCW. These corporations must be countywide with a board comprised of three mayors and three county commissioners.

Glossary Appendix 1
Page 248 Summary of Public Transportation – 2010 November 2011
Demand Response or Dial-a-Ride ServicePublic transportation service characterized by flexible routing and scheduling of relatively small vehicles to provide door‑to‑door or point‑to‑point transportation at the request of the passenger or their agent. Sometimes referred to as “paratransit.”
Deviated Fixed RouteTransportation service that operates along a fixed alignment or path at generally fixed times but may deviate from the route alignment to collect or drop off passengers who have requested the deviation. Sometimes referred to as “Deviated Route,” “Route Deviated,” or “Fixed Route Deviated”.
Dial-a-RideSee Demand Response.
DSHSWashington State Department of Social and Health Services
Fare Revenues/Farebox RevenuesAll income received directly from passengers, either paid in cash, token, voucher, transfer or through pre‑paid tickets, passes, etc. It includes donations from those passengers who donate money on the vehicle and the reduced fares paid by passengers in a user‑side subsidy arrangement but excludes revenue from charter services.
Farebox Recovery RatioTotal farebox revenue, plus contract service revenue, divided by total direct operating expenses.
Federal Capital AssistanceFinancial assistance from the Federal Transit Administration (FTA) to assist in paying the capital costs of providing transit service.
Federal Operating AssistanceFinancial assistance from the Federal Transit Administration (FTA) to assist in paying the operating and administrative costs of providing transportation services.
Federal Transit Administration (FTA)An agency of the United States Department of Transportation that administers federal programs of financial assistance for public transportation through the Federal Transit Act. It replaced the Urban Mass Transportation Administration (UMTA).
Fixed Route ServicePublic transportation on a repetitive, fixed schedule basis along a specific route with vehicles stopping for passengers along the way.
Full-Time Equivalent (FTE)Total employee hours divided by 2,080 hours. This is not the number of employees. For example, two employees each working halftime, or 1,040 hours in a year, would be counted as one FTE.

Appendix 1 Glossary
Summary of Public Transportation – 2010 Page 249 November 2011
Health and Recovery Services Administration (HRSA)A program of the Department of Social and Health Services (DSHS) which provides access to health care and recovery services for Washington’s most vulnerable residents. Prior to 2006, this program was called the Medical Assistance Administration (MAA).
HRSASee Health and Recovery Services Administration.
IntercityRegularly scheduled general public bus service operating with limited fixed route stops connecting two or more urban areas at least 20 miles apart or connecting rural communities to an urban area at least 20 miles away. Intercity service has the capacity for transporting baggage carried by passengers and makes meaningful connections with other scheduled intercity bus service to more distant points.
Intercity Bus Program 49 USC §5311(f)Federal grant program that provides formula funding to states for the purpose of supporting intercity services.
Job Access and Reverse Commute (JARC; §5316)A federal source of funding authorized through federal transportation legislation, (SAFETEA LU, Section 5316) that is used to fund public transportation projects that work towards improving job access (including job related services such as training and daycare) for low‑income persons and welfare recipients, and improving transportation to suburban employment centers from urban, rural, and suburban areas.
Light Rail ServiceA passenger railway system characterized by its ability to operate single cars or short trains along rails on exclusive right of way.
Local Capital FundsFinancial assistance from local entities to assist in paying capital. They can include, but are not limited to, tax levies, general funds, specified contributions, reserve funds, and donations.
Local Operating FundsFinancial assistance from local entities that support transit system operation. They can include, but are not limited to, tax levies, general funds, specified contributions, donations, and reserve funds.
MAAMedical Assistance Administration. See Health and Recovery Services Administration.
Major Capital Investments (New Starts & Small Starts) 49 USC §5309Federal grant program that provides capital assistance for new and replacement buses and related equipment and facilities.

Glossary Appendix 1
Page 250 Summary of Public Transportation – 2010 November 2011
MedicaidA federal entitlement program that pays for basic health care services for low‑income individuals and long‑term care for elders and people with disabilities. States administer their own Medicaid programs and establish their own eligibility standards, benefits packages, payment rates, and rules consistent with federal requirements.
Medicaid Brokerage RegionThe Health and Recovery Services Administration (HRSA) divides Washington State into thirteen transportation service regions and contracts with a network of brokers to arrange non-emergency medical transportation (NEMT) for eligible Medicaid clients.
Region 1: Island, San Juan, Skagit, Whatcom CountiesRegion 2: Snohomish CountyRegion 3: King CountyRegion 4: Pierce CountyRegion 5: Clallam, Jefferson, Kitsap, and north Mason CountiesRegion 6: Grays Harbor, Lewis, south Mason, Pacific, and Thurston CountiesRegion 7: Clark, Cowlitz, Klickitat, Skamania, and Wahkiakum CountiesRegion 8: Benton, Columbia, Franklin, Kittitas, Walla Walla, and Yakima CountiesRegion 9: Chelan, Douglas, and Okanogan CountiesRegion 10: Ferry, Pend Oreille, and Stevens CountiesRegion 11: Adams, Grant, and Lincoln CountiesRegion 12: Spokane CountyRegion 13: Asotin, Garfield, and Whitman Counties
Medical Assistance Administration (MAA)See Health and Recovery Services Administration.
Metropolitan Planning Organization (MPO)Federal legislation created Metropolitan Planning Organizations (MPOs). An MPO covers an urbanized area and receives federal funding in support of its planning efforts. It is the area‑wide agency responsible for conducting coordinated urbanized transportation planning consistent with state rules and federal legislation. Together with WSDOT, it carries out the planning and programming activities necessary for federal funding.
NEMTSee Non-Emergency Medical Transportation.
Non-Emergency Medical Transportation (NEMT)Transportation for healthcare purposes (e.g. routine medical appointments, dental care, preventive services) that excludes unforeseen, emergency transportation.

Appendix 1 Glossary
Summary of Public Transportation – 2010 Page 251 November 2011
Operating and Administrative ExpensesThe recurring costs of providing public transportation service. They include: all employees’ wages and salaries; fringe benefits; operating supplies such as fuel and oil; contractor service charges; taxes; repair and maintenance, parts and supplies; equipment leases and rentals; marketing; lease or rental costs; insurance; and administrative expenses. Operating and administrative expenses exclude costs of providing transportation services not available to the general public, interest paid on loans on capital equipment, and fixed costs such as depreciation on facilities and equipment.
Other Annual RevenueRevenue earned by activities not associated with the system’s services, such as maintenance service, vehicle and building rental, non‑transit parking lots, advertising space, sales, and investment income.
ParatransitFlexible public transportation services not provided on a fixed route or fixed schedule required by federal law. Transit agencies must provide complimentary services for people with disabilities who are not able to use fixed route services. The service must operate in the same general areas and during the same hours. The fare is limited to twice the fixed route fare. The transit agency can provide the service themselves or contract with a separate agency. They do not include exclusory services such charter bus trips. Sometimes referred to as “demand response” or “dial‑a‑ride.”
ParaTransit/Special Needs Competitive or Formula FundsWashington State grant program that supports public transportation for persons who, because of their age (youth or seniors), disabilities, or income status are unable to provide or purchase their own transportation.
Passenger Ferry ServicePublic transportation service comprised of vessels carrying passengers and/or vehicles over a body of water.
Passenger TripOne person making a one‑way trip from origin to destination. If the person transfers to another vehicle or travel mode en route to the final destination, that is considered another trip. One round trip is two passenger trips. One round trip on two buses each way is four passenger trips.
Public TransportationTransportation service that is available to any person upon payment of the fare—if charged—and which cannot be reserved for the private or exclusive use of one individual or group. “Public” in this sense refers to the access to the service, not to the ownership of the system providing the service.
Public Transportation Benefit Area (PTBA)A municipal corporation of Washington State, created pursuant to Chapter 36.57A RCW. These benfit areas may be less than countywide, countywide, or comprise more than one county.

Glossary Appendix 1
Page 252 Summary of Public Transportation – 2010 November 2011
MVET (Motor Vehicle Excise Tax)Sound Transit is authorized by the state to impose voter‑approved taxes to plan, build and operate the regional mass transit system. These taxes include; a sales and use tax and a 0.3 percent MVET “car tab” tax. These taxes, collected by the Department of Licensing, are levied only in the Sound Transit Regional Transit District.
Retired Senior Volunteer Program (RSVP)A Corporation for National and Community Service program which matches the personal interests and skills of older Americans with opportunities to serve their communities.
Revenue Vehicle HourThe measurement in hours that a public transportation system operates each vehicle in fixed route services (not including time to or from the assigned route), or makes demand response services available for public use.
Revenue Vehicle MileThe measurement in miles that a public transportation system operates each vehicle (not including the distance to or from the assigned route).
Regional Transportation Planning Organization (RTPO)State legislation created RTPOs. An RTPO covers both urban and rural areas and receives state funding to support its planning efforts.
Rural and Small Urban Areas 49 USC §5311Federal grant program that provides formula funding to states for the purpose of supporting public transportation in areas with populations of 50,000 people or less. See also Section 5311.
Rural AreasIncorporated and unincorporated communities and unincorporated areas in a county outside of a designated urbanized area. Total area population may exceed 50,000.
Rural Mobility CompetitiveWashington State grant program that supports projects to improve transportation in rural areas where public transportation is limited or does not exist.
Section 5307A Federal Transit Act section authorizing formula funding for public transportation in urbanized areas, and codified as 49 USC 5307.
Section 5309A Federal Transit Act section authorizing discretionary and formula funding for capital purposes, and codified as 49 USC 5309.
Section 5310See Transportation for Elderly Persons and Persons with Disabilities 49 USC §5310.

Appendix 1 Glossary
Summary of Public Transportation – 2010 Page 253 November 2011
Section 5311A Federal Transit Act section authorizing public transportation funding in rural areas, and codified as 49 USC 5311.
Section 5316See Job Access and Reverse Commute (JARC; §5316).
Section 5317 (New Freedom Program)A section of the Federal Transit Act authorizing funding for new public transportation services and public transportation alternatives beyond those required by the Americans with Disabilities Act of 1990 (ADA) and codified as 49 U.S.C. 5317.The New Freedom Program grants are awarded for projects that assist people with disabilities with transportation, including transportation to and from jobs and employment support services.
State Capital AssistanceFinancial assistance from any state agency to assist in paying capital costs.
State Operating AssistanceFinancial assistance from any state agency supporting transportation system operation. It includes, but is not limited to tax levies, general funds, and specified contributions.
TANFSee Temporary Assistance for Needy Families.
Temporary Assistance for Needy FamiliesThe federal government’s primary welfare program.
Total Vehicle HourThe measurement in hours that a public transportation system operates each vehicle including revenue and non‑revenue hours.
Total Vehicle MileThe measurement in miles that a public transportation system operates each vehicle including the revenue and non‑revenue miles.
Transportation for Elderly Persons and Persons with Disabilities 49 USC §5310Federal grant program that provides formula funding to states to assist private non-profit groups in meeting the transportation needs of the elderly and persons with disabilities when no transportation services are available or those provided are insufficient or inappropriate in meeting these needs.
Unincorporated Transportation Benefit Areas (UTBA)A Washington State municipal corporation created pursuant to Chapter 36.57.110 RCW. These corporations are authorized to create and define the boundaries of unincorporated transportation benefit areas in the unincorporated areas of the county.

Glossary Appendix 1
Page 254 Summary of Public Transportation – 2010 November 2011
Urbanized AreaA geographic area defined by the U.S. Census Bureau with a central city plus the losely‑settled urban fringe that together have a minimum population of 50,000. Small urbanized areas have populations between 50,000 and 200,000; large urbanized areas have populations greater than 200,000.
VanpoolA prearranged ridesharing service in which a number of people (7 to 15) travel together regularly in a van, particularly to and from work.
WorkFirstWashington State’s welfare reform program which helps financially struggling families find jobs, get better jobs, and stay employed.
WorkSourceA joint venture of organizations working to address Washington State’s employment needs.
WSDOTWashington State Department of Transportation.

Summary of Public Transportation – 2010 Page 255 November 2011
Appendix 2 Public Transportation Grant Awards
The Washington State Department of Transportation (WSDOT) awarded public transportation grants for 110 projects totaling more than $37 million for the 2009–2011 biennium.
These grants improve public transportation within and between rural communities, provide transportation services between cities, purchase new buses and other equipment, and provide public transportation service for the elderly and persons with disabilities.
The grantees competed for state and Federal Transit Administration (FTA) funds which are administered through state Rural Mobility and Paratransit/Special Needs Non-Profit grants, and federal Rural Mobility, Special Needs, Job Access and New Freedom grants. Over the biennium, state funds of $14 million will be matched with approximately $23 million in federal funds.
As the project list below illustrates, the competitive grant funds were awarded across Washington. WSDOT awarded these grants to transportation providers including transit agencies, non-profit agencies, tribal transportation, and senior services.
Organization Name County(s) Served Project Description Award
Ben Franklin Transit Benton and Franklin Provide dial-a-ride services to ADA-eligible persons residing outside current service boundaries .
$35,500
Ben Franklin Transit Benton and Franklin Develop and implement an in-house travel training program to better serve persons with special needs .
$75,000
Career Path Service Stevens Replace one wheelchair-accessible minivan equipped with two wheelchair stations, a manual ramp, and snow tires .
$30,800
Catholic Community Services
Pierce Reimburse volunteer drivers who provide special needs transportation .
$96,388
Clallam Transit System Clallam Provide bus services between Port Angeles and Forks .
$300,000
Coastal Community Action Program
Grays Harbor Purchase two minivans to provide dial-a-ride services to low-income individuals for employment and education-related purposes .
$60,704
Coastal Community Action Program
Grays Harbor Provide dial-a-ride services to low-income individuals for employment and education-related purposes .
$460,134
Columbia County Public Transportation
Columbia and Walla Walla
Provide dial-a-ride services that make connections to neighboring communities .
$938,220

Public Transportation Grant Awards Appendix 2
Page 256 Summary of Public Transportation – 2010 November 2011
Organization Name County(s) Served Project Description Award
Council on Aging & Human Services-COAST
Whitman Replace one wheelchair-accessible minivan for special needs transportation services .
$32,000
Council on Aging & Human Services-COAST
Whitman, Asotin, and Garfield
Provide special needs transportation services .
$550,000
Cowlitz Indian Tribe Lewis and Cowlitz Replace one wheelchair-accessible van for dial-a-ride services in south Lewis and north Cowlitz Counties .
$50,000
Cowlitz Indian Tribe Lewis and Cowlitz Provide dial-a-ride services in south Lewis and north Cowlitz Counties .
$146,625
Ephrata Senior Center Grant Replace one cutaway minibus for services to elderly persons in the Ephrata area .
$62,000
Garfield County Public Transportation
Garfield Provide dial-a-ride services . $166,650
Grant Transit Authority Grant Replace four bus shelters . $21,600
Grant Transit Authority Grant and Adams Provide bus services for employment-related purposes between Moses Lake and the Warden and Othello processing plants .
$150,610
Grays Harbor Transit Authority
Grays Harbor Provide bus services in the Quinault area .
$407,754
Grays Harbor Transit Authority
Grays Harbor Provide bus services in the North and South Beach areas .
$738,426
Hopelink King Purchase nine wheelchair-accessible minibuses and nine other minibuses on behalf of other non-profit transportation service providers in the area .
$471,564
HopeSource Kittitas Purchase one van to provide dial-a-ride services .
$50,000
HopeSource Kittitas Provide bus services to the general public in Ellensburg .
$187,500
HopeSource Kittitas Provide dial-a-ride and bus services to the general public and persons with special needs .
$1,087,283
Human Services Council Clark Provide brokered transportation services to elderly persons and persons with disabilities who do not qualify for Medicaid or for complementary ADA services .
$247,500

Appendix 2 Public Transportation Grant Awards
Summary of Public Transportation – 2010 Page 257 November 2011
Organization Name County(s) Served Project Description Award
Human Services Council Cowlitz and Wahkiakum Provide brokered transportation services to elderly persons and persons with disabilities who do not qualify for Medicaid or complementary ADA services .
$361,312
Human Services Council Clark Provide brokered transportation services to low-income individuals for employment-related purposes .
$474,375
Intercity Transit Thurston Provide dial-a-ride services to low-income individuals for employment-related purposes throughout the Olympia, Lacey, and Tumwater urbanized area .
$247,019
Island Transit Island Replace four 40ft transit coaches for rural transportation services .
$1,226,272
Jefferson Transit Authority
Jefferson Replace two 30ft transit coaches and two cutaway minibuses for services to the general public .
$205,718
Jefferson Transit Authority
Jefferson, Clallam, and Grays Harbor
Provide bus services to communities located in west Jefferson County . Provide connections with Clallam Transit in Forks and Grays Harbor Transit in Amanda Park .
$311,250
Jefferson Transit Authority
Jefferson Provide dial-a-ride and bus services in east Jefferson County .
$1,330,000
Kalispel Tribe of Indians Spokane and Pend Oreille
Provide bus services to low-income individuals for employment-related purposes between the communities of Spokane/Airway Heights, Usk, Cusick, and the Kalispel Nation Reservation .
$62,084
Klickitat County Senior Services
Klickitat Purchase two wheelchair-accessible minivans for dial-a-ride services .
$56,000
Klickitat County Senior Services
Klickitat Provide dial-a-ride and bus services to the general public and persons with special needs .
$885,468
Link Transit Chelan and Douglas Facilitate mobility coordination activities that support services for elderly persons and persons with disabilities .
$102,170
Link Transit Chelan Provide bus services that connect the rural communities of Leavenworth and Plain/Lake Wenatchee . Provide dial-a-ride services to the general public in the Leavenworth area .
$116,651

Public Transportation Grant Awards Appendix 2
Page 258 Summary of Public Transportation – 2010 November 2011
Organization Name County(s) Served Project Description Award
Link Transit Chelan Provide commuter services between Wenatchee, Leavenworth, and Chelan .
$285,000
Link Transit Chelan and Douglas Provide bus services that link communities along both sides of the Columbia River between Chelan and Wenatchee .
$300,000
Link Transit Chelan and Douglas Provide bus services to low-income neighborhoods within the urbanized area to ensure ongoing access to employment-related destinations and to regional transit services .
$450,000
Lower Columbia CAP Cowlitz and Wahkiakum Replace one wheelchair-accessible minibus for services provided to elderly persons and Medicaid clients .
$40,000
Lower Columbia CAP Thurston, Lewis, Cowlitz, and Clark
Replace one wheelchair-accessible minibus for bus services for the general public along the I-5 corridor between Vancouver and Olympia .
$44,000
Lower Columbia CAP Thurston, Lewis, Cowlitz, and Clark
Provide bus services to the general public between communities along the I-5 corridor between Vancouver and Olympia .
$586,960
Lummi Indian Business Council (LIBC)
Whatcom Provide public transportation to the general public of the Lummi Tribal Nation .
$314,249
Makah Tribal Council Clallam Provide bus services to the general public of the Makah Tribal Nation .
$141,386
Mason County Transportation Authority
Mason Provide bus services between Shelton, Lower Hood Canal, Arcadia, and the Agate/Hartsine areas of Mason County as contracted with the Shelton School District .
$207,170
Mason County Transportation Authority
Mason Replace three 35-foot transit coaches for bus services .
$900,000
Mason County Transportation Authority
Mason Provide dial-a-ride services to persons with special needs and the general public .
$938,450
Mason County Transportation Authority
Mason Provide bus services that make connections to transit services in adjacent counties .
$944,848
Mid-Columbia Economic Development District
Skamania and Klickitat Coordinate with transportation providers in the Mid-Columbia region of Washington and Oregon through the mobility manager .
$88,000

Appendix 2 Public Transportation Grant Awards
Summary of Public Transportation – 2010 Page 259 November 2011
Organization Name County(s) Served Project Description Award
Mt . Si Senior Center King Provide dial-a-ride services for persons with special needs in rural communities .
$480,549
Northshore Senior Center
King and Snohomish Provide dial-a-ride services to elderly persons and persons with disabilities in communities of north King and south Snohomish Counties .
$75,000
Okanogan County Transportation & Nutrition (OCTN)
Okanogan Provide shuttle services to the general public between Okanogan and Omak .
$65,050
Okanogan County Transportation & Nutrition (OCTN)
Okanogan Provide commuter services that run between Omak and the Colville Indian Agency and are provided to low-income and special needs individuals for employment-related purposes .
$73,848
Okanogan County Transportation & Nutrition (OCTN)
Okanogan Replace two wheelchair-accessible minibuses for services to the general public and persons with speical needs . Purchase snow tires, safety steps, and 20 bus stop signs .
$138,382
Okanogan County Transportation & Nutrition (OCTN)
Okanogan and Douglas Provide commuter services to low-income and special needs individuals for employment-related purposes .
$180,996
Okanogan County Transportation & Nutrition (OCTN)
Okanogan and Douglas Provide dial-a-ride services to the general public and persons with special needs in Okanogan County and rural communities in northern Douglas County .
$459,570
Olympic Community Action Program
Clallam and Jefferson Provide vanpool services to low-income individuals .
$147,613
Pacific Transit Pacific Replace one 30ft, wheelchair-accessible transit coach for services to the general public .
$288,000
Pacific Transit Pacific Provide bus and dial-a-ride services that connect to transit services in Astoria, Oregon .
$1,046,250
Paratransit Services Clallam Replace two wheelchair-accessible minivans for dial-a-ride services .
$75,200
Paratransit Services Clallam Replace six wheelchair-accessible minibuses for dial-a-ride services .
$264,000
People for People Yakima Provide dial-a-ride services to elderly persons and persons with disabilities .
$77,324

Public Transportation Grant Awards Appendix 2
Page 260 Summary of Public Transportation – 2010 November 2011
Organization Name County(s) Served Project Description Award
People for People Yakima Establish a mobility management program to coordinate special needs transportation, provide community outreach, and identify transportation resources and needs .
$100,530
People for People Adams, Lincoln, and Grant
Provide dial-a-ride and bus services to the general public and persons with special needs .
$171,351
People for People Yakima Purchase one wheelchair-accessible truck chassis cutaway minibus for bus services for the Pahto Public Passage in the Yakama Tribal Nation .
$250,453
People for People Adams, Lincoln, and Grant
Provide commuter services to low-income individuals for employment-related purposes between Othello and Moses Lake, and between Grand Coulee and Davenport .
$333,605
People for People Yakima and Benton Provide bus services that connect communities along I-82 between Prosser and Yakima .
$392,927
People for People Yakima Replace six wheelchair-accessible van chassis cutaway minibuses for dial-a-ride services and one wheelchair-accessible truck chassis cutaway minibus equipped with a security camera for bus services .
$486,387
People for People Adams, Lincoln, and Grant
Provide dial-a-ride and bus services to the general public and persons with special needs .
$781,074
People for People Yakima Provide dial-a-ride services to low-income individuals for employment-related purposes .
$808,197
People for People Yakima Provide dial-a-ride services to elderly persons and persons with disabilities .
$1,174,301
Pierce County Department of Community Services
Pierce Provide dial-a-ride services to people with special needs living in rural areas to connect them with Pierce Transit .
$234,366
Puget Sound Educational Services District
Pierce and King Provide driver training for people with low incomes who, in turn, provide transportation to people with special needs .
$196,000
Pullman Transit Whitman Replace four 40-foot and one 35-foot transit coaches for bus services for the general public in Pullman .
$339,000

Appendix 2 Public Transportation Grant Awards
Summary of Public Transportation – 2010 Page 261 November 2011
Organization Name County(s) Served Project Description Award
Pullman Transit Whitman Provide dial-a-ride and bus services to the general public in Pullman .
$1,100,000
Rural Resources Community Action
Stevens Provide commuter services to the general public .
$234,048
Rural Resources Community Action
Ferry, Stevens, and Pend Oreille
Provide dial-a-ride services . $833,590
Senior Services of King County
King Provide dial-a-ride services with paid and volunteer drivers to elderly persons and persons with disabilities .
$518,609
Senior Services of Snohomish County
Snohomish Provide bus services to people with special needs in rural areas .
$721,688
Skagit Transit Skagit Provide dial-a-ride services to persons with disabilities in rural areas beyond ADA service boundaries .
$45,760
Skagit Transit Skagit Purchase one minibus equipped with a bicycle rack for services in Anacortes .
$94,952
Skagit Transit Skagit Provide dial-a-ride services to persons with disabilities in rural areas beyond ADA service boundaries .
$151,488
Skagit Transit Skagit Provide new bus service to increase the frequency of transit services in Anacortes .
$185,328
Skagit Transit Skagit Provide bus services, including Sunday service, to enhance employment-related transportation in Mount Vernon, Burlington, and Sedro Woolley .
$195,000
Skagit Transit Skagit Purchase one 30- to 40-foot bus equipped with a bicycle rack .
$314,550
Skamania County Senior Services
Skamania Replace one wheelchair-accessible minibus and one wheelchair-accessible van for dial-a-ride services .
$101,864
Skamania County Senior Services
Skamania and Clark Provide bus services along State Route 14 between Carson and Fishers Landing in Vancouver .
$239,119
Skamania County Senior Services
Skamania Provide dial-a-ride services to persons with special needs .
$314,543
Special Mobility Services, Inc
Spokane Provide dial-a-ride services in north Spokane County and northern areas of the city of Spokane outside the current transit service boundaries .
$128,234

Public Transportation Grant Awards Appendix 2
Page 262 Summary of Public Transportation – 2010 November 2011
Organization Name County(s) Served Project Description Award
Special Mobility Services, Inc
Spokane and Pend Oreille
Provide bus services to the general public between Newport and the city of Spokane .
$159,543
Special Mobility Services, Inc
Spokane, Lincoln, and Adams
Provide bus services to the general public between Davenport and Spokane, and between Ritzville and Spokane .
$160,323
Special Mobility Services, Inc
Spokane Provide dial-a-ride services in north Spokane County and northern areas of the city of Spokane outside the current service boundaries .
$252,464
Spokane Tribe of Indians Stevens Establish and operate a public transit pilot project providing bus services to residents in and around the Spokane Tribal Nation .
$106,053
Spokane Tribe of Indians Stevens Purchase two wheelchair-accessible minibuses for a pilot project providing transportation services to residents on and around the Spokane Tribal Nation .
$120,000
Squaxin Island Tribe Mason, Grays Harbor, and Thurston
Provide dial-a-ride and bus services to the general public between Kamilche, Steamboat Island Road, and the Elma/McCleary area .
$133,780
Stillaguamish Tribe Transit Services (STTS)
Snohomish Provide dial-a-ride services to rural areas of north Snohomish County .
$178,997
TOGETHER! Thurston, Grays Harbor, Lewis, and Mason
Provide dial-a-ride services to special needs populations in unserved and underserved areas .
$1,309,000
Trancare Chelan, Douglas, and Okanogan
Purchase one wheelchair-accessible minivan equipped with a ramp to provide Medicaid transportation services .
$47,425
Twin Transit Lewis Replace one minibus for bus services in Centralia and Chehalis .
$146,880
Twin Transit Lewis Provide dial-a-ride and bus services to persons with special needs and the general public of Centralia and Chehalis .
$273,496
Twin Transit Lewis Replace one wheelchair-accessible minibus for bus services in Centralia and Chehalis .
$76,800
Valley Transit Walla Walla Provide dial-a-ride, bus, and vanpool services to the general public and persons with special needs .
$1,250,000

Appendix 2 Public Transportation Grant Awards
Summary of Public Transportation – 2010 Page 263 November 2011
Organization Name County(s) Served Project Description Award
Wahkiakum County Health and Human Resources
Wahkiakum Purchase two minibuses for services to the general public and persons with special needs .
$50,902
Wahkiakum County Health and Human Resources
Wahkiakum Provide bus services to the general public and persons with special needs .
$341,306
Whatcom Council of Governments
Whatcom Use mobility management to expand community outreach to include seniors, special needs travelers, and their families in order to inform them about transportation options in the area .
$150,000
Whatcom Transportation Authority
Whatcom Replace nine wheelchair-accessible buses for complementary paratransit and safety net services .
$698,544
White Pass Community Services Coalition dba L .E .W .I .S . Mountain Highway Transit
Lewis Provide bus services that connect rural communities in east Lewis County .
$609,804
Yakama Nation Yakima Facilitate mobility management activities including marketing, outreach, and coordination of transportation services for the Yakama Tribal Nation .
$127,795
Yakima Transit Yakima Purchase two wheelchair-accessible minibuses for dial-a-ride services provided to persons with disabilities in the city of Yakima .
$96,000
Yakima Transit Yakima Increase the amount of service hours provided in the city of Yakima through dial-a-ride and bus services .
$131,025
Total $37,223,517

Public Transportation Grant Awards Appendix 2
Page 264 Summary of Public Transportation – 2010 November 2011
Regional Mobility Grant Program 2009-2011 Budget
Budget Cycle Lead Agency Project Title Committed2005-07 Intercity Transit Martin Way $377,8082005-07 KCM Seattle North CBD $1,195,0002005-07 KCM Brickyard $1,242,1492007-09 Sound Transit Mt . Lake Terrace Fwy $2,500,0002007-09 Sound Transit Sounder Parking $3,600,0002007-09 Shoreline Aurora BAT 165-185 $2,500,0002007-09 KCM Pac Hwy So $1,798,1602007-09 Kitsap Transit Harper $1,561,6962007-09 Everett Transit Swift BRT Evtt Term $1,050,6512007-09 Skagit Transit Chuckanut $1,805,0252007-09 SDOT Pike/Pine/Westlake $1,374,9022007-09 KCM SE King Co . Connectors $1,463,9812009-11 KCM Route 120 $2,233,0002009-11 Community Swift BRT Ops $2,500,0002009-11 Community Double Deckers $2,880,0002009-11 Sound Transit D to M $8,000,0002009-11 Shoreline Aurora Bat 185-192 $1,000,0002009-11 Clark County Salmon Creek $2,900,0002009-11 Intercity Transit Hawks Prairie $3,038,7842009-11 Skagit Transit So . Mt . Vernon P&R $750,0002009-11 Pierce transit Pac Ave TSP $1,803,6502009-11 C-Tran I-5 Express $578,4962009-11 Everett Transit Evergreen Swift Stations $3,630,0002009-11 Federal Way Pac Hwy So Phase IV $1,300,0002009-11 Island transit Everett Connector $1,624,0002009-11 KCM Central Eastside $2,033,6162009-11 City of Seattle Rainier/Jackson $4,000,0002009-11 Sound Transit Expansion Sno to King Co . $4,496,7682009-11 City of Bothell SR 522 stage 2A $2,100,000
Projects Total Award $65,337,686

Summary of Public Transportation – 2010 Page 265 November 2011
Appendix 3 Summary of Public Transportation Notes
Historically, there was considerable data and reporting overlap between the Summary of Public Transportation, Transit Development Plans (TDP), and the reporting required by FTA in the National Transportation Database (NTD). In addition, the due dates for the required reporting were not aligned in a way that allowed a seamless data collection and reporting process.
In April 2008, David Evans and Associates, Inc. prepared a report for WSDOT titled, Cost Allocation and Reporting Project, in an effort to understand and improve the comparability of transit agency cost data submissions. The report had several objectives:
1. Develop an understanding of the cost allocation methods used by the state’s public transit agencies.
2. Understand the impact of cost allocation methods on the prepared and submitted transit agency reports.
3. Identify opportunities for developing more uniformity in cost allocation methods.
One of the concerns raised by the interviewed transit agencies relates to the conflicting submission schedules for various required reports. The other major concern was non-standard cost allocation practices.
Report recommendations for addressing these concerns included: a series of guiding principles for cost allocation discussions; and reporting date realignment not governed by federal requirements (see the Reporting Timeline Comparison 2007 and 2010 chart in this section). In addition, the report suggested that an online system would better facilitate data collection.
The 2008 (published in Nov. 2010) and 2009 (published in Jan. 2011) summary reports were produced as Transit Data Updates. These updates were based on the 2007 Summary of Public Transportation appendices tables containing Statewide Operations data, Statewide Operating Statistics and Statewide Financial Statistics summaries. During this time, efforts were made to better align the reporting dates and to refine how the financial and operational data is reported. The following outlines the data collection changes that took place during the 2008 and 2009 publication period.
1Required by RCW 35.58.2795. 2Required by 49 USC 5335(a).

Summary of Public Transportation Note Appendix 3
Page 266 Summary of Public Transportation – 2010 November 2011
Changes to the data collection process:
• 2007 Access Database was utilized once the data was collected from the transit systems.
– The process included several data collection forms filled out by the transits.
– Modifications to the database had to occur yearly to accommodate new datasets.
– FTA began to require that Sound Transit, Community Transit, King County METRO, and Pierce Transit start to report their data sets differently to the NTD.
* Sound Transit was to report the METRO and Pierce Transit provided fixed route service as Directly Operated. According to FTA rules, a Government‑ to‑Government contract should be regarded as Directly Operated.
* Sound Transit was to report the Community Transit provided fixed route as Purchased Transportation, because Community Transit purchases the service from First Transit. In this instance, the Government‑to‑Government rule doesn’t apply because the entity providing the service is a sub‑contractor.
• 2008 and 2009 data was processed through a series of workbook spreadsheets developed initially based on summary tables from the 2007 Summary of Public Transportation appendices.
– Data irregularities were easier to identify, but time consuming to correct.
– Requested data definitions began to transition towards the more uniform NTD definitions.
– “Other” data was no longer allowed without some explanation or discussion.
– Some transits were able to start reporting Purchased Transportation separately from Directly Operated Transportation because they were reporting it separately to the NTD that way. This data was then rolled together to match the 2007 reporting.
• FTA requested Sound Transit to report the new Light Rail line operated by King County METRO as Purchased Transportation. This was an exception to the Government‑to‑Government rule because of the characteristic differences between the two Light Rail services.
• 2010 data was collected using an online reporting form.
– Transit operators were asked to report Purchased Transportation and Direct Operated Transportation separately for all modes to align better with the already established NTD reporting.
* Previous years reporting asked for data by mode only. For example, Fixed Route information for Purchased Transportation was added to Directly Operated and presented as a single Fixed Route data set.
* The separation between Purchased Transportation and Directly Operated Transportation will allow for a better statewide data analysis.

Appendix 3 Summary of Public Transportation Note
Summary of Public Transportation – 2010 Page 267 November 2011
– Passenger Ferry data, reported by Kitsap Transit as part of the main Summary of Public Transportation document, moved to the Statewide Ferry Operations section.
As a result of the 2011 Regular Legislative Session, House Bill 1967 was signed into law on May 16, 2011 amending RCW 35.58.2795 and 35.58.2796 as well as adding a new section to chapter 43.19 RCW. The deadlines that govern the TDPs, NTD reporting and the Summary of Public Transportation were better aligned to streamline the process for reporting agencies and WSDOT.
For the 2010 calendar year, WSDOT created an on‑line collection form to gather data from the 30 public transit providers statewide. This was done for several reasons:
1. To combine previously separated data collection efforts (e.g., system snapshot, operational and financial tables)
2. To efficiently collect 2010 data 2010 – the previous Access database did not function without data from all calendar years (2008 and 2009 were collected using Excel workbooks).
3. To construct the online form to provide a base application platform to develop a comprehensive, user‑friendly online reporting system allowing transit representatives to enter their data directly into a software independent central database application.

Summary of Public Transportation Note Appendix 3
Page 268 Summary of Public Transportation – 2010 November 2011
Reporting Timeline Comparison 2007 & 2010
2007 2010
Previous year financial processing1/1 – 4/30
Previous year financial processing1/1 – 4/30
TDP due4/1
TDP due10/31
Begin PT Sum data collection process
5/1
Urban and Sm Urban NTD data submittal due
4/30
NTD data submittal due(Urban, Sm Urban & Rural)
4/30
AFR due5/31
NTD Rural data due
10/31
PT Summary published
by 9/1
NTD exception reporting complete
6/30
Jan
Feb
Mar
Apr
May
July
Jun
Aug
Sep
Oct
Nov
Dec
NTD exception reporting complete
6/30
PT Summary publishedby 12/1
AFR due5/31
Recommended