1
Summary of Fy2009 Feasibility Study on CDM/JI Project Title: Biogas Power Generation and Biocompost Production Project at Sugar Mill and Bio-ethanol Factory in
Thailand Main Implementing Entity: Tohoku Electric Power Co., Inc. FS Partners:
- Mitsubishi UFJ Securities Co., Ltd. (Assistance in preparation of PDD, co-benefit analysis and follow-up on initial validation)
1. Outline of the project
This project is biogas biogas-based power generation (10 MW) by reusing organic wastewater generated at an ethanol plant in Thailand. Technologies employed are production of biogas by anaerobic digester for organic wastewater from the ethanol plant in which molasses from a sugar mill adjacent to the ethanol factory are used as law material of ethanol, and electric power production by using the wastewater based biogas.
The sugar mill supplies molasses, a residue remaining after pressing sugar cane to extract its juice, to the adjacent ethanol plant as a raw material for ethanol. Greenhouse gas emissions are expected to be reduced by approximately 200,000 t-CO2/year. A project development company in Thailand is responsible for developing this project, aiming to start operating the facility in the first quarter of 2011.
Original plan aimed to achieve two plans—biogas-based power generation (10 MW) and the production of organic fertilizer (90,000 tons/year)—in an integrated facility by reusing organic wastewater and organic solid wastes generated at the ethanol plant and the sugar mill with integration of following facility two facilities:
1) Biogas production and power generation facility: Biogas will be produced from organic wastewater, and used to generate 10 MW of electricity.
2) Composting facility: 90,000 tons of biocompost (organic fertilizer) will be produced each year. At the biogas production facility, organic wastewater generated at an ethanol plant will be
decomposed to produce biogas. Biogas will then be used as fuel in gas engines with a total capacity of 10 MW to generate electricity. Approximately 8 MW of the electricity generated will be sold to the Provincial Electricity Authority (PEA) in Thailand.
At the composting facility, filter cake, an organic solid waste from the sugar mill located adjacent to the ethanol plant, and treated effluent from the biogas facility will be mixed to produce biocompost. The biocompost produced will be sold to the sugar mill and supplied to the mill’s contract plantations.
This project intended to utilize a combination of two technologies: biogas power generation
technology by utilizing molasses, a byproduct generated at the sugar mill, as fuel; and technology for composting solid wastes. Specifically, the two technologies are:
1) A technology for recovering methane gas from organic wastewater by means of anaerobic digestion, and using the gas as fuel for generating electricity; and
2) A technology for mixing filter cake, an unused organic solid waste from the sugar mill, and wastewater treated in 1) above to produce biocompost
Technology 2 enables filter cake and treated effluent to be mixed in an anaerobic environment that allows digesting bacteria to thrive and accelerate the digestion. The main features of the technology are an automatically controlled spraying system and a particular combination of bacteria, fungi and actinomycetes. Technologies 1 and 2 are often used individually, but this will be the first integrated

2
wastewater and solid waste treatment system to be installed in Thailand. With combination to these two technologies, greenhouse gas emissions were expected to be reduced by approximately 250,000 t-CO2/year.
The study, however, found that the product of biocompost from the project does not satisfy the standards applied to fertilizers in Thailand.
Hence, it was decided to cancel the biocompost production component of the project and purse only the biogas production and electricity generation component.
Baseline methodology to be applied:
ACM0014 ver.3.1‘Mitigation of greenhouse gas emissions from treatment of industrial wastewater’ The original plan aimed at integration of the baseline methodologies of ACM0014 and AM0039
ver.2 ‘Methane emissions reduction from organic waste water and bioorganic solid waste using co-composting’. However, application of AM0039 was ultimately cancelled because of abandon of the biocompost production.
2. Details of the study conducted (1) Study objectives ○ Objectives related to Clean Development Mechanism (CDM) The CDM-related objectives of this study were:
・ To study the applicability of baseline methodologies ACM0014 (electricity generation based on biogas from organic wastewater) and AM0039 (emissions reduction by reusing organic solid wastes), which were considered on an original business plan;
・ To examine the appropriateness of the integrated application, which were considered on an original business plan, of the baseline methodologies ACM0014 and AM0039 because there is no precedent in the CDM registrations with the United Nations for such application;
・ To check the validity of the existing data on the chemical oxygen demand (COD) content—a factor that greatly affects baseline emissions—of the existing open lagoons;
・ To clarify what data are required for calculating emission reductions achieved by the above baseline methodologies;
・ To define the items of the initial environmental examination (IEE), an examination required for CDM projects in Thailand, for this project in accordance with the examination guidelines created by the Thai government;
・ To check the status of preparations made by the local counterpart (project development company) for gathering comments from stakeholders; and
・ To estimate the effectiveness of the project in reducing organic solid wastes (t/year) and COD loads of organic wastewater (t/year) as part of evaluating the effectiveness of this project as a countermeasure against environmental pollution.
○ Objectives related to feasibility The feasibility-related objectives of the study were:
・ To identify the latest trends in Thailand regarding renewable energy projects, and the government’s policies, regulations, and decisions on electricity selling prices;
・ To check the trends in the sugar refining and bioethanol industries to learn more about the sugar mill and the ethanol plant, the suppliers of raw materials for this project;
・ To check what permits and licenses are necessary for this project, as well as the progress of discussions with the authorities to obtain them;
3
・ To evaluate the conformity of compost produced from organic solid wastes under this project to the quality standards in Thailand;
・ To investigate the progress of discussions with investors who are considering investing in this project, as well as the details of agreements and agreement levels with the investors;
・ To examine each assumption for economic analysis to evaluate the feasibility of the project; and ・ To evaluate the possibility of securing financing from public financial institutions in and outside
Thailand, local financial institutions, and other sources.
(2) Details of the study conducted This study investigated the following trends in Thailand to check the current conditions regarding
the supply system of raw materials, which it is essential to establish for the project, as well as regarding sales of electricity and biocompost, the products of this project:
・Trend of the sugar industry in Thailand ・Trend of the ethanol industry in Thailand ・Preferential policies on renewable energy in Thailand ・Trend of the fertilizer industry in Thailand In addition, basic information on the sugar mill and the ethanol plant (a subsidiary of the sugar mill),
the suppliers of raw materials for this project, were gathered to ensure that they are among the most productive in Thailand.
The following matters related to this project were also investigated: ・Characteristics of organic wastewater and organic solid wastes from the sugar mill and the ethanol
plant ・Details of the technologies used to produce biogas and biocompost ・Investigation of various project contracts and business licenses ・Analysis of the business model (economic feasibility, operational system, competitiveness of the
business model) ・Laws and regulations concerning organic fertilizer in Thailand, and the effectiveness of the applied
technologies
As a result of studying the characteristics of organic wastewater and organic solid wastes used for this project and the laws and regulations concerning organic fertilizer in Thailand, it was found that biocompost produced under this project is likely to fail to meet Thailand’s organic fertilizer quality standards. This issue is explained in detail below.
○ Laws and regulations concerning organic fertilizer in Thailand
The law concerning fertilizer currently in force in Thailand is the “Fertilizer Act (No.2) B.E. 2550 (2007)” enacted in 2008. According to a survey conducted as part of this study to learn how the law was established, because the inappropriate payment of government subsidies to fertilizer manufacturers—which were introduced while the former administration was in power—became a common practice under the quality standards based on the former Fertilizer Act, a movement arose to adopt new fertilizer standards with new quality criteria and penalties after the new administration assumed power in 2006.
The new Fertilizer Act enacted in 2008 stipulates the obligation for companies to apply for and receive licenses for production and other operations for chemical fertilizer, organic fertilizer and biofertilizer, the obligations of licensed companies, and the regulations on the registration and publicity of products, as well as provides the quality standards for organic fertilizer under the “National Standards on Organic Fertilizer B.E. 2551 (2008).”
4
○ Results of the study with regard to the biocompost production plan As a result of the study conducted by the project development company and the supplier that is to
deliver the applied technology regarding Thailand’s organic fertilizer quality standards, which the biocompost produced under this project is required to meet, it was found that the quality of biocompost is likely to fail to satisfy the national standards.
The National Standards on Organic Fertilizer B.E. 2551 (2008), which are quality standards for fertilizer products distributed in Thailand, are stricter than their predecessor due to the circumstances explained above, imposing electrical conductivity (EC) requirements, which are normally applied only to chemical fertilizer, on organic fertilizer as well (upper limit: 6 dS/m).
EC is an index of the fertilizer content in soil (the unit is either S/m or S/cm), which varies according to the total content of water-soluble fertilizer salts in soil (a state in which nitrogen and other fertilizer ingredients are ionized to NH4
+, NO3-, etc.). When the content of fertilizer in soil is large, soil
becomes more conductive and EC increases. The appropriate EC value for farm products differs depending on the farm product being grown and
the type of soil, and in Japan its upper limit is determined for each farm product by the prefectural government and supervisory organization. However, Thailand is the only country that imposes EC requirements on organic fertilizer, and although the local counterpart company has filed a protest against the requirements to the Ministry of Agriculture and Cooperatives, there is no prospect of the standards being revised in the future. Even if it is possible to ask agriculture industry organizations in Thailand to assist in protesting against the requirements, it is still necessary to build good relationships with the government slowly and steadily, and at present it would be extremely difficult to urge the government to revise the standards.
○ Decision on cancellation of the biocompost production plan
The technology that was planned to be applied in the biocompost production plan can control the amount of organic wastewater sprayed over organic solid wastes to accelerate microorganisms’ production of hydrolase and rapid, efficient reaction between organic solid wastes and organic wastewater in an anaerobic environment, thus producing biocompost containing a huge number of chelate compounds, enzymes, phyto-vitamins, probiotics, amino acids, and bacteria. If this technology is used, COD must, in principle, be lower than 35,000 to 45,000 ppm to meet the EC upper limit specified above. However, a field study revealed that the EC of organic wastewater and organic solid wastes used for this project is 29.7 dS/m and 2.47 dS/m, respectively. The EC of organic wastewater is particularly high due to the high concentration of COD (more than 230,000 ppm). According to the technology supplier for the composting facility, if organic wastewater with high COD concentration exceeding 200,000 ppm is used, past experience has shown that the EC of biocompost produced exceeds 10 dS/m, and it has been confirmed that, even if organic wastewater is improved, it is technically very difficult to keep the EC of biocompost below the upper limit of 6 dS/m.
Despite the regulations regarding EC in Thailand, if biocompost produced under this project were to be used in a large plantation, it would cause no problem because the resultant salinity and ion concentrations in soil are very low. It is considered that, if a suitable amount of biocompost is added to soil, it is diluted significantly and does not hinder the growth of farm products even when its EC exceeds the upper limit. Nevertheless, since the expected quality of biocompost produced under this project is likely to fail to satisfy the Thai standards as explained above, it has been decided, after discussions with the project development company, to cancel the biocompost production plan.
According to the technology supplier, a similar integrated CDM project is currently under way in Nepal to generate electricity using biogas from organic wastewater and produce biocompost at an instant food factory. By referring to the results of the feasibility study for this project in Nepal and gathering detailed data, it is planned to continue examining the feasibility of similar projects.
5
3. Results of the study on implementing the project under CDM
Because it was decided to cancel the biocompost production plan as explained in the previous
section, this section deals only with the biogas production and electricity generation plan, including the development of a baseline scenario and the calculation of expected emission reductions.
(1) Development of a baseline scenario and definition of the project boundary
The project activity involves the installation of a new anaerobic treatment system in an existing open lagoon based wastewater treatment facility at a tapioca starch production plant.
ACM0014 Version 03.1 has been chosen because the project activity matches with one of the applicable scenarios of the relevant methodology as shown in the table below:
Table: Scenario applicable to ACM0014 Version 03.1 compared to the project case
Scenario Description of the
historical situation Description of the project
activity Project case
1 The wastewater is not treated, but directed to open lagoons that have clearly anaerobic conditions.
The wastewater is treated in a new anaerobic digester. The biogas extracted from the anaerobic digester is flared and/or used to generated electricity and/or heat. The effluent from the anaerobic digester after the treatment is directed to open lagoons or is treated under clearly aerobic conditions (e.g. dewatering and land application)
In the project situation, the wastewater is treated in a newly installed anaerobic digester. The biogas extracted from the anaerobic digester is used to generate electricity with the excess biogas being flared to ensure complete methane decomposition. The effluent from the anaerobic digester after the treatment is directed to open lagoons.
The project activity also meets all the applicability conditions set forth in the methodology, as
described below. • The depth of the anaerobic lagoons should be at least 1m. • Heat and electricity needs per unit input of the water treatment facility remain largely unchanged
before and after the project; • Data requirements as laid out in this methodology are fulfilled • The residence time of the organic matter on the open lagoon system should be at least 30 days • Local regulations do not prevent discharge of wastewater in open lagoons
As per the baseline methodology, ACM0014 Version 03.1, the baseline determination follows a
four-step process below. Step 1: Identification of alternative scenarios
In accordance with the methodology, realistic and credible alternatives with regards to the
possible scenarios that would occur in the absence of the project activity are listed below:
6
Wastewater treatment W1. The use of open lagoons for the treatment of the wastewater (continuation of current practice); W2. Direct release of wastewater to a nearby water body; W3. Aerobic wastewater treatment facilities (e.g. activated sludge or filtered bed type treatment); W4. Anaerobic digester with methane recovery and flaring; W5. Anaerobic digester with methane recovery and utilization for electricity or heat generation (The
Project undertaken without being registered as a CDM project activity)
Electricity generation E1. Power generation using fossil fuels in a captive power plant; E2. Electricity generation in the grid (continuation of current practice); E3. Electricity generation using renewable sources (The Project undertaken without being
registered as a CDM project activity)
Step 2: Eliminate alternatives that are not complying with applicable laws and regulations Among all the identified alternative scenarios in Step 1 above, W2 “Direct release of
wastewater to a nearby water body” is prohibited by the Thai regulation. All alternatives other than W2 comply with the applicable laws and regulations of Thailand. Therefore, Alternative W2 is eliminated from the further analysis.
Step 3: Eliminate alternatives that face prohibitive barriers
Scenarios that face prohibitive barriers should be eliminated by applying Step 3 of the latest version of the “Tool for the demonstration and assessment of additionality” agreed by the CDM Executive Board.
Table: Elimination of alternatives that face prohibitive barriers
Scenario Identification of barriers
W1 It is the wastewater treatment practice most widely seen at ethanol plants in Thailand. Wastewater is left to stand in an open lagoon system so that COD will decompose under largely anaerobic conditions.
W3 Even though W3, introduction of aerobic wastewater treatment system, is making increasing inroads in South East Asia as an alternative waste management option, aerobic treatment of molasses-based wastewater is nonexistent within Thailand due to its complexity. The aerobic treatment of molasses-based wastewater is extremely difficult, and the project participants are not aware of any successfully working plants which employ this technology. As such, the local labour force has no knowhow regarding the operation of such a system. The installation and O&M costs for such a system will also be extremely high.
W4 Anaerobic bioreactor technology exists in Thailand, however, as in many other countries worldwide, it is a niche technology and not yet widespread. Since anaerobic digester technology is seen as a high risk, with limited performance guarantee, the majority of firms are still relying on lagoon based wastewater treatment system. These facts entail significant performance and technology risks in effluent treatment, which all translate to higher costs. Due to the high initial investment and O&M costs associated with implementation of anaerobic bioreactor technology along with the high technology risks, it would not be financially viable to install anaerobic digesters without additional income from CDM and from the generation of electricity.
W5 Even though this option is generally accepted as the best way to treat and utilize high COD/BOD
7
wastewater, as described for W4 above, implementation of anaerobic bioreactor technology in Thailand faces a significant technological and investment barrier. Utilization of biogas for electricity generation brings certain revenue to the project developer (i.e. electricity cost saving or income from electricity sales). This revenue, however, is not sufficient to overcome risks associated with installation of anaerobic bioreactor technology, and even less for the challenging technology for treating molasses-based wastewater.
E1 The ethanol plant currently meets its electricity demand by purchasing electricity from the connected grid. Due to the high initial investment and O&M costs associated with implementation and maintenance of a captive power plant, the ethanol plant would not feel obliged to install another captive power plant. Operating and maintaining a captive power plant would add a significant technical burden to the factory operators.
E2 The ethanol plant currently meets their electricity demand by purchasing electricity from the grid. E2 faces no preventive barrier.
E3 There is no reliable and economically feasible renewable energy source is found in the vicinity of the project facility. The ethanol plant does not possess experience in power generation using renewable sources. Without know-how and experience, it would be very difficult for the plant operator of the ethanol plant to operate/maintain a new renewable power generation facility.
Thus, it is concluded that Alternative E2 is the only realistic and credible scenarios with regard to the
possible scenarios that would occur in the absence of the project activity. Based on the step-wise approach conducted above, it is concluded that there is only one combination of the most plausible baseline scenario as follow:
W1: The use of open lagoons for the treatment of the wastewater, and E2: Electricity generation in the grid
In accordance with the ACM0014 Version 03.1, the spatial extent of the project boundary for this project activity includes: ・ The site where the wastewater is treated in both the baseline and the project scenario; ・ The sites where any sludge is applied to lands; ・ The anaerobic digester, the power and/or heat generation equipment and/or the flare installed under
the project activity; ・ The power plants connected to the grid, with the geographical boundary as specified in the latest
approved version of the “Tool to calculate the emission factor for an electricity system”. The emission sources included in the project boundary are described in Table below.
Table : Emission sources included and excluded from the project boundary
Source Gas Included/
ExcludedJustification/Explanation
CH4 Included This is the major source of emissions in the baseline from open lagoons.
N2O Excluded Excluded for simplification. This is conservative.
Bas
elin
e
Wastewater treatment processes
CO2 Excluded CO2 emissions from the decomposition of organic waste are not accounted for.
8
CO2 Included Electricity is generated with biogas from anaerobic digesters under the project activity, and electricity generation in the grid is displaced by the project activity.
CH4 Excluded Excluded for simplification. This is conservative.
Electricity consumption/generation
N2O Excluded Excluded for simplification. This is conservative. CO2 Included Excluded. Thermal energy is not generated with biogas from
anaerobic digesters under the project activity. CH4 Excluded Excluded for simplification. This is conservative.
Thermal energy generation
N2O Excluded Excluded for simplification. This is conservative. Included The treatment of wastewater under the project activity causes the
following project emissions, which are included: (i) Methane emissions from the lagoons (effluent from the
treatment under the project activity is directed to lagoons); (ii) Physical leakage of methane from the digester system; (iii) Methane emissions from flaring (excess biogas from the
digester is flared);
CH4
Excluded The following emission sources are excluded as they do not affect the project activity: (iv) Methane emissions from land application of sludge; (the
project does not involve land application of sludge) (v) Methane emissions from wastewater removed in the
dewatering process (no dewatering facility is installed as a part of the project activity)
CO2 Excluded CO2 emissions from the decomposition of organic waste are not accounted for.
Wastewater treatment processes
N2O Excluded The project does not involve land application of sludge. CO2 Excluded Electricity is consumed by the anaerobic digester which is
implemented by the project activity. A biogas fuelled power generation system will be installed. The electricity consumed by the project activity will be supplied by the electricity generated with biogas, therefore this component will be excluded. Any on-site electricity consumption will be subtracted from the electricity generation of the biogas as per the methodology instructions.
CH4 Excluded Excluded for simplification. This emission source is assumed to be very small.
On-site electricity use
N2O Excluded Excluded for simplification. This emission source is assumed to be very small.
CO2 Excluded Not applicable to the project. CH4 Excluded Excluded for simplification. This emission source is assumed to
be very small.
Proj
ect A
ctiv
ity
On-site fossil fuel consumption
N2O Excluded Excluded for simplification. This emission source is assumed to be very small.
Baseline emissions are estimated as follows:
yHGyELyCHy BEBEBEBE ,,,4 ++=
= 208,639 + 31,419 + 0
9
= 240,058 (tCO2e/yr)
Where: BEy = Baseline emissions in year y (tCO2e/yr)
BECH4,y = Methane emissions from anaerobic treatment of the wastewater in open lagoons (scenario1) in the absence of the project activity in year y (tCO2e/yr)
BEEL,y = CO2 emissions associated with electricity generation that is displaced by the project activity in year y (tCO2e/yr)
BEHG,y = CO2 emissions associated with fossil fuel combustion for heating equipment that is displaced by the project in year y (tCO2e/yr)
Baseline emissions for the project activity are calculated in the following three steps: Step1: Calculation of baseline emissions from anaerobic treatment of the wastewater
The methodology proposes two alternative methods for the estimation of methane emissions from open lagoons:
(a) The Methane Conversion Factor (MCF) Method (b) The Organic Removal Ratio (ORR) Method
In the case of method (a), the baseline methane emissions from anaerobic treatment of the wastewater in open lagoons are estimated based on the chemical oxygen demand (COD) of the wastewater that would enter the lagoon in the absence of the project activity (CODPJ,y), the maximum methane producing capacity (B0) and a methane conversion factor (MCFBL,y) which expresses the proportion of the wastewater that would decay to methane. Meanwhile, method (b) measures the reduction of chemical oxygen demand (COD) in a waste water or sludge stream between its entry into and exit from the treatment system. Among these two options, option (a) The Methane Conversion Factor (MCF) Method is selected for the project activity.
yBLOyBLCHyCH CODBMCFGWPBE ,,4,4 ×××= = 21 × 0.596 × 0.21 × 79,380 = 208,639 (tCO2e/yr)
Step 2: Baseline emissions from generation and/or consumption of electricity The Project activity involves electricity generation with capacity of 10 MW class. Actual amount of
power supply to the grid is estimated to be 8.2 MW (10MW×(1-18%)) based on assumption that load factor of the power generation with biogas from the new anaerobic biodigester is 18 % of total amount of power generation. Net quantity of electricity generated in year y with biogas from the new anaerobic biodigester is calculated as 64,994 MWh/year, based on assumption that annual operation time is 7,920 hours (330 days × 24 hours).
The grid emission factor used in the project activity was obtained from the official report from the Thai DNA, entitled “The estimation of emission factor for an electricity system in Thailand 2007”, issued on 26 January 2009. According to the document, the emission factor calculation follows procedures outlined in “Tool to calculate the emission factor for an electricity system” version01.1, which is the latest version currently available.
The Simple OM method was chosen as the method of calculating the Operating Margin (“OM”). However, in the aforementioned report, the Build Margin (“BM”) was calculated using generation data from IPPs only, ignoring generation from Electricity Generating Authority of Thailand (EGAT), Small Power Producers (SPPs), and Very Small Power Producers (VSPPs). However it is
10
not possible to replicate the calculation because fuel consumption for each power plant connected to the grid is not disclosed in the document due to the confidentiality concerns.
TGO supports the use of this emission factor (0.5057 kgCO2/kWh) as Thai grid emission factor for now until the updated emission factor becomes available. However, as a conservative approach, the project participant has decided to use the total generation of all generators for calculating the BM, in order to arrive at a lower BM figure, and hence a lower CM.
As a result, BM is reduced to 0.3959 kgCO2/kWh (15,170,168 / 38,321 or (total generation of all IPP generators) /1000) and, accordingly, the emission factor (combined margin) is reduced to 0.4838 kgCO2/kWh.
Baseline emissions from the generation and / or consumption of electricity are calculated as follows:
yELBLyPJBLyEL EFEGECBE ,,,, )( ×+= = ( 0 +64,944) × 0.4838 = 31,419 (tCO2e/yr)
Step 3: Baseline emissions from generation of heat The project activity does not involve heat generation from collected biogas, so baseline emissions
from this source will be ignored. (2) Project emissions
As discussed above, conditions of the project activity matches Scenario 1 provided in the baseline methodology applied (ACM0014 Version 03.1). Project emissions attributed to the project activity may include the following:
PEy = Project emissions in year y (tCO2e/yr) PECH4,effluent,y = Project emissions from treatment of wastewater effluent from the anaerobic
digester in year y (tCO2e/yr) PECH4,digest,y = Project emissions from physical leakage of methane from the anaerobic digester
in year y (tCO2e/yr) PEflare,y =Project emissions from flaring of biogas generated in the anaerobic digester in
year y (tCO2e/yr) PEsludge,LA,y = Project emissions from land application of sludge in year y (tCO2e/yr) PEEC,y = Project emissions from electricity consumption in year y (tCO2e/yr) PEFC,y = Project emissions from fossil fuel consumption in year y (tCO2e/yr)
Project emissions are calculated as follows:
yFCyECyLAsludgeyflareyeffluentCHy PEPEPEPEPEPE ,,,,,,,4 ++++= = 23,450 + 17,550 + 0 + 0+ 0 +0 = 41,000 (tCO2e/yr)
(i) Project methane emissions from effluent from the digester (PECH4,effluent,y)
Effluent from the digesters installed under the project activity is directed to open lagoons. PECH4,effluent,y = GWPCH4 × MCFPJ,y × B0 × (CODPJ,effl,dig,y – CPDPJ,effl,lag,y) = 21 × 0.6699 × 0.21 × (11,340-3,402) = 23,450 (tCO2e/yr)
(ii) Project emissions related to physical leakage from the digester As the project involves installation of anaerobic biodigester which is to be connected with
existing open lagoons, methane emissions from the new digester shall be considered: PECH4,digest,y = Fbiogas,y × FLbiogas,digest × wCH4,biogas,y × GWPCH4 = 42,443,280 × 0.05 ×0.3937 × 21 × 0.001
11
= 17,550 (tCO2e/yr) (iii) Methane emissions from flaring
In general all of the biogas produced by the project is utilized for electricity generation. A flaring system will be installed by the project activity to combust excess biogas if any. For the ex-ante calculation, methane emissions from the flare are set to zero.
The amount of biogas sent to flare will be monitored as per the methodology and the methane emissions from flaring will be calculated in accordance with the “Tool to determine project emissions from flaring gases containing methane (hereunder “flaring tool”)”.
For enclosed flares, the temperature in the exhaust gas of the flare is measured to determine whether the flare is operating or not. Since, among the options for flaring systems, an enclosed flare system is chosen by the project participants, the project participants have decided to use option (a), continuous monitoring of compliance with manufacturer’s specifications of flare, in which a 90% default value is used as flare efficiency.
(iv) Project emissions from land application of sludge This step is applicable if under the project activity sludge is applied on land. It is expected
that sludge will not be generated by the project activity. Project emissions from this source are set to zero in the ex-ante calculation.
(v) Project emissions from electricity consumption and combustion of fossil fuels in the project All of the electricity consumed by the project activity will be generated with biogas under the
project activity. (3) Monitoring plan
All monitoring equipment will be installed by experts and regularly calibrated to the highest standards by the project company. The project company will form a team to maintain and operate the project activity and monitor the parameters required by the methodology. The team will be composed of a plant manager, a Production/Biogas plant supervisor, a Genset/biogas boiler plant supervisor and operational staff.
Data / Parameter: FPJ,dig,m Data unit: m3 /month Description: Quantity of wastewater that is treated in the anaerobic digester or
under clearly aerobic conditions in the project activity in month mSource of data to be used: Measured by the ethanol plant Value of data applied for the purpose of calculating expected emission reductions in section B.5
45,000
Description of measurement methods and procedures to be applied:
Volume of wastewater will be monitored continuously with a flow meter which will be installed before the digester. Collected data will be aggregated annually for calculations.
QA/QC procedures to be applied:
Flow meters will undergo maintenance / calibration subject to appropriate industry standards.
Any comment: The value applied for the purpose of ex-ante estimation was calculated using the design daily flow rate of wastewater and expected annual operating days of the plant (330 days).
12
Data / Parameter: FPJ,effl,dig,m Data unit: m3 /month Description: Quantity of wastewater from the digester in month m Source of data to be used: Measured by the ethanol plant Value of data applied for the purpose of calculating expected emission reductions in section B.5
45,000-
Description of measurement methods and procedures to be applied:
Volume of treated wastewater from the digester will be monitored continuously with a flow meter which will be installed after the digester. Collected data will be aggregated annually for calculations.
QA/QC procedures to be applied:
Flow meters will undergo maintenance / calibration subject to appropriate industry standards.
Any comment: The value applied for the purpose of ex-ante estimation was calculated using the design daily flow rate of wastewater and expected annual operating days of the plant (330 days).
Data / Parameter: FPJ,effl,lag,m Data unit: m3 /month Description: Quantity of wastewater from the open lagoon in which the
wastewater from the digester is treated in month m Source of data to be used: Measured by the ethanol plant Value of data applied for the purpose of calculating expected emission reductions in section B.5
45,000-
Description of measurement methods and procedures to be applied:
Volume of treated wastewater from the open lagoon will be monitored continuously with a flow meter which will be installed after the last lagoon. Collected data will be aggregated annually for calculations.
QA/QC procedures to be applied:
Flow meters will undergo maintenance / calibration subject to appropriate industry standards.
Any comment: The value applied for the purpose of ex-ante estimation was calculated using the design daily flow rate of wastewater and expected annual operating days of the plant (330 days).
Data / Parameter: wCOD,dig,m Data unit: t COD/ m3 Description: Average chemical oxygen demand in the wastewater that is
treated in the anaerobic digester or under clearly aerobic conditions in the project activity in month m
Source of data to be used: Measured by the ethanol plant Value of data applied for the purpose of calculating expected
0.21 (tentative value)
13
emission reductions in section B.5 Description of measurement methods and procedures to be applied:
Regular sampling of wastewater flowing into a digester will be monitored with COD analyzer.
QA/QC procedures to be applied:
Measure the COD according to national or international standards
Any comment:
Data / Parameter: wCOD,effl,dig,m Data unit: t COD/ m3 Description: Average chemical oxygen demand in treated wastewater from the
digester o in month m Source of data to be used: Measured by the ethanol plant Value of data applied for the purpose of calculating expected emission reductions in section B.5
0.021 (tentative value)
Description of measurement methods and procedures to be applied:
Regular sampling of wastewater flowing into a digester will be monitored with COD analyzer.
QA/QC procedures to be applied:
Measure the COD according to national or international standards
Any comment:
Data / Parameter: wCOD,effl,lag,m Data unit: t COD/ m3 Description: Average chemical oxygen demand in the effluent from the open
lagoon in which the effluent from the digester is treated. Source of data to be used: Measured by the ethanol plant Value of data applied for the purpose of calculating expected emission reductions in section B.5
0.0063
Description of measurement methods and procedures to be applied:
Regular sampling of treated wastewater from the open lagoon will be monitored with COD analyzer.
QA/QC procedures to be applied:
Measure the COD according to national or international standards
Any comment:
Data / Parameter: T2.m Data unit: K Description: Average temperature at the project site in month m Source of data to be used: National or regional weather statistics Value of data applied for the purpose of calculating expected
14
emission reductions in section B.5 Description of measurement methods and procedures to be applied:
QA/QC procedures to be applied:
Any comment:
Data / Parameter: EGPJ,y Data unit: MWh/year Description: Net quantity of electricity generated in year y with biogas from
the new anaerobic digester Source of data to be used: Measurements on site Value of data applied for the purpose of calculating expected emission reductions in section B.5
64,944
Description of measurement methods and procedures to be applied:
Monitored continuously using electricity meters. Data will be recorded with a digital recording system and results will be kept electronically.
QA/QC procedures to be applied:
Electricity meters will undergo maintenance/calibration in accordance with manufacturer’s specifications.
Any comment:
Data / Parameter: Fbiogas,y Data unit: m3 /yr Description: Amount of biogas collected in the outlet of the new digester in
year y Source of data to be used: Measured by the ethanol plant Value of data applied for the purpose of calculating expected emission reductions in section B.5
42,443,280
Description of measurement methods and procedures to be applied:
Amount of biogas will be measured continuously with a gas flow meter. The collected data will be aggregated annually for calculations.
QA/QC procedures to be applied:
Flow meters will undergo maintenance / calibration subject to appropriate industry standards.
Any comment:
Data / Parameter: wCH4,biogas,y Data unit: kg CH4 / m3 Description: Concentration of methane in biogas in the outlet of the new
digester Source of data to be used: Measured by the ethanol plant Value of data applied for the 0.3938
15
purpose of calculating expected emission reductions in section B.5 Description of measurement methods and procedures to be applied:
Using calibrated continuous gas analyser or alternatively with periodical measurement at 95% confidence level. For ex-ante calculation, the value was calculated using biogas methane concentration, molar mass of methane (16.0425gCH4/mol)
QA/QC procedures to be applied:
Near infrared spectrometry will undergo maintenance / calibration subject to appropriate industry standards. The project proponents shall define the error for different levels of measurement frequency. The level of accuracy will be deducted from average concentration o measurement.
Any comment:
Data / Parameter: SLA,y Data unit: m3/year Description: Quantity of sludge applied to land in year Source of data to be used: Measured by the ethanol plant Value of data applied for the purpose of calculating expected emission reductions in section B.5
0
Description of measurement methods and procedures to be applied:
It is expected that the sludge will not be generated under the project activity. However, the end-use of the sludge will be monitored and documented and in case of land application, the project emissions from such activity will be calculated ex-post.
QA/QC procedures to be applied:
N/A
Any comment:
Data / Parameter: wN,sludge,LA Data unit: t N/ t sludge Description: Mass fraction of nitrogen in the sludge applied to land in year y Source of data to be used: Measured by the ethanol plant Value of data applied for the purpose of calculating expected emission reductions in section B.5
0
Description of measurement methods and procedures to be applied:
It is expected that the sludge will not be generated under the project activity. However, the end-use of the sludge will be monitored and documented and in case of land application, sample sludge will be submitted to a certified third party laboratory to analyze nitrogen in sludge.
QA/QC procedures to be applied:
16
Any comment:
Data / Parameter: fvi,h Data unit: - Description: Volumetric fraction of component i in the residual gas in the hour
h where i = CH4, CO, CO2, O2, H2, N2 Source of data to be used: Measured by the ethanol plant using a continuous gas analyzer Value of data applied for the purpose of calculating expected emission reductions in section B.5
CH4: 70% CO: 0% CO2: 0%
O2: 0%
H2: 0%
N2 : 30% Description of measurement methods and procedures to be applied:
This parameter will be monitored continuously and values will be averaged hourly. The same basis (dry or wet) will be considered for this measurement and the measurement of the volumetric flow rate of the residual gas (FVRG,h) when the residual gas temperature exceeds 60˚C.
QA/QC procedures to be applied:
Analysers will be periodically calibrated according to the manufacturer’s recommendation. A zero check and a typical value check will be performed by comparison with a standard certified gas.
Any comment: PEflare,y for ex-ante calculation was set to 0 tCO2/yr . As a simplified approach, project participants may only measure the methane content of the residual gas and consider the remaining part as N2.
Data / Parameter: FVRG,h Data unit: m3/h Description: Volumetric flow rate of the residual gas in dry basis at normal
conditions in the hour h Source of data to be used: Measured by the ethanol plant using a flow meter Value of data applied for the purpose of calculating expected emission reductions in section B.5
-
Description of measurement methods and procedures to be applied:
This parameter will be monitored continuously and values will be averaged hourly. The same basis (dry or wet) will be considered for this measurement and the measurement of volumetric fraction of all components in the residual gas (fvi,h) when the residual gas temperature exceeds 60˚C.
QA/QC procedures to be applied:
Flow meters are to be periodically calibrated according to the manufacturer’s recommendation.
Any comment: PEflare,y for ex-ante calculation was set to 0 tCO2/yr .
Data / Parameter: Tflare Data unit: oC
17
Description: Temperature in the exhaust gas of the flare Source of data to be used: Measurements by the ethanol plant Value of data applied for the purpose of calculating expected emission reductions in section B.5
-
Description of measurement methods and procedures to be applied:
Continuously monitored. Measure the temperature of the exhaust gas stream in the flare by a Type N thermocouple. A temperature above 500˚C indicates that a significant amount of gases are still being burnt and that the flare is operating.
QA/QC procedures to be applied:
Thermocouples should be replaced or calibrated every year.
Any comment: PEflare,y for ex-ante calculation was set to 0 tCO2/yr .
(4) Greenhouse gas emission reductions (or absorptions)
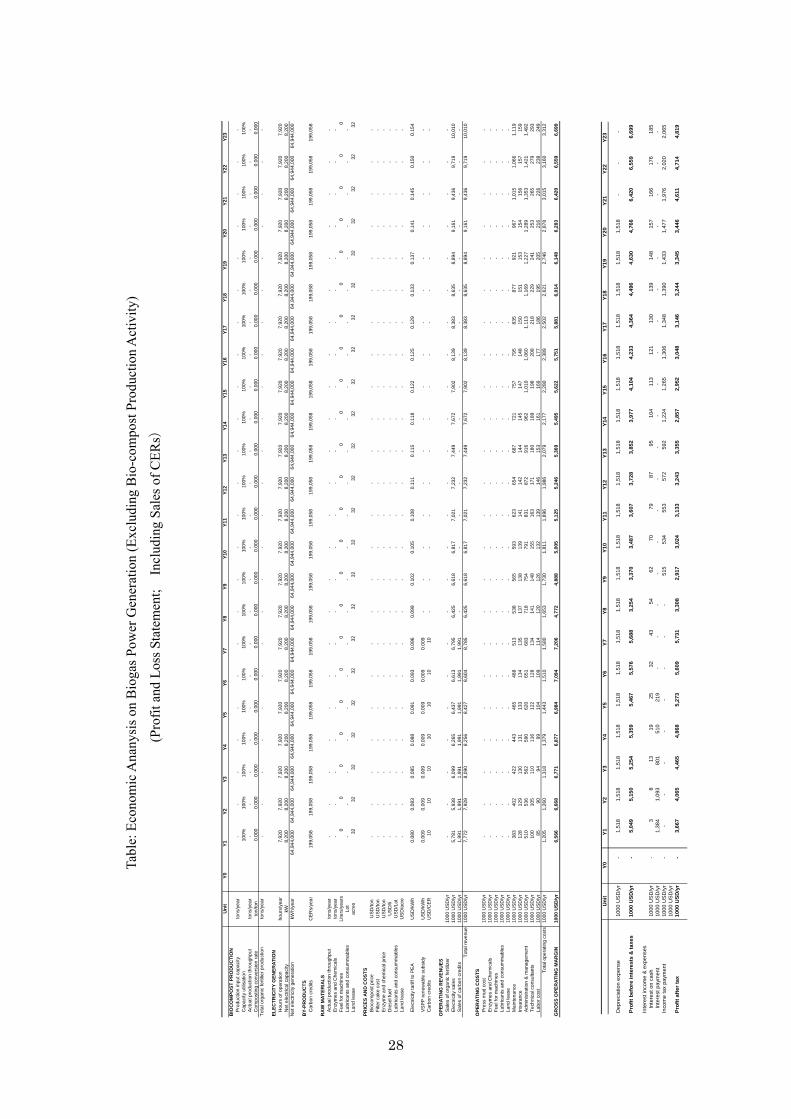
The greenhouse gas emission reductions through this project are expected to be 199,058 tons of CO2 equivalent per year. The table below shows the details.
Year 2011 2012 2013 After 2014
Baseline Emissions 208,639 208,639 208,639 208,639Project Emissions 41,000 41,000 41,000 41,000
Waste Water Treatment Leakage 0 0 0 0
Baseline Emissions 31,419 31,419 31,419 31,419Project Emissions 0 0 0 0
Power Generation
Leakage 0 0 0 0Total 199,058 tCO2 199,058 tCO22 199,058 tCO2 199,058 tCO2
(5) Project period, crediting period
The Tohoku Electric Power Company explained to its local counterpart the importance of drawing up the “Prior Considerations of the CDM” and submitting the document to the United Nations Framework Convention on Climate Change (UNFCCC) Secretariat and the Thailand Greenhouse Gas Management Organization (TGO), a governmental organization responsible for greenhouse gas emission reductions in Thailand, and the local counterpart agreed to do so. The local counterpart then prepared the document based on the format and draft text presented by the Tohoku Electric Power Company, and submitted it to the UNFCCC Secretariat and TGO on November 3, 2009.
Although the Tohoku Electric Power Company and the local counterpart have not reached a clear agreement on the project commencement date, the local counterpart is anxious to start the project in early 2010. The crediting period is 21 years in total (seven years x 3).
18
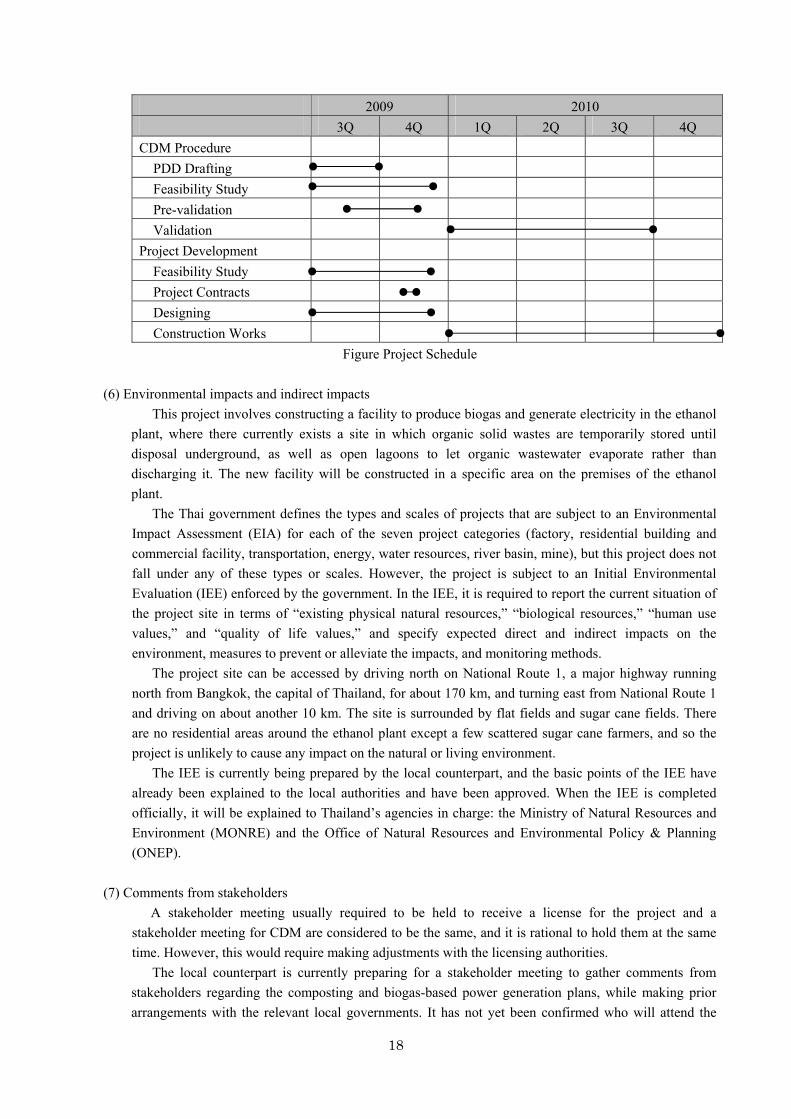
2009 2010 3Q 4Q 1Q 2Q 3Q 4Q CDM Procedure
PDD Drafting Feasibility Study Pre-validation Validation
Project Development Feasibility Study Project Contracts Designing Construction Works
Figure Project Schedule (6) Environmental impacts and indirect impacts
This project involves constructing a facility to produce biogas and generate electricity in the ethanol plant, where there currently exists a site in which organic solid wastes are temporarily stored until disposal underground, as well as open lagoons to let organic wastewater evaporate rather than discharging it. The new facility will be constructed in a specific area on the premises of the ethanol plant.
The Thai government defines the types and scales of projects that are subject to an Environmental Impact Assessment (EIA) for each of the seven project categories (factory, residential building and commercial facility, transportation, energy, water resources, river basin, mine), but this project does not fall under any of these types or scales. However, the project is subject to an Initial Environmental Evaluation (IEE) enforced by the government. In the IEE, it is required to report the current situation of the project site in terms of “existing physical natural resources,” “biological resources,” “human use values,” and “quality of life values,” and specify expected direct and indirect impacts on the environment, measures to prevent or alleviate the impacts, and monitoring methods.
The project site can be accessed by driving north on National Route 1, a major highway running north from Bangkok, the capital of Thailand, for about 170 km, and turning east from National Route 1 and driving on about another 10 km. The site is surrounded by flat fields and sugar cane fields. There are no residential areas around the ethanol plant except a few scattered sugar cane farmers, and so the project is unlikely to cause any impact on the natural or living environment.
The IEE is currently being prepared by the local counterpart, and the basic points of the IEE have already been explained to the local authorities and have been approved. When the IEE is completed officially, it will be explained to Thailand’s agencies in charge: the Ministry of Natural Resources and Environment (MONRE) and the Office of Natural Resources and Environmental Policy & Planning (ONEP).
(7) Comments from stakeholders A stakeholder meeting usually required to be held to receive a license for the project and a
stakeholder meeting for CDM are considered to be the same, and it is rational to hold them at the same time. However, this would require making adjustments with the licensing authorities.
The local counterpart is currently preparing for a stakeholder meeting to gather comments from stakeholders regarding the composting and biogas-based power generation plans, while making prior arrangements with the relevant local governments. It has not yet been confirmed who will attend the

19
stakeholder meeting, but attendants are expected to be primarily the members of the regional federation of communities and representatives from each community. According to the meeting plan, the outline of the project and facilities used for composting, biogas production, and electricity generation will be explained, and the attendants will visit the project site before their comments are collected.
The local counterpart and the ethanol plant operator are making arrangements so that the stakeholder meeting can be held by the end of March.
20
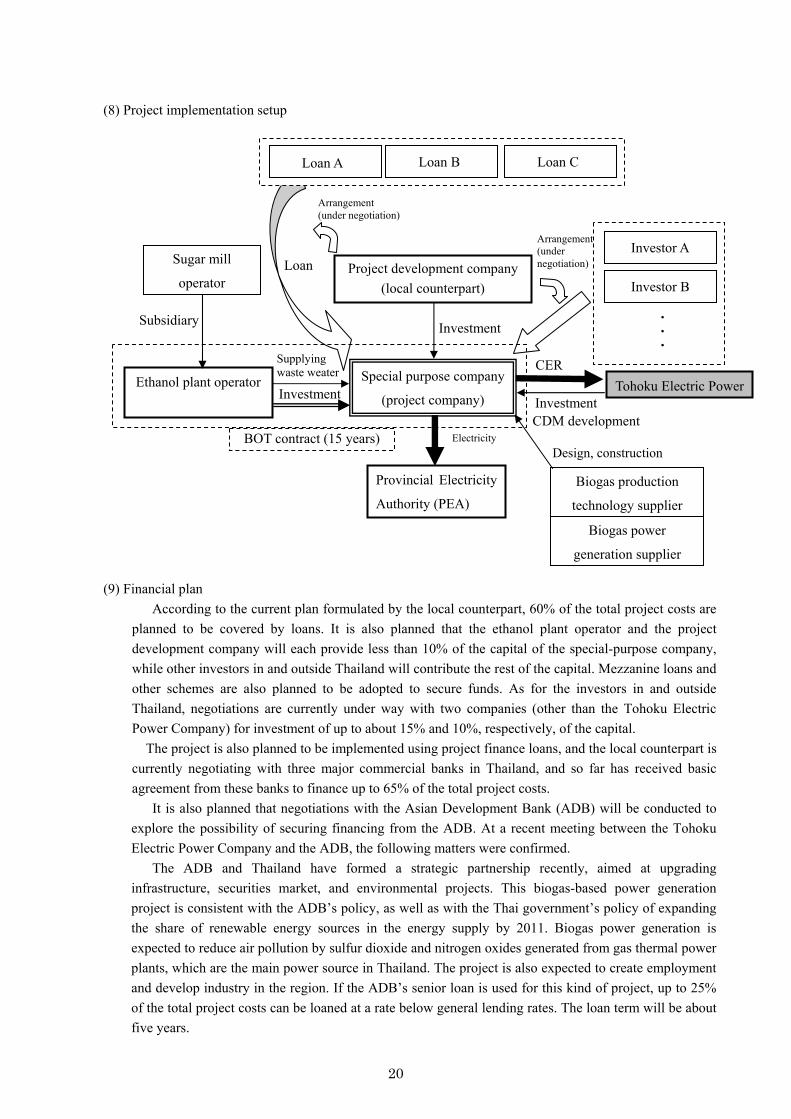
(8) Project implementation setup
(9) Financial plan According to the current plan formulated by the local counterpart, 60% of the total project costs are
planned to be covered by loans. It is also planned that the ethanol plant operator and the project development company will each provide less than 10% of the capital of the special-purpose company, while other investors in and outside Thailand will contribute the rest of the capital. Mezzanine loans and other schemes are also planned to be adopted to secure funds. As for the investors in and outside Thailand, negotiations are currently under way with two companies (other than the Tohoku Electric Power Company) for investment of up to about 15% and 10%, respectively, of the capital.
The project is also planned to be implemented using project finance loans, and the local counterpart is currently negotiating with three major commercial banks in Thailand, and so far has received basic agreement from these banks to finance up to 65% of the total project costs.
It is also planned that negotiations with the Asian Development Bank (ADB) will be conducted to explore the possibility of securing financing from the ADB. At a recent meeting between the Tohoku Electric Power Company and the ADB, the following matters were confirmed.
The ADB and Thailand have formed a strategic partnership recently, aimed at upgrading infrastructure, securities market, and environmental projects. This biogas-based power generation project is consistent with the ADB’s policy, as well as with the Thai government’s policy of expanding the share of renewable energy sources in the energy supply by 2011. Biogas power generation is expected to reduce air pollution by sulfur dioxide and nitrogen oxides generated from gas thermal power plants, which are the main power source in Thailand. The project is also expected to create employment and develop industry in the region. If the ADB’s senior loan is used for this kind of project, up to 25% of the total project costs can be loaned at a rate below general lending rates. The loan term will be about five years.
Special purpose company
(project company) Ethanol plant operator
Sugar mill
operator
Subsidiary Investment
Investment Tohoku Electric Power Investment
Biogas production
technology supplier
Design, construction
Provincial Electricity
Authority (PEA)
Electricity
CER
Investor B
Investor A
Supplying waste weater
Arrangement (under negotiation)
CDM development
Biogas power
generation supplier
・・・
BOT contract (15 years)
Project development company (local counterpart)
Loan A Loan B Loan C
Loan
Arrangement (under negotiation)
21
(10) Economic analysis and demonstration of additionality (See the attached document for assumptions and
cash flow.) The economic analysis of the biogas power generation project can be performed by analyzing the
cash flow of the project, whose total costs amount to US$30.355 million. With this analysis, it is also possible to demonstrate additionality. The demonstration of additionality is one of the CDM requirements, and must be completed using the “tool for the demonstration and assessment of additionality” (additionality tool) under ACM0013.
There are three investment analysis techniques that are granted by the additionality tool: simple cost analysis (Option I), investment comparison analysis (Option II), and benchmark analysis (Option III). For the analysis of this project, the benchmark analysis (Option III) was applied.
Initially, the equity internal rate of return (EIRR) was calculated based on assumed project cost values. The project period is 23 years, and the EIRR for the biogas power generation project was calculated to be 17.4% without revenues from CER sales.
The benchmark must be determined based on standard parameters in the market. Considering the fact that the investors have decided to make investments on the assumption that all electricity generated will be sold to the grid, it is appropriate that some kind of benchmark used in the power generation industry should be adopted for the benchmark for this analysis for the convenience of the investors. In addition, since there is no benchmark for CDM projects set by the designated national authorities (DNA) or others in Thailand, project participants need to determine the benchmark for each project based on available published data.
It was therefore decided to use the return on equity (ROE) calculated from net income and capital of companies in the energy and power sector with reference to the financial data of listed companies published by the Stock Exchange of Thailand as the benchmark. The benchmark thus determined was 23.51%, and therefore, the EIRR (17.4%) did not exceed the benchmark. This project is therefore considered unprofitable and infeasible by normal business standards, and it was concluded that there is additionality.
The additionality tool also requires sensitivity analysis. For this project, sensitivity analysis was conducted for two scenarios: one in which annual operation costs are reduced by 10%, and the other in which project costs are reduced by 10%. As a result of this analysis, the EIRR was found to be 18.27% in the former scenario, and 20.39% in the latter scenario. Both these rates are lower than the benchmark of 23.51%, demonstrating again, in sensitivity analysis, that the project is an additional project that cannot be implemented without CDM.
(11) Prospects for feasibility
Although organic wastewater from the ethanol plant must be analyzed continuously to work out more accurate baseline emissions, the project—as pointed out in the prevalidation—is not deviating significantly from the baseline methodology, and it is judged that CDM is feasible.
As regards feasibility, the project will utilize organic wastewater supplied stably by the large ethanol plant—a subsidiary of one of the leading sugar refiners in Thailand—as a raw material, and its long-term supply is guaranteed by a build-operate-transfer (BOT) contract signed with the ethanol plant operator. Electricity generated under this project will be sold to the Provincial Electricity Authority (PEA) over a long period, and its price is clearly defined by the Thai government, making it possible to evaluate the project’s long-term cash flow. In addition, this project is eligible for a subsidy for the electricity selling price and exemption from corporate tax for a certain period under the Very Small Power Producer (VSPP) scheme, and it is expected that, unlike many other CDM projects, this project will enjoy relatively stable profits.
With all these factors considered, this project is considered to be feasible, and the Tohoku Electric
22
Power Company is planning to discuss with the local counterpart the company’s way of participating in the project, the company’s role, schedule, and other matters. When agreement on these basic conditions is reached, the Tohoku Electric Power Company and the local counterpart will discuss more detailed conditions regarding the company’s participation in the project with a view to reaching an agreement in the second quarter of 2010.
4. Prevalidation
(1) Outline of the prevalidation Deloitte Touche Tohmatsu, a Designated Operational Entity (DOE), conducted a site review and
interviews with the project development company and the ethanol plant operator on January 11 and 12. This prevalidation was performed as part of a validation of the project for CDM registration with the
United Nations. In this prevalidation, (1) the project site was inspected, and the way that organic wastewater from the ethanol plant is treated was checked to verify the appropriateness of the baseline methodology and the calculated emission reductions; and (2) interviews were conducted with the expected project participants (project development company and ethanol plant operator) to verify the applicability of CDM to the project. ・ Inspection of the project site, and investigation of the way that organic wastewater from the ethanol
plant is treated to verify the appropriateness of the baseline methodology and the calculated emission reductions
・ Interviews with the expected project participants to verify the applicability of CDM to the project
(2) Views of the DOE regarding the project The following were major pointed out by the DOE:
1. From the comparison between the Project Design Document (PDD) and the actual current status, no particular problems were found regarding the applicability of the ACM0014 methodology.
2. It should be noted that the project was planned, and the PDD was prepared, based on the local feasibility study. A feasibility study report may be requested to be submitted during the validation process.
3. From the interview with the ethanol plant operator, it was confirmed that the operator intends to use—in addition to organic waste water generated in the initial stage of the ethanol distillation process—organic waste liquid generated during the subsequent process as well (the volume of the liquid and its COD content are said to be small) as raw materials for the project. If this is the case, the drainage volume and the properties of COD substances currently reported must be modified accordingly. It is also necessary to review the baseline emissions, construction costs, and other numerical data because these data change according to the input value.
4. It is necessary to check accurate drawings of the four existing open lagoons, as well as evidence of the functions and operational method (flow of organic wastewater) of the lagoons.
5. As regards additionality, a technological barrier appears to exist. Although there was a comment during the interview on the recent increase in anaerobic treatment facilities in Thailand, this project appears to be the first anaerobic example for the alcohol industry. If this is the case, some of the barriers are technology transfer and other problems related to anaerobic treatment.
With regard to 2 above, the local counterpart will prepare a feasibility study report, in addition to the
initial environmental examination (IEE) report currently being prepared, to make it available by the time of official validation. As regards 3., while it is necessary to ascertain the intention of the operator, ongoing and additional water quality monitoring will be conducted for about six months to check, based on the results of this monitoring, whether the figures used in the current plan are appropriate. As for 4., because there are no accurate drawings of the open lagoons at present, discussions will be made with the
23
local counterpart regarding the preparation of such drawings.
4. Study results of co-benefits (1) Evaluation of the effectiveness of environmental pollution countermeasures in the host country
As indicated in the table below, COD and odors are used as indicators to evaluate the effectiveness of co-benefits-type global warming countermeasures and CDM projects in the water quality improvement category, with a special focus on wastewater such as from factories and business operations.
Table: Co-benefits-type global warming countermeasures in the water quality improvement category
Evaluation indicator Explanation of indicator Use of indicator Target area Chemical oxygen demand (COD)
Amount of organic matter contained in wastewater, which is one of the causes of water pollution
To evaluate the reduction of the COD due to the implementation of the project
Odors Offensive odors generated from offensive odor substances in wastewater
To evaluate the control of offensive odors from changes in the odor index due to the implementation of the project
Countermeasures against environmental pollution
1. Method for evaluating COD emission reductions
The quantitative evaluation of the project for improving the environment was conducted using the Tier 2 methodology.
[Calculation of COD emissions in the baseline scenario]
CODconst,treatment RCOD,BL QBL,y 0.21 tCOD/m3 70% 45,000 m3/month × 12 months
BECOD, y 0.21 × (1 – 0.7) × 45,000 × 12 = 34,020 tCOD
[Calculation of COD emissions in the project scenario] CODconst,treatment RCOD,PJ QPJ,y 0.21 tCOD/m3 97% 45,000 m3/month × 12 months
PECOD, y 0.21 × (1 – 0.97) × 45,000 × 12 = 3,402 tCOD
[Calculation of emission reductions] BECOD, y PECOD, y
34,020 tCOD 3,402 tCOD ERCOD, y
34,020 tCOD – 3,402 tCOD = 30,618 tCOD 2. Odor evaluation method
Because odors could not be measured on site in this study due to little opportunity to discuss the measurement method with the local counterpart and the ethanol plant operator, it has been decided that odors will be evaluated through the field study and interviews in the surrounding areas based on the Tier 1 evaluation criteria.
Odors from the existing open lagoons are causing a serious environmental problem to the neighboring areas, and the project owner must urgently address this problem. With this project, wastewater from the plant will be sent to a treatment device to remove 90% of COD, a major cause of odors, before

24
discharge into the lagoons. This process will ensure that odors are controlled effectively and reduced significantly. The probability level of reduction is therefore the maximum “5” score.
Appendix: Parameters for Business Plan and Cash-flow Analysis
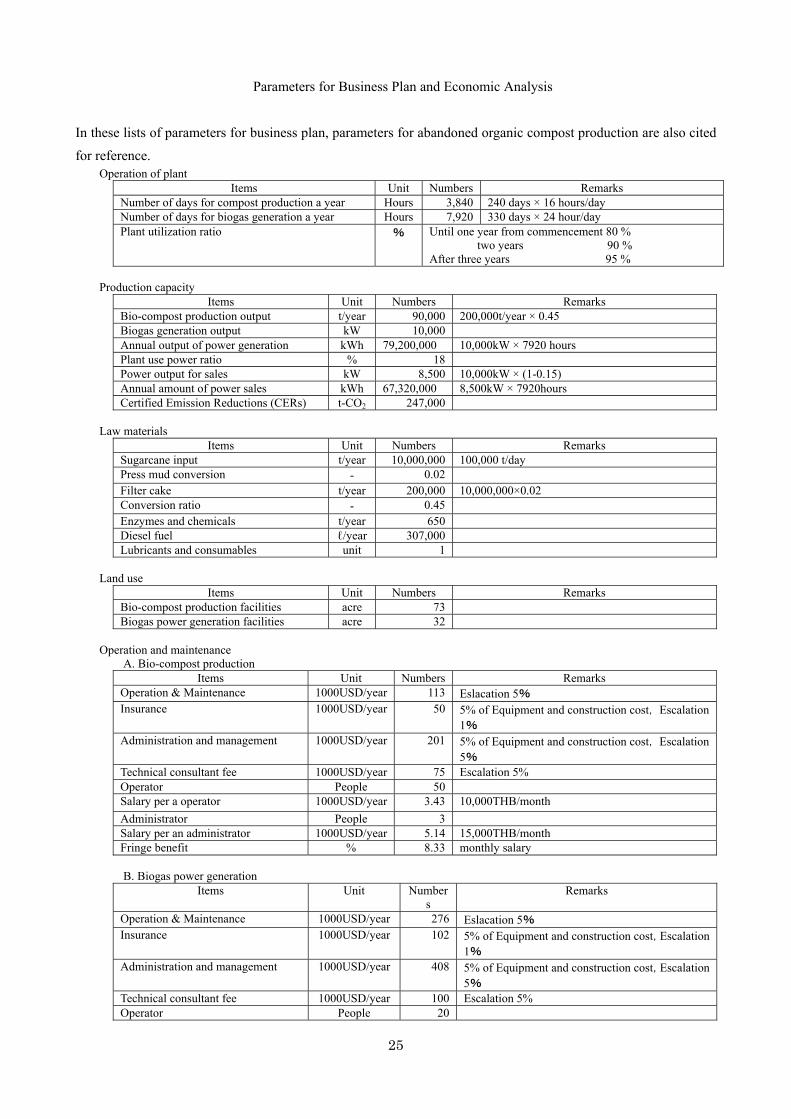
25
Parameters for Business Plan and Economic Analysis
In these lists of parameters for business plan, parameters for abandoned organic compost production are also cited
for reference. Operation of plant
Items Unit Numbers Remarks Number of days for compost production a year Hours 3,840 240 days × 16 hours/day Number of days for biogas generation a year Hours 7,920 330 days × 24 hour/day Plant utilization ratio % Until one year from commencement 80 %
two years 90 % After three years 95 %
Production capacity
Items Unit Numbers Remarks Bio-compost production output t/year 90,000 200,000t/year × 0.45 Biogas generation output kW 10,000 Annual output of power generation kWh 79,200,000 10,000kW × 7920 hours Plant use power ratio % 18 Power output for sales kW 8,500 10,000kW × (1-0.15) Annual amount of power sales kWh 67,320,000 8,500kW × 7920hours Certified Emission Reductions (CERs) t-CO2 247,000
Law materials
Items Unit Numbers Remarks Sugarcane input t/year 10,000,000 100,000 t/day Press mud conversion ‐ 0.02 Filter cake t/year 200,000 10,000,000×0.02 Conversion ratio ‐ 0.45 Enzymes and chemicals t/year 650 Diesel fuel ℓ/year 307,000 Lubricants and consumables unit 1
Land use
Items Unit Numbers Remarks Bio-compost production facilities acre 73 Biogas power generation facilities acre 32
Operation and maintenance
A. Bio-compost production Items Unit Numbers Remarks
Operation & Maintenance 1000USD/year 113 Eslacation 5% Insurance 1000USD/year 50 5% of Equipment and construction cost,Escalation
1% Administration and management 1000USD/year 201 5% of Equipment and construction cost,Escalation
5% Technical consultant fee 1000USD/year 75 Escalation 5% Operator People 50 Salary per a operator 1000USD/year 3.43 10,000THB/month Administrator People 3 Salary per an administrator 1000USD/year 5.14 15,000THB/month Fringe benefit % 8.33 monthly salary B. Biogas power generation
Items Unit Numbers
Remarks
Operation & Maintenance 1000USD/year 276 Eslacation 5% Insurance 1000USD/year 102 5% of Equipment and construction cost,Escalation
1% Administration and management 1000USD/year 408 5% of Equipment and construction cost,Escalation
5% Technical consultant fee 1000USD/year 100 Escalation 5% Operator People 20
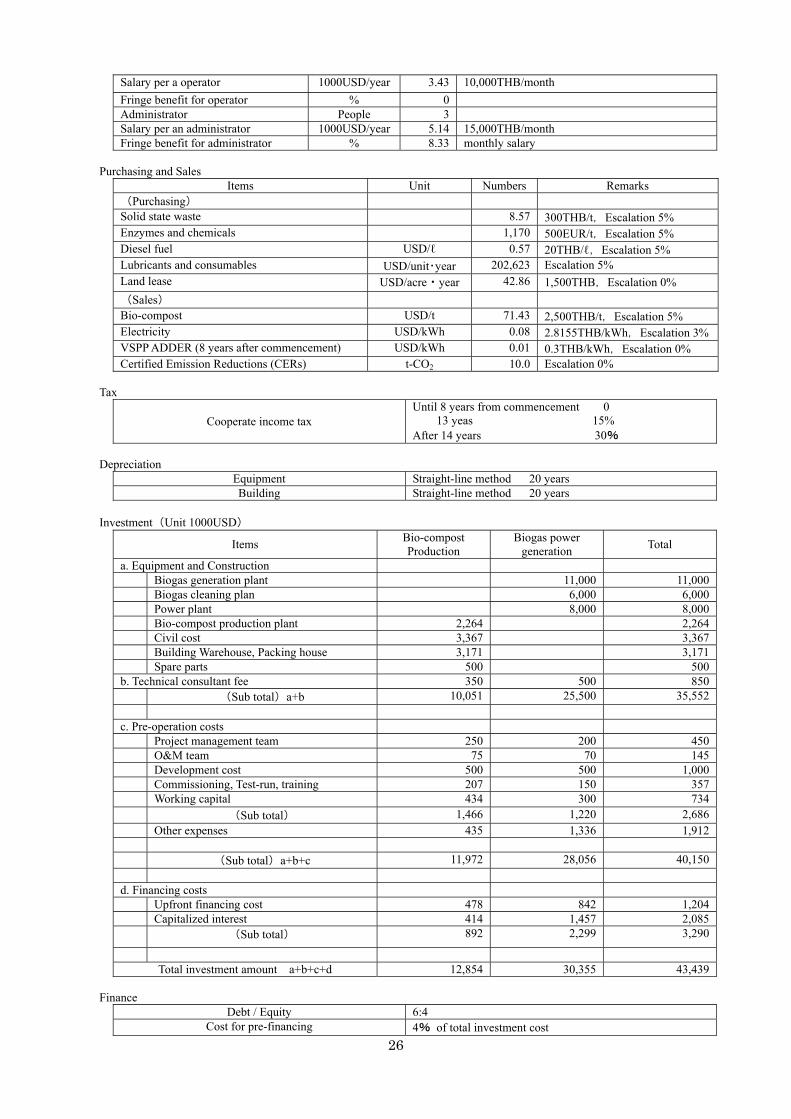
26
Salary per a operator 1000USD/year 3.43 10,000THB/month Fringe benefit for operator % 0 Administrator People 3 Salary per an administrator 1000USD/year 5.14 15,000THB/month Fringe benefit for administrator % 8.33 monthly salary
Purchasing and Sales
Items Unit Numbers Remarks (Purchasing) Solid state waste 8.57 300THB/t,Escalation 5% Enzymes and chemicals 1,170 500EUR/t,Escalation 5% Diesel fuel USD/ℓ 0.57 20THB/ℓ,Escalation 5% Lubricants and consumables USD/unit・year 202,623 Escalation 5% Land lease USD/acre・year 42.86 1,500THB,Escalation 0% (Sales) Bio-compost USD/t 71.43 2,500THB/t,Escalation 5% Electricity USD/kWh 0.08 2.8155THB/kWh,Escalation 3%VSPP ADDER (8 years after commencement) USD/kWh 0.01 0.3THB/kWh,Escalation 0% Certified Emission Reductions (CERs) t-CO2 10.0 Escalation 0%
Tax
Cooperate income tax Until 8 years from commencement 0 13 yeas 15% After 14 years 30%
Depreciation
Equipment Straight-line method 20 years Building Straight-line method 20 years
Investment(Unit 1000USD)
Items Bio-compost Production
Biogas power generation Total
a. Equipment and Construction Biogas generation plant 11,000 11,000 Biogas cleaning plan 6,000 6,000 Power plant 8,000 8,000 Bio-compost production plant 2,264 2,264 Civil cost 3,367 3,367 Building Warehouse, Packing house 3,171 3,171 Spare parts 500 500b. Technical consultant fee 350 500 850 (Sub total)a+b 10,051 25,500 35,552 c. Pre-operation costs Project management team 250 200 450 O&M team 75 70 145 Development cost 500 500 1,000 Commissioning, Test-run, training 207 150 357 Working capital 434 300 734 (Sub total) 1,466 1,220 2,686 Other expenses 435 1,336 1,912
(Sub total)a+b+c 11,972 28,056 40,150
d. Financing costs Upfront financing cost 478 842 1,204 Capitalized interest 414 1,457 2,085 (Sub total) 892 2,299 3,290
Total investment amount a+b+c+d 12,854 30,355 43,439
Finance
Debt / Equity 6:4 Cost for pre-financing 4% of total investment cost

27
Interest during construction 3% Interest for loan 8%
Duration 6 years Grace period 1 years after commencement
28
Uni
tY
0Y
1Y
2Y
3Y
4Y
5Y
6Y
7Y
8Y
9Y
10Y
11Y
12Y
13Y
14Y
15Y
16Y
17Y
18Y
19Y
20Y
21Y
22Y
23B
IOC
OM
PO
ST
PR
OD
UC
TIO
NPr
oduc
tion
inpu
t cap
acity
tons
/yea
r-
-
-
-
-
-
-
-
-
-
-
-
-
-
-
-
-
-
-
-
-
-
-
C
apac
ity u
tilis
atio
n10
0%10
0%10
0%10
0%10
0%10
0%10
0%10
0%10
0%10
0%10
0%10
0%10
0%10
0%10
0%10
0%10
0%10
0%10
0%10
0%10
0%10
0%10
0%Ac
tual
pro
duct
ion
thro
ughp
utto
ns/y
ear
-
-
-
-
-
-
-
-
-
-
-
-
-
-
-
-
-
-
-
-
-
-
-
Com
post
ing
conv
ersi
on ra
teto
n/to
n0.
000
0.00
00.
000
0.00
00.
000
0.00
00.
000
0.00
00.
000
0.00
00.
000
0.00
00.
000
0.00
00.
000
0.00
00.
000
0.00
00.
000
0.00
00.
000
0.00
00.
000
Tota
l org
anic
ferti
lier p
rodu
ctio
nto
ns/y
ear
-
-
-
-
-
-
-
-
-
-
-
-
-
-
-
-
-
-
-
-
-
-
-
ELE
CTR
ICIT
Y G
EN
ER
ATI
ON
Hou
rs o
f ope
ratio
nho
urs/
year
7,92
0
7,
920
7,92
0
7,
920
7,92
0
7,
920
7,92
0
7,
920
7,92
0
7,
920
7,92
0
7,
920
7,92
0
7,
920
7,92
0
7,
920
7,92
0
7,
920
7,92
0
7,
920
7,92
0
7,
920
7,92
0
N
et e
lect
rical
cap
acity
kW8,
200
8,20
0
8,
200
8,20
0
8,
200
8,20
0
8,
200
8,20
0
8,
200
8,20
0
8,
200
8,20
0
8,
200
8,20
0
8,
200
8,20
0
8,
200
8,20
0
8,
200
8,20
0
8,
200
8,20
0
8,
200
Net
ele
ctric
ity g
ener
atio
nkW
h/ye
ar64
,944
,000
64
,944
,000
64
,944
,000
64
,944
,000
64
,944
,000
64
,944
,000
64
,944
,000
64
,944
,000
64
,944
,000
64
,944
,000
64
,944
,000
64
,944
,000
64
,944
,000
64
,944
,000
64
,944
,000
64
,944
,000
64
,944
,000
64
,944
,000
64
,944
,000
64
,944
,000
64
,944
,000
64
,944
,000
64
,944
,000
BY
-PR
OD
UC
TSC
arbo
n cr
edits
CER
s/ye
ar19
9,05
8
199,
058
19
9,05
8
199,
058
19
9,05
8
199,
058
19
9,05
8
199,
058
19
9,05
8
199,
058
19
9,05
8
199,
058
19
9,05
8
199,
058
19
9,05
8
199,
058
19
9,05
8
199,
058
19
9,05
8
199,
058
19
9,05
8
199,
058
19
9,05
8
R
AW
MA
TER
IALS
Actu
al p
rodu
ctio
n th
roug
hput
tons
/yea
r-
-
-
-
-
-
-
-
-
-
-
-
-
-
-
-
-
-
-
-
-
-
-
En
zym
es a
nd C
hem
ical
sto
ns/y
ear
-
-
-
-
-
-
-
-
-
-
-
-
-
-
-
-
-
-
-
-
-
-
-
Fuel
for m
achi
nes
Lite
rs/y
ears
00
00
00
00
00
00
00
00
00
00
00
0Lu
bric
ants
and
con
sum
mab
les
Lot
-
-
-
-
-
-
-
-
-
-
-
-
-
-
-
-
-
-
-
-
-
-
-
Land
leas
eac
res
3232
3232
3232
3232
3232
3232
3232
3232
3232
3232
3232
32
PR
ICE
S A
ND
CO
STS
Bioc
ompo
st p
rice
US
D/to
n-
-
-
-
-
-
-
-
-
-
-
-
-
-
-
-
-
-
-
-
-
-
-
Fi
lter c
ake
cost
US
D/to
n-
-
-
-
-
-
-
-
-
-
-
-
-
-
-
-
-
-
-
-
-
-
-
En
zym
e an
d ch
emic
al p
rice
US
D/to
n-
-
-
-
-
-
-
-
-
-
-
-
-
-
-
-
-
-
-
-
-
-
-
D
iese
l fue
lU
SD
/li-
-
-
-
-
-
-
-
-
-
-
-
-
-
-
-
-
-
-
-
-
-
-
Lu
bric
ants
and
con
sum
mab
les
US
D/L
ot-
-
-
-
-
-
-
-
-
-
-
-
-
-
-
-
-
-
-
-
-
-
-
La
nd le
ase
USD
/acr
e-
-
-
-
-
-
-
-
-
-
-
-
-
-
-
-
-
-
-
-
-
-
-
Elec
trici
ty ta
riff t
o PE
AU
SD
/kW
h0.
080
0.08
3
0.
085
0.08
8
0.
091
0.09
3
0.
096
0.09
9
0.
102
0.10
5
0.
108
0.11
1
0.
115
0.11
8
0.
122
0.12
5
0.
129
0.13
3
0.
137
0.14
1
0.
145
0.15
0
0.
154
VSPP
rene
wab
le s
ubsi
dyU
SD
/kW
h0.
009
0.00
9
0.
009
0.00
9
0.
009
0.00
9
0.
009
-
-
-
-
-
-
-
-
-
-
-
-
-
-
-
-
Car
bon
cred
itsU
SD/C
ER10
10
10
10
10
10
10
-
-
-
-
-
-
-
-
-
-
-
-
-
-
-
-
OP
ER
ATI
NG
RE
VE
NU
ES
Sale
s of
org
anic
ferti
lizer
1000
USD
/yr
-
-
-
-
-
-
-
-
-
-
-
-
-
-
-
-
-
-
-
-
-
-
-
Elec
trici
ty s
ales
1000
USD
/yr
5,78
1
5,
938
6,09
9
6,
265
6,43
7
6,
613
6,79
5
6,
425
6,61
8
6,
817
7,02
1
7,
232
7,44
9
7,
672
7,90
2
8,
139
8,38
3
8,
635
8,89
4
9,
161
9,43
6
9,
719
10,0
10
Sale
s of
car
bon
cred
its10
00 U
SD/y
r1,
991
1,99
1
1,
991
1,99
1
1,
991
1,99
1
1,
991
-
-
-
-
-
-
-
-
-
-
-
-
-
-
-
-
Tota
l rev
enue
1000
USD
/yr
7,77
2
7,
928
8,09
0
8,
256
8,42
7
8,
604
8,78
5
6,
425
6,61
8
6,
817
7,02
1
7,
232
7,44
9
7,
672
7,90
2
8,
139
8,38
3
8,
635
8,89
4
9,
161
9,43
6
9,
719
10,0
10
OP
ER
ATI
NG
CO
STS
Pres
s m
ud c
ost
1000
USD
/yr
-
-
-
-
-
-
-
-
-
-
-
-
-
-
-
-
-
-
-
-
-
-
-
Enzy
mes
and
Che
mic
als
1000
USD
/yr
-
-
-
-
-
-
-
-
-
-
-
-
-
-
-
-
-
-
-
-
-
-
-
Fuel
for m
achi
nes
1000
USD
/yr
-
-
-
-
-
-
-
-
-
-
-
-
-
-
-
-
-
-
-
-
-
-
-
Lubr
ican
ts a
nd c
onsu
mm
able
s10
00 U
SD/y
r-
-
-
-
-
-
-
-
-
-
-
-
-
-
-
-
-
-
-
-
-
-
-
La
nd le
ase
1000
USD
/yr
-
-
-
-
-
-
-
-
-
-
-
-
-
-
-
-
-
-
-
-
-
-
-
Mai
nten
ance
1000
USD
/yr
383
40
2
422
44
3
465
48
8
513
53
8
565
59
3
623
65
4
687
72
1
757
79
5
835
87
7
921
96
7
1,01
5
1,
066
1,11
9
In
sura
nce
1000
USD
/yr
128
12
9
130
13
1
133
13
4
135
13
7
138
13
9
141
14
2
144
14
5
147
14
8
150
15
1
153
15
4
156
15
7
159
Ad
min
istra
tion
& m
anag
emen
t10
00 U
SD/y
r51
0
536
56
2
590
62
0
651
68
3
718
75
4
791
83
1
872
91
6
962
1,
010
1,06
0
1,
113
1,16
9
1,
227
1,28
9
1,
353
1,42
1
1,
492
Tech
nica
l con
sulta
nts
1000
USD
/yr
100
10
5
110
11
6
122
12
8
134
14
1
148
15
5
163
17
1
180
18
9
198
20
8
218
22
9
241
25
3
265
27
9
293
La
bor c
ost
1000
USD
/yr
85
90
94
99
104
10
9
114
12
0
126
13
2
139
14
6
153
16
1
169
17
7
186
19
5
205
21
6
226
23
8
249
To
tal o
pera
ting
cost
s10
00 U
SD/y
r1,
205
1,26
0
1,
318
1,37
9
1,
443
1,51
0
1,
580
1,65
3
1,
730
1,81
1
1,
896
1,98
6
2,
079
2,17
7
2,
280
2,38
9
2,
502
2,62
1
2,
746
2,87
8
3,
015
3,16
0
3,
312
GR
OS
S O
PE
RA
TIN
G M
AR
GIN
1000
US
D/y
r6,
566
6,66
8
6,
771
6,87
7
6,
984
7,09
4
7,
206
4,77
2
4,
888
5,00
5
5,
125
5,24
6
5,
369
5,49
5
5,
622
5,75
1
5,
881
6,01
4
6,
148
6,28
3
6,
420
6,
559
6,69
9
Uni
tY
0Y
1Y
2Y
3Y
4Y
5Y
6Y
7Y
8Y
9Y
10Y
11Y
12Y
13Y
14Y
15Y
16Y
17Y
18Y
19Y
20Y
21Y
22Y
23
Dep
reci
atio
n ex
pens
e10
00 U
SD
/yr
-
1,51
8
1,51
8
1,51
8
1,51
8
1,51
8
1,51
8
1,51
8
1,51
8
1,51
8
1,51
8
1,51
8
1,51
8
1,51
8
1,51
8
1,51
8
1,51
8
1,51
8
1,51
8
1,51
8
1,51
8
-
-
-
Pro
fit b
efor
e in
tere
sts
& ta
xes
1000
US
D/y
r-
5,
049
5,
150
5,
254
5,
359
5,
467
5,
576
5,
688
3,
254
3,
370
3,
487
3,
607
3,
728
3,
852
3,
977
4,
104
4,
233
4,
364
4,
496
4,
630
4,
766
6,
420
6,
559
6,
699
Inte
rest
inco
me
& e
xpen
ses
Inte
rest
on
cash
1000
US
D/y
r-
3
8
13
19
25
32
43
54
62
70
79
87
95
10
4
11
3
12
1
13
0
13
9
14
8
15
7
16
6
17
6
18
5
In
tere
st p
aym
ent
1000
US
D/y
r1,
384
1,
093
80
1
51
0
21
9
-
-
-
-
-
-
-
-
-
-
-
-
-
-
-
-
-
-
In
com
e ta
x pa
ymen
t10
00 U
SD
/yr
-
-
-
-
-
-
-
-
-
515
534
553
572
592
1,22
4
1,26
5
1,30
6
1,34
8
1,39
0
1,43
3
1,47
7
1,97
6
2,02
0
2,06
5
1000
US
D/y
rP
rofit
aft
er ta
x10
00 U
SD
/yr
-
3,66
7
4,06
5
4,46
5
4,86
8
5,27
3
5,60
9
5,73
1
3,30
8
2,91
7
3,02
4
3,13
3
3,24
3
3,35
5
2,85
7
2,95
2
3,04
8
3,14
6
3,24
4
3,34
5
3,44
6
4,61
1
4,71
4
4,81
9
Tabl
e: E
cono
mic
Ana
nysi
s on
Bio
gas P
ower
Gen
erat
ion
(Exc
ludi
ng B
io-c
ompo
st P
rodu
ctio
n A
ctiv
ity)
(Pro
fit a
nd L
oss S
tate
men
t; I
nclu
ding
Sal
es o
f CER
s)
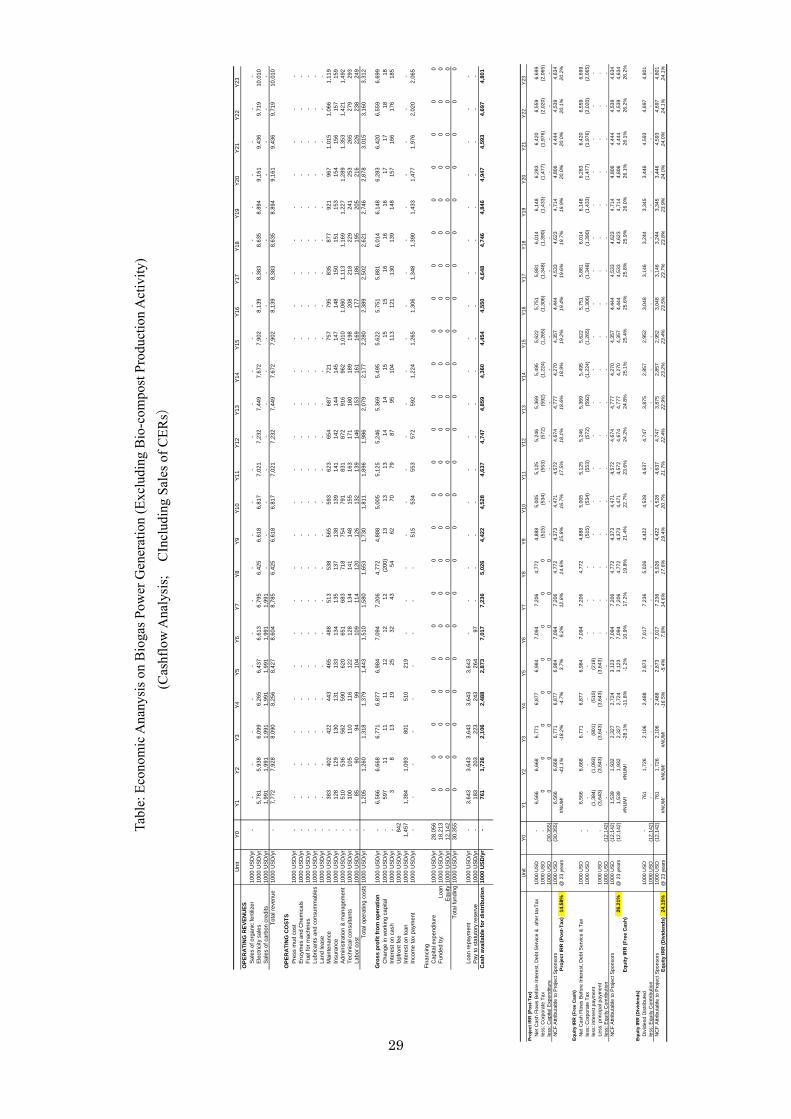
29
Uni
tY0
Y1Y2
Y3Y4
Y5Y6
Y7Y
8Y9
Y10
Y11
Y12
Y13
Y14
Y15
Y16
Y17
Y18
Y19
Y20
Y21
Y22
Y23
Pro
ject
IRR
(Pos
t-Ta
x)N
et C
ash
Flow
s Be
fore
Inte
rest
, Deb
t Ser
vice
& a
fter t
axTa
x10
00 U
SD-
6,
566
6,66
8
6,
771
6,87
7
6,
984
7,09
4
7,
206
4,77
2
4,
888
5,00
5
5,
125
5,24
6
5,
369
5,49
5
5,
622
5,75
1
5,
881
6,01
4
6,
148
6,28
3
6,
420
6,55
9
6,
699
less
: Cor
pora
te T
ax10
00 U
SD-
0
00
00
00
0(5
15)
(5
34)
(5
53)
(5
72)
(5
92)
(1
,224
)
(1
,265
)
(1
,306
)
(1
,348
)
(1
,390
)
(1
,433
)
(1
,477
)
(1
,976
)
(2
,020
)
(2
,065
)
le
ss: C
apita
l Exp
endi
ture
1000
USD
(30,
355)
0
00
00
00
0-
-
-
-
-
-
-
-
-
-
-
-
-
-
-
N
CF
Attr
ibut
able
to P
roje
ct S
pons
ors
1000
USD
(30,
355)
6,
566
6,66
8
6,
771
6,87
7
6,
984
7,09
4
7,
206
4,77
2
4,
373
4,47
1
4,
572
4,67
4
4,
777
4,27
0
4,
357
4,44
4
4,
533
4,62
3
4,
714
4,80
6
4,
444
4,53
9
4,
634
Pro
ject
IRR
(Pos
t-Ta
x)14
.58%
@ 2
3 ye
ars
#NU
M!
-41.
1%-1
8.2%
-4.7
%3.
7%9.
2%12
.8%
14.6
%15
.8%
16.7
%17
.5%
18.1
%18
.6%
18.9
%19
.2%
19.4
%19
.6%
19.7
%19
.9%
20.0
%20
.0%
20.1
%20
.2%
Equ
ity IR
R (F
ree
Cas
h)N
et C
ash
Flow
s Be
fore
Inte
rest
, Deb
t Ser
vice
& T
ax10
00 U
SD-
6,
566
6,66
8
6,
771
6,87
7
6,
984
7,09
4
7,
206
4,77
2
4,
888
5,00
5
5,
125
5,24
6
5,
369
5,49
5
5,
622
5,75
1
5,
881
6,01
4
6,
148
6,28
3
6,
420
6,55
9
6,
699
less
: Cor
pora
te T
ax10
00 U
SD-
-
-
-
-
-
-
-
-
(5
15)
(5
34)
(5
53)
(5
72)
(5
92)
(1
,224
)
(1
,265
)
(1
,306
)
(1
,348
)
(1
,390
)
(1
,433
)
(1
,477
)
(1
,976
)
(2
,020
)
(2
,065
)
le
ss: i
nter
est p
aym
ent
(1,3
84)
(1,0
93)
(801
)
(510
)
(219
)
-
-
-
-
-
-
-
-
-
-
-
-
-
-
-
-
-
-
Less
: prin
cipa
l pay
men
t10
00 U
SD-
(3
,643
)
(3
,643
)
(3
,643
)
(3
,643
)
(3
,643
)
-
-
-
-
-
-
-
-
-
-
-
-
-
-
-
-
-
-
le
ss: E
quity
Con
tribu
tion
1000
USD
(12,
142)
-
-
-
-
-
-
-
-
-
-
-
-
-
-
-
-
-
-
-
-
-
-
-
N
CF
Attr
ibut
able
to P
roje
ct S
pons
ors
1000
USD
(12,
142)
1,
539
1,93
2
2,
327
2,72
4
3,
123
7,09
4
7,
206
4,77
2
4,
373
4,47
1
4,
572
4,67
4
4,
777
4,27
0
4,
357
4,44
4
4,
533
4,62
3
4,
714
4,80
6
4,
444
4,53
9
4,
634
Ret
urn
on E
quity
26.2
1%@
23
year
s(1
2,14
2)
1,53
9
1,
932
2,32
7
2,
724
3,12
3
7,
094
7,20
6
4,
772
4,37
3
4,
471
4,57
2
4,
674
4,77
7
4,
270
4,35
7
4,
444
4,53
3
4,
623
4,71
4
4,
806
4,44
4
4,
539
4,63
4
E
quity
IRR
(Fre
e C
ash)
#NU
M!
#NU
M!
-28.
1%-1
1.8%
-1.2
%10
.9%
17.2
%19
.8%
21.4
%22
.7%
23.6
%24
.2%
24.8
%25
.1%
25.4
%25
.6%
25.8
%25
.9%
26.0
%26
.1%
26.1
%26
.2%
26.2
%R
emai
ning
from
prin
cipa
l(8
,499
)
(4
,857
)
(1
,214
)
2,
428
6,07
1
6,
071
6,07
1
6,
071
6,07
1
6,
071
6,07
1
6,
071
6,07
1
6,
071
6,07
1
26
%E
quity
IRR
(Div
iden
ds)
Div
iden
d D
istri
bute
d10
00 U
SD-
76
1
1,72
6
2,
106
2,48
8
2,
873
7,01
7
7,
236
5,02
6
4,
422
4,52
8
4,
637
4,74
7
3,
875
2,85
7
2,
952
3,04
8
3,
146
3,24
4
3,
345
3,44
6
4,
593
4,69
7
4,
801
less
: Equ
ity C
ontri
butio
n10
00 U
SD(1
2,14
2)
-
-
-
-
-
-
-
-
-
-
-
-
-
-
-
-
-
-
-
-
-
-
-
NC
F A
ttrib
utab
le to
Pro
ject
Spo
nsor
s10
00 U
SD(1
2,14
2)
761
1,
726
2,10
6
2,
488
2,87
3
7,
017
7,23
6
5,
026
4,42
2
4,
528
4,63
7
4,
747
3,87
5
2,
857
2,95
2
3,
048
3,14
6
3,
244
3,34
5
3,
446
4,59
3
4,
697
4,80
1
E
quity
IRR
(Div
iden
ds)
24.1
5%@
23
year
s#N
UM
!#N
UM
!#N
UM
!-1
6.5%
-5.4
%7.
8%14
.6%
17.6
%19
.4%
20.7
%21
.7%
22.4
%22
.9%
23.2
%23
.4%
23.5
%23
.7%
23.8
%23
.9%
24.0
%24
.0%
24.1
%24
.1%
Uni
tY0
Y1Y2
Y3Y4
Y5Y6
Y7Y8
Y9Y1
0Y1
1Y1
2Y1
3Y1
4Y1
5Y1
6Y1
7Y1
8Y1
9Y2
0Y2
1Y2
2Y2
3O
PE
RA
TIN
G R
EV
EN
UE
SSa
les
of o
rgan
ic fe
rtiliz
er10
00 U
SD
/yr
-
-
-
-
-
-
-
-
-
-
-
-
-
-
-
-
-
-
-
-
-
-
-
-
El
ectri
city
sal
es10
00 U
SD
/yr
5,78
1
5,93
8
6,09
9
6,26
5
6,43
7
6,61
3
6,79
5
6,42
5
6,61
8
6,81
7
7,02
1
7,23
2
7,44
9
7,67
2
7,90
2
8,13
9
8,38
3
8,63
5
8,89
4
9,16
1
9,43
6
9,71
9
10,0
10
Sale
s of
car
bon
cred
its10
00 U
SD
/yr
1,99
1
1,99
1
1,99
1
1,99
1
1,99
1
1,99
1
1,99
1
-
-
-
-
-
-
-
-
-
-
-
-
-
-
-
-
Tota
l rev
enue
1000
US
D/y
r-
7,77
2
7,92
8
8,09
0
8,25
6
8,42
7
8,60
4
8,78
5
6,42
5
6,61
8
6,81
7
7,02
1
7,23
2
7,44
9
7,67
2
7,90
2
8,13
9
8,38
3
8,63
5
8,89
4
9,16
1
9,43
6
9,71
9
10,0
10
OP
ER
ATI
NG
CO
STS
Pres
s m
ud c
ost
1000
US
D/y
r-
-
-
-
-
-
-
-
-
-
-
-
-
-
-
-
-
-
-
-
-
-
-
-
Enzy
mes
and
Che
mic
als
1000
US
D/y
r-
-
-
-
-
-
-
-
-
-
-
-
-
-
-
-
-
-
-
-
-
-
-
-
Fuel
for m
achi
nes
1000
US
D/y
r-
-
-
-
-
-
-
-
-
-
-
-
-
-
-
-
-
-
-
-
-
-
-
-
Lubr
ican
ts a
nd c
onsu
mm
able
s10
00 U
SD
/yr
-
-
-
-
-
-
-
-
-
-
-
-
-
-
-
-
-
-
-
-
-
-
-
-
La
nd le
ase
1000
US
D/y
r-
-
-
-
-
-
-
-
-
-
-
-
-
-
-
-
-
-
-
-
-
-
-
-
Mai
nten
ance
1000
US
D/y
r-
383
402
422
443
465
488
513
538
565
593
623
654
687
721
757
795
835
877
921
967
1,01
5
1,06
6
1,11
9
Insu
ranc
e10
00 U
SD
/yr
-
12
8
12
9
13
0
13
1
13
3
13
4
13
5
13
7
13
8
13
9
14
1
14
2
14
4
14
5
14
7
14
8
15
0
15
1
15
3
15
4
15
6
15
7
15
9
Ad
min
istra
tion
& m
anag
emen
t10
00 U
SD
/yr
-
51
0
53
6
56
2
59
0
62
0
65
1
68
3
71
8
75
4
79
1
83
1
87
2
91
6
96
2
1,
010
1,
060
1,
113
1,
169
1,
227
1,
289
1,
353
1,
421
1,
492
Te
chni
cal c
onsu
ltant
s10
00 U
SD
/yr
-
10
0
10
5
11
0
11
6
12
2
12
8
13
4
14
1
14
8
15
5
16
3
17
1
18
0
18
9
19
8
20
8
21
8
22
9
24
1
25
3
26
5
27
9
29
3
La
bor c
ost
1000
US
D/y
r-
85
90
94
99
104
109
114
120
126
132
139
146
153
161
169
177
186
195
205
216
226
238
249
Tota
l ope
ratin
g co
sts
1000
US
D/y
r-
1,20
5
1,26
0
1,31
8
1,37
9
1,44
3
1,51
0
1,58
0
1,65
3
1,73
0
1,81
1
1,89
6
1,98
6
2,07
9
2,17
7
2,28
0
2,38
9
2,50
2
2,62
1
2,74
6
2,87
8
3,01
5
3,16
0
3,31
2
Gro
ss p
rofit
from
ope
ratio
n10
00 U
SD
/yr
-
6,
566
6,
668
6,
771
6,
877
6,
984
7,
094
7,
206
4,
772
4,
888
5,
005
5,
125
5,
246
5,
369
5,
495
5,
622
5,
751
5,
881
6,
014
6,
148
6,
283
6,
420
6,
559
6,
699
C
hang
e in
wor
king
cap
ital
1000
US
D/y
r-
597
11
11
11
12
12
12
(200
)
13
13
13
14
14
15
15
15
16
16
16
17
17
18
18
In
tere
st o
n ca
sh10
00 U
SD
/yr
-
3
8
13
19
25
32
43
54
62
70
79
87
95
10
4
11
3
12
1
13
0
13
9
14
8
15
7
16
6
17
6
18
5
U
pfro
nt fe
e10
00 U
SD
/yr
842
Inte
rest
on
loan
1000
US
D/y
r1,
457
1,
384
1,
093
80
1
51
0
21
9
-
-
-
-
-
-
-
-
-
-
-
-
-
-
-
-
-
-
In
com
e ta
x pa
ymen
t10
00 U
SD
/yr
-
-
-
-
-
-
-
-
-
51
5
53
4
55
3
57
2
59
2
1,
224
1,
265
1,
306
1,
348
1,
390
1,
433
1,
477
1,
976
2,
020
2,
065
Fina
ncin
gC
apita
l exp
endi
ture
1000
US
D/y
r28
,056
00
00
00
00
00
00
00
00
00
00
00
0Fu
nded
by:
Loan
1000
US
D/y
r18
,213
00
00
00
00
00
00
00
00
00
00
00
0E
quity
1000
US
D/y
r12
,142
00
00
00
00
00
00
00
00
00
00
00
0To
tal f
undi
ng10
00 U
SD
/yr
30,3
55
0
00
00
00
00
00
00
00
00
00
00
00
Loan
repa
ymen
t10
00 U
SD
/yr
-
3,
643
3,
643
3,
643
3,
643
3,
643
-
-
-
-
-
-
-
-
-
-
-
-
-
-
-
-
-
-
Pa
y to
sta
tuto
ry re
serv
e10
00 U
SD
/yr
-
18
3
20
3
22
3
24
3
26
4
97
-
-
-
-
-
-
-
-
-
-
-
-
-
-
-
-
-
C
ash
avai
labl
e fo
r di
stri
butio
n10
00 U
SD
/yr
-
76
1
1,
726
2,
106
2,
488
2,
873
7,
017
7,
236
5,
026
4,
422
4,
528
4,
637
4,
747
4,
859
4,
360
4,
454
4,
550
4,
648
4,
746
4,
846
4,
947
4,
593
4,
697
4,
801
Tabl
e: E
cono
mic
Ana
nysi
s on
Bio
gas P
ower
Gen
erat
ion
(Exc
ludi
ng B
io-c
ompo
st P
rodu
ctio
n A
ctiv
ity)
(Cas
hflo
w A
naly
sis;
C
Incl
udin
g Sa
les o
f CER
s)
Recommended