Sum Scores and Scores of Individual Components in Clinical Practice and Clinical
Trials
Lillian W. Gaber
University of Tennessee
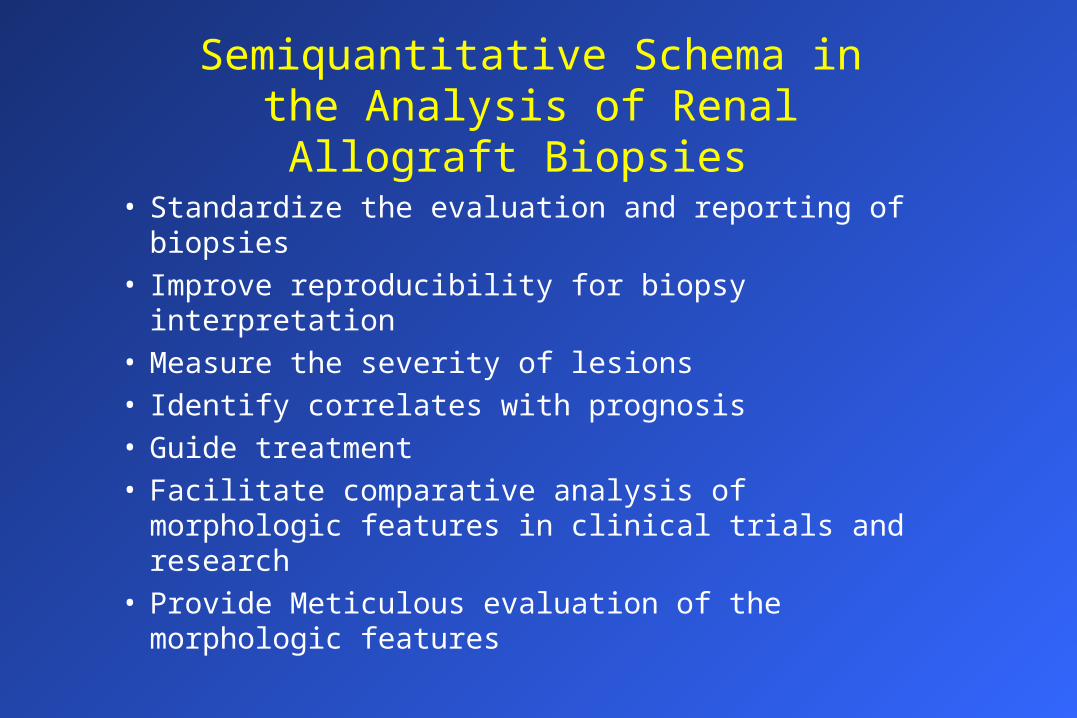
Semiquantitative Schema in the Analysis of Renal Allograft Biopsies
• Standardize the evaluation and reporting of biopsies• Improve reproducibility for biopsy interpretation • Measure the severity of lesions • Identify correlates with prognosis• Guide treatment • Facilitate comparative analysis of morphologic
features in clinical trials and research• Provide Meticulous evaluation of the morphologic
features

Scores For Chronic Allograft Nephropathy
Chronic Scores
• Diffuse interstitial fibrosis was consistently identified as a significant risk factor for graft loss
• Proliferative vasculopathy is detrimental• What is the value of CAN before we get to endstage?

CAN Scores for Protocol Biopsies & Graft Function
Correlation 12-mocreatinine
(n=71)
24-mocreatinine
(n=62)Chronic score at 1 mo NS NS
Chronic score at 2 mo NS NS
Chronic score at 3 mo * 0.45 0.47
Chronic score at 6 mo * 0.47 0.48
CI + CT at 6 mo 0.39 0.41
CG + CV at 6 mo 0.44 0.45
Nicherson et al; 1997
* P <0.05
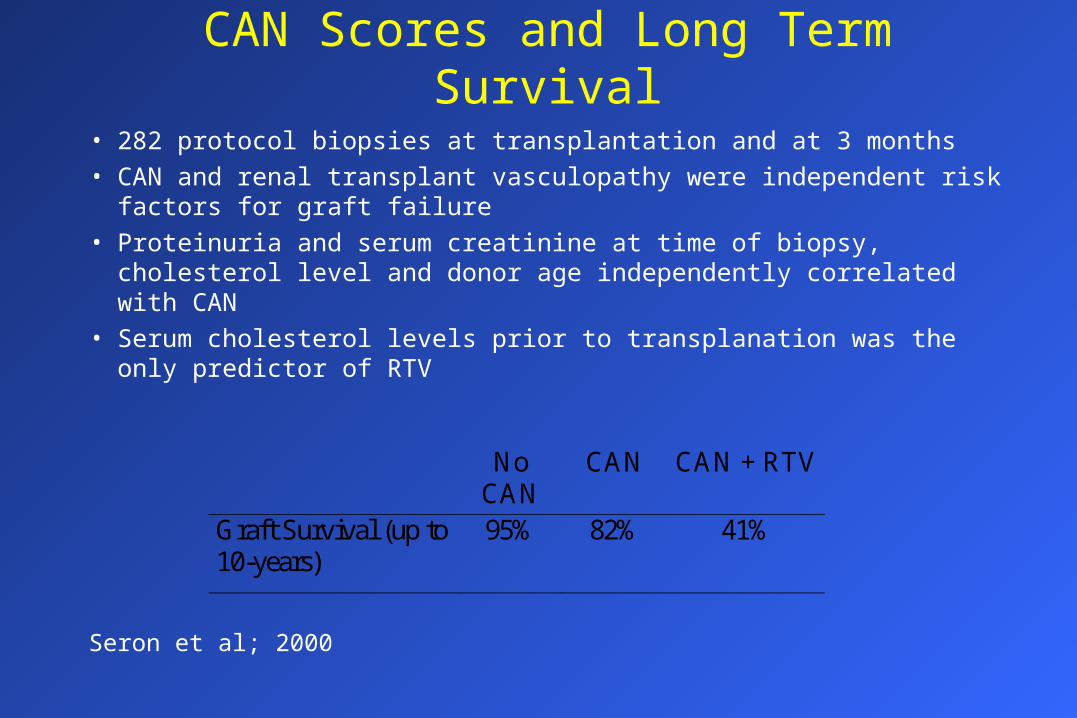
• 282 protocol biopsies at transplantation and at 3 months• CAN and renal transplant vasculopathy were independent risk factors for
graft failure• Proteinuria and serum creatinine at time of biopsy, cholesterol level and
donor age independently correlated with CAN • Serum cholesterol levels prior to transplanation was the only predictor of
RTV
CAN Scores and Long Term Survival
NoCAN
CAN CAN + RTV
Graft Survival (up to10-years)
95% 82% 41%
Seron et al; 2000

Protocol biopsies - CAN & Intervention Trials• Primary intervention trials
– CAN with or without RTV in 15.7% donor biopsies and 38.3% protocol 3 M biopsies. Denovo CAN develops in 22.6% of patients in the first 3 M
– Hypothetical trial to detect a 50% reduction in the incidence of denovo CAN from 38.3% to 27%; 285 patients in the control and treatment groups would be necessary
• Secndary intervention trials– If selection is restricted to patients with RTV only, 72 patients in each arm would
be necessary, to detect a 50% increase in graft survival from 55.1% to 77.5%
– 217 patients in each group will be needed to detect a 50% survival increase from 81.1% to 90.5% in 5 years when all patients with CAN with or without RTV included
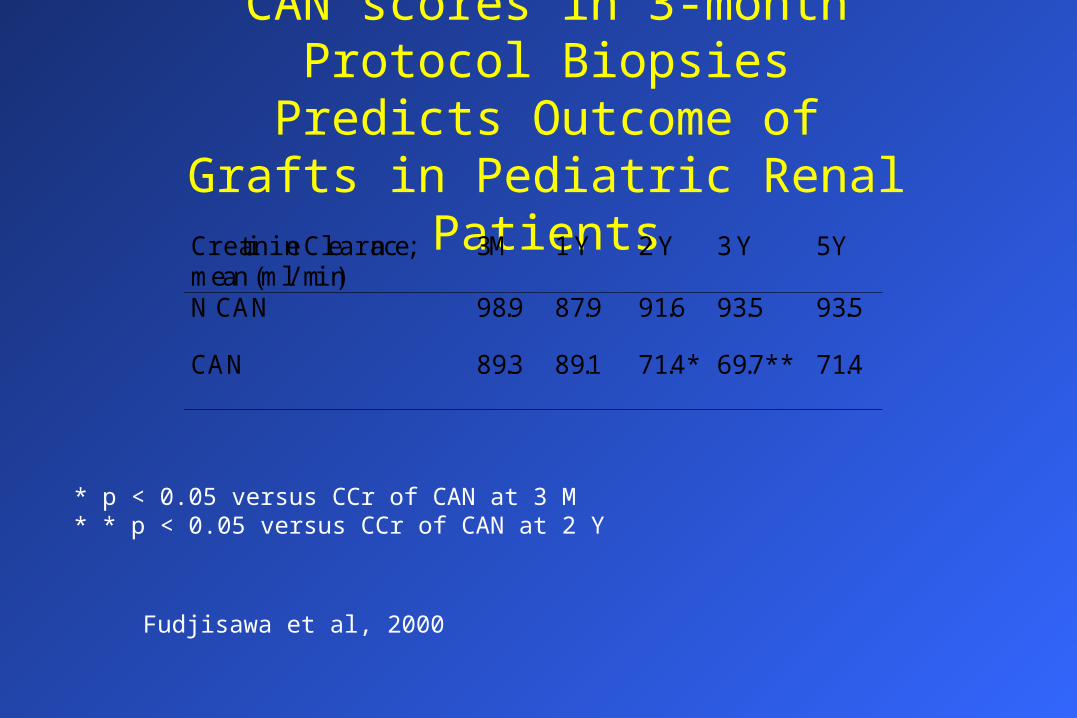
CAN scores in 3-month Protocol Biopsies Predicts Outcome of Grafts
in Pediatric Renal PatientsCreatinine Clearance;mean (ml/min)
3M 1 Y 2 Y 3 Y 5Y
N CAN 98.9 87.9 91.6 93.5 93.5
CAN 89.3 89.1 71.4* 69.7** 71.4
Fudjisawa et al, 2000
* p < 0.05 versus CCr of CAN at 3 M* * p < 0.05 versus CCr of CAN at 2 Y
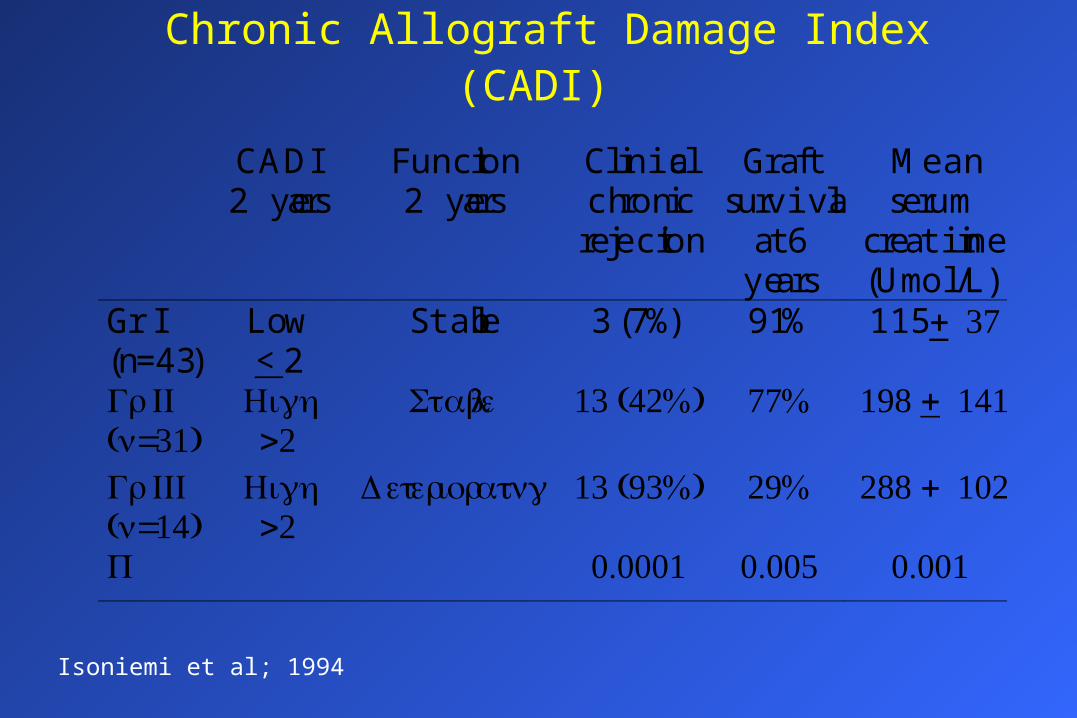
Chronic Allograft Damage Index (CADI)
CADI2 years
Function2 years
Clinicalchronic
rejection
Graftsurvival
at 6years
Meanserum
creatinine(Umol/L)
Gr I(n=43)
Low< 2
Stable 3 (7%) 91% 115 + 37
Gr II(n=31)
High>2
Stable 13 (42%) 77% 198 + 141
Gr III(n=14)
High>2
Deteriorating 13 (93%) 29% 288 + 102
P 0.0001 0.005 0.001
Isoniemi et al; 1994

CAN Scores: Potential Application
• Scores for CAN can be used as a primary efficacy endpoint in trials aimed at prevention or treatment of CAN
• CAN represents the collective effect of immunologic, hemodynamic, metabolic, baseline kidney status. It is an important tool to control the effect of therapeutic maneuvers
• Estimation of CAN in protocol biopsies for enrolment in large intervention studies aimed at prevention or modification the natural history of CAN, may allow reduction in the time of follow up of patients and a significant reduction in sample size
• Question the use of protocol biopsies in clinical practice

Grades and Scores in Clinical Practice

Components Scores and Sum Scores Correlate with Response to Steroids - University of Tennessee
0
1
2
3
4
5
6
SUM AG AI AT AV
SensitiveResistent
Gaber et al, 1996
*
**
* P= 0.04** P= 0.02
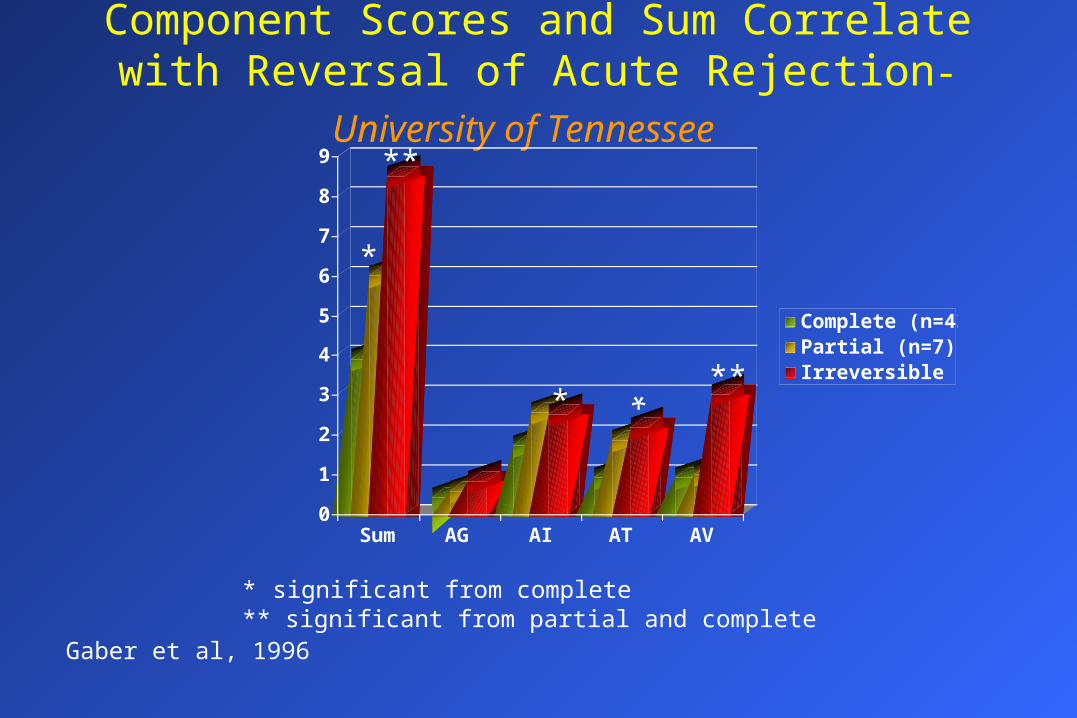
Component Scores and Sum Correlate with Reversal of Acute Rejection- University of Tennessee
0
1
2
3
4
5
6
7
8
9
Sum AG AI AT AV
Complete (n=43)Partial (n=7)Irreversible (n=6)**
*
*
*
**
Gaber et al, 1996
* significant from complete** significant from partial and complete
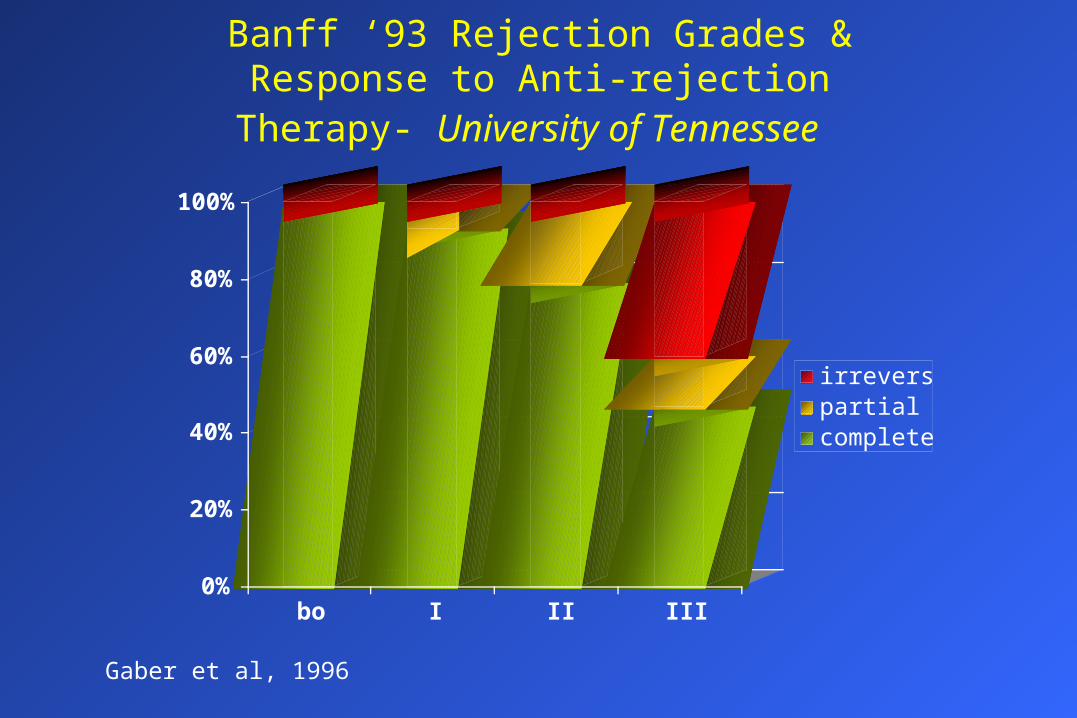
Banff ‘93 Rejection Grades & Response to Anti-rejection Therapy- University of Tennessee
0%
20%
40%
60%
80%
100%
bo I II III
irreversiblepartialcomplete
Gaber et al, 1996

Validity of Banff ‘93 Schema in Clinical Practice- University of Tennessee
• Sum scores correlate with rejection reversal– Mean Sum for complete reversal was 3.9, partial 6.0,
irreversible 8.5
– Vascular scores were significantly higher in irreversible rejection compared to partial or completely reversed rejection (mean 3.0 versus 1.0)
• Resolution of rejection by steroids versus the need for added OKT3 was correlated with low vascular score (0.65 versus 1.4) and low Sum (3.7 versus 5.2)

Validity of Banff ‘93 Schema in Clinical Practice- University of Tennessee
• Correlation between the sum scores and grades of acute rejection – Borderline (Sum 1.6 + 0.5)
– Grade I (Sum 3.3 + 0.4)
– Grade II (Sum 4.2 + 0.3)
– Grade III (Sum 8.5 + 0.4)

At and Av in Banff’ 97- University of Pittsburgh
• Acute cellular rejection with mild or moderate tubulitis (Banff 97 IA) have better prognosis than acute cellular rejection with severe tubulitis (Banff 97 IB)
• No differences between acute rejection with t3 (Banff IB) and rejection with mild vasculitis v 1(Banff IIA) in terms of rejection reversal, 12-month creatinine or graft loss
• Rejection with moderate (Banff IIB) or severe intimal arteritis (Banff III) was associated with the worst outcome
Randhawa, AST 2000

Acute Glomerulitis in Renal Allografts; Johns Hopkins
Acute glomerulitis Negative AG P
Incidence 42% 58%
Age 40.0 ± 15.8 46.8 ± 15.9
Caucasian Race 38.9% 56%
HLA mismatches 3.7 ± 2 3.7 ± 1.2
Delayed Graft Function 86.9% 61.1% 0.03
Retransplants 1.56 1.14 0.01
No previous AR 88% 52% 0.009
# of previous AR 0.24 0.58 0.009
Graft survival, months 31.4 46.9 0.02
Graft Failure 35% 19%
Zachary, Racusen AST, 2000
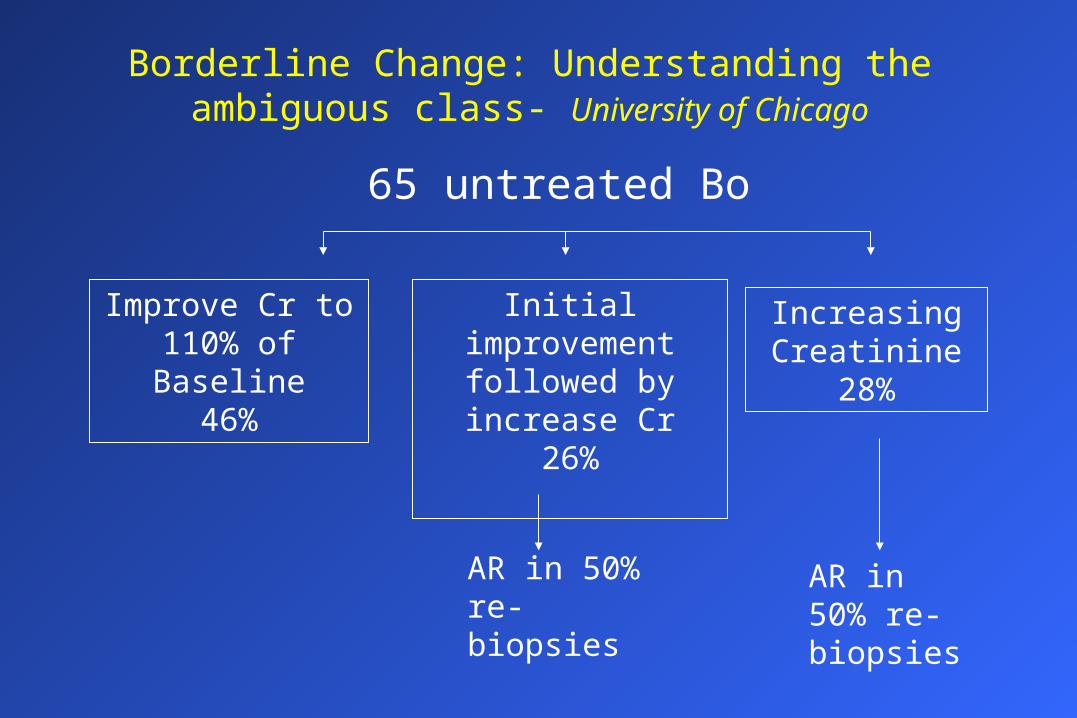
Borderline Change: Understanding the ambiguous class- University of Chicago
65 untreated Bo
Improve Cr to 110% of Baseline
46%
Initial improvement followed by increase
Cr26%
AR in 50% re-biopsies
Increasing Creatinine
28%
AR in 50% re-biopsies

Untreated Borderline lesions: University of Chicago
• Incidence of BO: 17%• Common concomitant lesions
– Nephrotoxicity
– ATN
– Urinary tract obstruction
– CAN
• Risk Factors for progression to rejection– Acute glomerulitis
– Banff acute score >2

Sum Scores & Components’ Scores For Prognostic Studies
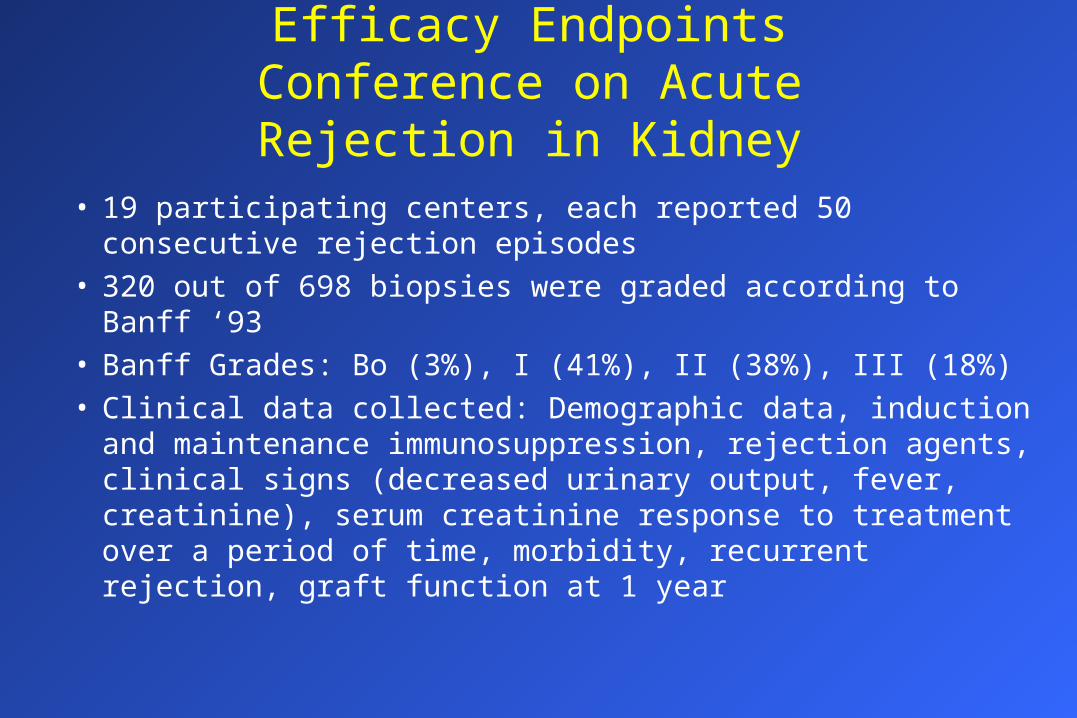
Efficacy Endpoints Conference on Acute Rejection in Kidney
• 19 participating centers, each reported 50 consecutive rejection episodes
• 320 out of 698 biopsies were graded according to Banff ‘93• Banff Grades: Bo (3%), I (41%), II (38%), III (18%) • Clinical data collected: Demographic data, induction and
maintenance immunosuppression, rejection agents, clinical signs (decreased urinary output, fever, creatinine), serum creatinine response to treatment over a period of time, morbidity, recurrent rejection, graft function at 1 year
Frequency of Clinical Signs During Rejection & Histologic Severity
Schroeder et al, for the Efficacy Endpoint Conference

Scores in Assessment of Acute Rejection
SingleRejection
Recurrent Acute Rejection
First Second ThirdSum 4.5 ± 0.4 3.0 ± 0.8 4.9 ± 0.8 7.8 ± 1.3
AG 0.4 ± 0.2 0.6 ± 0.3 0.4 0.3 1.3 ± 0.5
AI 1.8 ± 0.2 1.2 ± 0.2 2.2 ± 0.2 2.5 ± 0.4
AT 1.1 ± 0.2 0.6 ± 0.2 1.3 ± 0.2 2.5 ± 0.4
AV 1.2 ± 0.2 0.6 ± 0.3 1.0 ± 0.3 1.5 ± 0.5
Gaber et al;1996
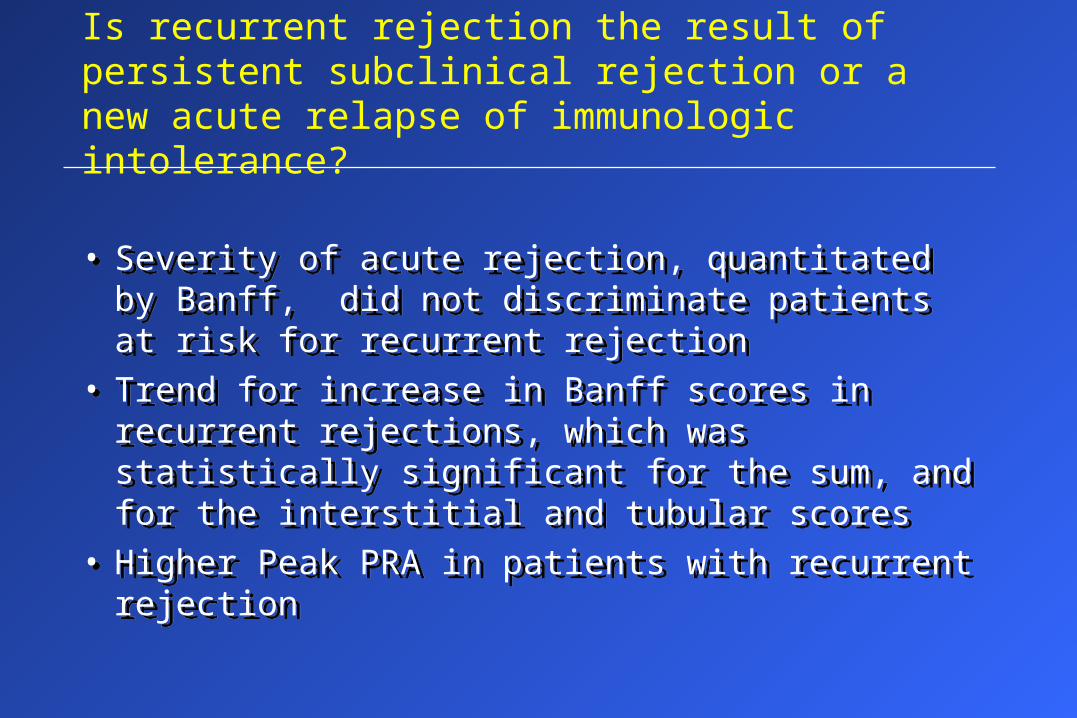
Is recurrent rejection the result of persistent subclinical rejection or a new acute relapse of immunologic intolerance?
• Severity of acute rejection, quantitated by Banff, did not discriminate patients at risk for recurrent rejection
• Trend for increase in Banff scores in recurrent rejections, which was statistically significant for the sum, and for the interstitial and tubular scores
• Higher Peak PRA in patients with recurrent rejection
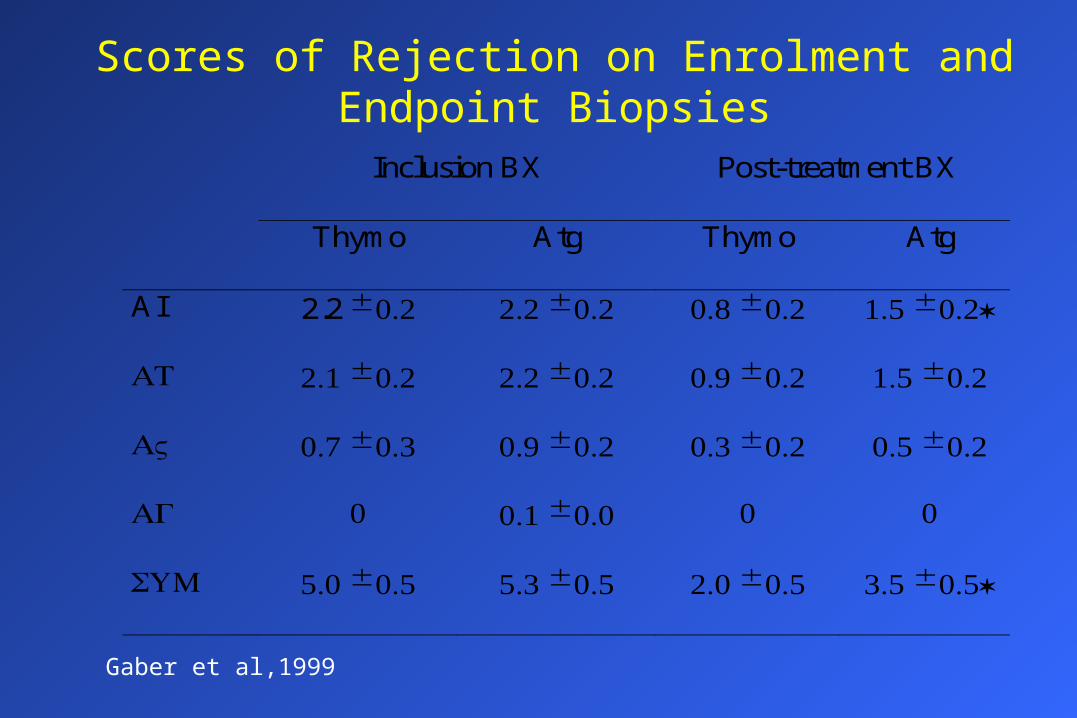
Scores of Rejection on Enrolment and Endpoint Biopsies
Inclusion BX Post-treatment BX
Thymo Atg Thymo Atg
AI 2.2 ± 0.2 2.2 ± 0.2 0.8 ± 0.2 1.5 ± 0.2*
AT 2.1 ± 0.2 2.2 ± 0.2 0.9 ± 0.2 1.5 ± 0.2
AV 0.7 ± 0.3 0.9 ± 0.2 0.3 ± 0.2 0.5 ± 0.2
AG 0 0.1 ± 0.0 0 0
SUM 5.0 ± 0.5 5.3 ± 0.5 2.0 ± 0.5 3.5 ± 0.5*
Gaber et al,1999
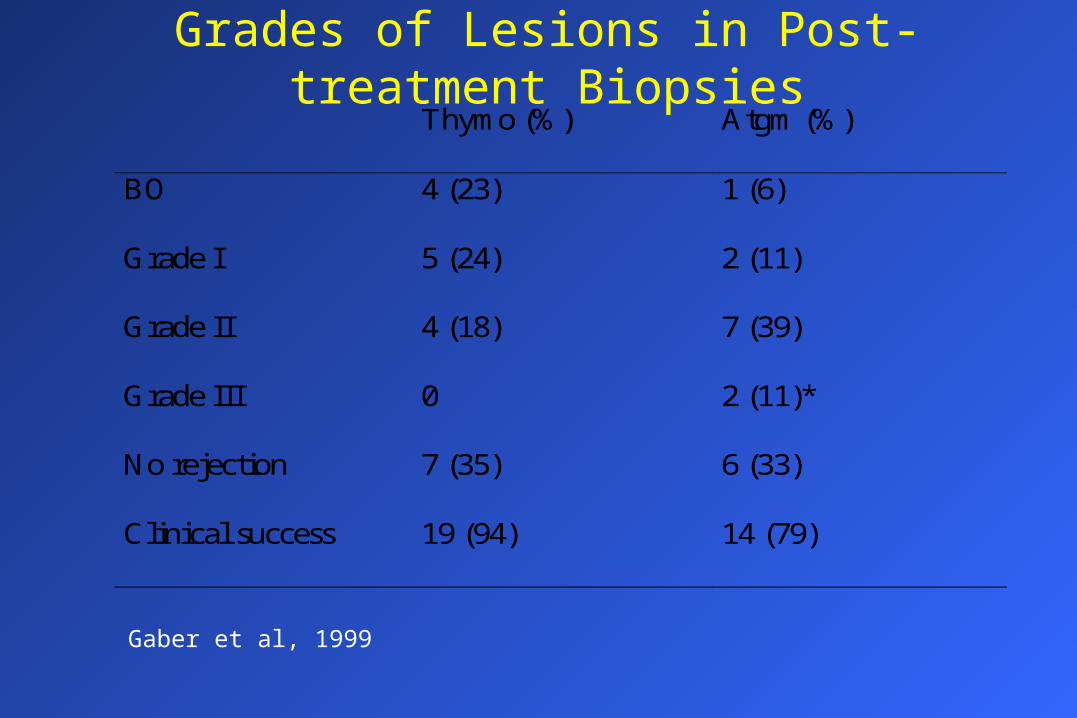
Grades of Lesions in Post-treatment BiopsiesThymo (%) Atgm (%)
BO 4 (23) 1 (6)
Grade I 5 (24) 2 (11)
Grade II 4 (18) 7 (39)
Grade III 0 2 (11)*
No rejection 7 (35) 6 (33)
Clinical success 19 (94) 14 (79)
Gaber et al, 1999
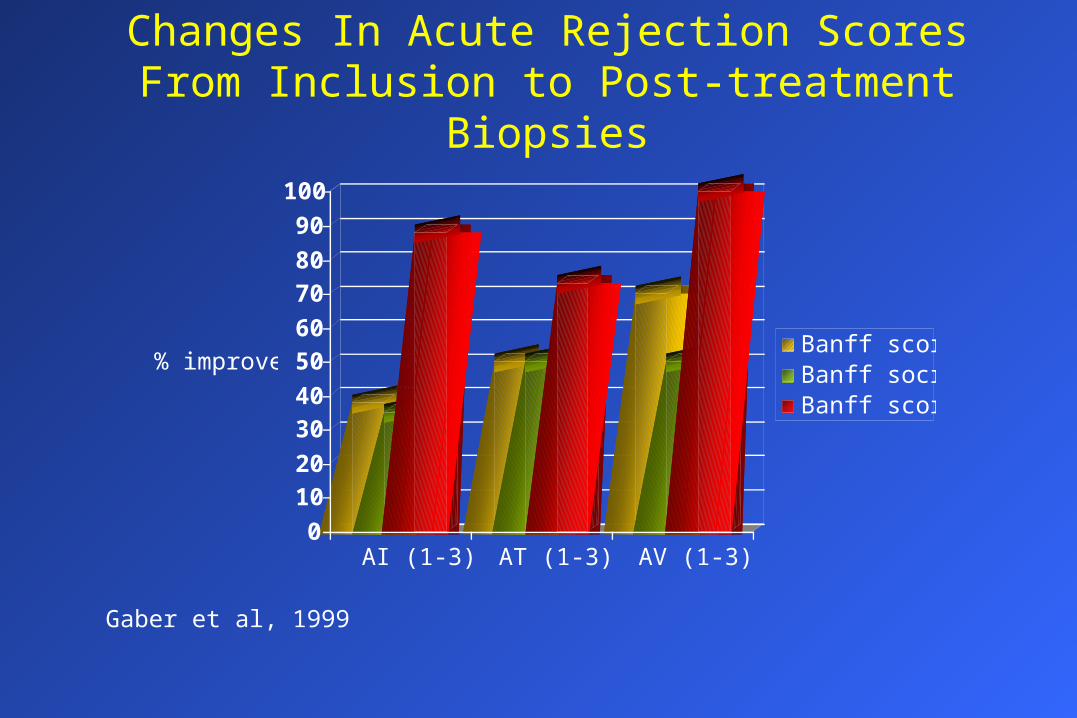
Changes In Acute Rejection Scores From Inclusion to Post-treatment Biopsies
0
10
20
30
40
50
60
70
80
90
100
% improved
AI (1-3) AT (1-3) AV (1-3)
Banff score 1Banff socre 2Banff score 3
Gaber et al, 1999
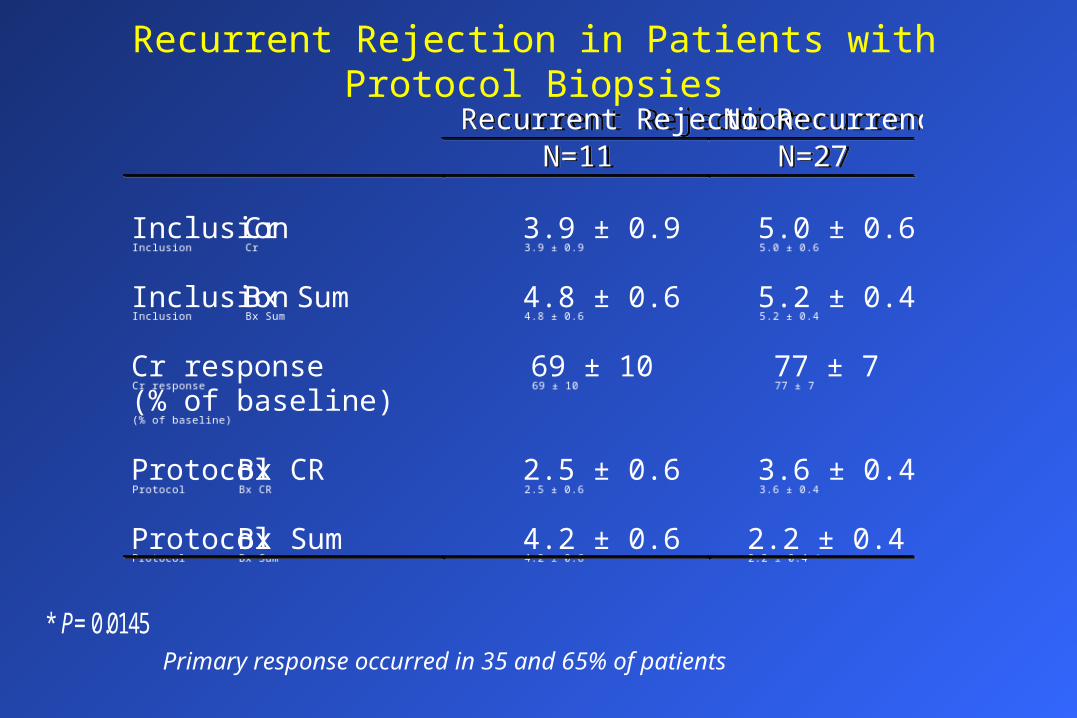
Recurrent Rejection in Patients with Protocol Biopsies
Recurrent Rejection No RecurrenceN=11 N=27
Inclusion Cr 3.9 ± 0.9 5.0 ± 0.6
Inclusion Bx Sum 4.8 ± 0.6 5.2 ± 0.4
Cr response(% of baseline)
69 ± 10 77 ± 7
Protocol Bx CR 2.5 ± 0.6 3.6 ± 0.4
Protocol Bx Sum 4.2 ± 0.6 2.2 ± 0.4 *
Recurrent Rejection No RecurrenceN=11 N=27
Inclusion Cr 3.9 ± 0.9 5.0 ± 0.6
Inclusion Bx Sum 4.8 ± 0.6 5.2 ± 0.4
Cr response(% of baseline)
69 ± 10 77 ± 7
Protocol Bx CR 2.5 ± 0.6 3.6 ± 0.4
Protocol Bx Sum 4.2 ± 0.6 2.2 ± 0.4 *
Primary response occurred in 35 and 65% of patients * P= 0.0145

Recurrent Acute Rejection
• 31% of patients developed a second rejection• Sum scores for residual inflammation in the
protocol post-treatment biopsies were significantly higher in cases with recurrent rejection (4.2 ± 0.6), versus no recurrence (2.2 ± 0.4) [P = 0.015]
• 31% of patients developed a second rejection• Sum scores for residual inflammation in the
protocol post-treatment biopsies were significantly higher in cases with recurrent rejection (4.2 ± 0.6), versus no recurrence (2.2 ± 0.4) [P = 0.015]

2-Year Protocol Biopsies From the U.S. Multicenter Trial Comparing Tacrotimus to Cyclosporine
Tacrolimus Cyclosporine
Acute rejection 8.7% 9.2%
Acute Scores 1.4 1.6
I + T 1.4 1.5
CAN Scores 1.8 2.0
Solez for FK 506 Study Group, 1998

Histologic Improvement by Steroids According to Acute Rejection Severity
Mazzucchi et al; 1999
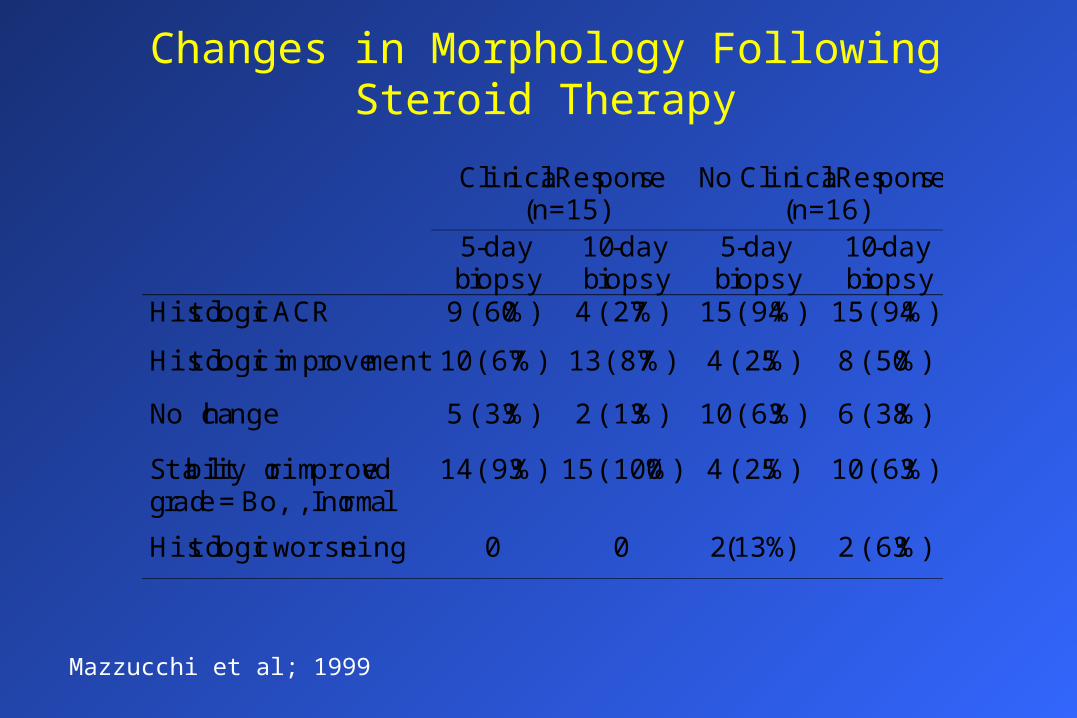
Changes in Morphology Following Steroid Therapy
Clinical Response(n=15)
No Clinical Response(n=16)
5-daybiopsy
10-daybiopsy
5-daybiopsy
10-daybiopsy
Histologic ACR 9 (60%) 4 (27%) 15 (94%) 15 (94%)
Histologic improvement 10 (67%) 13 (87%) 4 (25%) 8 (50%)
No change 5 (33%) 2 (13%) 10 (63%) 6 (38%)
Stability or improvedgrade = Bo, I, normal
14 (93%) 15 (100%) 4 (25%) 10 (63%)
Histologic worsening 0 0 2(13%) 2 (63%)
Mazzucchi et al; 1999

Conclusions• Evidence to support the validity of grading and scoring of acute
rejection to direct therapy choices as adjuncts to pathologic diagnosis
• Grades and individual scores for acute and chronic lesions in the kidney correlate with graft survival
• Potential of monitoring patients by protocol biopsies
• Scores and Sum are an easy and cheap way to screen pathology reports
• Force detailed analysis of lesions
• Digitization of morphologic data for statistical analysis
• Patients selection in clinical efficacy trials
• Endpoint in large prospective clinical trials
Recommended