1
WAT E R S SO LU T IO NS
XBridge® Protein BEH SEC 200Å
and 450Å, 3.5 µm Columns
ACQUITY UPLC® Protein BEH SEC, 200Å,
1.7 µm, and 450Å, 2.5 µm Columns
Alliance® HPLC System
ACQUITY UPLC H-Class Bio System
Empower® 3 Software
Waters BEH200 and BEH450 SEC Protein
Standard Mixture and mAb Standard
K E Y W O R D S
Size-exclusion chromatography, UPLC,
HPLC, method transfer, aggregates
A P P L I C AT IO N B E N E F I T S■■ Seamless scalability and transfer
of protein SEC methods between
UPLC and HPLC instrumentation
■■ Simplifying method transfer
between laboratories with
different instrumentation
■■ Enabling UPLC method scale-up
for peak characterization
■■ 200Å and 450Å pore sizes provide
a broad protein size separation range
IN T RO DU C T IO N
Over the last several years Waters has produced the highest resolving and highest
sample throughput size-exclusion chromatography (SEC) columns available for
protein and peptide analysis.1,2 These size-exclusion UPLC® (SE-UPLC) columns
consist of 1.7 µm diameter ethylene bridged hybrid (BEH) particles with 200Å
or 125Å pore sizes, or a 2.5 µm diameter BEH particle with a 450Å pore
size. Based on observations, SE-UPLC technology has been adopted in many
biopharmaceutical analytical laboratories as an important tool to monitor protein
aggregation during product development due to the high sample throughput that
it provides. However, often times SE-UPLC methods cannot be transferred to
other laboratories due to the lack of available UPLC instrumentation. Therefore,
in an effort to provide the capability to transfer SEC methods between UPLC and
HPLC instruments, Waters has introduced 3.5 µm particle diameter BEH-based
size-exclusion HPLC (SE-HPLC) columns specifically for use on traditional HPLC
instrumentation. These columns provide the analyst with the unique capability to
use consistent particle chemistries that can be directly scaled between HPLC and
UPLC instrumentation. This application note will highlight the considerations that
must be made when transferring an SEC method between UPLC and HPLC columns
and systems.
Successful Transfer of Size-Exclusion Separations Between HPLC and UPLC Stephan Koza, Susan Serpa, Edouard Bouvier, and Kenneth J. FountainWaters Corporation, Milford, MA, USA
2Successful Transfer of Size-Exclusion Separations Between HPLC and UPLC
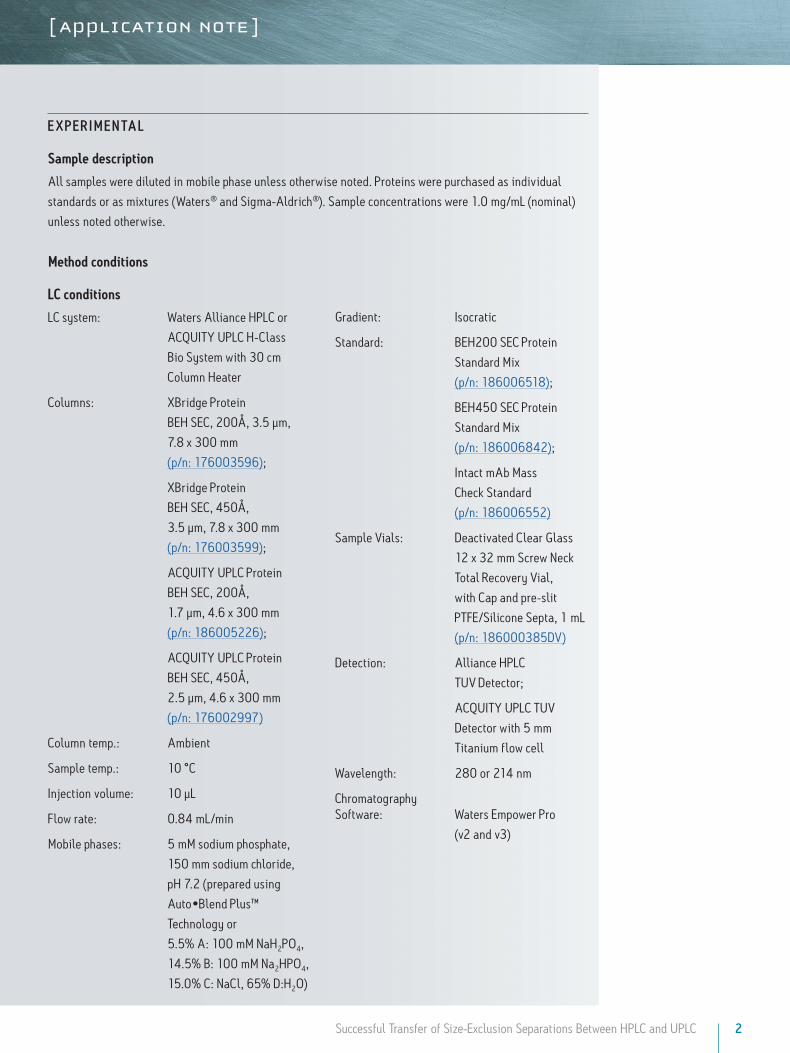
E X P E R IM E N TA L
Sample description
All samples were diluted in mobile phase unless otherwise noted. Proteins were purchased as individual
standards or as mixtures (Waters® and Sigma-Aldrich®). Sample concentrations were 1.0 mg/mL (nominal)
unless noted otherwise.
Method conditions
LC conditions
LC system: Waters Alliance HPLC or
ACQUITY UPLC H-Class
Bio System with 30 cm
Column Heater
Columns: XBridge Protein
BEH SEC, 200Å, 3.5 µm,
7.8 x 300 mm
(p/n: 176003596);
XBridge Protein
BEH SEC, 450Å,
3.5 µm, 7.8 x 300 mm
(p/n: 176003599);
ACQUITY UPLC Protein
BEH SEC, 200Å,
1.7 µm, 4.6 x 300 mm
(p/n: 186005226);
ACQUITY UPLC Protein
BEH SEC, 450Å,
2.5 µm, 4.6 x 300 mm
(p/n: 176002997)
Column temp.: Ambient
Sample temp.: 10 °C
Injection volume: 10 µL
Flow rate: 0.84 mL/min
Mobile phases: 5 mM sodium phosphate,
150 mm sodium chloride,
pH 7.2 (prepared using
Auto•Blend Plus™
Technology or
5.5% A: 100 mM NaH2PO4,
14.5% B: 100 mM Na2HPO4,
15.0% C: NaCl, 65% D:H2O)
Gradient: Isocratic
Standard: BEH200 SEC Protein
Standard Mix
(p/n: 186006518);
BEH450 SEC Protein
Standard Mix
(p/n: 186006842);
Intact mAb Mass
Check Standard
(p/n: 186006552)
Sample Vials: Deactivated Clear Glass
12 x 32 mm Screw Neck
Total Recovery Vial,
with Cap and pre-slit
PTFE/Silicone Septa, 1 mL
(p/n: 186000385DV)
Detection: Alliance HPLC
TUV Detector;
ACQUITY UPLC TUV
Detector with 5 mm
Titanium flow cell
Wavelength: 280 or 214 nm
Chromatography Software: Waters Empower Pro
(v2 and v3)
3Successful Transfer of Size-Exclusion Separations Between HPLC and UPLC
R E SU LT S A N D D IS C U S S IO N
LC system considerations
The performance of the LC system in an SEC separation can have a
significant effect on the quality of the chromatographic resolution
that can be achieved. Fundamentally, this can be represented by
the equation highlighted in Figure 1, which has been adapted from
Gritti and Guiochon.3 From this equation, the total peak variance
s2Total can be derived from the sum of the peak variances that occur
prior to the analyte reaching the column (s2Pre-Column), on the column
(s2Column), and after the analyte elutes off of the column (s2
Post-Column).
Using this relationship, it can be readily derived that as the
peak variance contributions from extra-column dispersion
(s2Pre-Column and s2
Post-Column) increase and become significant
relative to the variance that occurs on the column (s2Column),
that the SEC separation efficiency will be measurably reduced.
Another important concept illustrated by Figure 1 is the additive
characteristic of both the pre-column and post-column variances in
SEC. This is due to the absence of significant binding interactions
between the analyte and the particle surface in SEC. Conversely,
in other bind-and-elute based protein separations such as
reversed-phase or ion-exchange chromatography, the contributions
of s2Pre-Column become far less significant due to the strong binding-
driven, analyte refocusing that occurs at the head of the column.
2
Total 2
Pre-Column 2
Post-Column = + + 2
Column
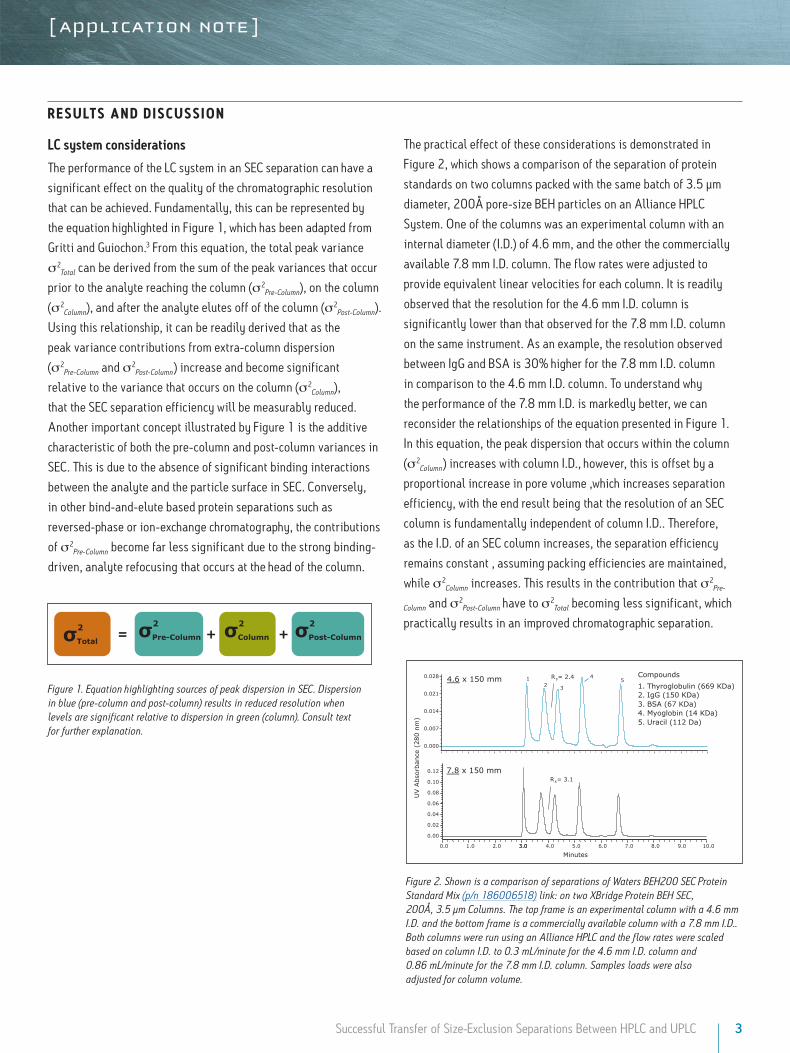
Figure 1. Equation highlighting sources of peak dispersion in SEC. Dispersion in blue (pre-column and post-column) results in reduced resolution when levels are significant relative to dispersion in green (column). Consult text for further explanation.
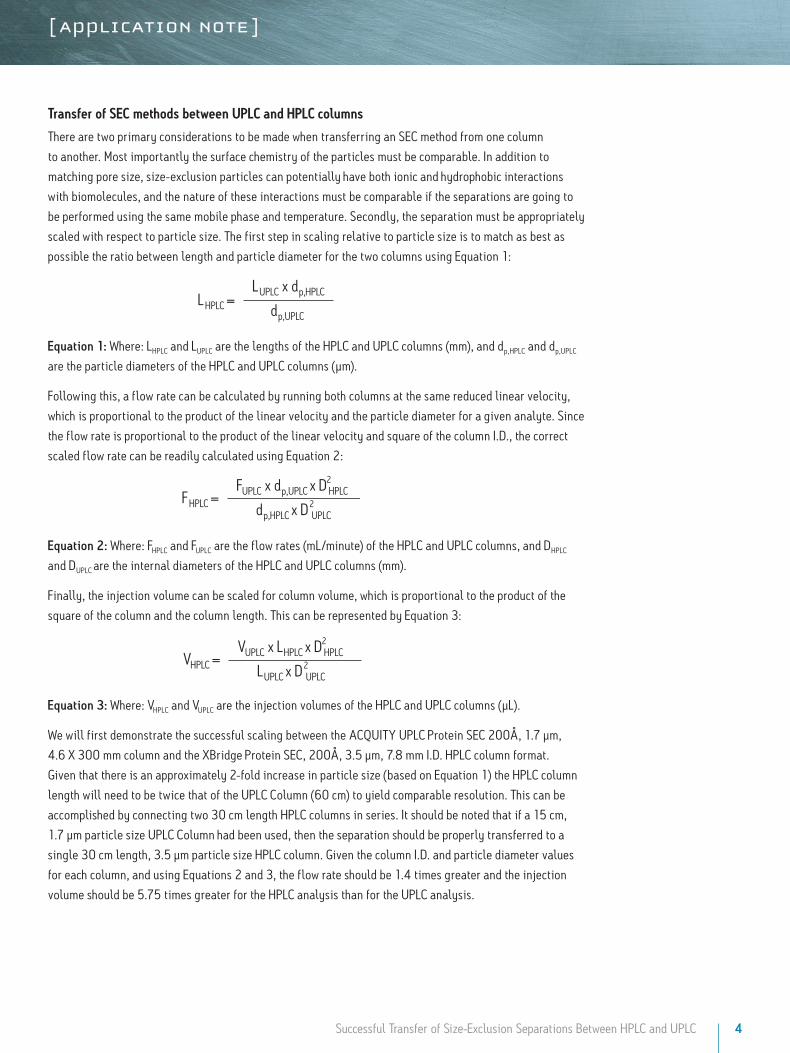
Figure 2. Shown is a comparison of separations of Waters BEH200 SEC Protein Standard Mix (p/n 186006518) link: on two XBridge Protein BEH SEC, 200Å, 3.5 µm Columns. The top frame is an experimental column with a 4.6 mm I.D. and the bottom frame is a commercially available column with a 7.8 mm I.D.. Both columns were run using an Alliance HPLC and the flow rates were scaled based on column I.D. to 0.3 mL/minute for the 4.6 mm I.D. column and 0.86 mL/minute for the 7.8 mm I.D. column. Samples loads were also adjusted for column volume.
The practical effect of these considerations is demonstrated in
Figure 2, which shows a comparison of the separation of protein
standards on two columns packed with the same batch of 3.5 µm
diameter, 200Å pore-size BEH particles on an Alliance HPLC
System. One of the columns was an experimental column with an
internal diameter (I.D.) of 4.6 mm, and the other the commercially
available 7.8 mm I.D. column. The flow rates were adjusted to
provide equivalent linear velocities for each column. It is readily
observed that the resolution for the 4.6 mm I.D. column is
significantly lower than that observed for the 7.8 mm I.D. column
on the same instrument. As an example, the resolution observed
between IgG and BSA is 30% higher for the 7.8 mm I.D. column
in comparison to the 4.6 mm I.D. column. To understand why
the performance of the 7.8 mm I.D. is markedly better, we can
reconsider the relationships of the equation presented in Figure 1.
In this equation, the peak dispersion that occurs within the column
(s2Column) increases with column I.D., however, this is offset by a
proportional increase in pore volume ,which increases separation
efficiency, with the end result being that the resolution of an SEC
column is fundamentally independent of column I.D.. Therefore,
as the I.D. of an SEC column increases, the separation efficiency
remains constant , assuming packing efficiencies are maintained,
while s2Column increases. This results in the contribution that s2
Pre-
Column and s2Post-Column have to s2
Total becoming less significant, which
practically results in an improved chromatographic separation.
UV A
bsor
banc
e (2
80 n
m)
0.0 1.0 2.0 3.0 4.0 5.0 6.0 7.0 8.0 9.0 10.0
0.00
0.02
0.04
0.06
0.08
0.10
0.12
Minutes 3.0
Rs= 3.1 7.8 x 150 mm
0.000
0.007
0.014
0.021
0.028 4.6 x 150 mm Rs= 2.4 1 2 3
4 5
Compounds
1. Thyroglobulin (669 KDa) 2. IgG (150 KDa) 3. BSA (67 KDa) 4. Myoglobin (14 KDa) 5. Uracil (112 Da)
4Successful Transfer of Size-Exclusion Separations Between HPLC and UPLC
Transfer of SEC methods between UPLC and HPLC columns
There are two primary considerations to be made when transferring an SEC method from one column
to another. Most importantly the surface chemistry of the particles must be comparable. In addition to
matching pore size, size-exclusion particles can potentially have both ionic and hydrophobic interactions
with biomolecules, and the nature of these interactions must be comparable if the separations are going to
be performed using the same mobile phase and temperature. Secondly, the separation must be appropriately
scaled with respect to particle size. The first step in scaling relative to particle size is to match as best as
possible the ratio between length and particle diameter for the two columns using Equation 1:
Equation 1: Where: LHPLC and LUPLC are the lengths of the HPLC and UPLC columns (mm), and dp,HPLC and dp,UPLC
are the particle diameters of the HPLC and UPLC columns (µm).
Following this, a flow rate can be calculated by running both columns at the same reduced linear velocity,
which is proportional to the product of the linear velocity and the particle diameter for a given analyte. Since
the flow rate is proportional to the product of the linear velocity and square of the column I.D., the correct
scaled flow rate can be readily calculated using Equation 2:
Equation 2: Where: FHPLC and FUPLC are the flow rates (mL/minute) of the HPLC and UPLC columns, and DHPLC
and DUPLC are the internal diameters of the HPLC and UPLC columns (mm).
Finally, the injection volume can be scaled for column volume, which is proportional to the product of the
square of the column and the column length. This can be represented by Equation 3:
Equation 3: Where: VHPLC and VUPLC are the injection volumes of the HPLC and UPLC columns (µL).
We will first demonstrate the successful scaling between the ACQUITY UPLC Protein SEC 200Å, 1.7 µm,
4.6 X 300 mm column and the XBridge Protein SEC, 200Å, 3.5 µm, 7.8 mm I.D. HPLC column format.
Given that there is an approximately 2-fold increase in particle size (based on Equation 1) the HPLC column
length will need to be twice that of the UPLC Column (60 cm) to yield comparable resolution. This can be
accomplished by connecting two 30 cm length HPLC columns in series. It should be noted that if a 15 cm,
1.7 µm particle size UPLC Column had been used, then the separation should be properly transferred to a
single 30 cm length, 3.5 µm particle size HPLC column. Given the column I.D. and particle diameter values
for each column, and using Equations 2 and 3, the flow rate should be 1.4 times greater and the injection
volume should be 5.75 times greater for the HPLC analysis than for the UPLC analysis.
L HPLC =LUPLC x dp,HPLC
dp,UPLC
F HPLC =FUPLC x dp,UPLC x D2
HPLC
dp,HPLC x D2UPLC
VHPLC =VUPLC x LHPLC x D2
HPLC
LUPLC x D2UPLC
L HPLC =LUPLC x dp,HPLC
dp,UPLC
F HPLC =FUPLC x dp,UPLC x D2
HPLC
dp,HPLC x D2UPLC
VHPLC =VUPLC x LHPLC x D2
HPLC
LUPLC x D2UPLC
L HPLC =LUPLC x dp,HPLC
dp,UPLC
F HPLC =FUPLC x dp,UPLC x D2
HPLC
dp,HPLC x D2UPLC
VHPLC =VUPLC x LHPLC x D2
HPLC
LUPLC x D2UPLC
5Successful Transfer of Size-Exclusion Separations Between HPLC and UPLC
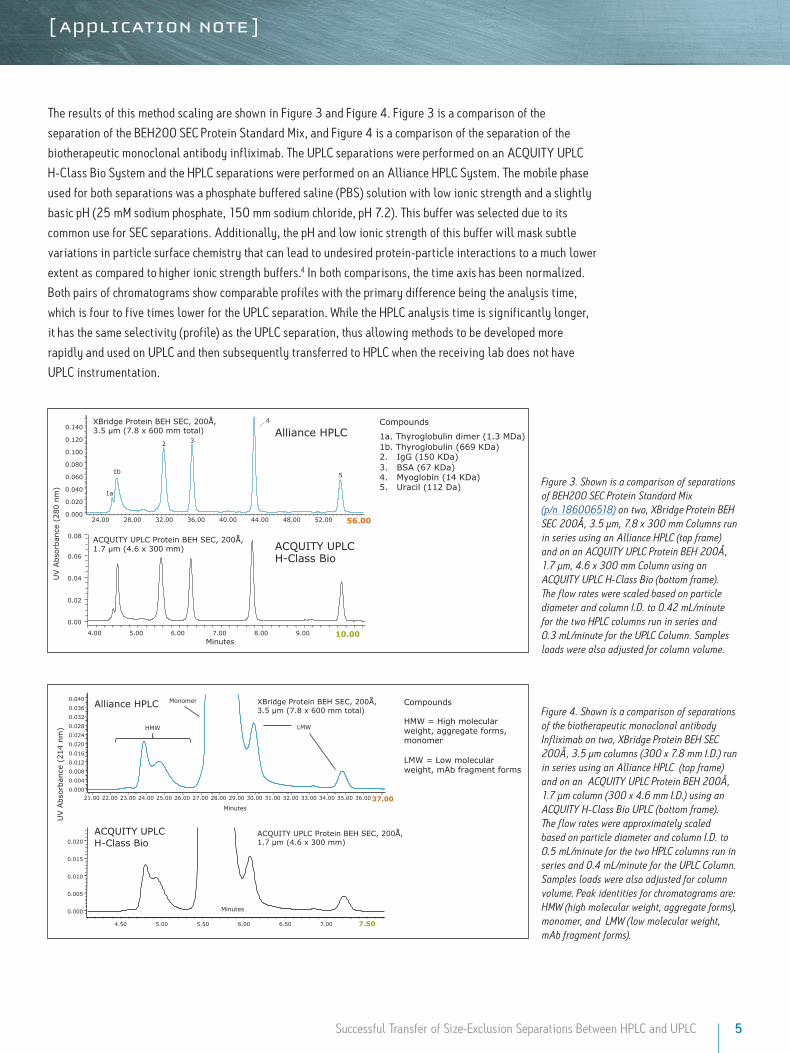
The results of this method scaling are shown in Figure 3 and Figure 4. Figure 3 is a comparison of the
separation of the BEH200 SEC Protein Standard Mix, and Figure 4 is a comparison of the separation of the
biotherapeutic monoclonal antibody infliximab. The UPLC separations were performed on an ACQUITY UPLC
H-Class Bio System and the HPLC separations were performed on an Alliance HPLC System. The mobile phase
used for both separations was a phosphate buffered saline (PBS) solution with low ionic strength and a slightly
basic pH (25 mM sodium phosphate, 150 mm sodium chloride, pH 7.2). This buffer was selected due to its
common use for SEC separations. Additionally, the pH and low ionic strength of this buffer will mask subtle
variations in particle surface chemistry that can lead to undesired protein-particle interactions to a much lower
extent as compared to higher ionic strength buffers.4 In both comparisons, the time axis has been normalized.
Both pairs of chromatograms show comparable profiles with the primary difference being the analysis time,
which is four to five times lower for the UPLC separation. While the HPLC analysis time is significantly longer,
it has the same selectivity (profile) as the UPLC separation, thus allowing methods to be developed more
rapidly and used on UPLC and then subsequently transferred to HPLC when the receiving lab does not have
UPLC instrumentation.
UV A
bsor
banc
e (2
80 n
m)
0.00 0.02 0.04 0.06
Minutes 4.00 5.00 6.00 7.00 8.00 9.00 10.00
0.000 0.020 0.040 0.060 0.080 0.100 0.120 0.140
24.00 28.00 32.00 36.00 40.00 44.00 48.00 52.00 56.00
0.08
XBridge Protein BEH SEC, 200Å, 3.5 m (7.8 x 600 mm total)
ACQUITY UPLC Protein BEH SEC, 200Å, 1.7 m (4.6 x 300 mm)
1a
1b
2 3
4
5
ACQUITY UPLC H-Class Bio
Alliance HPLC Compounds
1a. Thyroglobulin dimer (1.3 MDa) 1b. Thyroglobulin (669 KDa) 2. IgG (150 KDa) 3. BSA (67 KDa) 4. Myoglobin (14 KDa) 5. Uracil (112 Da)
UV A
bsor
banc
e (2
14 n
m)
0.000
0.004
0.008
0.012
0.016
0.020
0.024
0.028
0.032
0.036
0.040
Minutes
22.00 23.00 24.00 25.00 26.00 27.00 28.00 29.00 30.00 31.00 32.00 33.00 34.00 35.00 36.00 37.00 21.00
0.000
0.005
0.010
0.015
0.020
4.50 5.00 5.50 6.00 6.50 7.00 7.50
HMW
Monomer
LMW
Minutes
ACQUITY UPLC H-Class Bio
Alliance HPLC XBridge Protein BEH SEC, 200Å, 3.5 m (7.8 x 600 mm total)
ACQUITY UPLC Protein BEH SEC, 200Å, 1.7 m (4.6 x 300 mm)
Compounds HMW = High molecular weight, aggregate forms, monomer LMW = Low molecular weight, mAb fragment forms
Figure 3. Shown is a comparison of separations of BEH200 SEC Protein Standard Mix (p/n 186006518) on two, XBridge Protein BEH SEC 200Å, 3.5 µm, 7.8 x 300 mm Columns run in series using an Alliance HPLC (top frame) and on an ACQUITY UPLC Protein BEH 200Å, 1.7 µm, 4.6 x 300 mm Column using an ACQUITY UPLC H-Class Bio (bottom frame). The flow rates were scaled based on particle diameter and column I.D. to 0.42 mL/minute for the two HPLC columns run in series and 0.3 mL/minute for the UPLC Column. Samples loads were also adjusted for column volume.
Figure 4. Shown is a comparison of separations of the biotherapeutic monoclonal antibody Infliximab on two, XBridge Protein BEH SEC 200Å, 3.5 µm columns (300 x 7.8 mm I.D.) run in series using an Alliance HPLC (top frame) and on an ACQUITY UPLC Protein BEH 200Å, 1.7 µm column (300 x 4.6 mm I.D.) using an ACQUITY H-Class Bio UPLC (bottom frame). The flow rates were approximately scaled based on particle diameter and column I.D. to 0.5 mL/minute for the two HPLC columns run in series and 0.4 mL/minute for the UPLC Column. Samples loads were also adjusted for column volume. Peak identities for chromatograms are: HMW (high molecular weight, aggregate forms), monomer, and LMW (low molecular weight, mAb fragment forms).
6Successful Transfer of Size-Exclusion Separations Between HPLC and UPLC
Next, we present the transfer between an ACQUITY UPLC Protein BEH SEC, 450Å, 2.5 µm, 4.6 x 300mm,
column and the XBridge Protein BEH SEC, 450Å, 3.5 µm particle size, 7.8 mm I.D. HPLC column format. Using
Equation 1, the length of the HPLC column should be 42 cm, which can be approximated by connecting a
30 cm and a 15 cm XBridge SEC, 3.5 µm Column in series. In the event that the method transfer is from a
15 cm length, 2.5 µm UPLC Column, the appropriate length HPLC column would be 21 cm, which is not an
available configuration. In this case, a 30 cm HPLC column could be used. However, if matching reduced
linear velocities were used, the resolution for the HPLC column should be approximately 20% greater,
as the resolution difference is approximately proportional to the square root of compared column lengths.
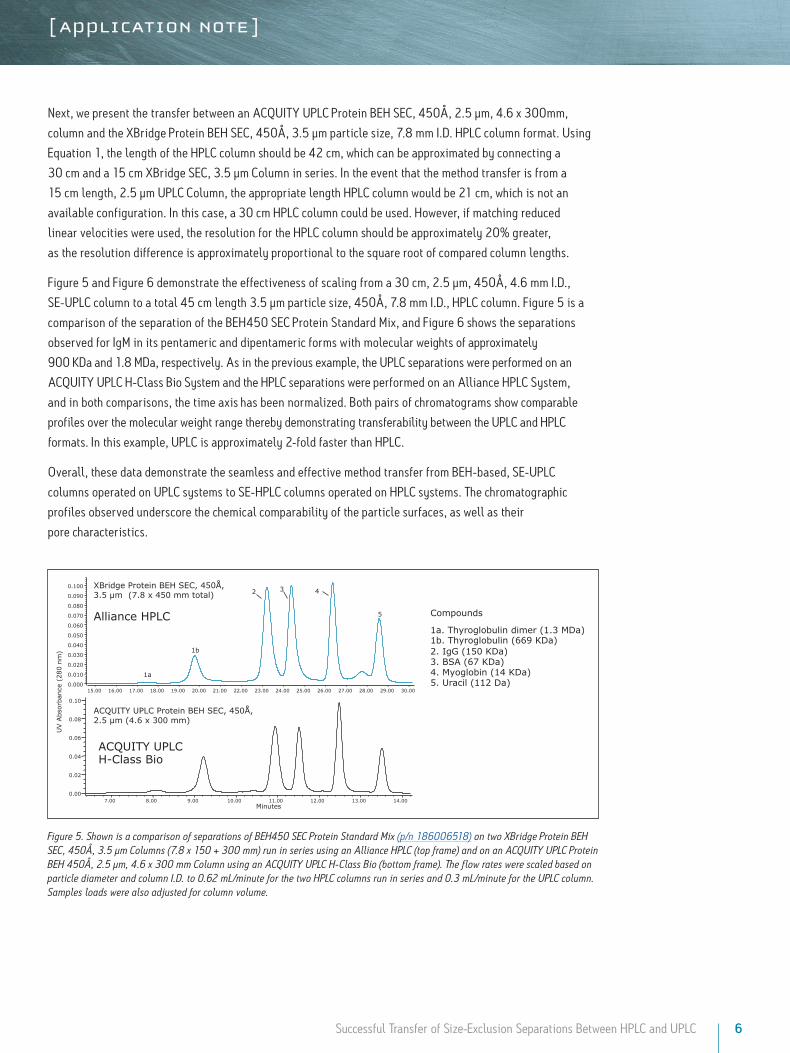
Figure 5 and Figure 6 demonstrate the effectiveness of scaling from a 30 cm, 2.5 µm, 450Å, 4.6 mm I.D.,
SE-UPLC column to a total 45 cm length 3.5 µm particle size, 450Å, 7.8 mm I.D., HPLC column. Figure 5 is a
comparison of the separation of the BEH450 SEC Protein Standard Mix, and Figure 6 shows the separations
observed for IgM in its pentameric and dipentameric forms with molecular weights of approximately
900 KDa and 1.8 MDa, respectively. As in the previous example, the UPLC separations were performed on an
ACQUITY UPLC H-Class Bio System and the HPLC separations were performed on an Alliance HPLC System,
and in both comparisons, the time axis has been normalized. Both pairs of chromatograms show comparable
profiles over the molecular weight range thereby demonstrating transferability between the UPLC and HPLC
formats. In this example, UPLC is approximately 2-fold faster than HPLC.
Overall, these data demonstrate the seamless and effective method transfer from BEH-based, SE-UPLC
columns operated on UPLC systems to SE-HPLC columns operated on HPLC systems. The chromatographic
profiles observed underscore the chemical comparability of the particle surfaces, as well as their
pore characteristics.
UV A
bsor
banc
e (2
80 n
m)
0.00
0.02
0.04
0.06
0.08
0.10
Minutes 7.00 8.00 9.00 10.00 11.00 12.00 13.00 14.00
0.000
0.010
0.020
0.030
0.040
0.050
0.060
0.070
0.080
0.090
0.100
15.00 16.00 17.00 18.00 19.00 20.00 21.00 22.00 23.00 24.00 25.00 26.00 27.00 28.00 29.00 30.00
1a
1b
2 3 4
5
XBridge Protein BEH SEC, 450Å, 3.5 m (7.8 x 450 mm total)
ACQUITY UPLC Protein BEH SEC, 450Å, 2.5 m (4.6 x 300 mm)
ACQUITY UPLC H-Class Bio
Alliance HPLC Compounds
1a. Thyroglobulin dimer (1.3 MDa) 1b. Thyroglobulin (669 KDa) 2. IgG (150 KDa) 3. BSA (67 KDa) 4. Myoglobin (14 KDa) 5. Uracil (112 Da)
Figure 5. Shown is a comparison of separations of BEH450 SEC Protein Standard Mix (p/n 186006518) on two XBridge Protein BEH SEC, 450Å, 3.5 µm Columns (7.8 x 150 + 300 mm) run in series using an Alliance HPLC (top frame) and on an ACQUITY UPLC Protein BEH 450Å, 2.5 µm, 4.6 x 300 mm Column using an ACQUITY UPLC H-Class Bio (bottom frame). The flow rates were scaled based on particle diameter and column I.D. to 0.62 mL/minute for the two HPLC columns run in series and 0.3 mL/minute for the UPLC column. Samples loads were also adjusted for column volume.

Waters Corporation 34 Maple Street Milford, MA 01757 U.S.A. T: 1 508 478 2000 F: 1 508 872 1990 www.waters.com
Waters, T he Science of What’s Possible, UPLC, XBridge, ACQUITY UPLC, Alliance, and Empower are registered trademarks of Waters Corporation. Auto•Blend Plus is a trademark of Waters Corporation. All other trademarks are the property of their respective owners.
©2015 Waters Corporation. Produced in the U.S.A. February 2015 720005214EN AG-PDF
0.00 0.02 0.04 0.06 0.08 0.10 0.12 0.14 0.16 0.18 0.20 0.22 0.24 0.26 0.28 0.30
11.00 12.00 13.00 14.00 15.00 16.00 17.00 18.00 19.00 20.00 21.00
0.00
0.02
0.04
0.06
0.08
0.10
0.12
0.14
0.16
Minutes
5.00 5.50 6.00 6.50 7.00 7.50 8.00 8.50 9.00 9.50 10.00
UV A
bsor
banc
e (2
14 n
m)
Aggregates
IgM Dipentamer
IgM Pentamer
XBridge Protein BEH SEC, 450Å, 3.5 m (7.8 x 450 mm total)
ACQUITY UPLC Protein BEH SEC, 450Å, 2.5 m (4.6 x 300 mm)
ACQUITY UPLC H-Class Bio
Alliance HPLC
Figure 6. Shown is a comparison of separations of IgM (1 mg/mL) on two XBridge Protein BEH SEC 450Å, 3.5 µm, 7.8 x 150 + 300 mm Columns run in series using an Alliance HPLC System (top frame) and on an ACQUITY UPLC Protein BEH SEC, 450Å, 2.5 µm, 4.6 x 300 mm Column using an ACQUITY UPLC H-Class Bio (bottom frame). The flow rates were scaled based on particle diameter and column I.D. to 0.62 mL/minute for the two HPLC columns run in series and 0.3 mL/minute for the UPLC column. Samples loads were also adjusted for column volume.
CO N C LU S IO NS
Successful implementation of SE-UPLC separation technology
requires high efficiency columns and low dispersion LC systems
capable of operating at high back pressures. The advantage in doing
so is the capability to dramatically improve sample throughput
while decreasing sample requirements and mobile phase use.
However, there are several situations where it is beneficial to
be able to transfer between SE-UPLC and SE-HPLC separations,
including instrumentation limitations in a method transfer, or in
the event that a UPLC separation needs to be scaled up in order
to facilitate the structural or functional characterization of low
abundance species. However, in some cases, a direct method
transfer using the same mobile phase and temperature conditions
is not possible between SE-UPLC Columns packed with BEH-based
particles and SE-HPLC columns packed with traditional silica-based
particles due to the differences in the surface characteristics of
the two particle types. These differences can necessitate the
re-optimization of the method in order to get comparable results.
Waters’ recent development of HPLC compatible 200Å and 450Å,
3.5 µm particles based on the same diol-coated BEH-particle
chemistry as that used in ACQUITY UPLC Protein BEH SEC Columns
provides the capability to readily transfer between SE-UPLC
and SE-HPLC for the first time. This application note details and
provides examples of the methodology that can successfully
employed for this method transfer.
References
1. Fountain K. J., Hong, P. Serpa, S. Bouvier, E. S. P. and Morrison, D., Analysis of Biomolecules by Size-Exclusion UltraPerformance Liquid Chromatography. Waters Corporation, Application Note [serial on the Internet]. 2012; (720004412EN).
2. Hong, P., Koza S., Fountain, K. J., Advances in Size-Exclusion Chromatography for the Analysis of Small Proteins and Peptides: Evaluation of Calibration Curves for Molecular Weight Estimation. Waters Corporation, Application Note [serial on the Internet]. 2010; (WA64226).
3. Gritti, F., Guiochon, G., On the extra-column band-broadening contributions of modern, very high pressure liquid chromatographs using 2.1 mm I.D. columns packed with sub-2-µm particles. Journal of Chromatography A 2010, 1217 (49), 7677–7689.
4. Ricker, R. D., Sandoval, L. A., Fast, reproducible size-exclusion chromatography of biological macromolecules. Journal of Chromatography A 1996, 743 (1), 43–50.
Recommended