Submission
doc.: IEEE 11-13/0536r0May 2013
Wookbong Lee, LG ElectronicsSlide 1
HEW SG PHY Considerations For Out-door Environment
Date: 2013-05-12
Name Affiliations Address Phone email Wookbong Lee LG Electronics Gyeonggi-do, Korea +82-31-450-
1883 [email protected]
Jinyoung Chun LG Electronics [email protected]
Jinsoo Choi LG Electronics [email protected]
Dongguk Lim LG Electronics [email protected]
HanGyu Cho LG Electronics [email protected]
Authors:

Submission
doc.: IEEE 11-13/0536r0May 2013
Wookbong Lee, LG ElectronicsSlide 2
Abstract
This document includes PHY considerations for HEW development especially for Outdoor Environment.
Submission
doc.: IEEE 11-13/0536r0May 2013
Wookbong Lee, LG ElectronicsSlide 3
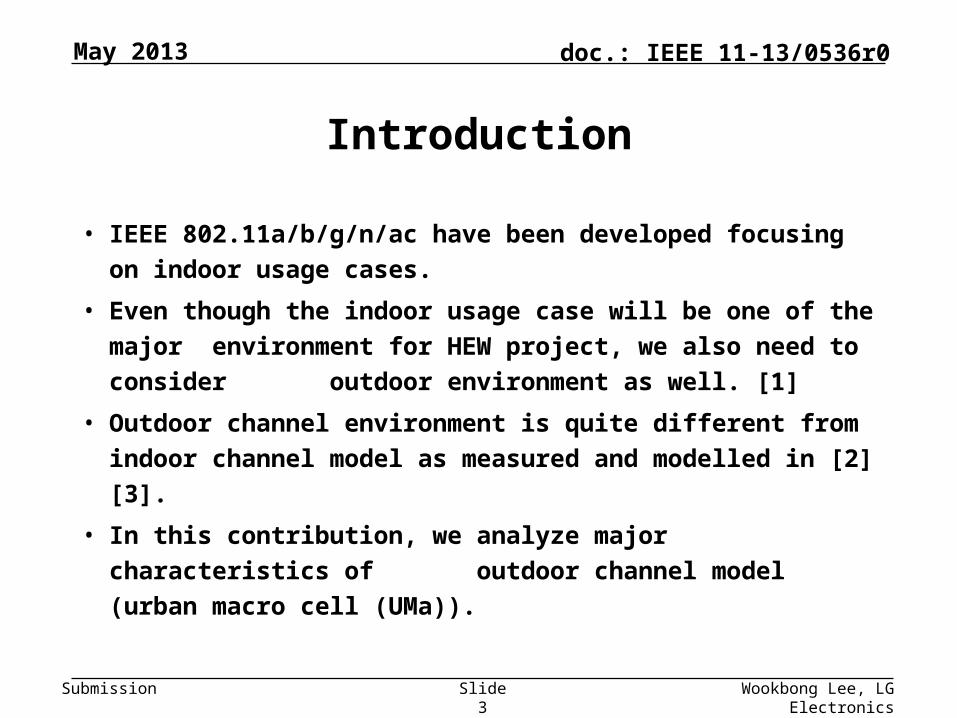
Introduction
• IEEE 802.11a/b/g/n/ac have been developed focusing on
indoor usage cases.
• Even though the indoor usage case will be one of the ma-
jor environment for HEW project, we also need to con-
sider outdoor environment as well. [1]
• Outdoor channel environment is quite different from in-
door channel model as measured and modelled in [2][3].
• In this contribution, we analyze major characteristics of
outdoor channel model (urban macro cell (UMa)).

Submission
doc.: IEEE 11-13/0536r0
Wookbong Lee, LG Electronics
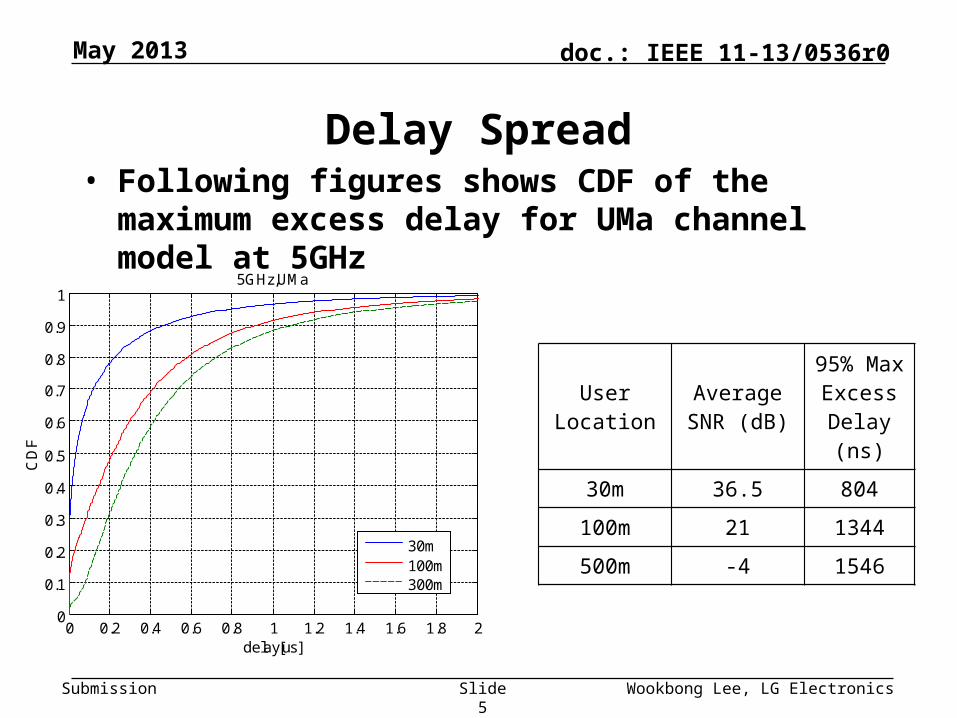
Delay Spread• Following figures shows CDF of the maximum excess
delay for UMa channel model at 2.4GHz
Slide 4
May 2013
User Loca-tion
Average SNR (dB)
95% Max Excess
Delay (ns)
30m 42.6 806
100m 27.3 1330
500m 0.3 1540
0 0.2 0.4 0.6 0.8 1 1.2 1.4 1.6 1.8 20
0.1
0.2
0.3
0.4
0.5
0.6
0.7
0.8
0.9
1
delay [us]
CD
F
2.4GHz, UMa
30m100m300m
Submission
doc.: IEEE 11-13/0536r0
Wookbong Lee, LG Electronics
Delay Spread• Following figures shows CDF of the maximum excess
delay for UMa channel model at 5GHz
Slide 5
May 2013
User Loca-tion
Average SNR (dB)
95% Max Excess
Delay (ns)
30m 36.5 804
100m 21 1344
500m -4 1546
0 0.2 0.4 0.6 0.8 1 1.2 1.4 1.6 1.8 20
0.1
0.2
0.3
0.4
0.5
0.6
0.7
0.8
0.9
1
delay[us]
CD
F
5GHz,UMa
30m100m300m

Submission
doc.: IEEE 11-13/0536r0
Wookbong Lee, LG Electronics
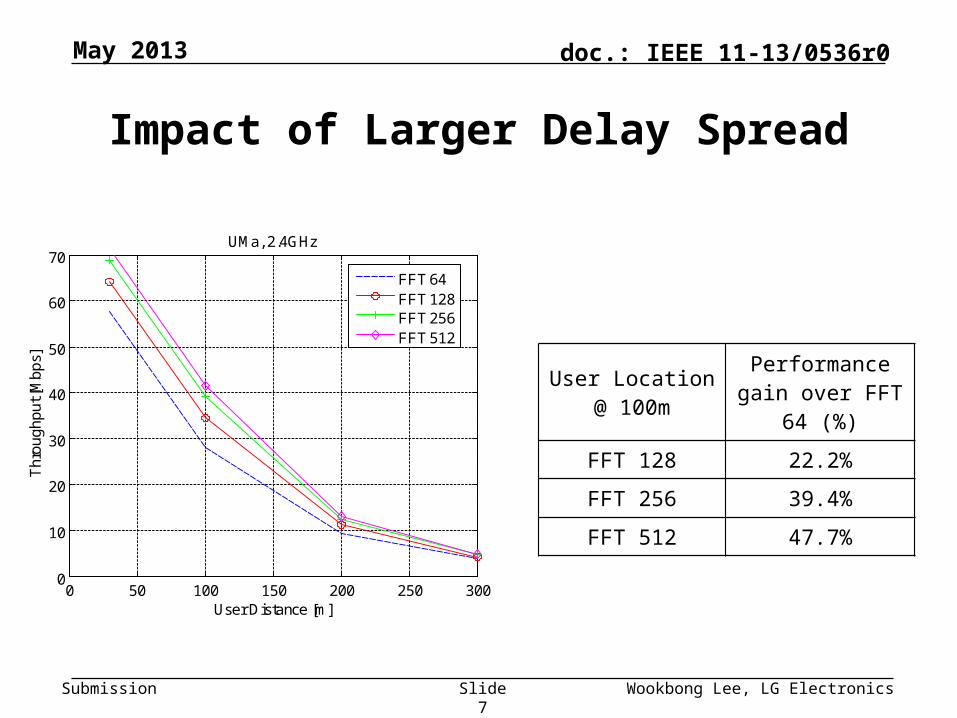
Impact of Larger Delay Spread
• Performance loss due to larger inter-symbol-interference.
• There is no other solution than increasing CP length in this case.
• Just increasing CP length brings throughput loss due to larger PHY overhead. (See Appendix for more details)
• During the development of IEEE 802.11af or .11ah, members come up with increasing CP length by increasing FFT size for a given bandwidth to maintain physical layer overhead.
─ For example, the subcarrier spacing of .11af is 41.7kHz (in case of U.S. channel) and that of .11ah is 31.25kHz while the subcarrier spacing of .11a/n/ac is 312.5kHz.
• With same logic, we can increase CP length by increasing FFT size for a given bandwidth (20MHz, 40MHz, 80MHz or 160MHz).
Slide 6
May 2013
Submission
doc.: IEEE 11-13/0536r0
Wookbong Lee, LG Electronics
Impact of Larger Delay Spread
Slide 7
May 2013
User Location @ 100m
Performance gain over FFT 64 (%)
FFT 128 22.2%
FFT 256 39.4%
FFT 512 47.7%
0 50 100 150 200 250 3000
10
20
30
40
50
60
70
User Distance [m]
Th
rou
gh
pu
t [M
bp
s]
UMa, 2.4GHz
FFT 64FFT 128FFT 256FFT 512

Submission
doc.: IEEE 11-13/0536r0
Wookbong Lee, LG Electronics
Impact of Larger Delay Spread
Slide 8
May 2013
User Location @ 100m
Performance gain over FFT 64 (%)
FFT 128 16.0%
FFT 256 27.2%
FFT 512 32.7%
0 50 100 150 200 250 3000
10
20
30
40
50
60
70
User Distance [m]
Th
rou
gh
pu
t [M
bp
s]
UMa, 5GHz
FFT 64FFT 128FFT 256FFT 512
Submission
doc.: IEEE 11-13/0536r0
Wookbong Lee, LG Electronics
Channel Variation
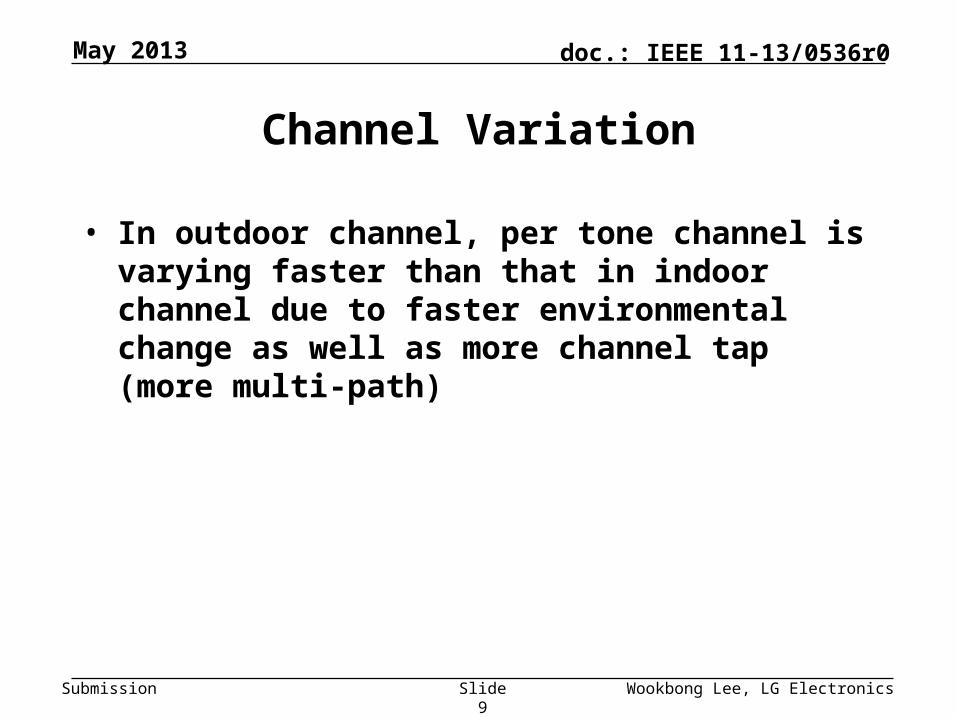
• In outdoor channel, per tone channel is varying faster than that in indoor channel due to faster environmental change as well as more channel tap (more multi-path)
Slide 9
May 2013

Submission
doc.: IEEE 11-13/0536r0
Wookbong Lee, LG Electronics
Impact of Larger Channel Variation
Slide 10
May 2013
• Channel variation of one tone per one OFDM symbol ─ Observation during the PPDU max Time
In 802.11 ac, aPPDUMaxTime is 5.484 ms
0 400 800 1200 1600 2000 2400 2800 3200 3600 4000 4400 4800 5200 5600 600060000.8
0.85
0.9
0.95
1
1.05
1.1
1.15
1.21.2
Second [us]
Mag
nitu
de
Channel variation comparison in max PPDU size
InH
UMa
0 400 800 1200 1600 2000 2400 2800 3200 3600 4000 4400 4800 5200 5600 60006000-0.1
-0.05
0
0.05
0.1
0.15
0.2
0.25
0.3
0.35
0.4
0.45
0.5
0.55
0.60.6
Second [us]
Pha
se (ra
dian
)
Channel variation comparison in max PPDU size
InH
UMa
Submission
doc.: IEEE 11-13/0536r0
Wookbong Lee, LG Electronics
Impact of Larger Channel Variation
Slide 11
May 2013
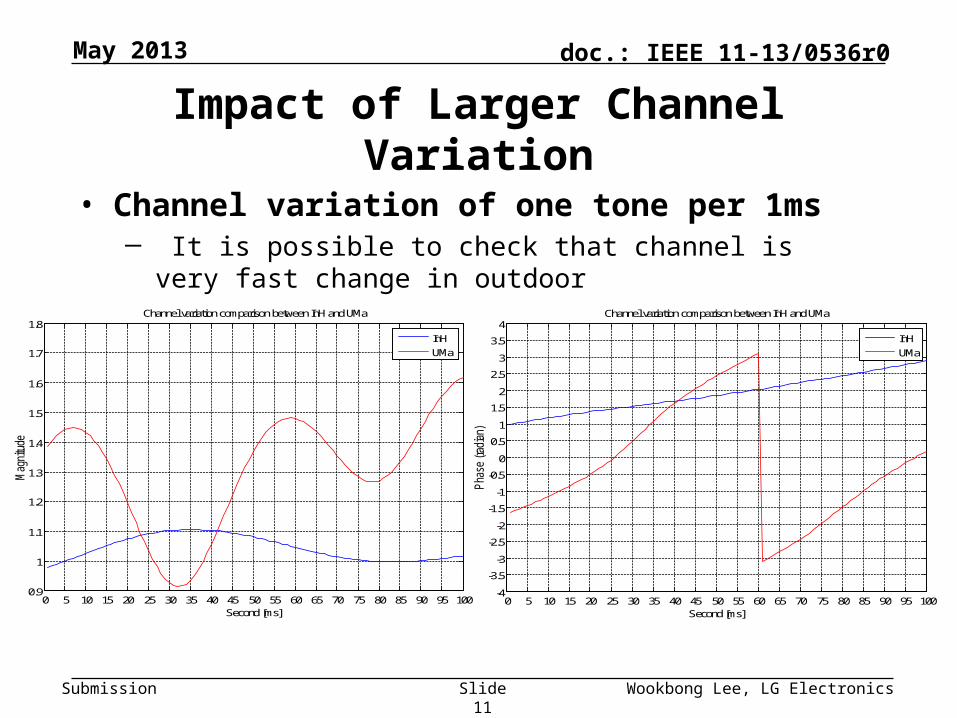
• Channel variation of one tone per 1ms─ It is possible to check that channel is very fast change in outdoor
•
0 5 10 15 20 25 30 35 40 45 50 55 60 65 70 75 80 85 90 95 1000.9
1
1.1
1.2
1.3
1.4
1.5
1.6
1.7
1.8
Second [ms]
Mag
nitu
de
Channel variation comparison between InH and UMa
InH
UMa
0 5 10 15 20 25 30 35 40 45 50 55 60 65 70 75 80 85 90 95 100-4
-3.5
-3
-2.5
-2
-1.5
-1
-0.5
0
0.5
1
1.5
2
2.5
3
3.5
4
Second [ms]
Pha
se (ra
dian
)
Channel variation comparison between InH and UMa
InH
UMa
Submission
doc.: IEEE 11-13/0536r0
Wookbong Lee, LG Electronics
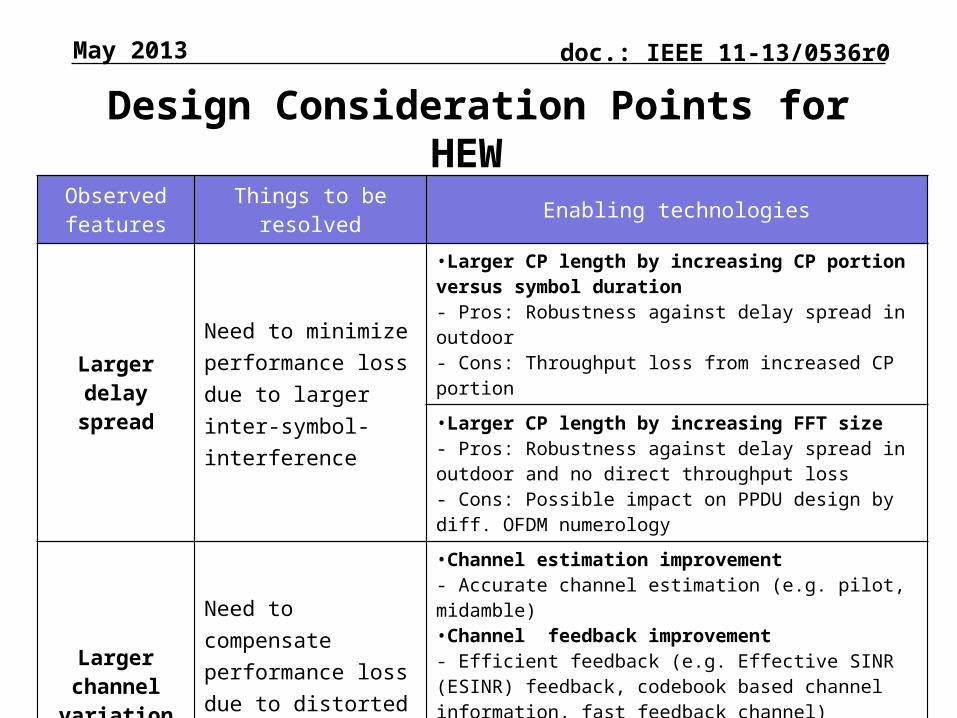
Design Consideration Points for HEW
Slide 12
May 2013
Observed fea-tures
Things to be resolved Enabling technologies
Larger delay spread
Need to minimize per-formance loss due to larger inter-symbol-in-terference
•Larger CP length by increasing CP portion versus symbol duration- Pros: Robustness against delay spread in outdoor - Cons: Throughput loss from increased CP portion
•Larger CP length by increasing FFT size - Pros: Robustness against delay spread in outdoor and no direct throughput loss- Cons: Possible impact on PPDU design by diff. OFDM nu-merology
Larger chan-nel variation
Need to compensate per-formance loss due to dis-torted channel informa-tion
•Channel estimation improvement- Accurate channel estimation (e.g. pilot, midamble)•Channel feedback improvement- Efficient feedback (e.g. Effective SINR (ESINR) feedback, codebook based channel information, fast feedback channel)•Techniques to mitigate fading- Enhancement of link quality (e.g. effective error correction and retransmission mechanism)

Submission
doc.: IEEE 11-13/0536r0
Wookbong Lee, LG Electronics
Appendix
May 2013
Slide 13
Submission
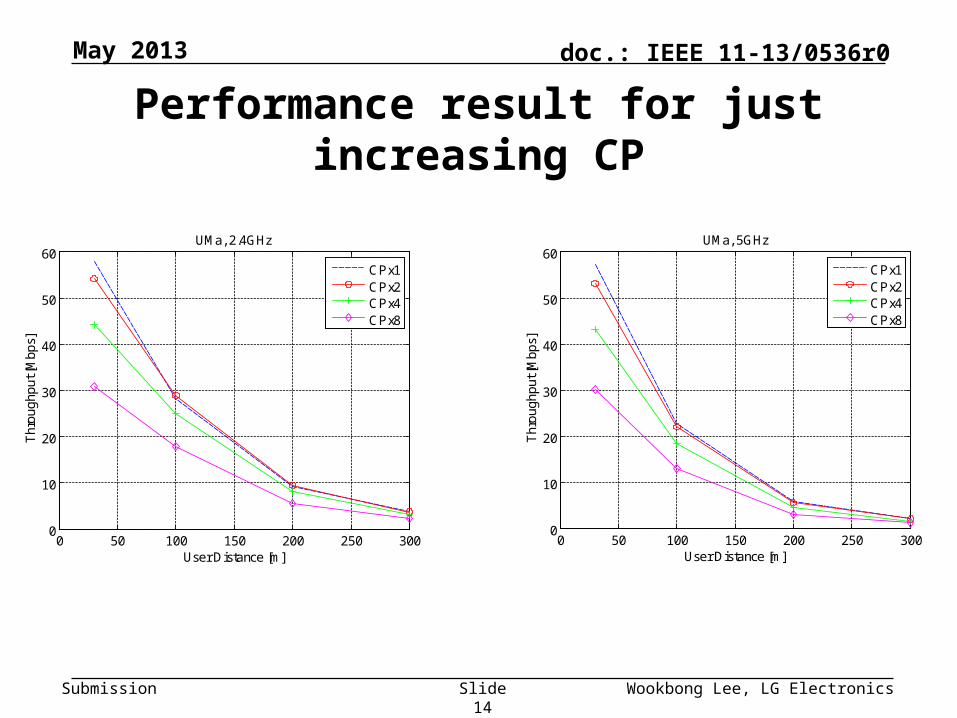
doc.: IEEE 11-13/0536r0
Performance result for just increasing CP
Slide 14 Wookbong Lee, LG Electronics
May 2013
0 50 100 150 200 250 3000
10
20
30
40
50
60
User Distance [m]
Th
rou
gh
pu
t [M
bp
s]
UMa, 2.4GHz
CPx1CPx2CPx4CPx8
0 50 100 150 200 250 3000
10
20
30
40
50
60
User Distance [m]
Th
rou
gh
pu
t [M
bp
s]
UMa, 5GHz
CPx1CPx2CPx4CPx8

Submission
doc.: IEEE 11-13/0536r0May 2013
Wookbong Lee, LG ElectronicsSlide 15
Channel Model
ScenarioUMa
LoS NLoS
Delay Spread (log10(s)) (-7.03,0.66)* (-6.44,0.39)*
K-factor (K) (dB) (9,3.5)* N/A
Delay distribution Exp Exp
Delay scaling parameter 2.5 2.3
Number of cluster 12 20
Per cluster shadowing std ζ (dB) 3 3
LoS probability as a function of distance, d(m)
37,5.0
3718,2718exp
18,1
d
dd
d
PLOS )36/exp()36/exp(1)1,/18min( dddPLOS
* (μ,σ)For SNR evaluation, we assume noise figure 5dB, cable loss 2dB, signal power 1W for 20MHz.See page 30-41 of reference [2]
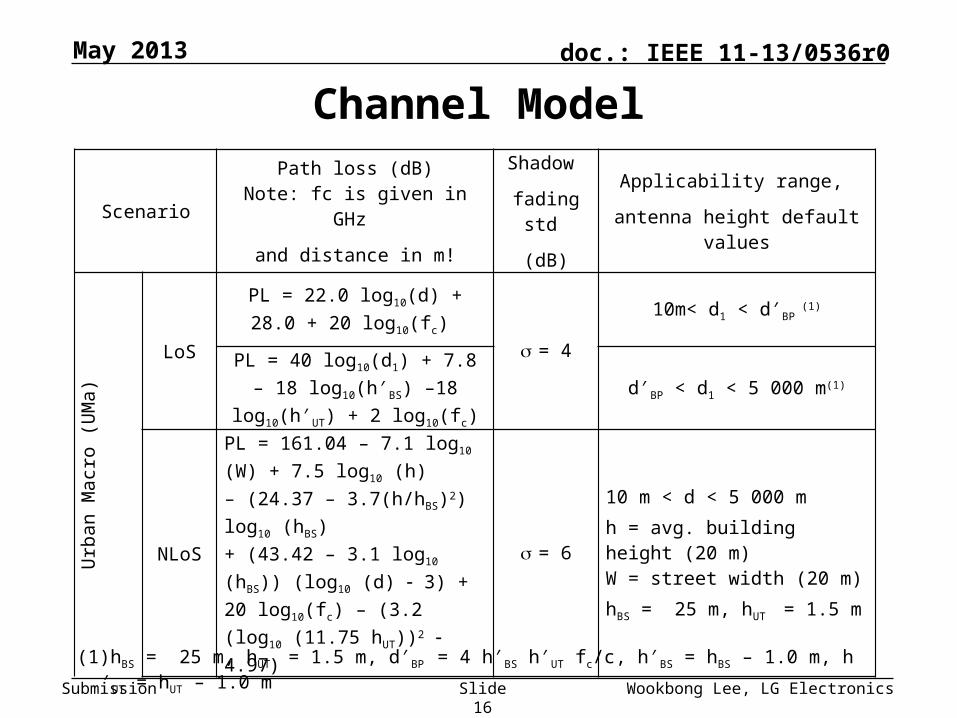
Submission
doc.: IEEE 11-13/0536r0
Wookbong Lee, LG Electronics
Channel Model
Slide 16
May 2013
Scenario
Path loss (dB)Note: fc is given in GHz
and distance in m!
Shadow
fading std
(dB)
Applicability range,
antenna height default values
Urban Macro (UMa)
LoS
PL = 22.0 log10(d) + 28.0 + 20 log10(fc)
= 4
10m< d1 < d′BP (1)
PL = 40 log10(d1) + 7.8 – 18 log10(h′BS) –18 log10(h′UT) + 2
log10(fc)d′BP < d1 < 5 000 m(1)
NLoS
PL = 161.04 – 7.1 log10 (W) + 7.5 log10 (h) – (24.37 – 3.7(h/hBS)2) log10 (hBS) + (43.42 – 3.1 log10 (hBS)) (log10 (d) 3) +20 log10(fc) – (3.2 (log10 (11.75 hUT))2 4.97)
= 6
10 m < d < 5 000 m
h = avg. building height (20 m)W = street width (20 m)
hBS = 25 m, hUT = 1.5 m
(1)hBS = 25 m, hUT = 1.5 m, d′BP = 4 h′BS h′UT fc/c, h′BS = hBS – 1.0 m, h′UT = hUT – 1.0 m

Submission
doc.: IEEE 11-13/0536r0May 2013
Wookbong Lee, LG ElectronicsSlide 17
Delay profile vs. CP length
• And we need to have proper modeling on how channel and CP impact performance.
• One of possible modeling is as follows [4]:
TFFT is FFT period CP is CP period|αm|2 is power of m-th tapτm is delay of m-th tap including OFDM symbol timing
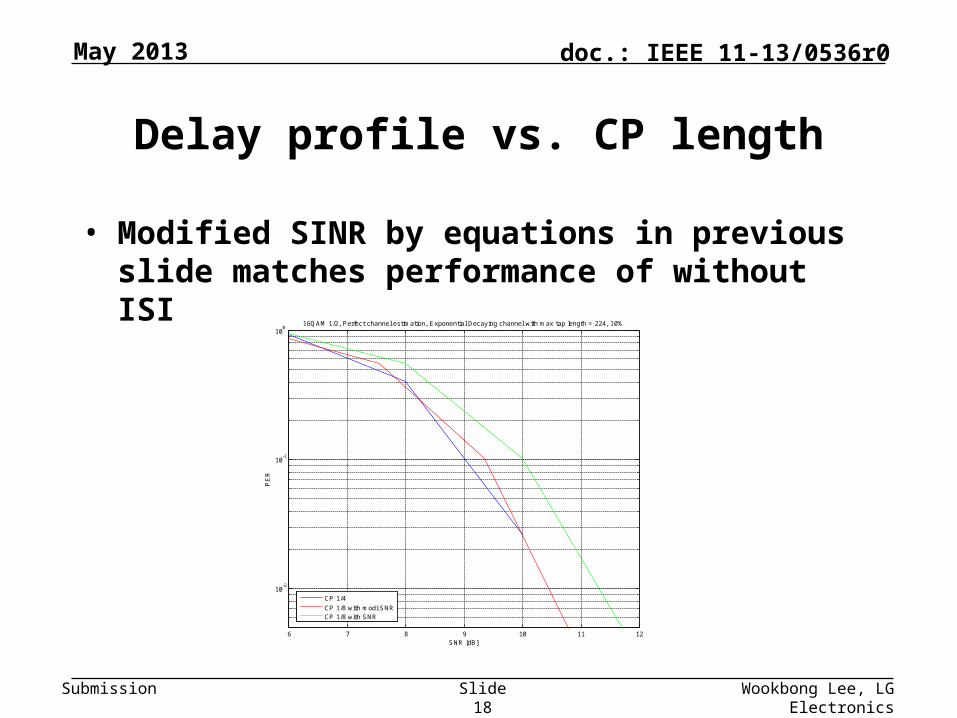
Submission
doc.: IEEE 11-13/0536r0May 2013
Wookbong Lee, LG ElectronicsSlide 18
Delay profile vs. CP length
• Modified SINR by equations in previous slide matches performance of without ISI
6 7 8 9 10 11 12
10-2
10-1
100
SNR [dB]
PE
R
16QAM 1/2, Perfect channel estimation, Exponential Decaying channel with max tap length = 224, 10%
CP 1/4
CP 1/8 with modi SNRCP 1/8 with SNR

Submission
doc.: IEEE 11-13/0536r0
Wookbong Lee, LG Electronics
Simulation Assumption for Slide 7 and 8
Slide 19
May 2013
FFT1 FFT2 FFT4 FFT8
FFT size 64 128 256 512
Used data subcarriers 52 104 208 416
Symbol length with CP 4us 8us 16us 32us
CP length 0.8us 1.6us 3.2us 6.4us
Center frequency 2.4GHz/5GHz
Bandwidth 20MHz
Channel model UMa 3km/h
Packet structure Preamble +Data frame
Preamble L-STF/LTF/SIG+VHT-SIG-A/STF/LTF/SIG-B =40 us
Data frame SERVICE(2bytes) +MAC header(40bytes) +Data +Tail(6bits) +Padding(Data =8kbyte)
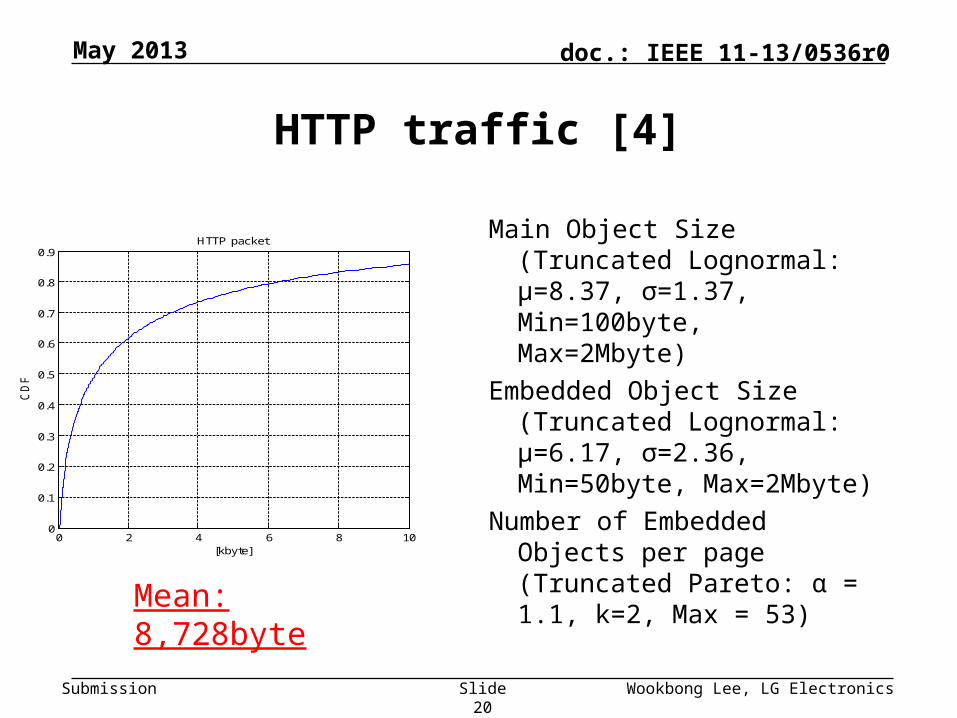
Submission
doc.: IEEE 11-13/0536r0
Wookbong Lee, LG Electronics
HTTP traffic [4]
Main Object Size (Truncated Lognormal: μ=8.37, σ=1.37, Min=100byte, Max=2Mbyte)
Embedded Object Size (Trun-cated Lognormal: μ=6.17, σ=2.36, Min=50byte, Max=2Mbyte)
Number of Embedded Objects per page (Truncated Pareto: α = 1.1, k=2, Max = 53)
Slide 20
May 2013
0 2 4 6 8 100
0.1
0.2
0.3
0.4
0.5
0.6
0.7
0.8
0.9
[kbyte]
CD
F
HTTP packet
Mean: 8,728byte
Submission
doc.: IEEE 11-13/0536r0May 2013
Wookbong Lee, LG ElectronicsSlide 21
References
[1] IEEE 802.11-13/0331r5- Laurent Carious et al., “High- effi-ciency WLAN,” March 2013
[2] Report M.2135, “Guidelines for evaluation of radio interface technologies for IMT-Advanced, ” available at http://www.itu.int/pub/R-REP-M.2135
[2] IST-4-027756 WINNER II D1.1.2 V1.2, “WINNER II channel models,” available at http://www.ist-winner.org/deliverables.html
[3] Mickael Batariere, Kevin Baum, and Thomas P. Krauss, “Cyclic Prefix Length Analysis for 4G OFDM Systems,” VTC 2004 Fall
[4] IEEE 802.16m-08/004r5, “IEEE 802.16m Evaluation Methodol-ogy Document (EMD),” Jan. 2012
Recommended