prepared for the Illinois Soybean Association
April 29, 2011
Study of Containerized Shipping of Soybean Meal Exports
Page 0
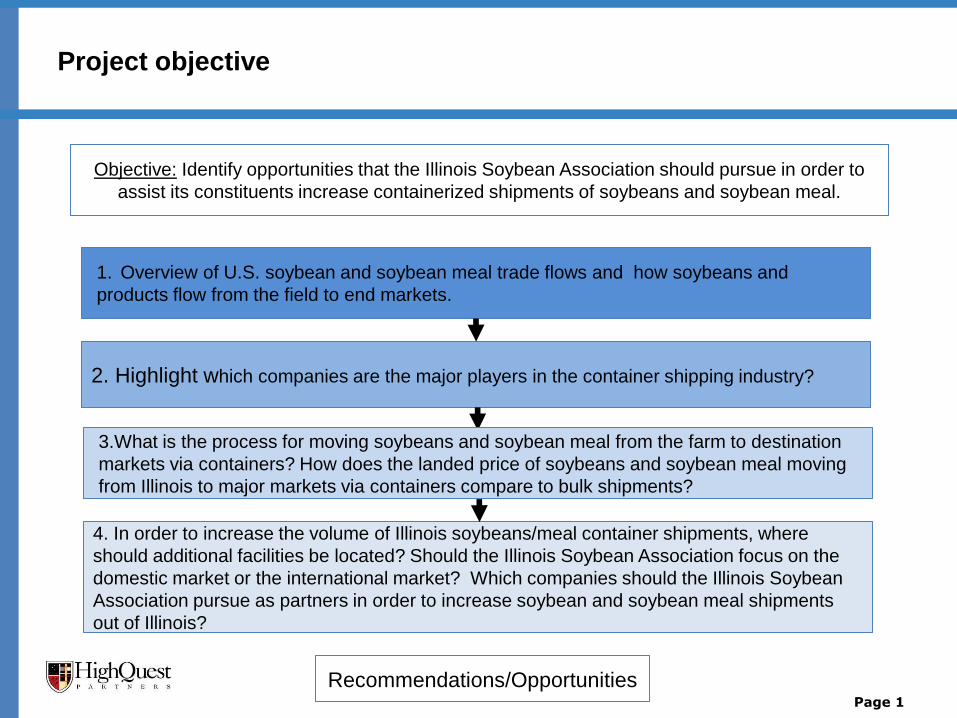
1. Overview of U.S. soybean and soybean meal trade flows and how soybeans and
products flow from the field to end markets.
2. Highlight which companies are the major players in the container shipping industry?
4. In order to increase the volume of Illinois soybeans/meal container shipments, where
should additional facilities be located? Should the Illinois Soybean Association focus on the
domestic market or the international market? Which companies should the Illinois Soybean
Association pursue as partners in order to increase soybean and soybean meal shipments
out of Illinois?
Project objective
Page 1
Objective: Identify opportunities that the Illinois Soybean Association should pursue in order to
assist its constituents increase containerized shipments of soybeans and soybean meal.
3.What is the process for moving soybeans and soybean meal from the farm to destination
markets via containers? How does the landed price of soybeans and soybean meal moving
from Illinois to major markets via containers compare to bulk shipments?
Recommendations/Opportunities
Table of contents
1. Executive Summary
2. Overview of U.S. and Illinois soybeans and soybean trade flows
3. Major players in the U.S. and Illinois container shipping industry
4. Landed price analysis of soybeans and soybean meal moving from
Illinois to major destination markets
4. Recommendations for increasing container movements of Illinois
soybeans and soybean meal
Page 2
Executive Summary - export outlook for containerized soybean and soybean meal shipments
• Asian demand for soybean and soybean meal is expected to increase substantially over the next
ten years as GDP per capita increases throughout the region resulting in consumers allocating a
greater portion of their incomes to consumption of animal protein and vegetable oil.
• At the same time, container shipping companies are expected to increase the number of containers
in production as well as their fleets in order to meet increased future demand for container
shipments.
• As the U.S. economy continues to improve, demand for containers in the Midwest is expected to
increase leading to improved availability of empty containers in the Chicago area that can be used
on the backhaul to Asia for shipping soybean and soybean meal.
• The completion of the Panama Canal project in 2014 is expected to result in an increase in
container shipments out of the Gulf, which shippers based in Illinois are ideally suited to take
advantage of given their access to the Mississippi, Illinois and Ohio Rivers.
• Illinois is well positioned to take advantage of these market dynamics due to its large soybean and
soybean meal production, the lack of local demand for protein meal which provides a strong
incentive to export to markets outside the state the proximity to Chicago, the largest container
market in the Midwest, to large soybean production areas.
Page 3
Executive Summary- major players in the Illinois containerized soybean and soybean meal market
• The major players in the Illinois soybean market include the large origination companies - ADM,
Bunge, Cargill and CGB(Consolidated Grain & Barge owned by Zennoh).
• These companies operate have large origination and processing capabilities throughout the state
and generally ship their soybeans via barge to New Orleans for the export market.
• In addition, there are a number of smaller players in Illinois that have taken advantage of the
container market to export their soybeans and soybean meal.
– The container market has enabled smaller players to enter the export market directly without the capital
expense of having to build large export facilities while cutting out the middlemen (brokers) from the equation.
– The Illinois Soybean Association should focus on these smaller, regional players when considering where to
build a container trans-load facility.
• The major rail lines and container shipping companies operate in the inter-modal yards surrounding
Chicago as it is the primary container market in the Midwest. For this reason, container availability
in Chicago is much higher than in other Midwestern states. This provides exporters of
containerized grains with a substantial transportation advantage over exporters located in other
states in terms of exporting soybeans and soybean meal via container.
• The other major inter-modal hubs in Illinois are located in East St. Louis and Peoria. These hubs
can expect to experience significant container throughput volume in 2014 when the Panama Canal
expansion project is completed giving Illinois the added advantage of being able to move containers
by barge to New Orleans.
Page 4
Executive Summary- landed price analysis
Page 5
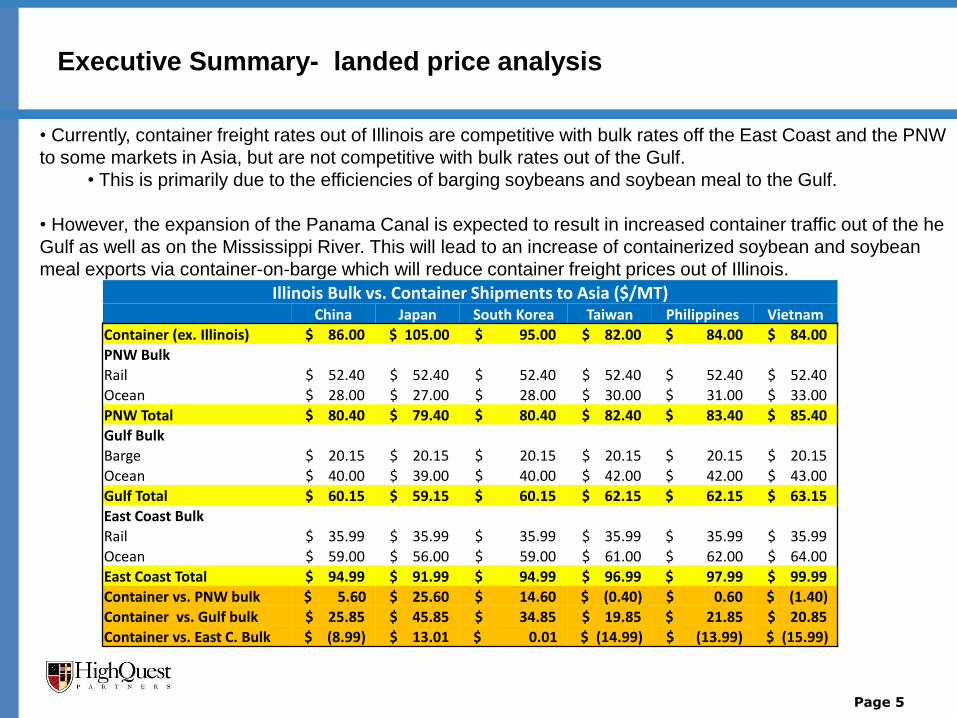
Illinois Bulk vs. Container Shipments to Asia ($/MT) China Japan South Korea Taiwan Philippines Vietnam
Container (ex. Illinois) $ 86.00 $ 105.00 $ 95.00 $ 82.00 $ 84.00 $ 84.00
PNW Bulk
Rail $ 52.40 $ 52.40 $ 52.40 $ 52.40 $ 52.40 $ 52.40
Ocean $ 28.00 $ 27.00 $ 28.00 $ 30.00 $ 31.00 $ 33.00
PNW Total $ 80.40 $ 79.40 $ 80.40 $ 82.40 $ 83.40 $ 85.40
Gulf Bulk
Barge $ 20.15 $ 20.15 $ 20.15 $ 20.15 $ 20.15 $ 20.15
Ocean $ 40.00 $ 39.00 $ 40.00 $ 42.00 $ 42.00 $ 43.00
Gulf Total $ 60.15 $ 59.15 $ 60.15 $ 62.15 $ 62.15 $ 63.15
East Coast Bulk
Rail $ 35.99 $ 35.99 $ 35.99 $ 35.99 $ 35.99 $ 35.99
Ocean $ 59.00 $ 56.00 $ 59.00 $ 61.00 $ 62.00 $ 64.00
East Coast Total $ 94.99 $ 91.99 $ 94.99 $ 96.99 $ 97.99 $ 99.99
Container vs. PNW bulk $ 5.60 $ 25.60 $ 14.60 $ (0.40) $ 0.60 $ (1.40)
Container vs. Gulf bulk $ 25.85 $ 45.85 $ 34.85 $ 19.85 $ 21.85 $ 20.85
Container vs. East C. Bulk $ (8.99) $ 13.01 $ 0.01 $ (14.99) $ (13.99) $ (15.99)
• Currently, container freight rates out of Illinois are competitive with bulk rates off the East Coast and the PNW
to some markets in Asia, but are not competitive with bulk rates out of the Gulf.
• This is primarily due to the efficiencies of barging soybeans and soybean meal to the Gulf.
• However, the expansion of the Panama Canal is expected to result in increased container traffic out of the he
Gulf as well as on the Mississippi River. This will lead to an increase of containerized soybean and soybean
meal exports via container-on-barge which will reduce container freight prices out of Illinois.
Executive Summary- key locations to consider for investment in trans-load facilities in Illinois
• Historically, the Chicago area, with its vast inter-modal network, has been the primary
location to consider for investment in trans-loading facilities due to the large volumes of
containers available in this market.
– Soybean growers and processors have trucked their soybean and soybean products to trans-
loading facilities in Chicago, loaded them into containers and shipped their products to the
major ports on the east and west coasts for delivery via containers ships to Asia.
• This is flow of product likely to remain prevalent case even after the Panama Canal
expansion project is completed as demand for inter-modal goods in rural areas of
Illinois will not be as high as in Chicago.
• However, with the expansion of the Panama Canal, new opportunities for inter-modal
hubs and trans-load facilities are likely to increase as more containers enter Illinois via
the Mississippi River system.
• Peoria, a major industrial city on the Illinois River located approximately 100 miles
south of Chicago in the middle of Illinois’ grain production belt, and East St. Louis, a
city located across the river from the inter-modal hub of St. Louis, represent significant
investment opportunities assuming that container flows increase on the river system.
Page 6
Executive Summary- SWOT analysis of investing in trans-loading facilities in Illinois
Page 7
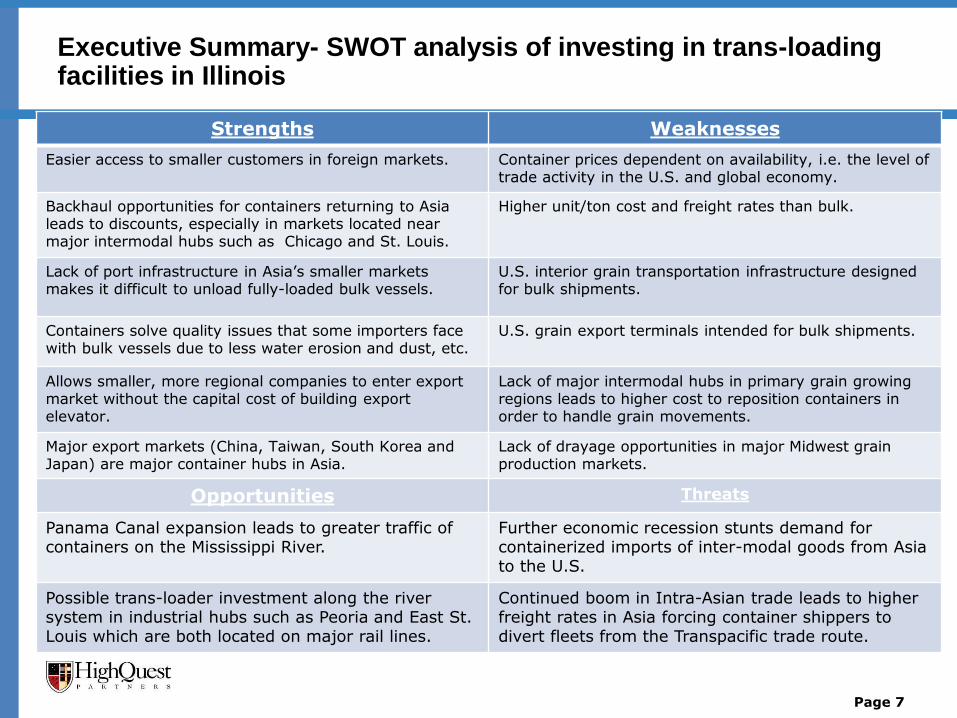
Strengths Weaknesses
Easier access to smaller customers in foreign markets. Container prices dependent on availability, i.e. the level of trade activity in the U.S. and global economy.
Backhaul opportunities for containers returning to Asia leads to discounts, especially in markets located near major intermodal hubs such as Chicago and St. Louis.
Higher unit/ton cost and freight rates than bulk.
Lack of port infrastructure in Asia’s smaller markets makes it difficult to unload fully-loaded bulk vessels.
U.S. interior grain transportation infrastructure designed for bulk shipments.
Containers solve quality issues that some importers face with bulk vessels due to less water erosion and dust, etc.
U.S. grain export terminals intended for bulk shipments.
Allows smaller, more regional companies to enter export market without the capital cost of building export elevator.
Lack of major intermodal hubs in primary grain growing regions leads to higher cost to reposition containers in order to handle grain movements.
Major export markets (China, Taiwan, South Korea and Japan) are major container hubs in Asia.
Lack of drayage opportunities in major Midwest grain production markets.
Opportunities Threats
Panama Canal expansion leads to greater traffic of containers on the Mississippi River.
Further economic recession stunts demand for containerized imports of inter-modal goods from Asia to the U.S.
Possible trans-loader investment along the river system in industrial hubs such as Peoria and East St. Louis which are both located on major rail lines.
Continued boom in Intra-Asian trade leads to higher freight rates in Asia forcing container shippers to divert fleets from the Transpacific trade route.
Table of contents
1. Executive Summary
2. Overview of U.S. and Illinois soybeans and soybean trade flows
3. Major players in the U.S. and Illinois container shipping industry
4. Landed price analysis of soybeans and soybean meal moving from
Illinois to major destination markets
4. Recommendations for increasing container movements of Illinois
soybeans and soybean meal
Page 8
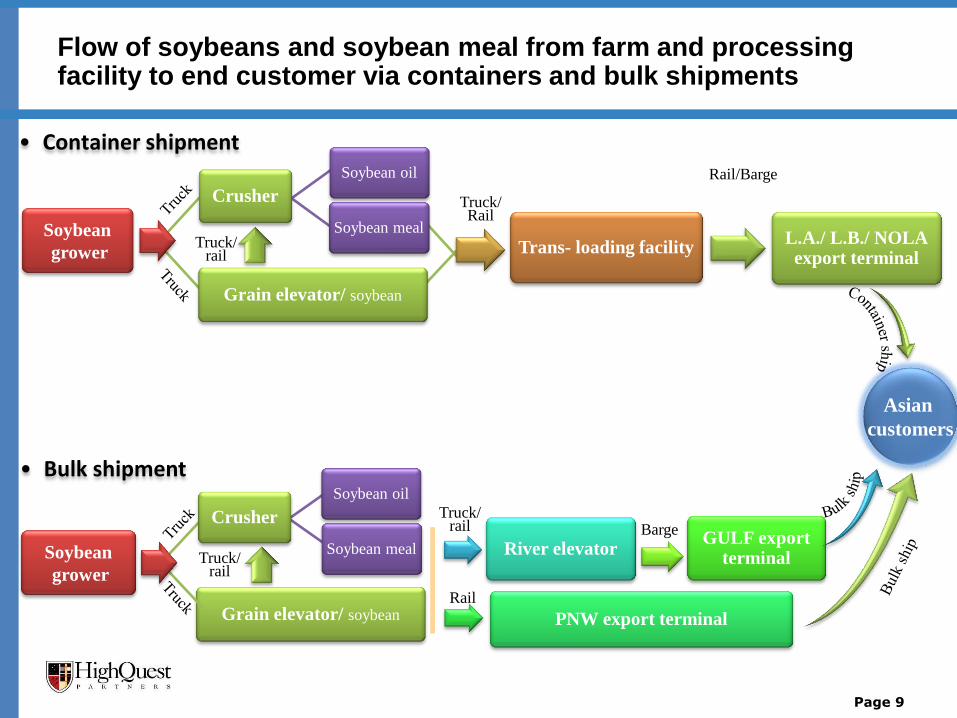
Flow of soybeans and soybean meal from farm and processing facility to end customer via containers and bulk shipments
Page 9
Soybean
grower
Soybean oil
Trans- loading facility Soybean meal
Grain elevator/ soybean
L.A./ L.B./ NOLA export terminal
• Container shipment
Asian
customers
Soybean
grower
Grain elevator/ soybean
Soybean oil
Soybean meal River elevator GULF export
terminal
PNW export terminal
Crusher
Truck/ rail
Truck/ Rail
Rail/Barge
Barge
Rail
Truck/ rail
Truck/ rail
Crusher
• Bulk shipment
U.S. soybean production and demand
Page 10
Source: USDA, HighQuest Partners analysis
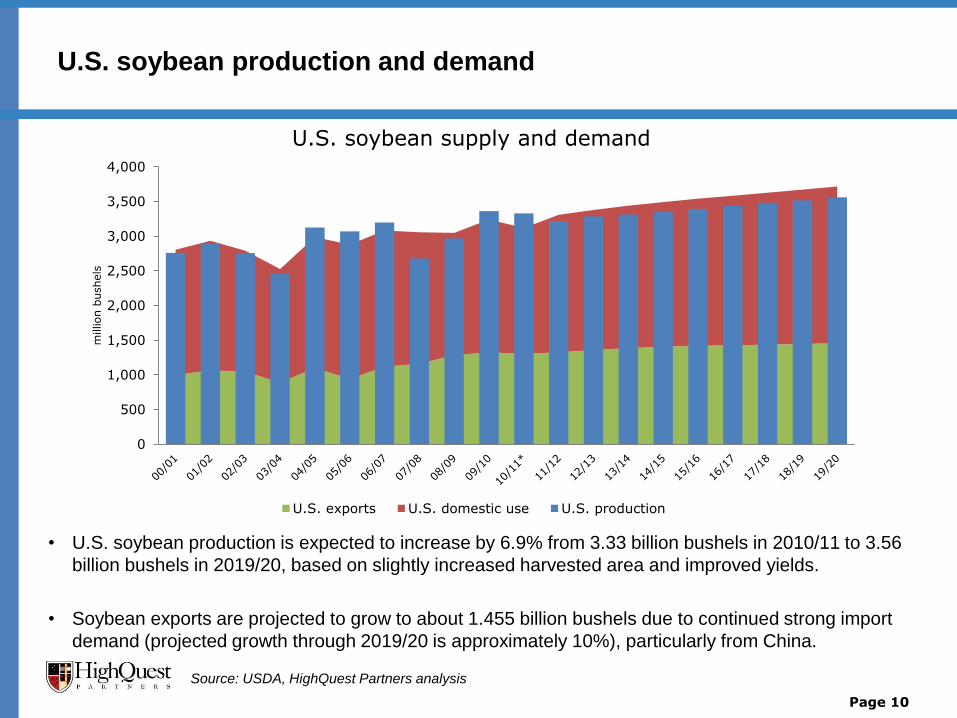
• U.S. soybean production is expected to increase by 6.9% from 3.33 billion bushels in 2010/11 to 3.56
billion bushels in 2019/20, based on slightly increased harvested area and improved yields.
• Soybean exports are projected to grow to about 1.455 billion bushels due to continued strong import
demand (projected growth through 2019/20 is approximately 10%), particularly from China.
0
500
1,000
1,500
2,000
2,500
3,000
3,500
4,000
million b
ushels
U.S. soybean supply and demand
U.S. exports U.S. domestic use U.S. production
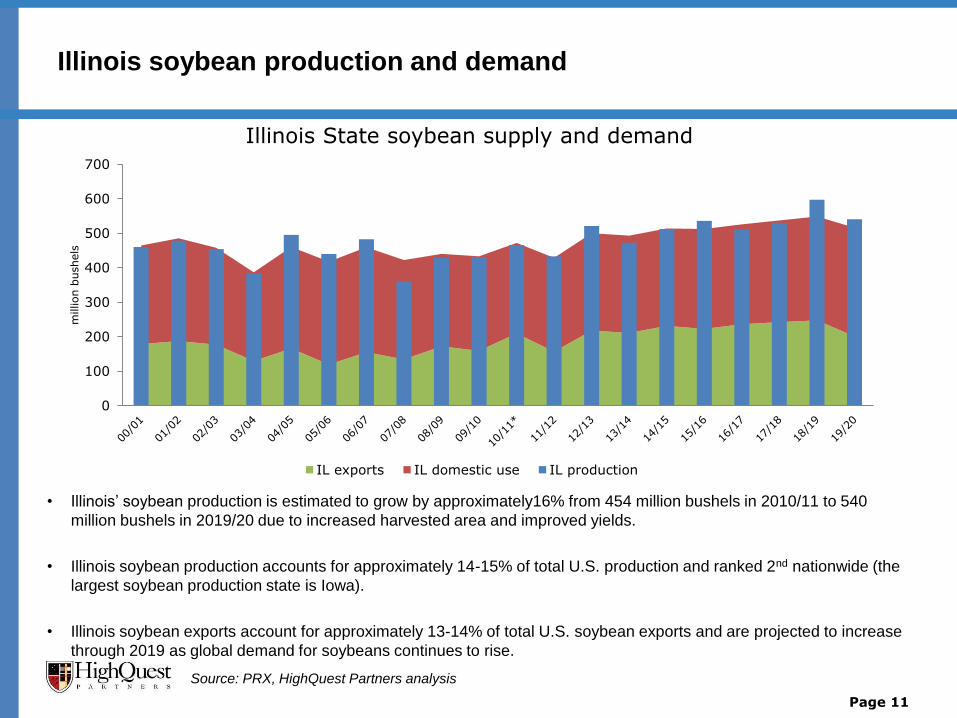
• Illinois’ soybean production is estimated to grow by approximately16% from 454 million bushels in 2010/11 to 540
million bushels in 2019/20 due to increased harvested area and improved yields.
• Illinois soybean production accounts for approximately 14-15% of total U.S. production and ranked 2nd nationwide (the
largest soybean production state is Iowa).
• Illinois soybean exports account for approximately 13-14% of total U.S. soybean exports and are projected to increase
through 2019 as global demand for soybeans continues to rise.
Page 11
Illinois soybean production and demand
0
100
200
300
400
500
600
700
million b
ushels
Illinois State soybean supply and demand
IL exports IL domestic use IL production
Source: PRX, HighQuest Partners analysis
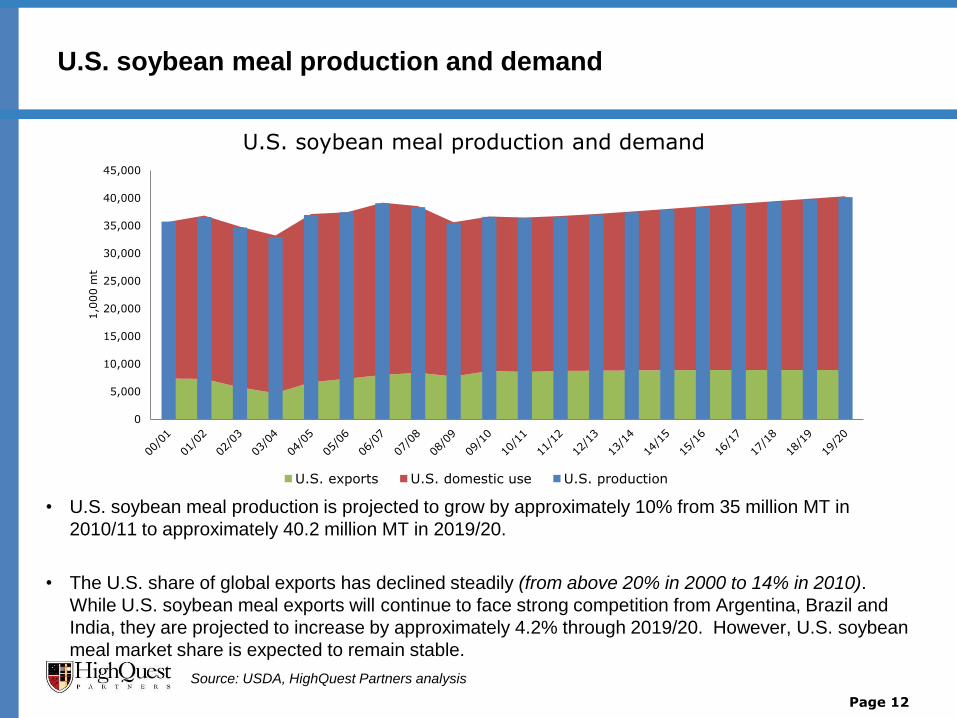
• U.S. soybean meal production is projected to grow by approximately 10% from 35 million MT in
2010/11 to approximately 40.2 million MT in 2019/20.
• The U.S. share of global exports has declined steadily (from above 20% in 2000 to 14% in 2010).
While U.S. soybean meal exports will continue to face strong competition from Argentina, Brazil and
India, they are projected to increase by approximately 4.2% through 2019/20. However, U.S. soybean
meal market share is expected to remain stable.
Page 12
U.S. soybean meal production and demand
Source: USDA, HighQuest Partners analysis
0
5,000
10,000
15,000
20,000
25,000
30,000
35,000
40,000
45,000
1,0
00 m
t
U.S. soybean meal production and demand
U.S. exports U.S. domestic use U.S. production
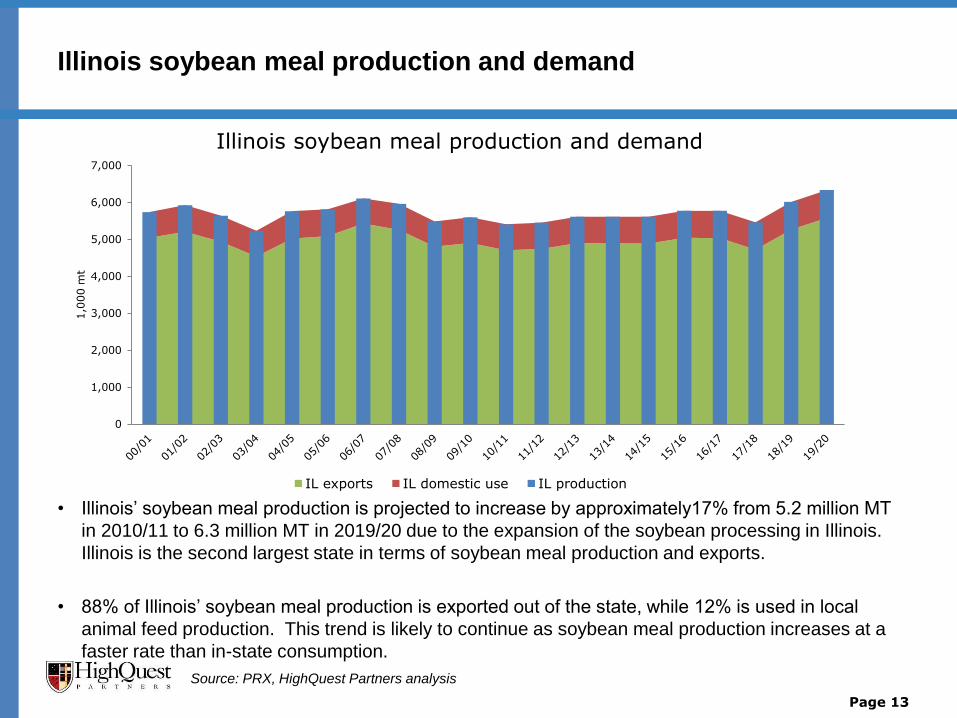
• Illinois’ soybean meal production is projected to increase by approximately17% from 5.2 million MT
in 2010/11 to 6.3 million MT in 2019/20 due to the expansion of the soybean processing in Illinois.
Illinois is the second largest state in terms of soybean meal production and exports.
• 88% of Illinois’ soybean meal production is exported out of the state, while 12% is used in local
animal feed production. This trend is likely to continue as soybean meal production increases at a
faster rate than in-state consumption.
Page 13
Illinois soybean meal production and demand
Source: PRX, HighQuest Partners analysis
0
1,000
2,000
3,000
4,000
5,000
6,000
7,000
1,0
00 m
t
Illinois soybean meal production and demand
IL exports IL domestic use IL production
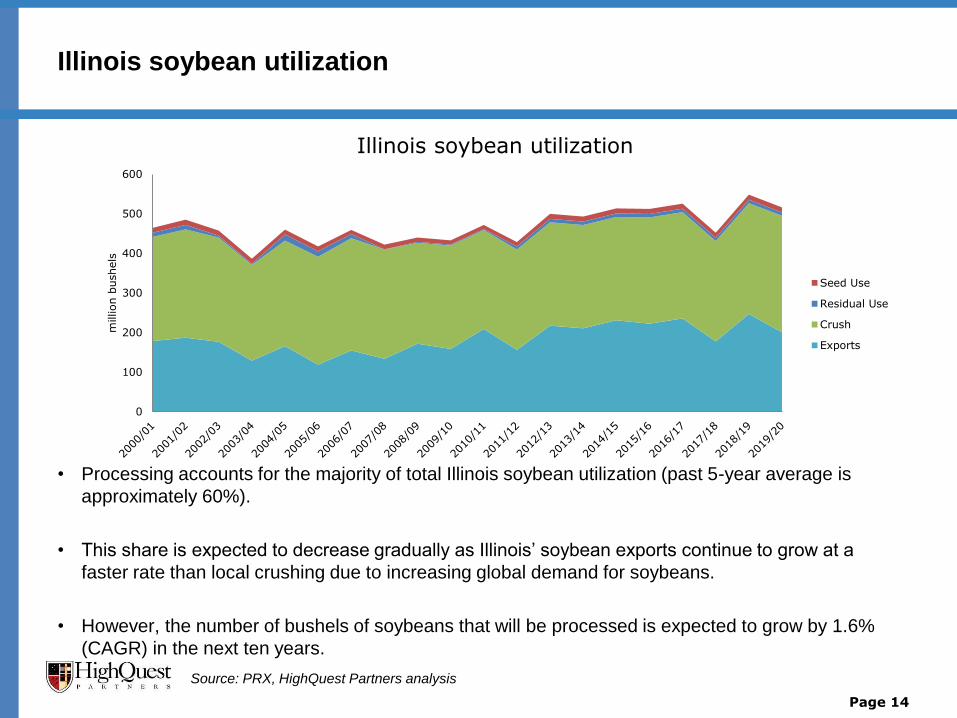
• Processing accounts for the majority of total Illinois soybean utilization (past 5-year average is
approximately 60%).
• This share is expected to decrease gradually as Illinois’ soybean exports continue to grow at a
faster rate than local crushing due to increasing global demand for soybeans.
• However, the number of bushels of soybeans that will be processed is expected to grow by 1.6%
(CAGR) in the next ten years.
Page 14
Illinois soybean utilization
0
100
200
300
400
500
600
million b
ushels
Illinois soybean utilization
Seed Use
Residual Use
Crush
Exports
Source: PRX, HighQuest Partners analysis
Illinois soybean meal utilization
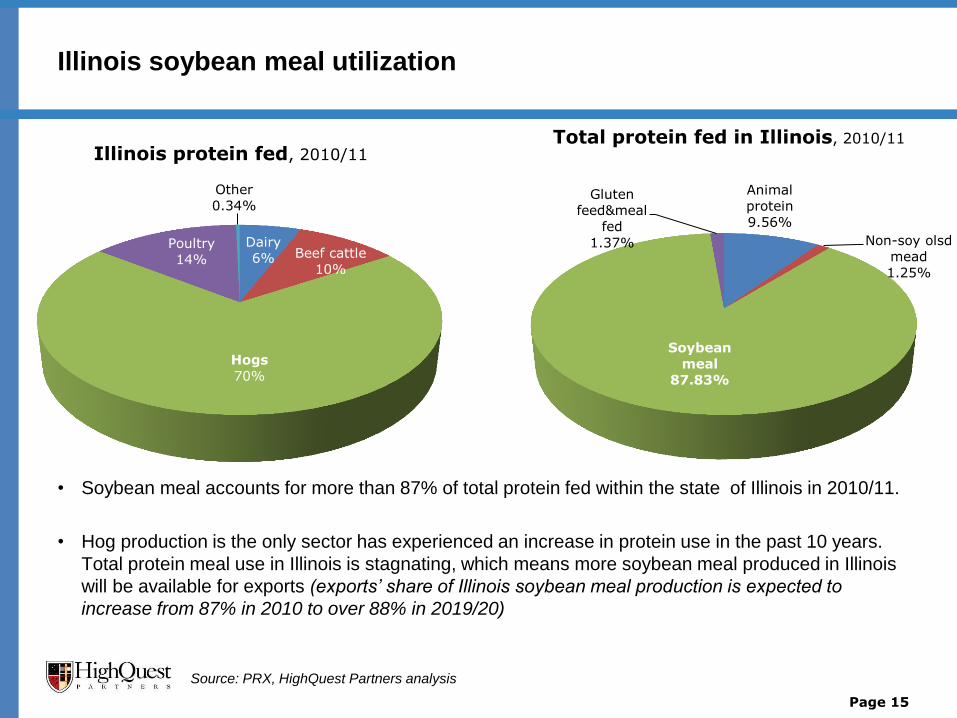
• Soybean meal accounts for more than 87% of total protein fed within the state of Illinois in 2010/11.
• Hog production is the only sector has experienced an increase in protein use in the past 10 years.
Total protein meal use in Illinois is stagnating, which means more soybean meal produced in Illinois
will be available for exports (exports’ share of Illinois soybean meal production is expected to
increase from 87% in 2010 to over 88% in 2019/20)
Page 15
Dairy
6% Beef cattle
10%
Hogs
70%
Poultry
14%
Other
0.34%
Illinois protein fed, 2010/11
Animal
protein
9.56%
Non-soy olsd
mead
1.25%
Soybean
meal
87.83%
Gluten
feed&meal
fed
1.37%
Total protein fed in Illinois, 2010/11
Source: PRX, HighQuest Partners analysis
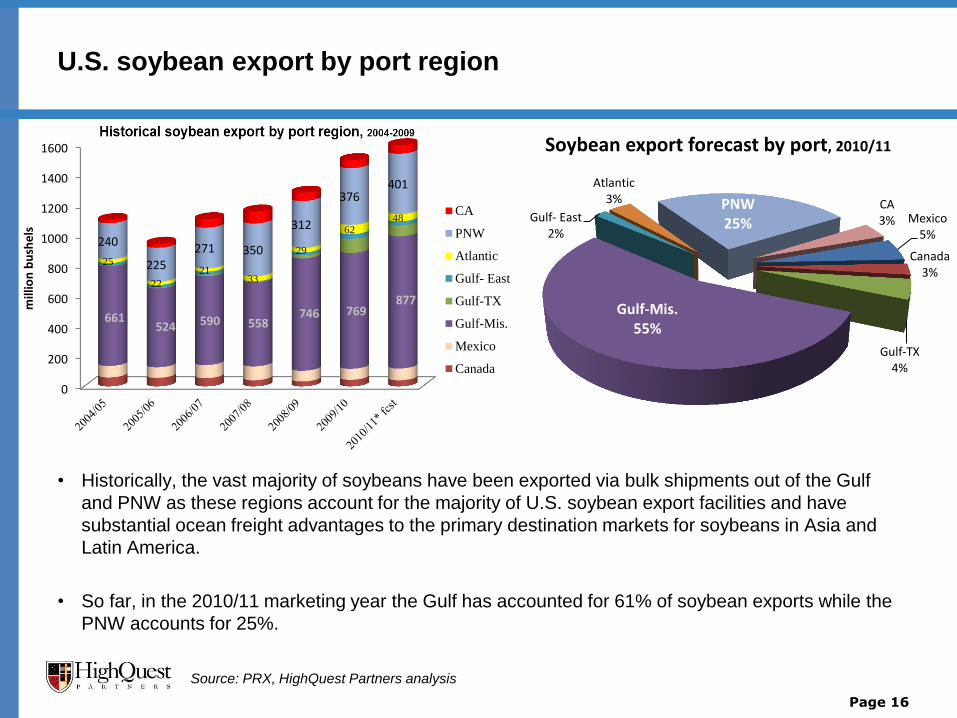
U.S. soybean export by port region
• Historically, the vast majority of soybeans have been exported via bulk shipments out of the Gulf
and PNW as these regions account for the majority of U.S. soybean export facilities and have
substantial ocean freight advantages to the primary destination markets for soybeans in Asia and
Latin America.
• So far, in the 2010/11 marketing year the Gulf has accounted for 61% of soybean exports while the
PNW accounts for 25%.
Page 16
Source: PRX, HighQuest Partners analysis
0
200
400
600
800
1000
1200
1400
1600
661 524 590 558
746 769 877
25
22
21 33
29
62 48
240
225
271 350
312
376 401
mill
ion
bu
she
ls
CA
PNW
Atlantic
Gulf- East
Gulf-TX
Gulf-Mis.
Mexico
Canada
Mexico 5%
Canada 3%
Gulf-TX 4%
Gulf-Mis. 55%
Gulf- East 2%
Atlantic 3% PNW
25%
CA 3%
Soybean export forecast by port, 2010/11
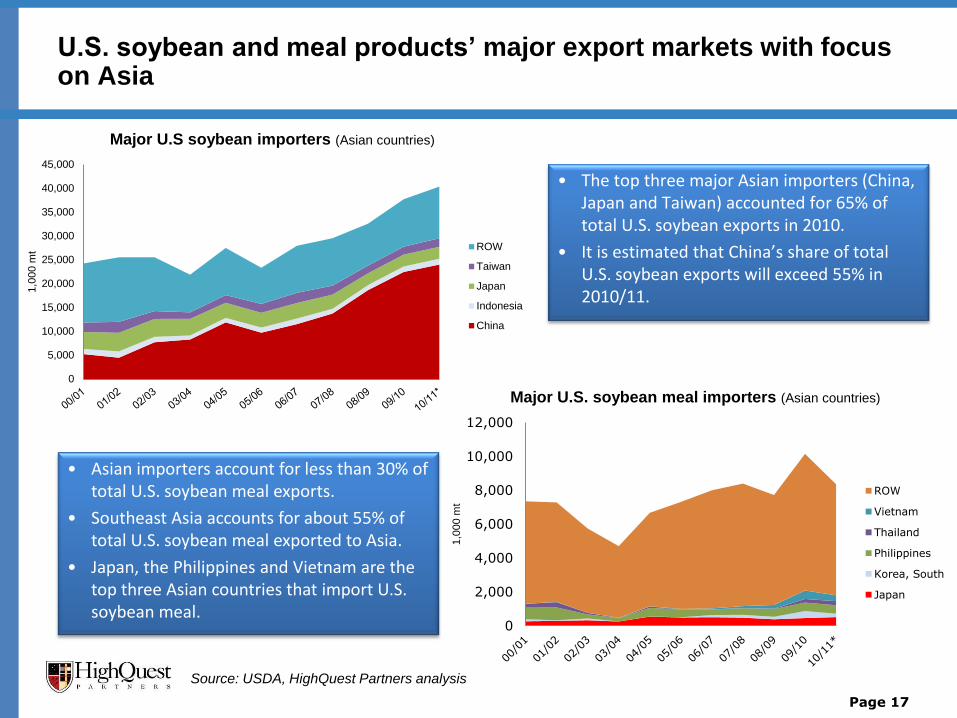
U.S. soybean and meal products’ major export markets with focus on Asia
• The top three major Asian importers (China, Japan and Taiwan) accounted for 65% of total U.S. soybean exports in 2010.
• It is estimated that China’s share of total U.S. soybean exports will exceed 55% in 2010/11.
Page 17
• Asian importers account for less than 30% of total U.S. soybean meal exports.
• Southeast Asia accounts for about 55% of total U.S. soybean meal exported to Asia.
• Japan, the Philippines and Vietnam are the top three Asian countries that import U.S. soybean meal.
Source: USDA, HighQuest Partners analysis
0
5,000
10,000
15,000
20,000
25,000
30,000
35,000
40,000
45,000
1,0
00 m
t
Major U.S soybean importers (Asian countries)
ROW
Taiwan
Japan
Indonesia
China
0
2,000
4,000
6,000
8,000
10,000
12,000
1,0
00 m
t
Major U.S. soybean meal importers (Asian countries)
ROW
Vietnam
Thailand
Philippines
Korea, South
Japan
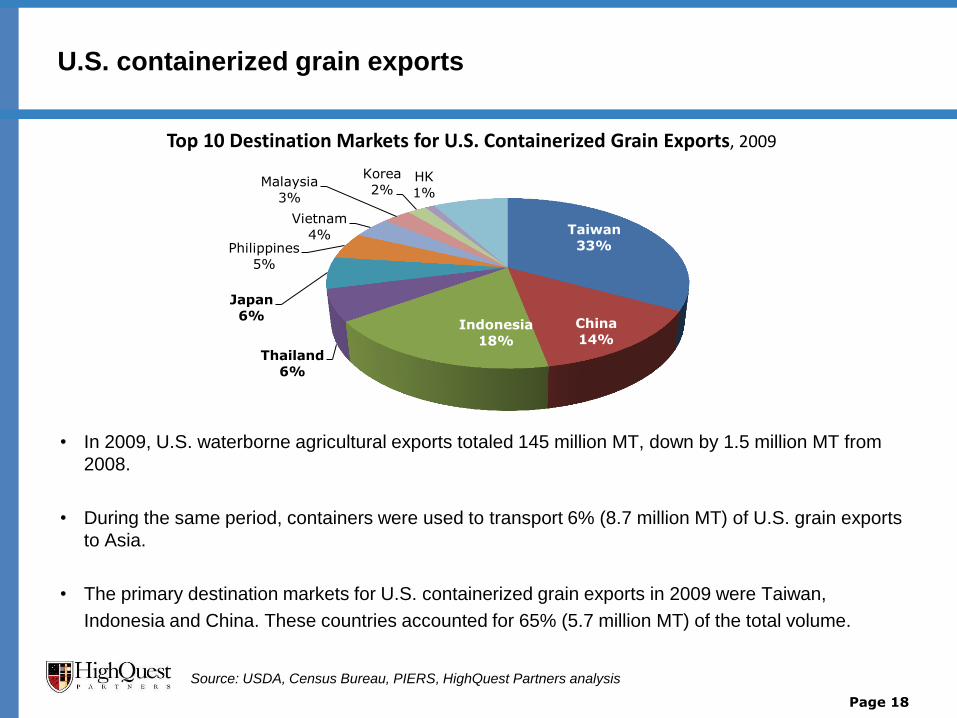
• In 2009, U.S. waterborne agricultural exports totaled 145 million MT, down by 1.5 million MT from
2008.
• During the same period, containers were used to transport 6% (8.7 million MT) of U.S. grain exports
to Asia.
• The primary destination markets for U.S. containerized grain exports in 2009 were Taiwan,
Indonesia and China. These countries accounted for 65% (5.7 million MT) of the total volume.
Page 18
Taiwan
33%
China
14% Indonesia
18% Thailand
6%
Japan
6%
Philippines
5%
Vietnam
4%
Malaysia
3%
Korea
2% HK
1%
Others
8%
Top 10 Destination Markets for U.S. Containerized Grain Exports, 2009
U.S. containerized grain exports
Source: USDA, Census Bureau, PIERS, HighQuest Partners analysis
Page 19
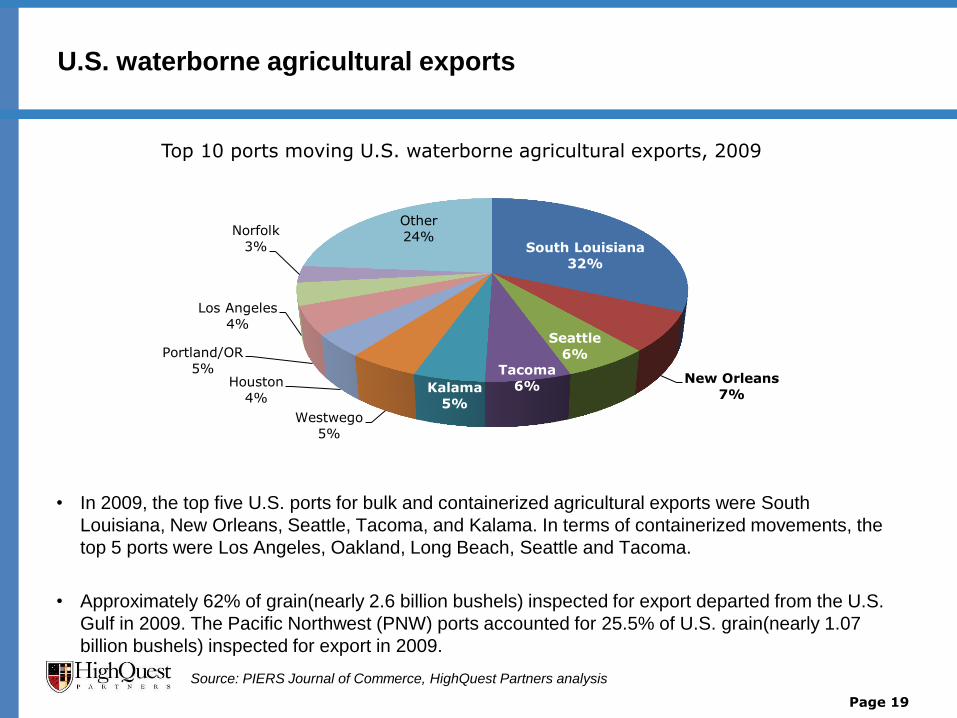
U.S. waterborne agricultural exports
Source: PIERS Journal of Commerce, HighQuest Partners analysis
• In 2009, the top five U.S. ports for bulk and containerized agricultural exports were South
Louisiana, New Orleans, Seattle, Tacoma, and Kalama. In terms of containerized movements, the
top 5 ports were Los Angeles, Oakland, Long Beach, Seattle and Tacoma.
• Approximately 62% of grain(nearly 2.6 billion bushels) inspected for export departed from the U.S.
Gulf in 2009. The Pacific Northwest (PNW) ports accounted for 25.5% of U.S. grain(nearly 1.07
billion bushels) inspected for export in 2009.
South Louisiana
32%
New Orleans
7%
Seattle
6% Tacoma
6% Kalama
5% Westwego
5%
Houston
4%
Portland/OR
5%
Los Angeles
4%
Norfolk
3%
Other
24%
Top 10 ports moving U.S. waterborne agricultural exports, 2009
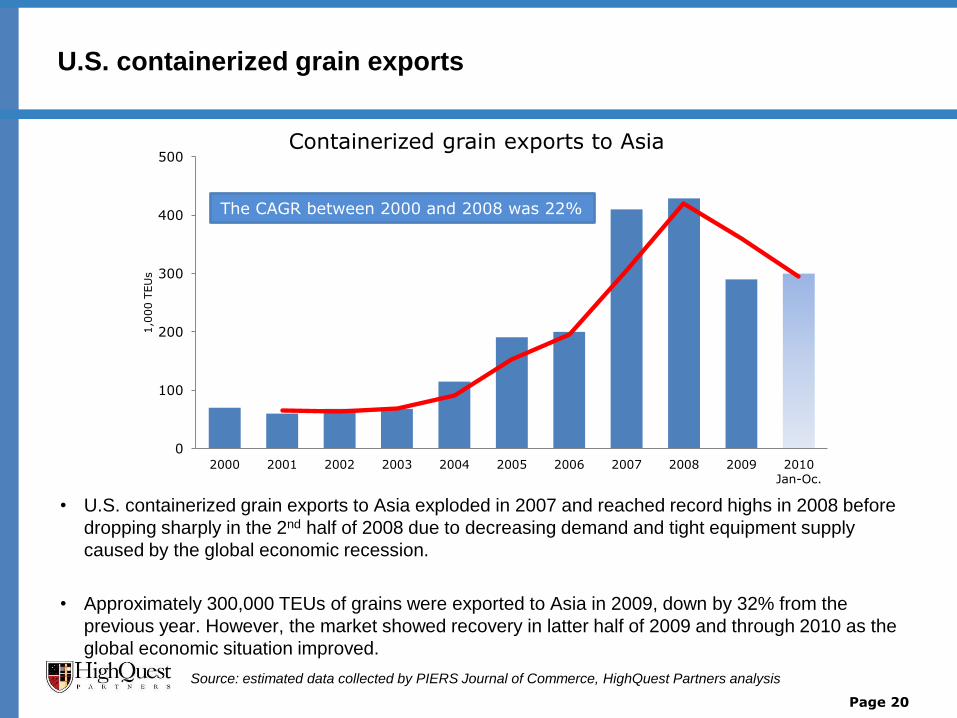
• U.S. containerized grain exports to Asia exploded in 2007 and reached record highs in 2008 before
dropping sharply in the 2nd half of 2008 due to decreasing demand and tight equipment supply
caused by the global economic recession.
• Approximately 300,000 TEUs of grains were exported to Asia in 2009, down by 32% from the
previous year. However, the market showed recovery in latter half of 2009 and through 2010 as the
global economic situation improved.
Page 20
U.S. containerized grain exports
Source: estimated data collected by PIERS Journal of Commerce, HighQuest Partners analysis
0
100
200
300
400
500
2000 2001 2002 2003 2004 2005 2006 2007 2008 2009 2010Jan-Oc.
1,0
00 T
EU
s
Containerized grain exports to Asia
The CAGR between 2000 and 2008 was 22%
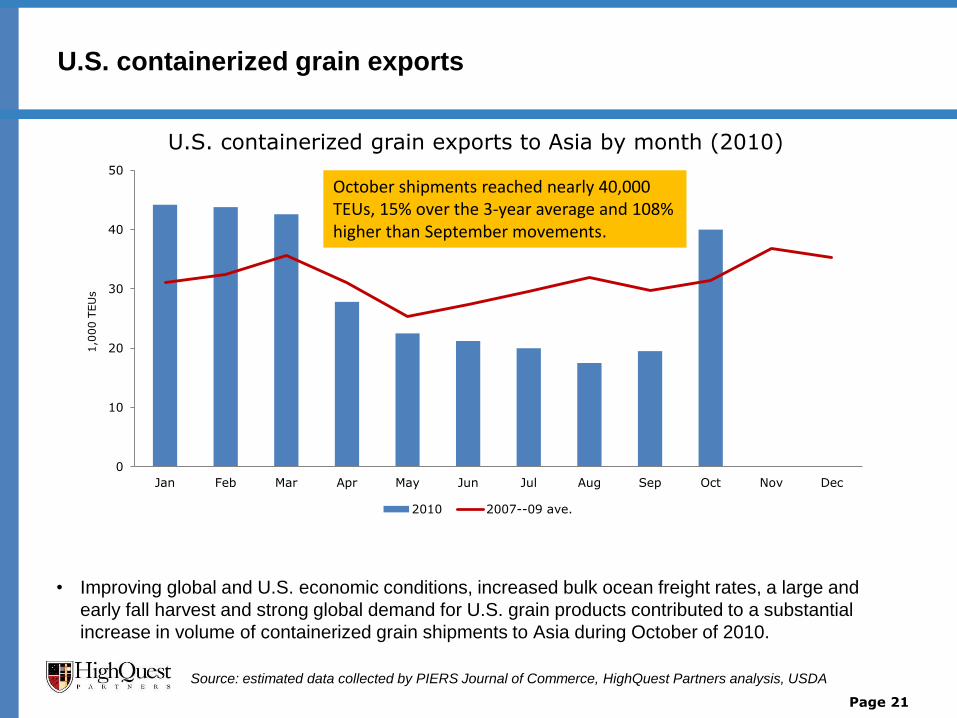
• Improving global and U.S. economic conditions, increased bulk ocean freight rates, a large and
early fall harvest and strong global demand for U.S. grain products contributed to a substantial
increase in volume of containerized grain shipments to Asia during October of 2010.
Page 21
U.S. containerized grain exports
Source: estimated data collected by PIERS Journal of Commerce, HighQuest Partners analysis, USDA
0
10
20
30
40
50
Jan Feb Mar Apr May Jun Jul Aug Sep Oct Nov Dec
1,0
00 T
EU
s
U.S. containerized grain exports to Asia by month (2010)
2010 2007--09 ave.
October shipments reached nearly 40,000 TEUs, 15% over the 3-year average and 108% higher than September movements.
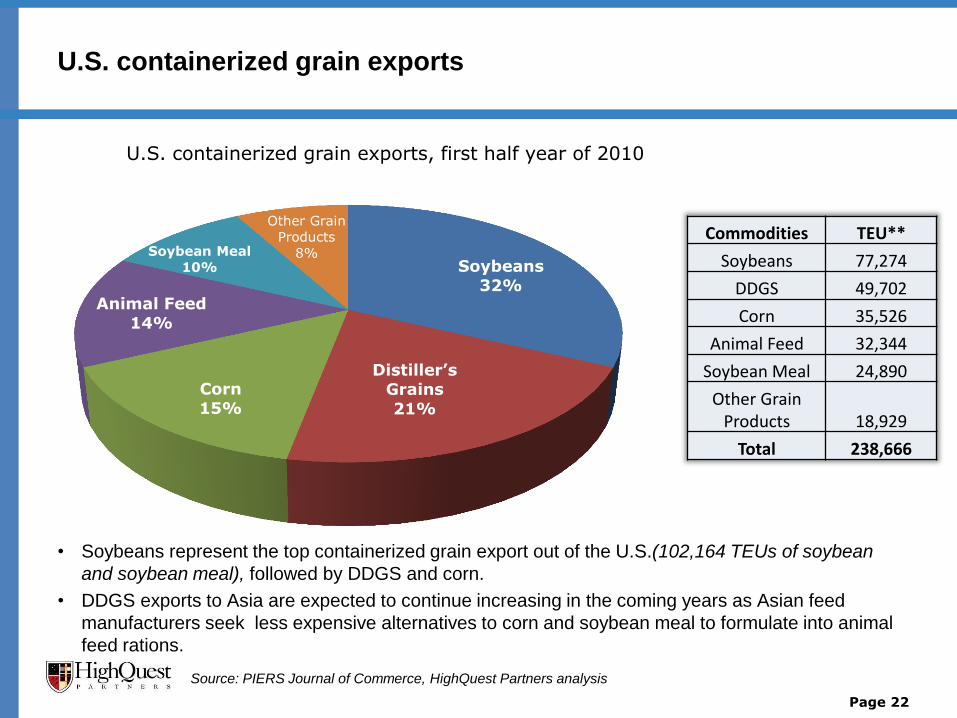
• Soybeans represent the top containerized grain export out of the U.S.(102,164 TEUs of soybean
and soybean meal), followed by DDGS and corn.
• DDGS exports to Asia are expected to continue increasing in the coming years as Asian feed
manufacturers seek less expensive alternatives to corn and soybean meal to formulate into animal
feed rations.
Page 22
U.S. containerized grain exports
Soybeans 32%
Distiller’s Grains
21%
Corn 15%
Animal Feed 14%
Soybean Meal
10%
Other Grain
Products
8%
U.S. containerized grain exports, first half year of 2010
Source: PIERS Journal of Commerce, HighQuest Partners analysis
Commodities TEU**
Soybeans 77,274
DDGS 49,702
Corn 35,526
Animal Feed 32,344
Soybean Meal 24,890
Other Grain Products 18,929
Total 238,666
U.S. soybean exports to Asia via container
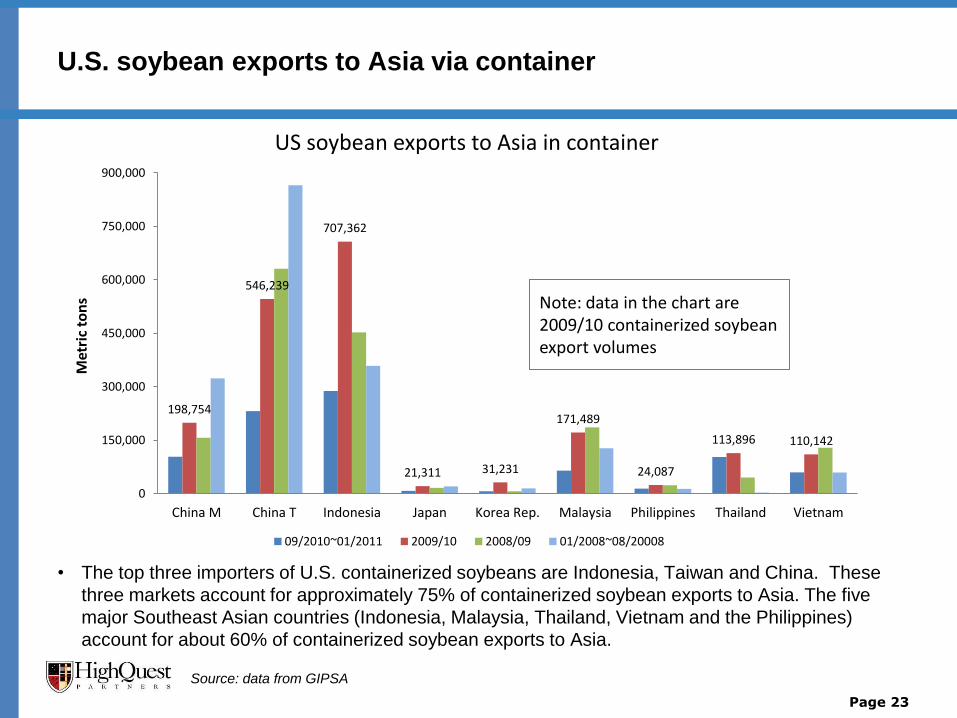
• The top three importers of U.S. containerized soybeans are Indonesia, Taiwan and China. These
three markets account for approximately 75% of containerized soybean exports to Asia. The five
major Southeast Asian countries (Indonesia, Malaysia, Thailand, Vietnam and the Philippines)
account for about 60% of containerized soybean exports to Asia.
Page 23
Source: data from GIPSA
198,754
546,239
707,362
21,311 31,231
171,489
24,087
113,896 110,142
0
150,000
300,000
450,000
600,000
750,000
900,000
China M China T Indonesia Japan Korea Rep. Malaysia Philippines Thailand Vietnam
Met
ric
ton
s
US soybean exports to Asia in container
09/2010~01/2011 2009/10 2008/09 01/2008~08/20008
Note: data in the chart are 2009/10 containerized soybean export volumes
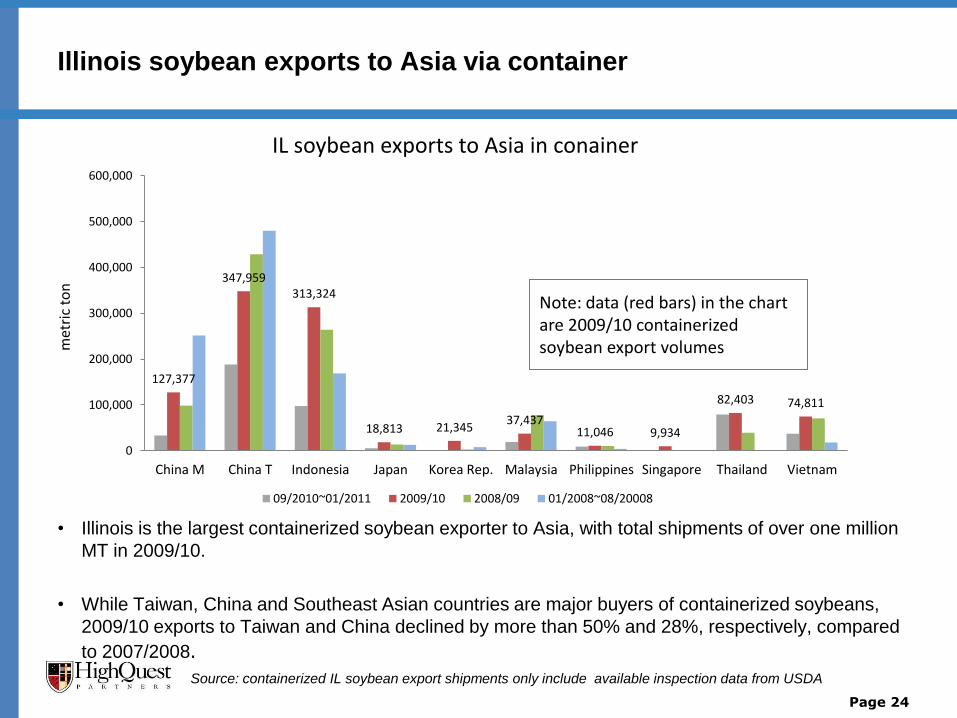
• Illinois is the largest containerized soybean exporter to Asia, with total shipments of over one million
MT in 2009/10.
• While Taiwan, China and Southeast Asian countries are major buyers of containerized soybeans,
2009/10 exports to Taiwan and China declined by more than 50% and 28%, respectively, compared
to 2007/2008.
Page 24
Illinois soybean exports to Asia via container
Source: containerized IL soybean export shipments only include available inspection data from USDA
127,377
347,959 313,324
18,813 21,345 37,437
11,046 9,934
82,403 74,811
0
100,000
200,000
300,000
400,000
500,000
600,000
China M China T Indonesia Japan Korea Rep. Malaysia Philippines Singapore Thailand Vietnam
met
ric
ton
IL soybean exports to Asia in conainer
09/2010~01/2011 2009/10 2008/09 01/2008~08/20008
Note: data (red bars) in the chart are 2009/10 containerized soybean export volumes
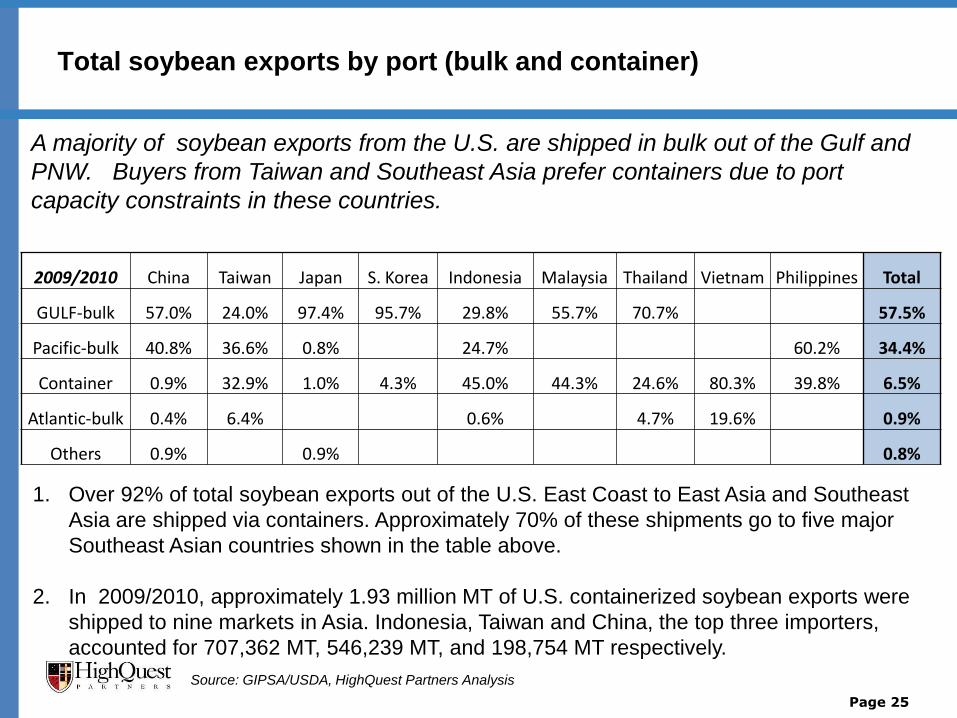
Total soybean exports by port (bulk and container)
Page 25
A majority of soybean exports from the U.S. are shipped in bulk out of the Gulf and
PNW. Buyers from Taiwan and Southeast Asia prefer containers due to port
capacity constraints in these countries.
Source: GIPSA/USDA, HighQuest Partners Analysis
2009/2010 China Taiwan Japan S. Korea Indonesia Malaysia Thailand Vietnam Philippines Total
GULF-bulk 57.0% 24.0% 97.4% 95.7% 29.8% 55.7% 70.7% 57.5%
Pacific-bulk 40.8% 36.6% 0.8% 24.7% 60.2% 34.4%
Container 0.9% 32.9% 1.0% 4.3% 45.0% 44.3% 24.6% 80.3% 39.8% 6.5%
Atlantic-bulk 0.4% 6.4% 0.6% 4.7% 19.6% 0.9%
Others 0.9% 0.9% 0.8%
1. Over 92% of total soybean exports out of the U.S. East Coast to East Asia and Southeast
Asia are shipped via containers. Approximately 70% of these shipments go to five major
Southeast Asian countries shown in the table above.
2. In 2009/2010, approximately 1.93 million MT of U.S. containerized soybean exports were
shipped to nine markets in Asia. Indonesia, Taiwan and China, the top three importers,
accounted for 707,362 MT, 546,239 MT, and 198,754 MT respectively.
Overview of container industry - current and projected availability of containers
• Most of the large Post-Panamax containerships delivered in 2010 were assigned to the more
lucrative Asia/Europe routes, while most of the remaining units have joined Far East/U.S. routes.
• A record number of Post-Panamax containerships with capacity of more than 7,500 TEUs will be
delivered in 2011.
• Collectively these new vessels will increase the capacity of the world containership fleet by 860,000
TEUs next year, accounting for approximately 63% of all new slots due for delivery in 2011.
• It is estimated that there will be 49 new Post-Panamax ships delivered in 2011 with capacity of
more than 10,000 TEUs (compared to 29 in 2010 and 15 in 2009), as well as delivery of 27 ships
with capacity of 7,500-9,999 TEUs in 2011 (compared to 32 in 2010 and 18 in 2009).
• The expected VLCS deliveries in 2011 are likely to enable carriers to mount four to five new high-
capacity Asia/Europe routes and five Asia/U.S. routes, with most of these expected to be launched
in the first half of the year.
Page 26
Source: Alphaliner, Journal of Commerce
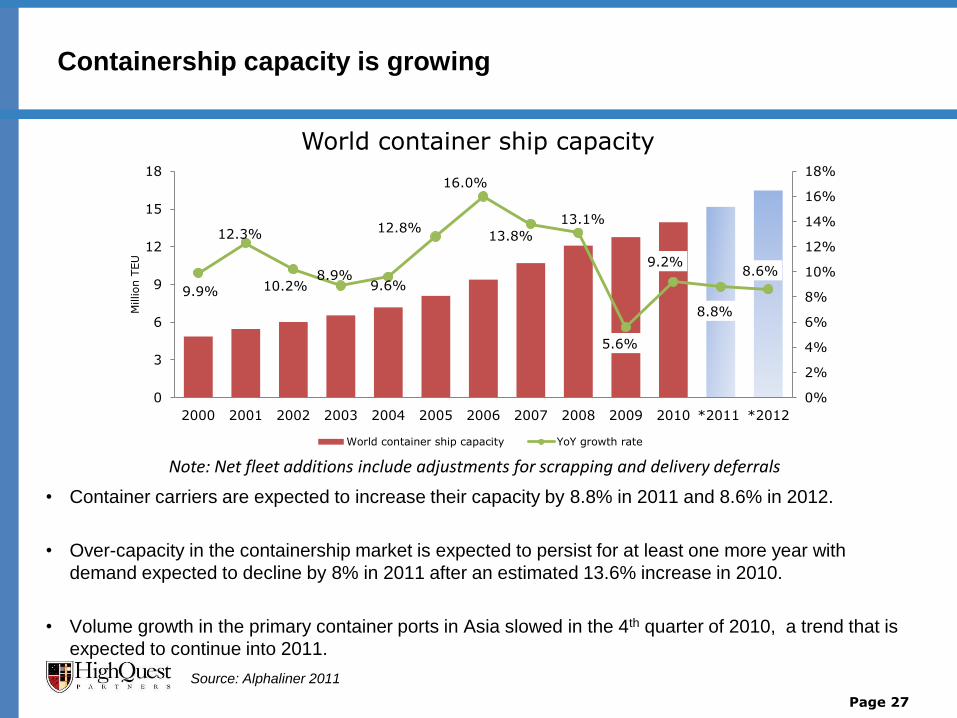
Containership capacity is growing
• Container carriers are expected to increase their capacity by 8.8% in 2011 and 8.6% in 2012.
• Over-capacity in the containership market is expected to persist for at least one more year with
demand expected to decline by 8% in 2011 after an estimated 13.6% increase in 2010.
• Volume growth in the primary container ports in Asia slowed in the 4th quarter of 2010, a trend that is
expected to continue into 2011.
Page 27
Source: Alphaliner 2011
Note: Net fleet additions include adjustments for scrapping and delivery deferrals
9.9%
12.3%
10.2% 8.9%
9.6%
12.8%
16.0%
13.8%
13.1%
5.6%
9.2%
8.8%
8.6%
0%
2%
4%
6%
8%
10%
12%
14%
16%
18%
0
3
6
9
12
15
18
2000 2001 2002 2003 2004 2005 2006 2007 2008 2009 2010 *2011 *2012
Million T
EU
World container ship capacity
World container ship capacity YoY growth rate
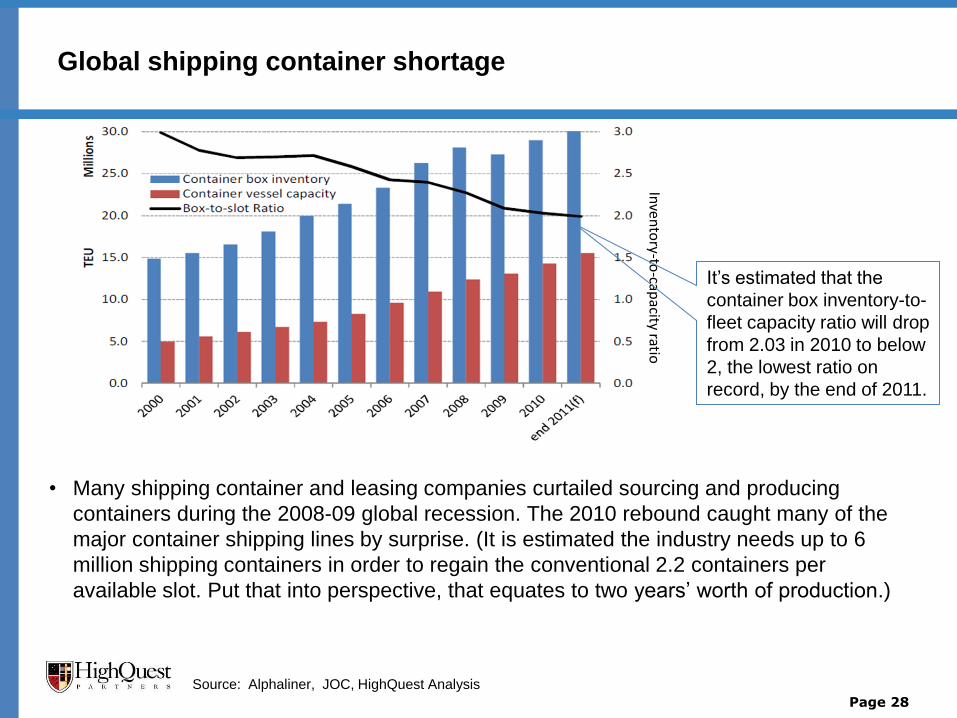
Global shipping container shortage
• Many shipping container and leasing companies curtailed sourcing and producing
containers during the 2008-09 global recession. The 2010 rebound caught many of the
major container shipping lines by surprise. (It is estimated the industry needs up to 6
million shipping containers in order to regain the conventional 2.2 containers per
available slot. Put that into perspective, that equates to two years’ worth of production.)
Page 28
Inven
tory-to
-capacity ratio
It’s estimated that the
container box inventory-to-
fleet capacity ratio will drop
from 2.03 in 2010 to below
2, the lowest ratio on
record, by the end of 2011.
Source: Alphaliner, JOC, HighQuest Analysis
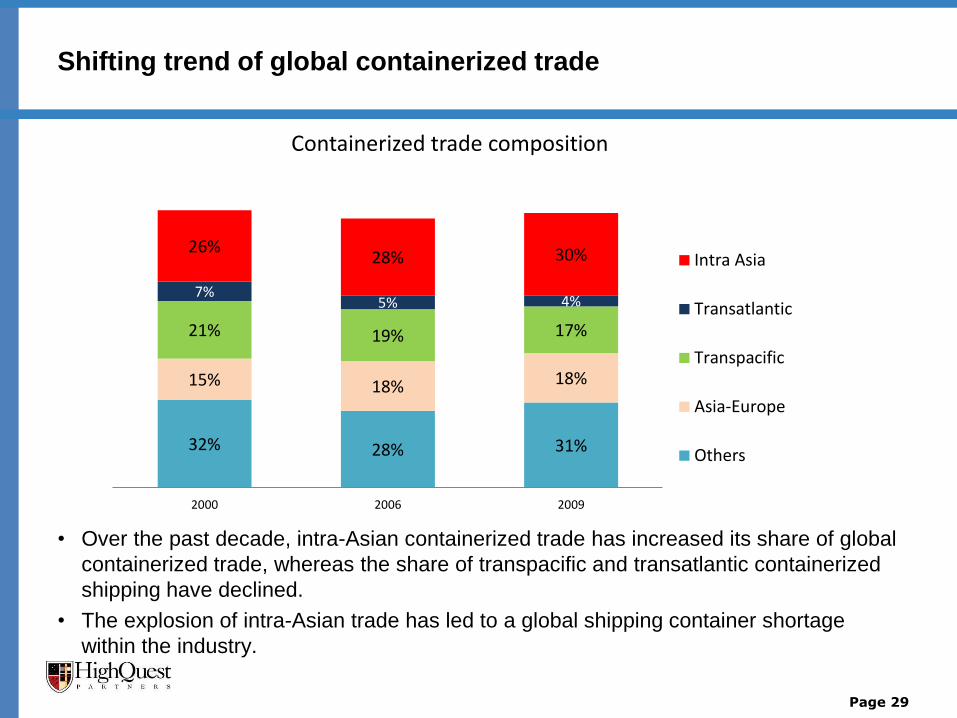
Shifting trend of global containerized trade
• Over the past decade, intra-Asian containerized trade has increased its share of global
containerized trade, whereas the share of transpacific and transatlantic containerized
shipping have declined.
• The explosion of intra-Asian trade has led to a global shipping container shortage
within the industry.
Page 29
32% 28% 31%
15% 18% 18%
21% 19% 17%
7% 5% 4%
26% 28% 30%
2000 2006 2009
Containerized trade composition
Intra Asia
Transatlantic
Transpacific
Asia-Europe
Others
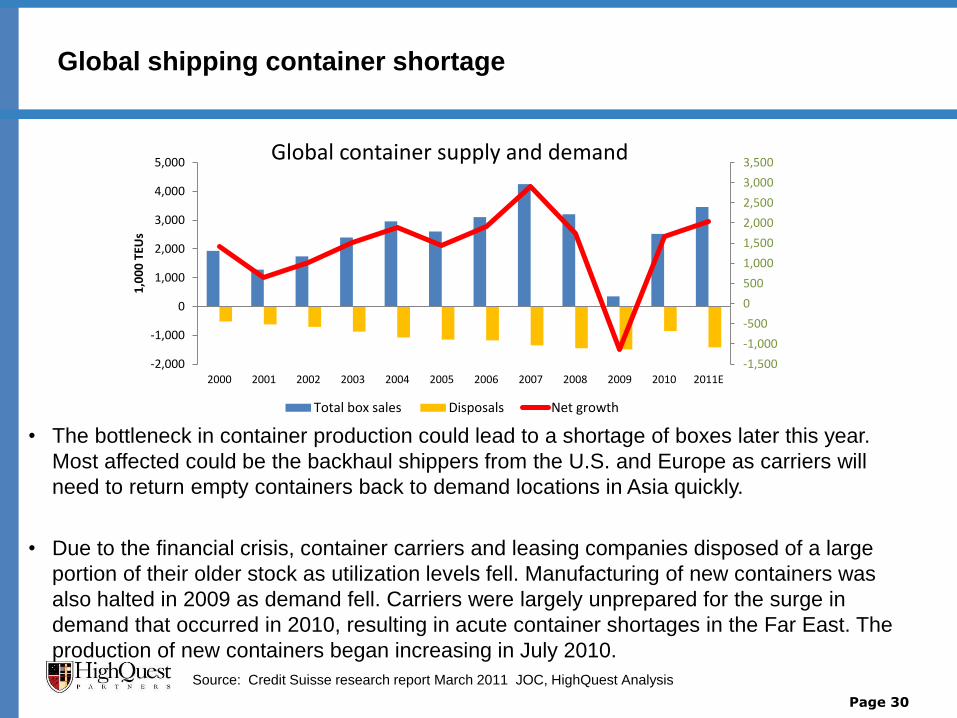
Global shipping container shortage
Page 30
Source: Credit Suisse research report March 2011 JOC, HighQuest Analysis
• The bottleneck in container production could lead to a shortage of boxes later this year.
Most affected could be the backhaul shippers from the U.S. and Europe as carriers will
need to return empty containers back to demand locations in Asia quickly.
• Due to the financial crisis, container carriers and leasing companies disposed of a large
portion of their older stock as utilization levels fell. Manufacturing of new containers was
also halted in 2009 as demand fell. Carriers were largely unprepared for the surge in
demand that occurred in 2010, resulting in acute container shortages in the Far East. The
production of new containers began increasing in July 2010.
-1,500
-1,000
-500
0
500
1,000
1,500
2,000
2,500
3,000
3,500
-2,000
-1,000
0
1,000
2,000
3,000
4,000
5,000
2000 2001 2002 2003 2004 2005 2006 2007 2008 2009 2010 2011E
1,0
00
TEU
s
Global container supply and demand
Total box sales Disposals Net growth
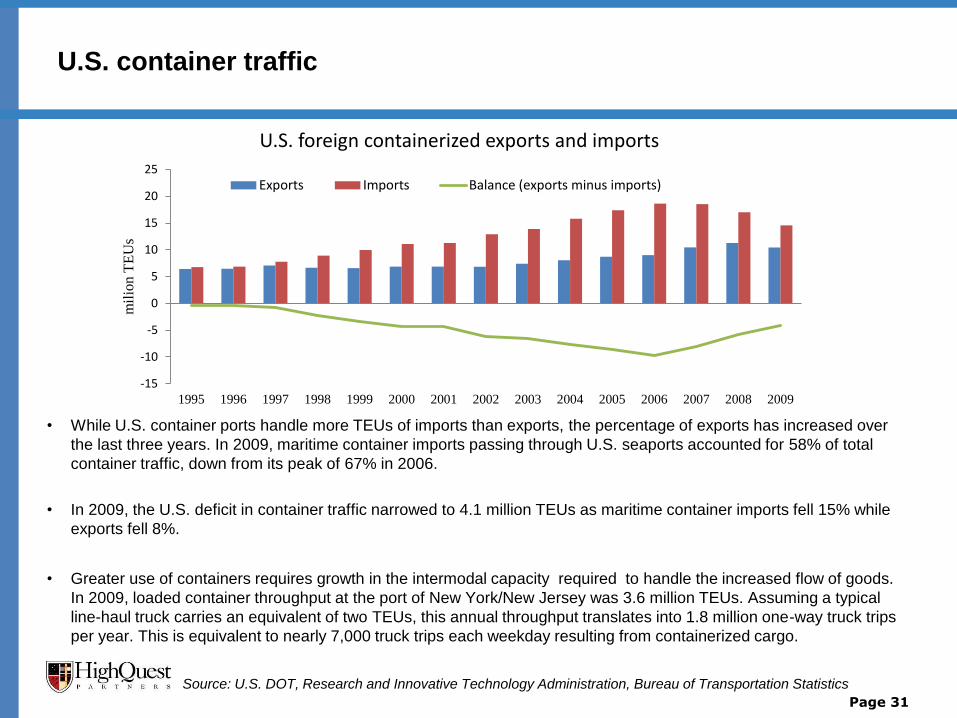
U.S. container traffic
• While U.S. container ports handle more TEUs of imports than exports, the percentage of exports has increased over
the last three years. In 2009, maritime container imports passing through U.S. seaports accounted for 58% of total
container traffic, down from its peak of 67% in 2006.
• In 2009, the U.S. deficit in container traffic narrowed to 4.1 million TEUs as maritime container imports fell 15% while
exports fell 8%.
• Greater use of containers requires growth in the intermodal capacity required to handle the increased flow of goods.
In 2009, loaded container throughput at the port of New York/New Jersey was 3.6 million TEUs. Assuming a typical
line-haul truck carries an equivalent of two TEUs, this annual throughput translates into 1.8 million one-way truck trips
per year. This is equivalent to nearly 7,000 truck trips each weekday resulting from containerized cargo.
Page 31
Source: U.S. DOT, Research and Innovative Technology Administration, Bureau of Transportation Statistics
-15
-10
-5
0
5
10
15
20
25
1995 1996 1997 1998 1999 2000 2001 2002 2003 2004 2005 2006 2007 2008 2009
mil
ion T
EU
s U.S. foreign containerized exports and imports
Exports Imports Balance (exports minus imports)
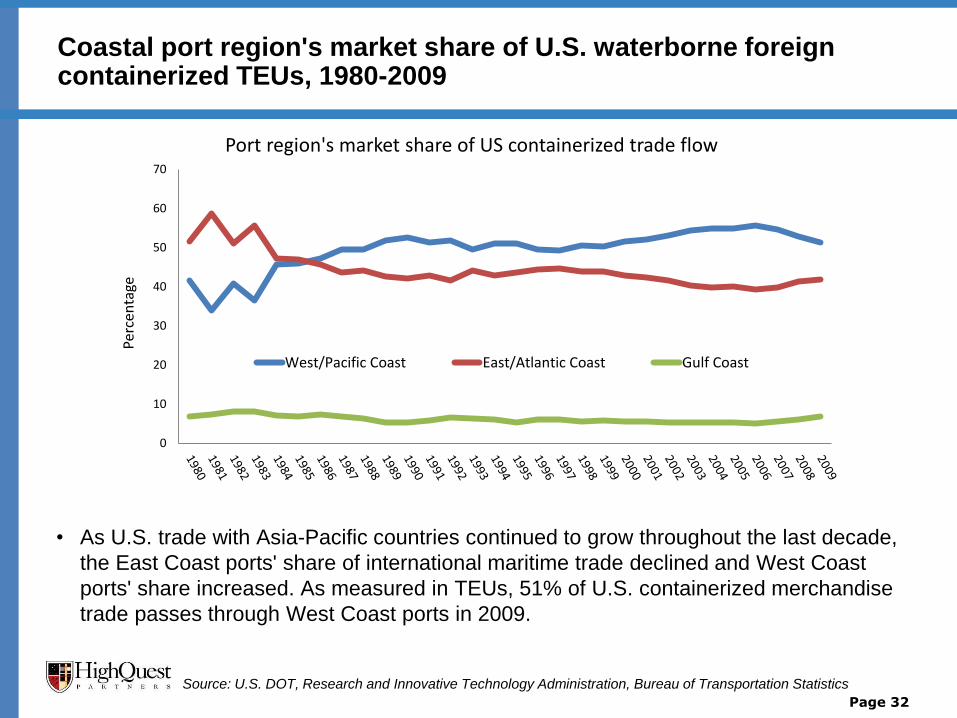
Coastal port region's market share of U.S. waterborne foreign containerized TEUs, 1980-2009
• As U.S. trade with Asia-Pacific countries continued to grow throughout the last decade,
the East Coast ports' share of international maritime trade declined and West Coast
ports' share increased. As measured in TEUs, 51% of U.S. containerized merchandise
trade passes through West Coast ports in 2009.
Page 32
Source: U.S. DOT, Research and Innovative Technology Administration, Bureau of Transportation Statistics
0
10
20
30
40
50
60
70
Perc
enta
ge
Port region's market share of US containerized trade flow
West/Pacific Coast East/Atlantic Coast Gulf Coast
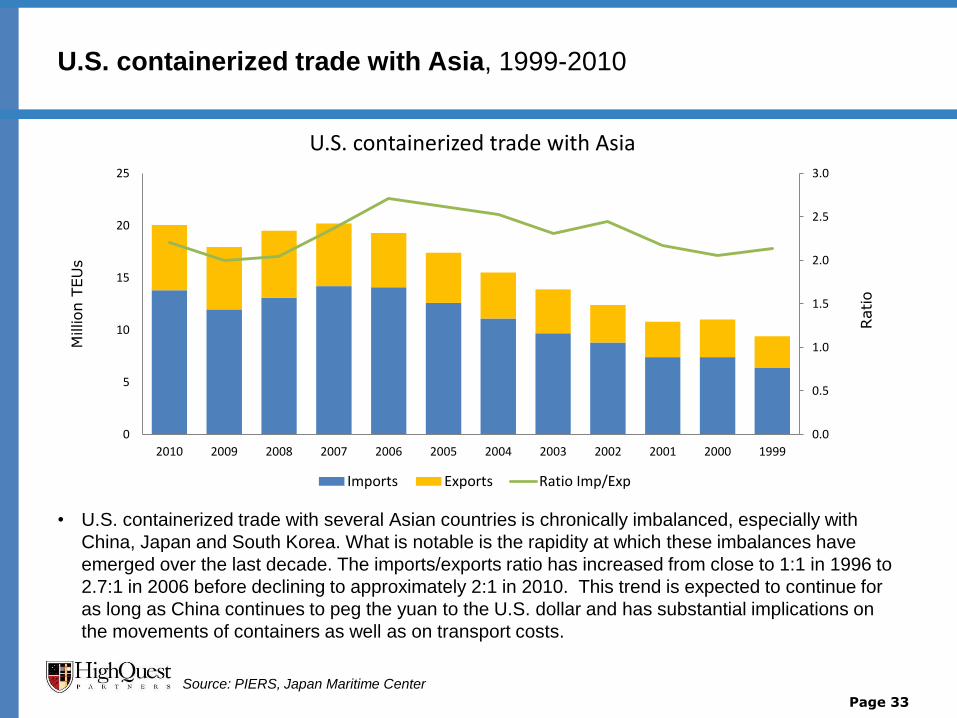
U.S. containerized trade with Asia, 1999-2010
• U.S. containerized trade with several Asian countries is chronically imbalanced, especially with
China, Japan and South Korea. What is notable is the rapidity at which these imbalances have
emerged over the last decade. The imports/exports ratio has increased from close to 1:1 in 1996 to
2.7:1 in 2006 before declining to approximately 2:1 in 2010. This trend is expected to continue for
as long as China continues to peg the yuan to the U.S. dollar and has substantial implications on
the movements of containers as well as on transport costs.
Page 33
Source: PIERS, Japan Maritime Center
Million T
EU
s
Ratio
0.0
0.5
1.0
1.5
2.0
2.5
3.0
0
5
10
15
20
25
2010 2009 2008 2007 2006 2005 2004 2003 2002 2001 2000 1999
U.S. containerized trade with Asia
Imports Exports Ratio Imp/Exp
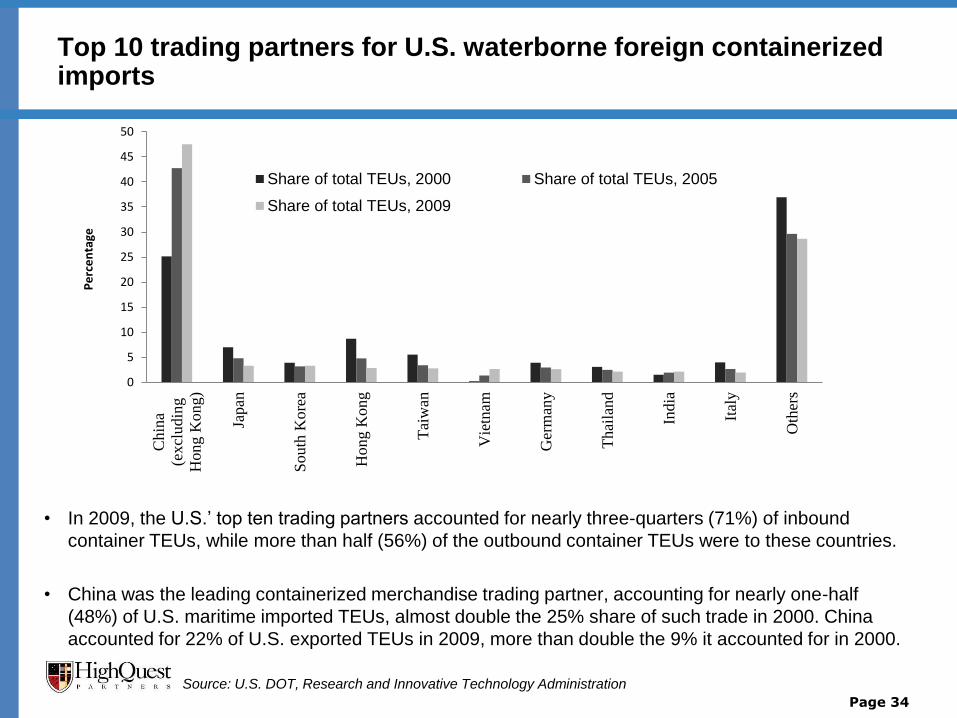
Top 10 trading partners for U.S. waterborne foreign containerized imports
• In 2009, the U.S.’ top ten trading partners accounted for nearly three-quarters (71%) of inbound
container TEUs, while more than half (56%) of the outbound container TEUs were to these countries.
• China was the leading containerized merchandise trading partner, accounting for nearly one-half
(48%) of U.S. maritime imported TEUs, almost double the 25% share of such trade in 2000. China
accounted for 22% of U.S. exported TEUs in 2009, more than double the 9% it accounted for in 2000.
Page 34
Source: U.S. DOT, Research and Innovative Technology Administration
0
5
10
15
20
25
30
35
40
45
50
Chin
a
(excl
udin
g
Hong K
ong)
Japan
South
Kore
a
Hong K
ong
Tai
wan
Vie
tnam
Ger
man
y
Thai
land
India
Ital
y
Oth
ers
Pe
rce
nta
ge
Share of total TEUs, 2000 Share of total TEUs, 2005
Share of total TEUs, 2009
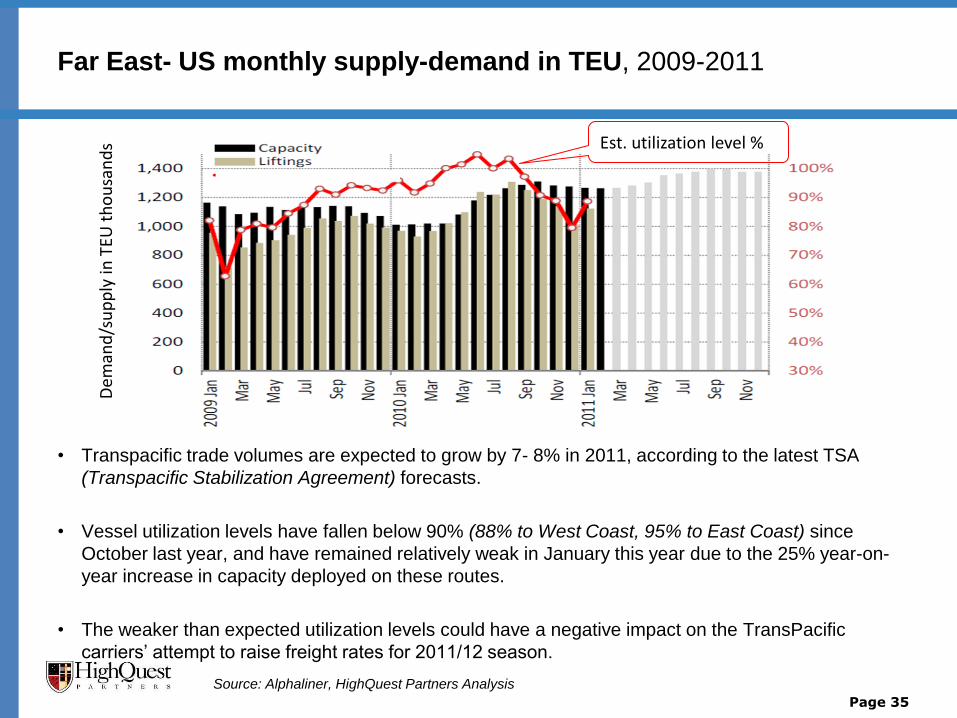
Far East- US monthly supply-demand in TEU, 2009-2011
• Transpacific trade volumes are expected to grow by 7- 8% in 2011, according to the latest TSA
(Transpacific Stabilization Agreement) forecasts.
• Vessel utilization levels have fallen below 90% (88% to West Coast, 95% to East Coast) since
October last year, and have remained relatively weak in January this year due to the 25% year-on-
year increase in capacity deployed on these routes.
• The weaker than expected utilization levels could have a negative impact on the TransPacific
carriers’ attempt to raise freight rates for 2011/12 season.
Page 35
Source: Alphaliner, HighQuest Partners Analysis
Dem
and
/su
pp
ly in
TEU
th
ou
san
ds Est. utilization level %
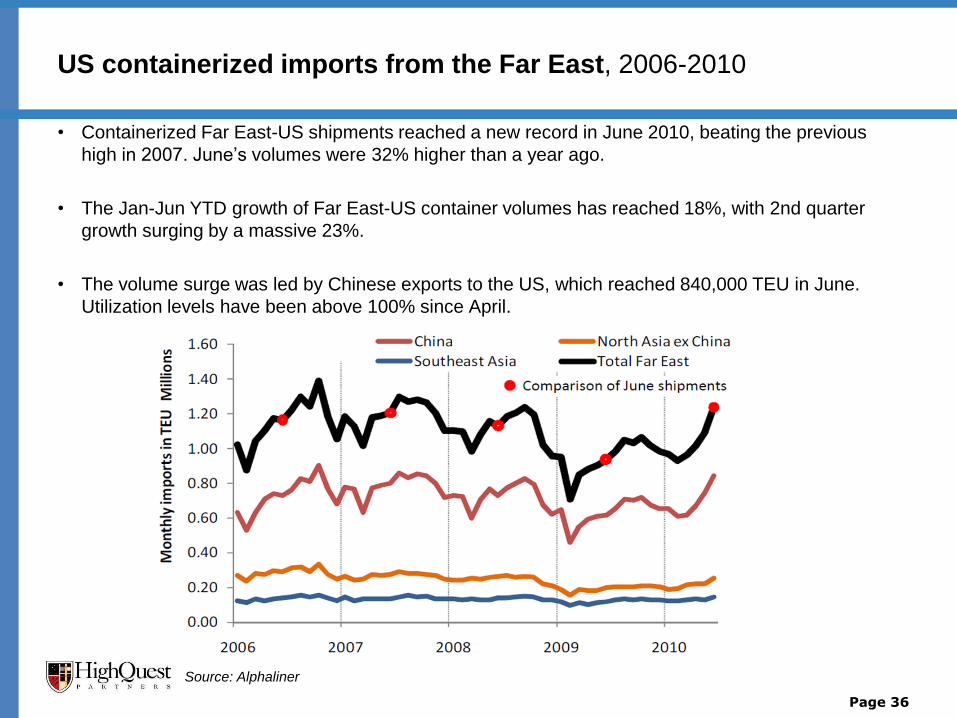
US containerized imports from the Far East, 2006-2010
• Containerized Far East-US shipments reached a new record in June 2010, beating the previous
high in 2007. June’s volumes were 32% higher than a year ago.
• The Jan-Jun YTD growth of Far East-US container volumes has reached 18%, with 2nd quarter
growth surging by a massive 23%.
• The volume surge was led by Chinese exports to the US, which reached 840,000 TEU in June.
Utilization levels have been above 100% since April.
Source: Alphaliner
Page 36
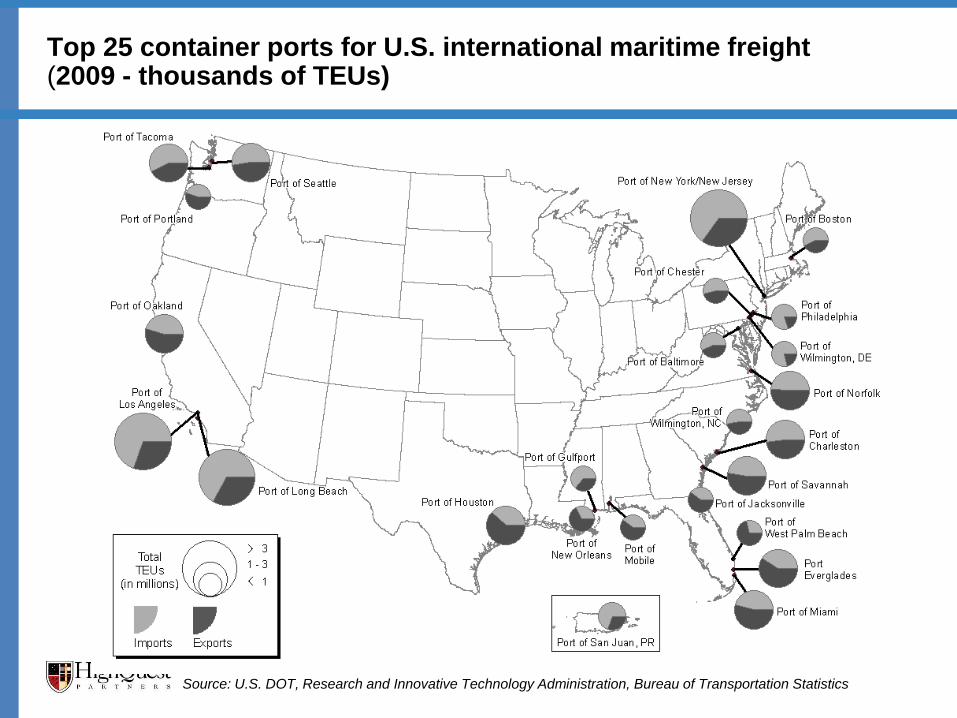
Top 25 container ports for U.S. international maritime freight (2009 - thousands of TEUs)
Source: U.S. DOT, Research and Innovative Technology Administration, Bureau of Transportation Statistics
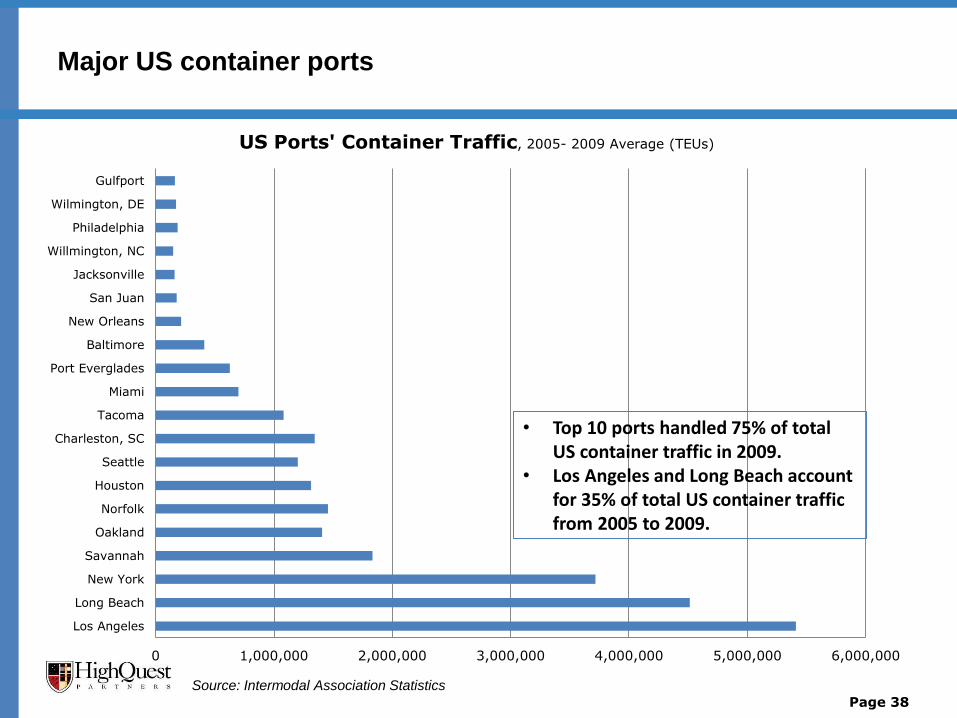
Major US container ports
Source: Intermodal Association Statistics
Page 38
0 1,000,000 2,000,000 3,000,000 4,000,000 5,000,000 6,000,000
Los Angeles
Long Beach
New York
Savannah
Oakland
Norfolk
Houston
Seattle
Charleston, SC
Tacoma
Miami
Port Everglades
Baltimore
New Orleans
San Juan
Jacksonville
Willmington, NC
Philadelphia
Wilmington, DE
Gulfport
US Ports' Container Traffic, 2005- 2009 Average (TEUs)
• Top 10 ports handled 75% of total US container traffic in 2009.
• Los Angeles and Long Beach account for 35% of total US container traffic from 2005 to 2009.
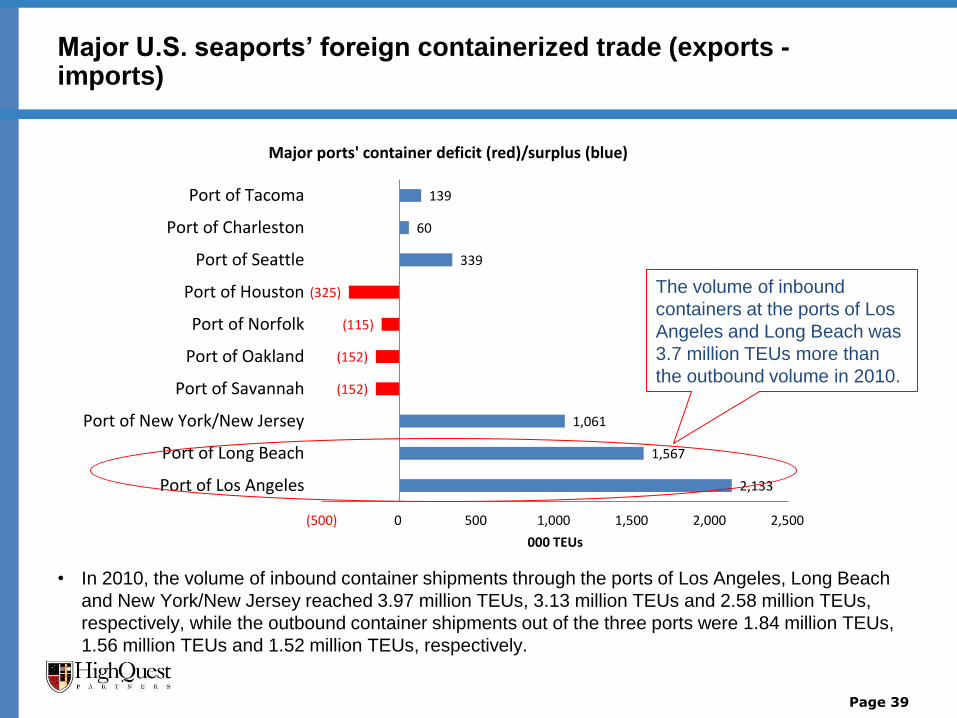
Major U.S. seaports’ foreign containerized trade (exports - imports)
• In 2010, the volume of inbound container shipments through the ports of Los Angeles, Long Beach
and New York/New Jersey reached 3.97 million TEUs, 3.13 million TEUs and 2.58 million TEUs,
respectively, while the outbound container shipments out of the three ports were 1.84 million TEUs,
1.56 million TEUs and 1.52 million TEUs, respectively.
Page 39
2,133
1,567
1,061
(152)
(152)
(115)
(325)
339
60
139
(500) 0 500 1,000 1,500 2,000 2,500
Port of Los Angeles
Port of Long Beach
Port of New York/New Jersey
Port of Savannah
Port of Oakland
Port of Norfolk
Port of Houston
Port of Seattle
Port of Charleston
Port of Tacoma
000 TEUs
Major ports' container deficit (red)/surplus (blue)
The volume of inbound
containers at the ports of Los
Angeles and Long Beach was
3.7 million TEUs more than
the outbound volume in 2010.
Container freight in US agriculture
• U.S. agricultural exporters began viewing container freight as a viable option for
shipping goods to Asia in 2007 when bulk freight prices rose substantially.
• The primary reason that agricultural exporters started using container freight was due
to the economy in the U.S. at that time.
– As the U.S. economy was in a significant boom period, U.S. consumers were importing large
volumes of Asian electronic and inter-modal goods into the U.S. via containers.
– The challenge for container shipping companies was that there was not the same demand for
U.S. goods in Asia, so containers were returning empty.
– The container companies realized that they needed to pursue new markets in order to secure
backhaul to Asia in their containers and they began to pursue agricultural products by offering
very cheap rates that were competitive with bulk shipments.
• Historically, the primary driver of container freight prices has been availability, not
distance, so it is better to locate a trans-loader near an inter-modal hub where
containers are readily available.
• In the Midwest, Chicago represents the low price container market (despite its distance
from the major West Coast ports) due to its high availability of containers.
Page 40
Container freight rates to Asia
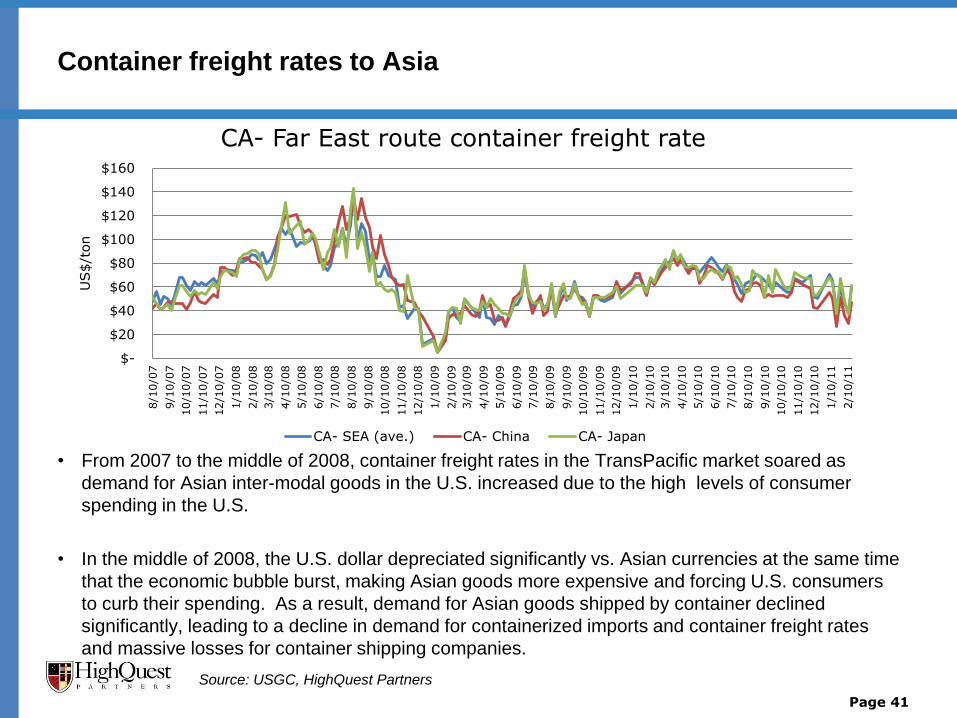
• From 2007 to the middle of 2008, container freight rates in the TransPacific market soared as
demand for Asian inter-modal goods in the U.S. increased due to the high levels of consumer
spending in the U.S.
• In the middle of 2008, the U.S. dollar depreciated significantly vs. Asian currencies at the same time
that the economic bubble burst, making Asian goods more expensive and forcing U.S. consumers
to curb their spending. As a result, demand for Asian goods shipped by container declined
significantly, leading to a decline in demand for containerized imports and container freight rates
and massive losses for container shipping companies.
Page 41
$-
$20
$40
$60
$80
$100
$120
$140
$160
8/1
0/0
7
9/1
0/0
7
10/1
0/0
7
11/1
0/0
7
12/1
0/0
7
1/1
0/0
8
2/1
0/0
8
3/1
0/0
8
4/1
0/0
8
5/1
0/0
8
6/1
0/0
8
7/1
0/0
8
8/1
0/0
8
9/1
0/0
8
10/1
0/0
8
11/1
0/0
8
12/1
0/0
8
1/1
0/0
9
2/1
0/0
9
3/1
0/0
9
4/1
0/0
9
5/1
0/0
9
6/1
0/0
9
7/1
0/0
9
8/1
0/0
9
9/1
0/0
9
10/1
0/0
9
11/1
0/0
9
12/1
0/0
9
1/1
0/1
0
2/1
0/1
0
3/1
0/1
0
4/1
0/1
0
5/1
0/1
0
6/1
0/1
0
7/1
0/1
0
8/1
0/1
0
9/1
0/1
0
10/1
0/1
0
11/1
0/1
0
12/1
0/1
0
1/1
0/1
1
2/1
0/1
1
US$/t
on
CA- Far East route container freight rate
CA- SEA (ave.) CA- China CA- Japan
Source: USGC, HighQuest Partners
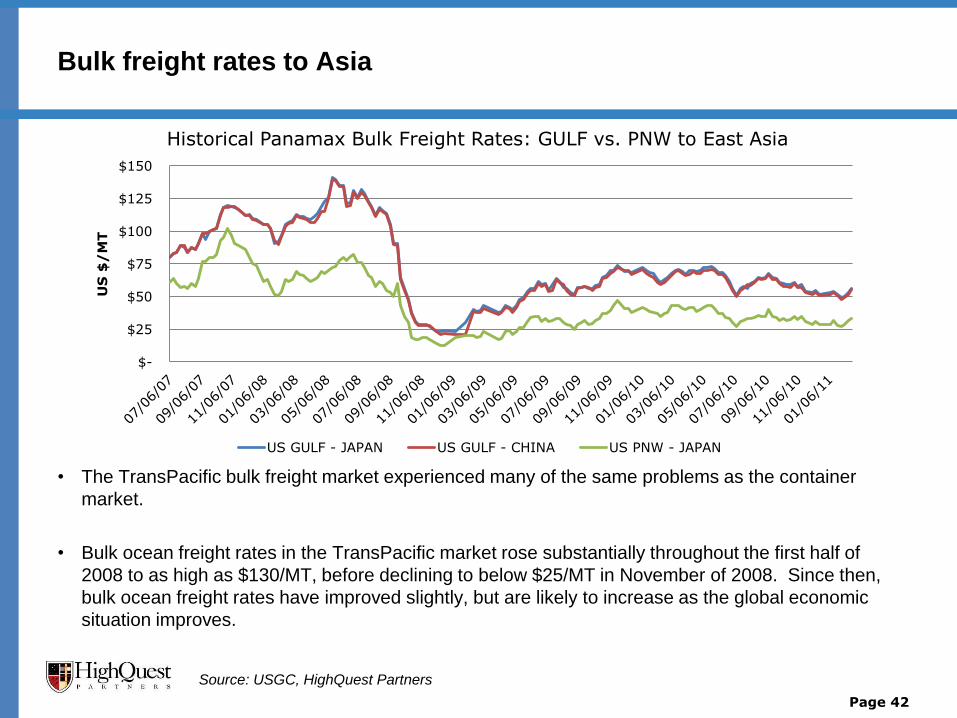
• The TransPacific bulk freight market experienced many of the same problems as the container
market.
• Bulk ocean freight rates in the TransPacific market rose substantially throughout the first half of
2008 to as high as $130/MT, before declining to below $25/MT in November of 2008. Since then,
bulk ocean freight rates have improved slightly, but are likely to increase as the global economic
situation improves.
Page 42
Bulk freight rates to Asia
Source: USGC, HighQuest Partners
$-
$25
$50
$75
$100
$125
$150
US
$/
MT
Historical Panamax Bulk Freight Rates: GULF vs. PNW to East Asia
US GULF - JAPAN US GULF - CHINA US PNW - JAPAN
Seasonal patterns of U.S. soybean exports to major Asian markets
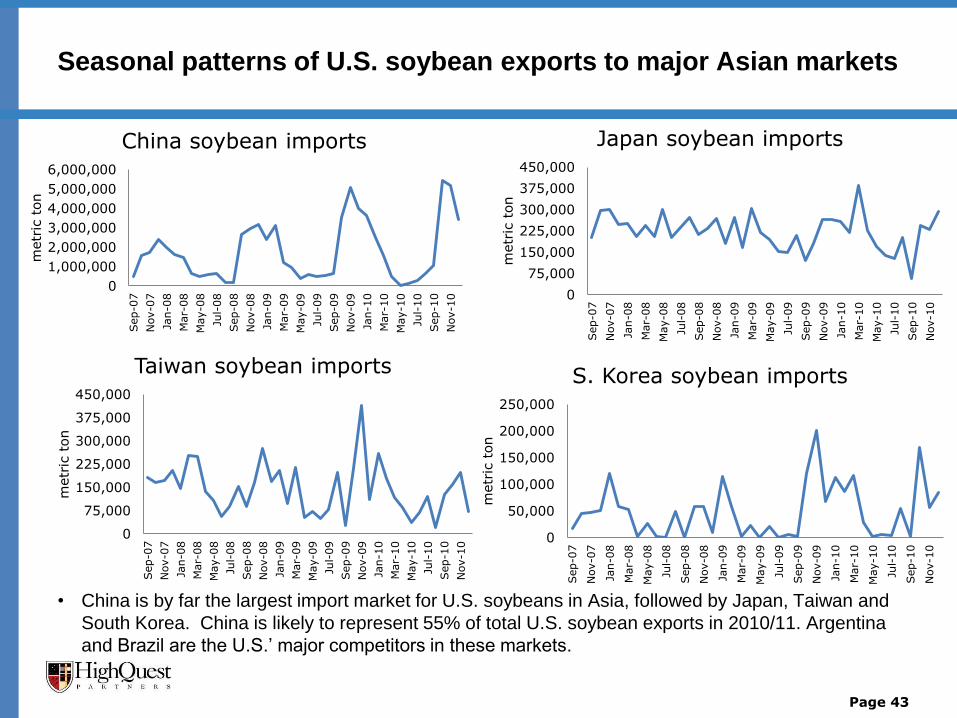
• China is by far the largest import market for U.S. soybeans in Asia, followed by Japan, Taiwan and
South Korea. China is likely to represent 55% of total U.S. soybean exports in 2010/11. Argentina
and Brazil are the U.S.’ major competitors in these markets.
Page 43
0
1,000,000
2,000,000
3,000,000
4,000,000
5,000,000
6,000,000
Sep-0
7
Nov-0
7
Jan-0
8
Mar-
08
May-0
8
Jul-
08
Sep-0
8
Nov-0
8
Jan-0
9
Mar-
09
May-0
9
Jul-
09
Sep-0
9
Nov-0
9
Jan-1
0
Mar-
10
May-1
0
Jul-
10
Sep-1
0
Nov-1
0
metr
ic t
on
China soybean imports
0
75,000
150,000
225,000
300,000
375,000
450,000
Sep-0
7
Nov-0
7
Jan-0
8
Mar-
08
May-0
8
Jul-
08
Sep-0
8
Nov-0
8
Jan-0
9
Mar-
09
May-0
9
Jul-
09
Sep-0
9
Nov-0
9
Jan-1
0
Mar-
10
May-1
0
Jul-
10
Sep-1
0
Nov-1
0
metr
ic t
on
Japan soybean imports
0
75,000
150,000
225,000
300,000
375,000
450,000
Sep-0
7
Nov-0
7
Jan-0
8
Mar-
08
May-0
8
Jul-
08
Sep-0
8
Nov-0
8
Jan-0
9
Mar-
09
May-0
9
Jul-
09
Sep-0
9
Nov-0
9
Jan-1
0
Mar-
10
May-1
0
Jul-
10
Sep-1
0
Nov-1
0
metr
ic t
on
Taiwan soybean imports
0
50,000
100,000
150,000
200,000
250,000
Sep-0
7
Nov-0
7
Jan-0
8
Mar-
08
May-0
8
Jul-
08
Sep-0
8
Nov-0
8
Jan-0
9
Mar-
09
May-0
9
Jul-
09
Sep-0
9
Nov-0
9
Jan-1
0
Mar-
10
May-1
0
Jul-
10
Sep-1
0
Nov-1
0
metr
ic t
on
S. Korea soybean imports
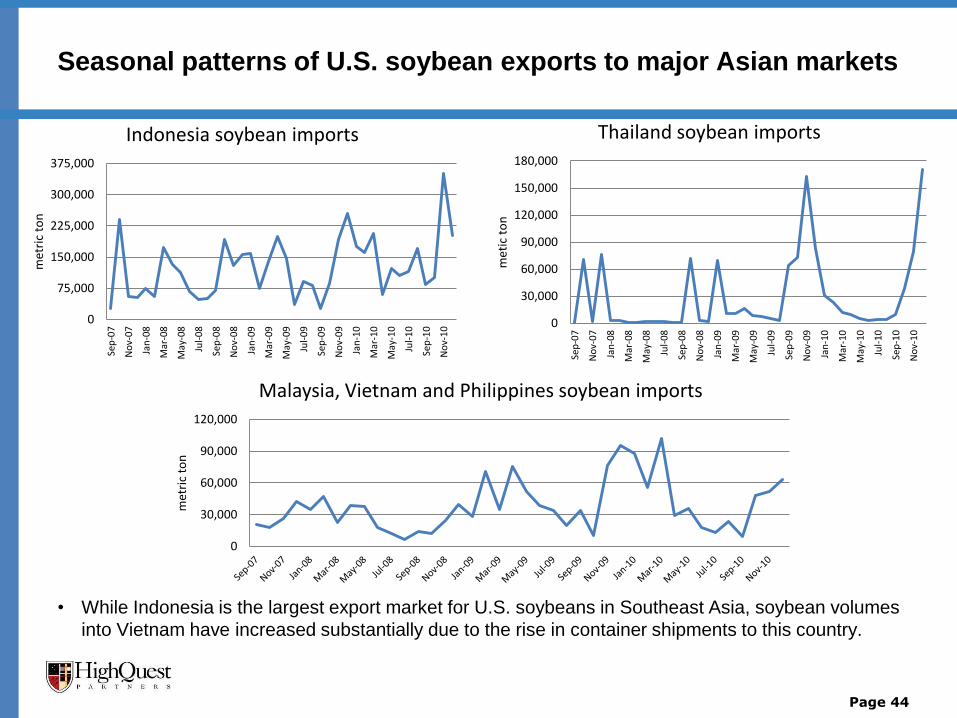
• While Indonesia is the largest export market for U.S. soybeans in Southeast Asia, soybean volumes
into Vietnam have increased substantially due to the rise in container shipments to this country.
Page 44
Seasonal patterns of U.S. soybean exports to major Asian markets
0
75,000
150,000
225,000
300,000
375,000
Sep
-07
No
v-0
7
Jan
-08
Mar
-08
May
-08
Jul-
08
Sep
-08
No
v-0
8
Jan
-09
Mar
-09
May
-09
Jul-
09
Sep
-09
No
v-0
9
Jan
-10
Mar
-10
May
-10
Jul-
10
Sep
-10
No
v-1
0
met
ric
ton
Indonesia soybean imports
0
30,000
60,000
90,000
120,000
150,000
180,000
Sep
-07
No
v-0
7
Jan
-08
Mar
-08
May
-08
Jul-
08
Sep
-08
No
v-0
8
Jan
-09
Mar
-09
May
-09
Jul-
09
Sep
-09
No
v-0
9
Jan
-10
Mar
-10
May
-10
Jul-
10
Sep
-10
No
v-1
0
met
ic t
on
Thailand soybean imports
0
30,000
60,000
90,000
120,000
met
ric
ton
Malaysia, Vietnam and Philippines soybean imports
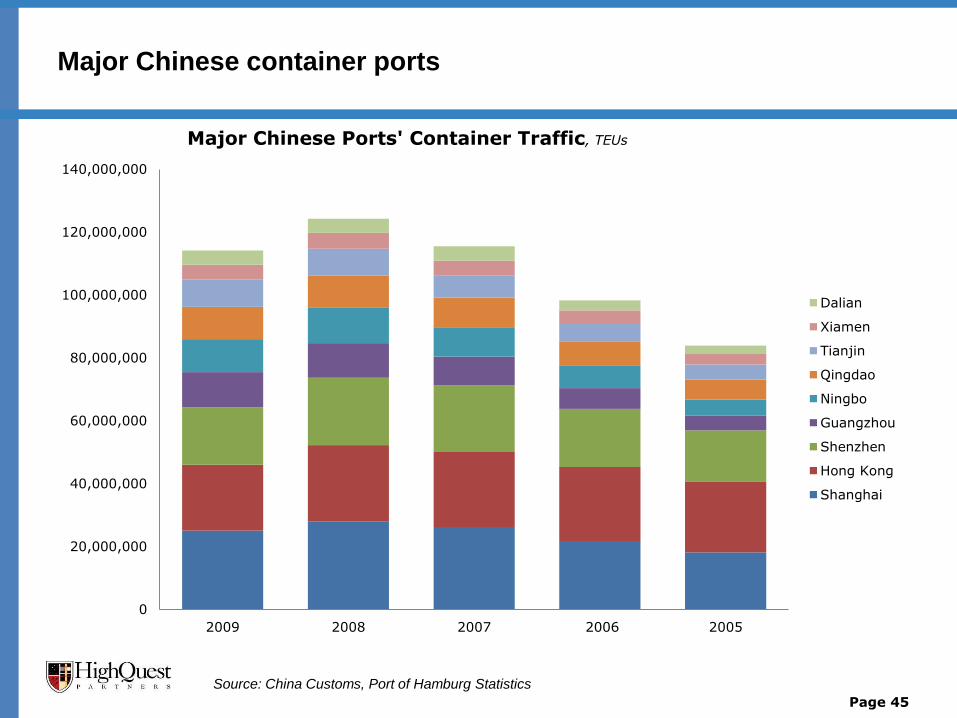
Major Chinese container ports
Source: China Customs, Port of Hamburg Statistics
Page 45
0
20,000,000
40,000,000
60,000,000
80,000,000
100,000,000
120,000,000
140,000,000
2009 2008 2007 2006 2005
Major Chinese Ports' Container Traffic, TEUs
Dalian
Xiamen
Tianjin
Qingdao
Ningbo
Guangzhou
Shenzhen
Hong Kong
Shanghai
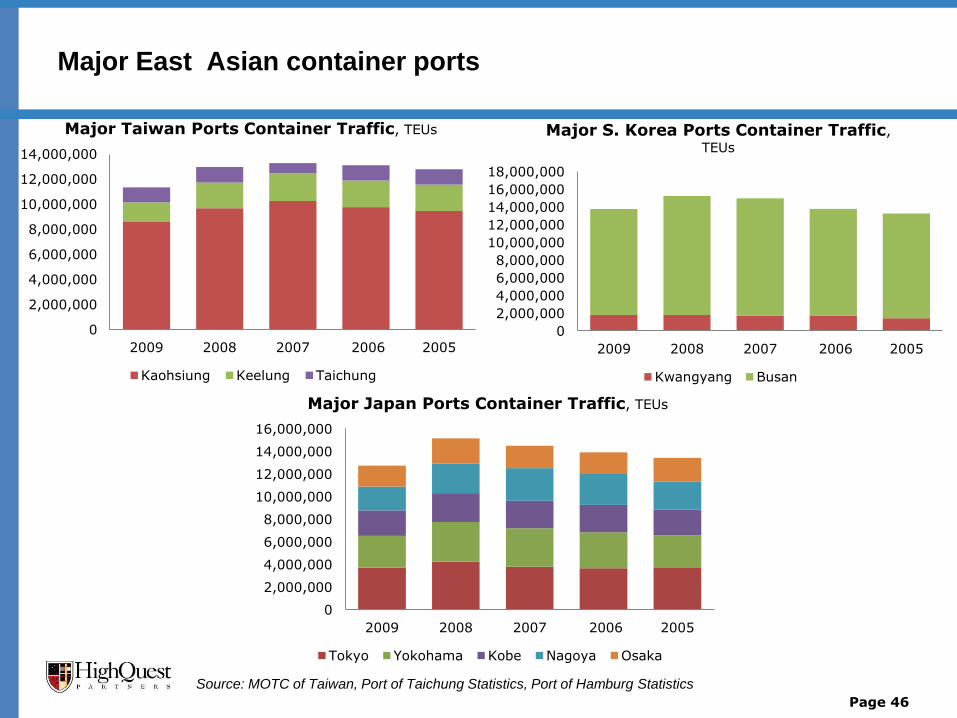
Major East Asian container ports
Page 46
Source: MOTC of Taiwan, Port of Taichung Statistics, Port of Hamburg Statistics
0
2,000,000
4,000,000
6,000,000
8,000,000
10,000,000
12,000,000
14,000,000
2009 2008 2007 2006 2005
Major Taiwan Ports Container Traffic, TEUs
Kaohsiung Keelung Taichung
0
2,000,000
4,000,000
6,000,000
8,000,000
10,000,000
12,000,000
14,000,000
16,000,000
18,000,000
2009 2008 2007 2006 2005
Major S. Korea Ports Container Traffic,
TEUs
Kwangyang Busan
0
2,000,000
4,000,000
6,000,000
8,000,000
10,000,000
12,000,000
14,000,000
16,000,000
2009 2008 2007 2006 2005
Major Japan Ports Container Traffic, TEUs
Tokyo Yokohama Kobe Nagoya Osaka
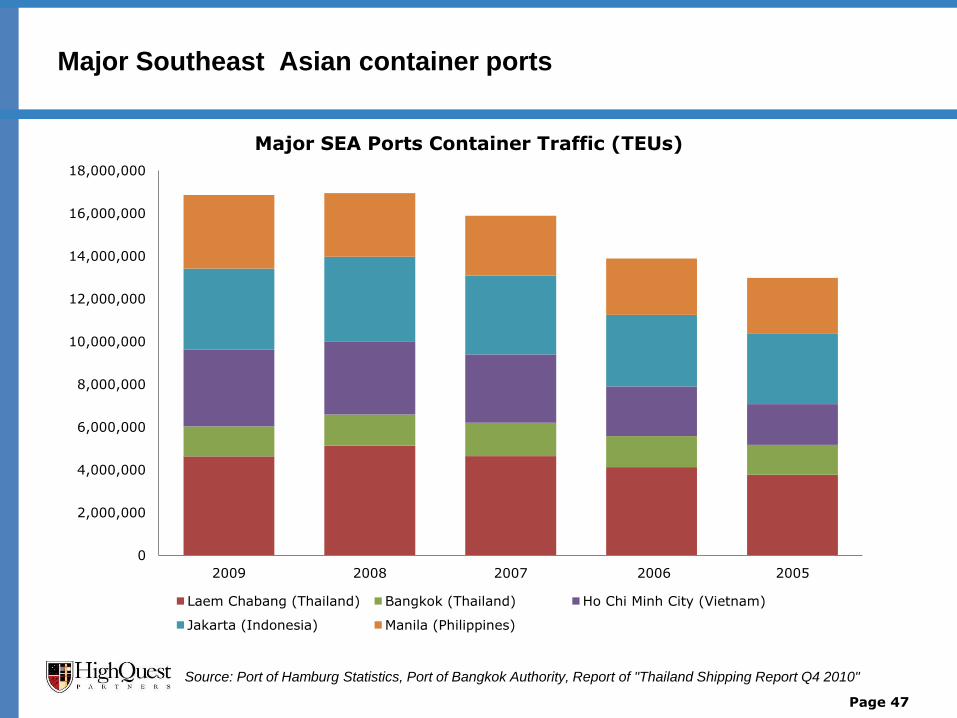
Major Southeast Asian container ports
Source: Port of Hamburg Statistics, Port of Bangkok Authority, Report of "Thailand Shipping Report Q4 2010"
Page 47
0
2,000,000
4,000,000
6,000,000
8,000,000
10,000,000
12,000,000
14,000,000
16,000,000
18,000,000
2009 2008 2007 2006 2005
Major SEA Ports Container Traffic (TEUs)
Laem Chabang (Thailand) Bangkok (Thailand) Ho Chi Minh City (Vietnam)
Jakarta (Indonesia) Manila (Philippines)
Container vs. Bulk Shipping- Strengths and Weaknesses
• Historically, the vast majority of grains exported out of the U.S. have been transported via ocean-
going bulk vessels due to:
– sheer volumes that can be moved in bulk vs. containers
– unit/ton cost advantages of loading grain in bulk;
– interior transportation flows of U.S. grain movements;
– ability of U.S. grain elevators to load in bulk vs. container;
– ability of U.S. export grain terminals to load bulk vessels more easily than container vessels
and
– lack of major intermodal hubs located near major U.S. grain production centers.
• However, in 2006, the economics of loading U.S. grains in containers changed substantially as
significant volumes of containers entered the U.S. Midwest and returned to Asia without a backhaul,
substantially reducing container shipper margins.
– This development led to an increase in containerized grain backhaul volumes to Asia and
forced many grain companies to reconsider how they were shipping grains back to Asia.
– As the container shipping companies began offering discounts to exporters for shipping their
grains to Asia, the cost of shipping containerized grain declined significantly and made it more
affordable for buyers in Asia to consider containerized shipments over bulk.
– Containers enabled U.S. local elevators and regional grain companies to enter the export
market directly without the capital expense of building an export elevator and cut out the
middlemen, thus increasing these companies margins.
Page 48
Strengths and weaknesses of shipping soybeans via container vs. bulk
Page 49
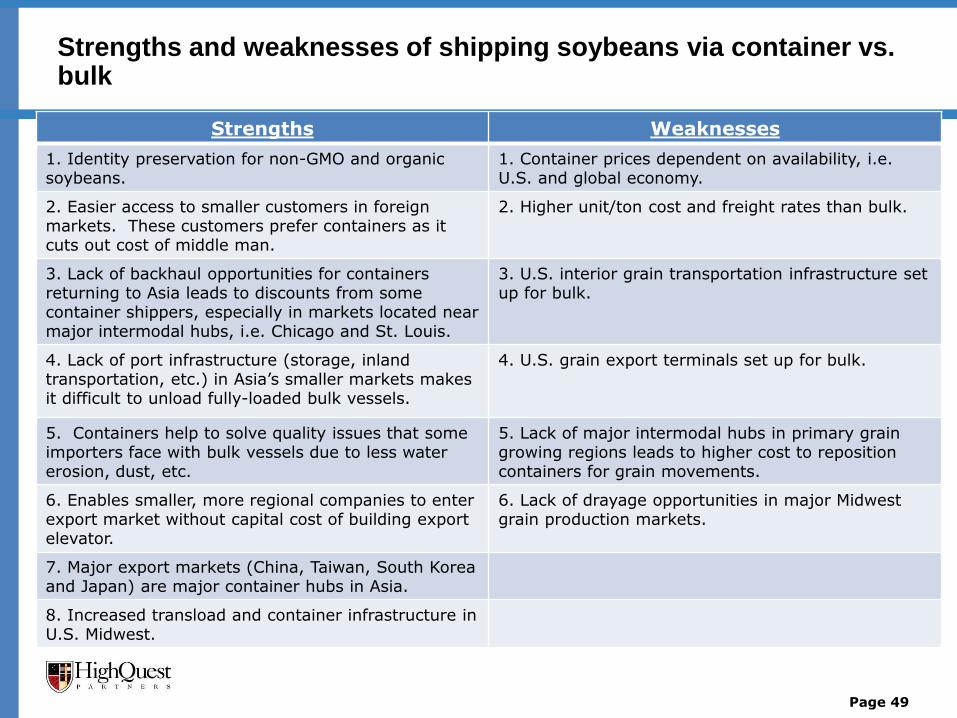
Strengths Weaknesses
1. Identity preservation for non-GMO and organic soybeans.
1. Container prices dependent on availability, i.e. U.S. and global economy.
2. Easier access to smaller customers in foreign markets. These customers prefer containers as it cuts out cost of middle man.
2. Higher unit/ton cost and freight rates than bulk.
3. Lack of backhaul opportunities for containers returning to Asia leads to discounts from some container shippers, especially in markets located near major intermodal hubs, i.e. Chicago and St. Louis.
3. U.S. interior grain transportation infrastructure set up for bulk.
4. Lack of port infrastructure (storage, inland transportation, etc.) in Asia’s smaller markets makes it difficult to unload fully-loaded bulk vessels.
4. U.S. grain export terminals set up for bulk.
5. Containers help to solve quality issues that some importers face with bulk vessels due to less water erosion, dust, etc.
5. Lack of major intermodal hubs in primary grain growing regions leads to higher cost to reposition containers for grain movements.
6. Enables smaller, more regional companies to enter export market without capital cost of building export elevator.
6. Lack of drayage opportunities in major Midwest grain production markets.
7. Major export markets (China, Taiwan, South Korea and Japan) are major container hubs in Asia.
8. Increased transload and container infrastructure in U.S. Midwest.
Table of contents
1. Executive Summary
2. Overview of U.S. and Illinois soybeans and soybean trade flows
3. Major players in the U.S. and Illinois container shipping industry
4. Landed price analysis of soybeans and soybean meal moving from
Illinois to major destination markets
4. Recommendations for increasing container movements of Illinois
soybeans and soybean meal
Page 50
Major players in the U.S. and Illinois container shipping industry
• Container shipping companies and the major rail lines dominate the U.S. containerized
shipping industry.
• The majority of containers enter the U.S. at major port facilities on the East, Gulf and
West coasts and are then moved on to rail cars for shipments to inter-modal yards in
the U.S. Midwest. The containers are then returned to the port via rail empty or with
agricultural goods from the Midwest.
• The top 20 container shipping companies (seen slide 47) accounted for approximately
87% of global TEUs moved in 2010 and 68% of the total container fleet moved in
2010.
• The major rail lines accounted for the vast majority of containers shipped internally in
the U.S.
• All of these companies have major operations in Illinois as Chicago and St. Louis are
two of the major container destination markets in the U.S.
Page 51
Containerized grain flows in Illinois
• Illinois has a decided advantage over the other major production states on
containerized exports of soybeans due to its proximity to the major inter-modal yards in
Chicago and St. Louis.
• Chicago represents the largest container market in the Midwest due to its high demand
for inter-modal goods. Container availability is generally higher here than in other
Midwest states.
– The high container availability in Chicago allows grain shippers in Illinois greater access to
containers and provides these exporters cheaper freight rates to the ports than other
Midwestern states.
– St. Louis is another major inter-modal hub in close proximity to growers and processors
located in southern Illinois.
• Soybean growers and processors in Illinois can deliver their soybeans and soybean
meal by truck to trans-loaders located near the inter-modal hubs, load their products
into containers and then rail the containers to the East, West and Gulf Coast ports for
export to Asia at a lower cost than their competitors as containers do not need to be
repositioned and growers and processors do not have to travel the same distance as
growers and processors in neighboring soybean producing states.
Page 52
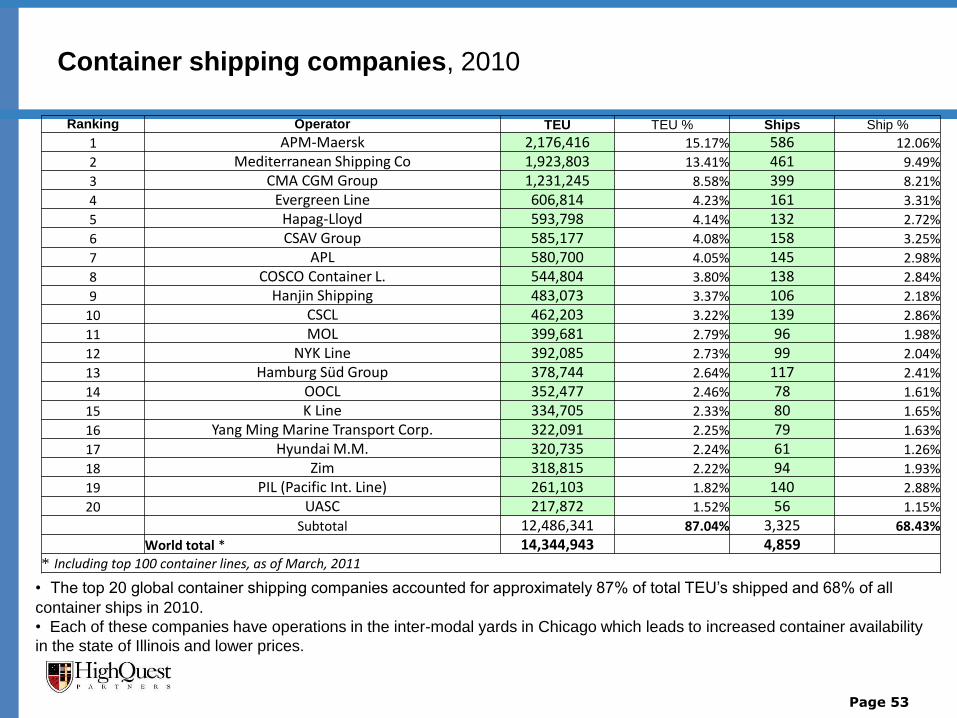
Container shipping companies, 2010
Page 53
Ranking Operator TEU TEU % Ships Ship %
1 APM-Maersk 2,176,416 15.17% 586 12.06%
2 Mediterranean Shipping Co 1,923,803 13.41% 461 9.49%
3 CMA CGM Group 1,231,245 8.58% 399 8.21%
4 Evergreen Line 606,814 4.23% 161 3.31%
5 Hapag-Lloyd 593,798 4.14% 132 2.72%
6 CSAV Group 585,177 4.08% 158 3.25%
7 APL 580,700 4.05% 145 2.98%
8 COSCO Container L. 544,804 3.80% 138 2.84%
9 Hanjin Shipping 483,073 3.37% 106 2.18%
10 CSCL 462,203 3.22% 139 2.86%
11 MOL 399,681 2.79% 96 1.98%
12 NYK Line 392,085 2.73% 99 2.04%
13 Hamburg Süd Group 378,744 2.64% 117 2.41%
14 OOCL 352,477 2.46% 78 1.61%
15 K Line 334,705 2.33% 80 1.65%
16 Yang Ming Marine Transport Corp. 322,091 2.25% 79 1.63%
17 Hyundai M.M. 320,735 2.24% 61 1.26%
18 Zim 318,815 2.22% 94 1.93%
19 PIL (Pacific Int. Line) 261,103 1.82% 140 2.88%
20 UASC 217,872 1.52% 56 1.15%
Subtotal 12,486,341 87.04% 3,325 68.43%
World total * 14,344,943 4,859
* Including top 100 container lines, as of March, 2011
• The top 20 global container shipping companies accounted for approximately 87% of total TEU’s shipped and 68% of all
container ships in 2010.
• Each of these companies have operations in the inter-modal yards in Chicago which leads to increased container availability
in the state of Illinois and lower prices.
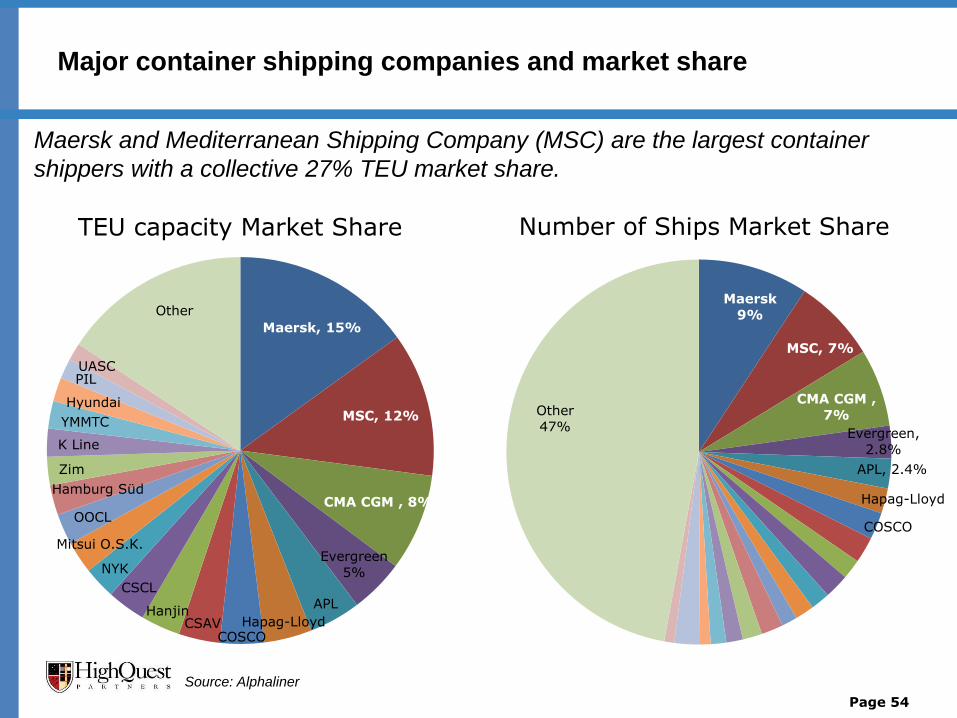
Major container shipping companies and market share
Page 54
Maersk, 15%
MSC, 12%
CMA CGM , 8%
Evergreen
5%
APL
Hapag-Lloyd COSCO
CSAV Hanjin
CSCL
NYK
Mitsui O.S.K.
OOCL
Hamburg Süd
Zim
K Line
YMMTC
Hyundai
PIL UASC
Other
TEU capacity Market Share
Maersk
9%
MSC, 7%
CMA CGM ,
7%
Evergreen,
2.8%
APL, 2.4%
Hapag-Lloyd
COSCO
Other
47%
Number of Ships Market Share
Maersk and Mediterranean Shipping Company (MSC) are the largest container
shippers with a collective 27% TEU market share.
Source: Alphaliner
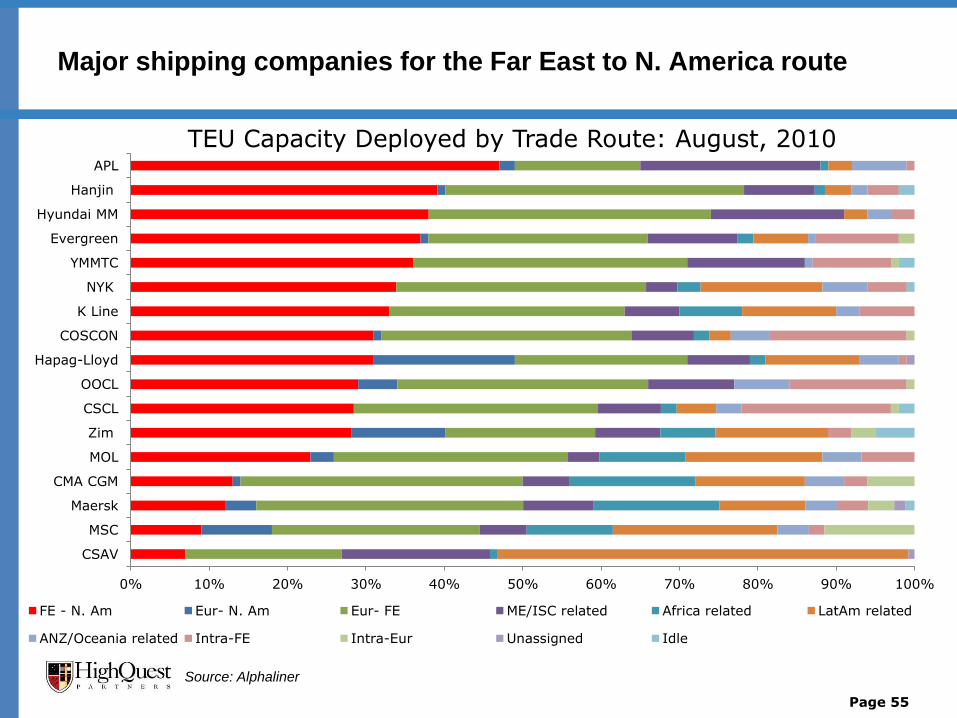
Major shipping companies for the Far East to N. America route
Page 55
0% 10% 20% 30% 40% 50% 60% 70% 80% 90% 100%
CSAV
MSC
Maersk
CMA CGM
MOL
Zim
CSCL
OOCL
Hapag-Lloyd
COSCON
K Line
NYK
YMMTC
Evergreen
Hyundai MM
Hanjin
APL
TEU Capacity Deployed by Trade Route: August, 2010
FE - N. Am Eur- N. Am Eur- FE ME/ISC related Africa related LatAm related
ANZ/Oceania related Intra-FE Intra-Eur Unassigned Idle
Source: Alphaliner
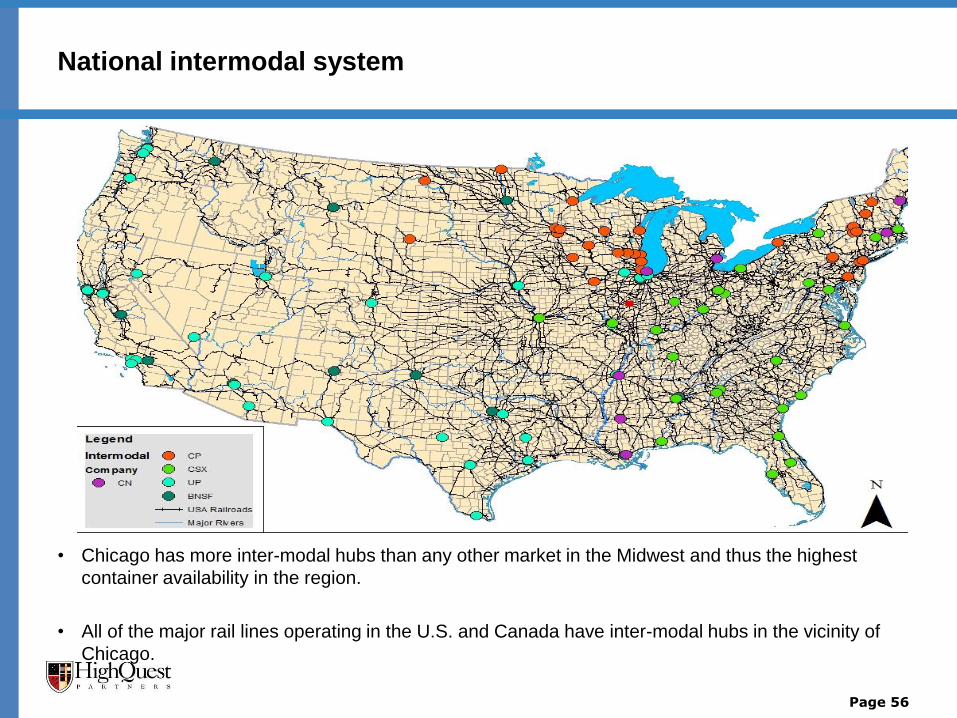
National intermodal system
• Chicago has more inter-modal hubs than any other market in the Midwest and thus the highest
container availability in the region.
• All of the major rail lines operating in the U.S. and Canada have inter-modal hubs in the vicinity of
Chicago.
Page 56
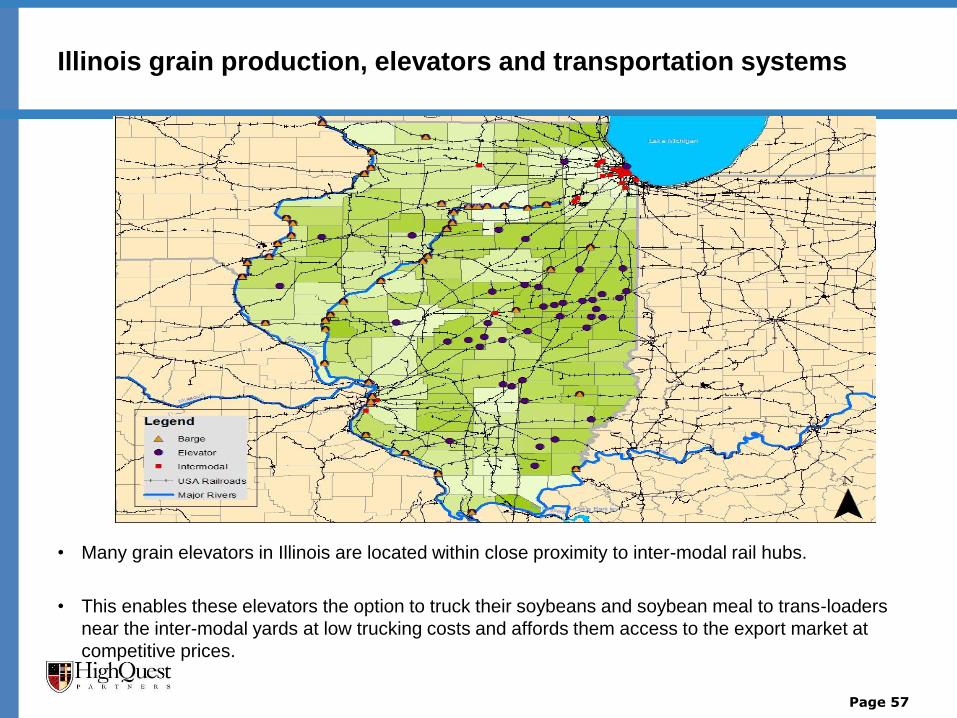
Illinois grain production, elevators and transportation systems
• Many grain elevators in Illinois are located within close proximity to inter-modal rail hubs.
• This enables these elevators the option to truck their soybeans and soybean meal to trans-loaders
near the inter-modal yards at low trucking costs and affords them access to the export market at
competitive prices.
Page 57
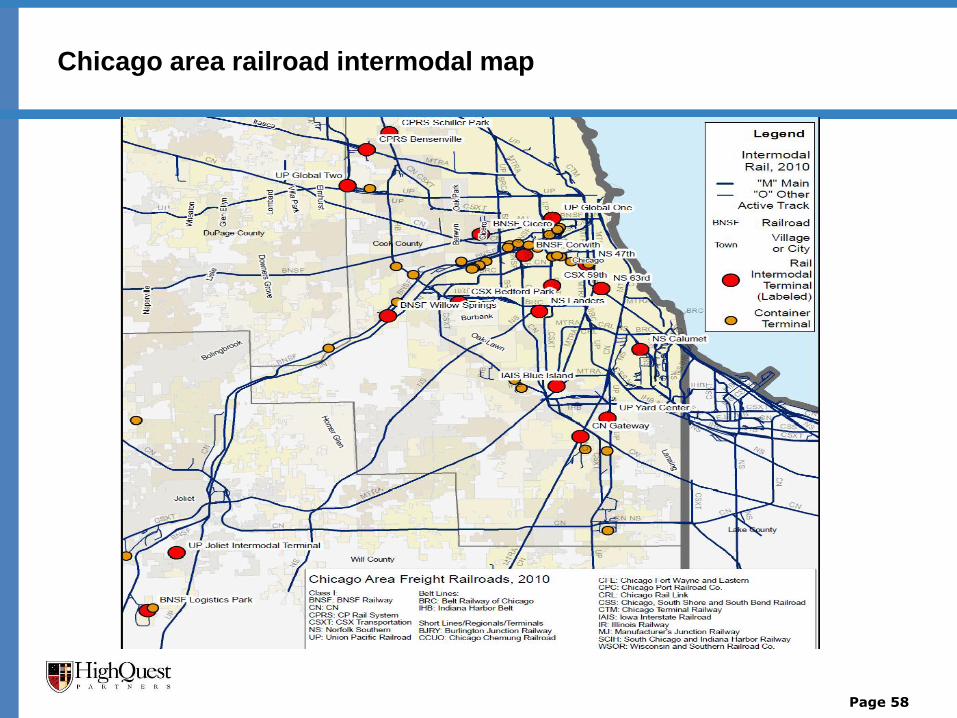
Chicago area railroad intermodal map
Page 58
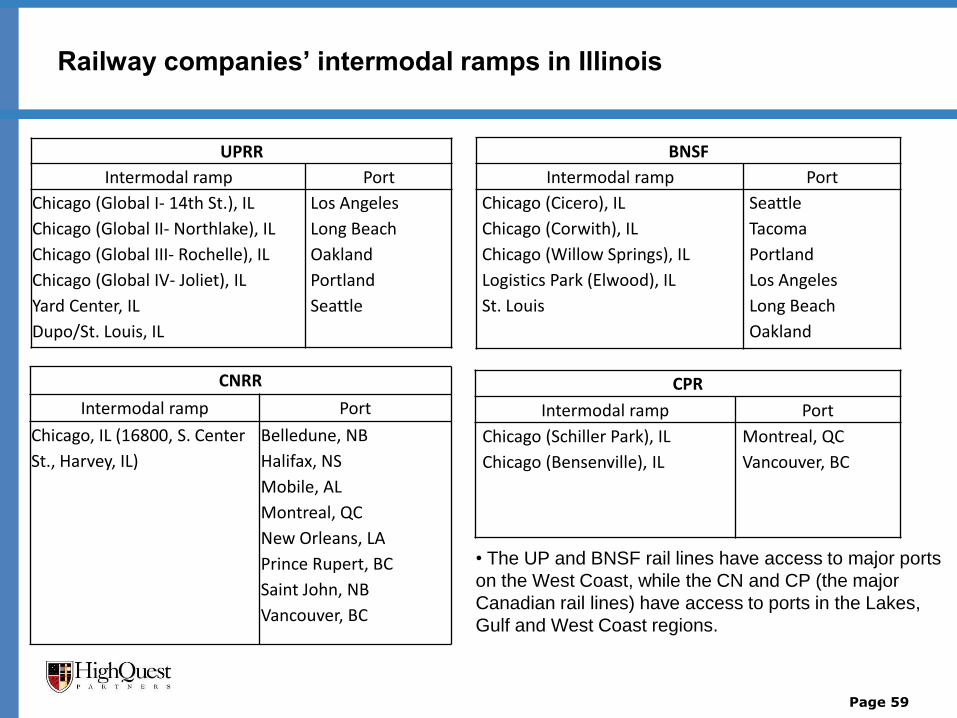
Railway companies’ intermodal ramps in Illinois
UPRR
Intermodal ramp Port
Chicago (Global I- 14th St.), IL
Chicago (Global II- Northlake), IL
Chicago (Global III- Rochelle), IL
Chicago (Global IV- Joliet), IL
Yard Center, IL
Dupo/St. Louis, IL
Los Angeles
Long Beach
Oakland
Portland
Seattle
Page 59
BNSF
Intermodal ramp Port
Chicago (Cicero), IL
Chicago (Corwith), IL
Chicago (Willow Springs), IL
Logistics Park (Elwood), IL
St. Louis
Seattle
Tacoma
Portland
Los Angeles
Long Beach
Oakland
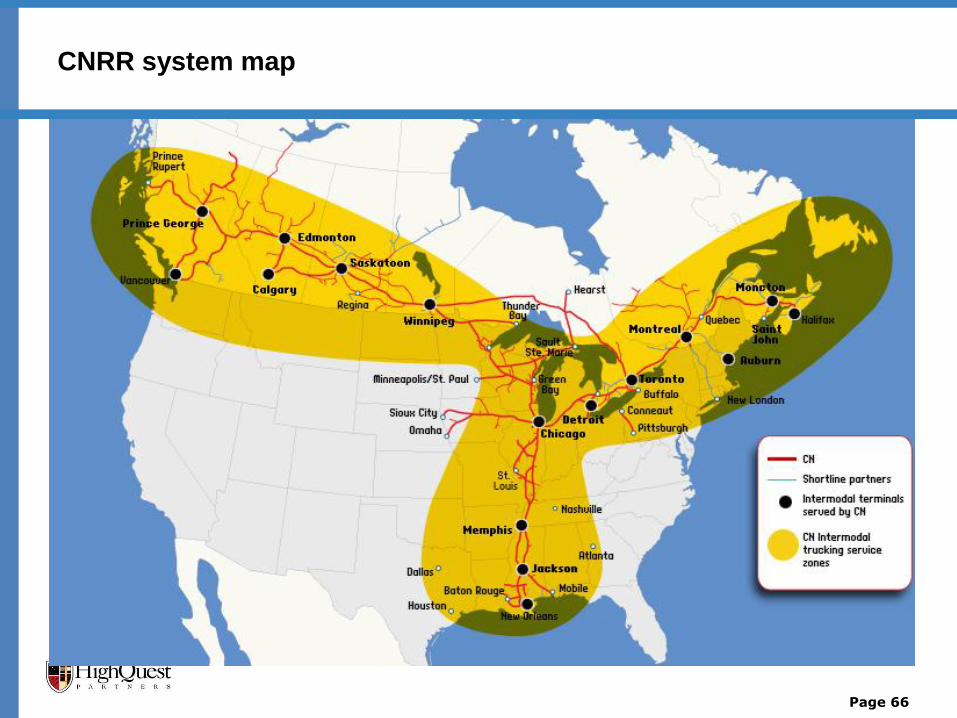
CNRR
Intermodal ramp Port
Chicago, IL (16800, S. Center
St., Harvey, IL)
Belledune, NB
Halifax, NS
Mobile, AL
Montreal, QC
New Orleans, LA
Prince Rupert, BC
Saint John, NB
Vancouver, BC
CPR
Intermodal ramp Port
Chicago (Schiller Park), IL
Chicago (Bensenville), IL
Montreal, QC
Vancouver, BC
• The UP and BNSF rail lines have access to major ports
on the West Coast, while the CN and CP (the major
Canadian rail lines) have access to ports in the Lakes,
Gulf and West Coast regions.
Page 60
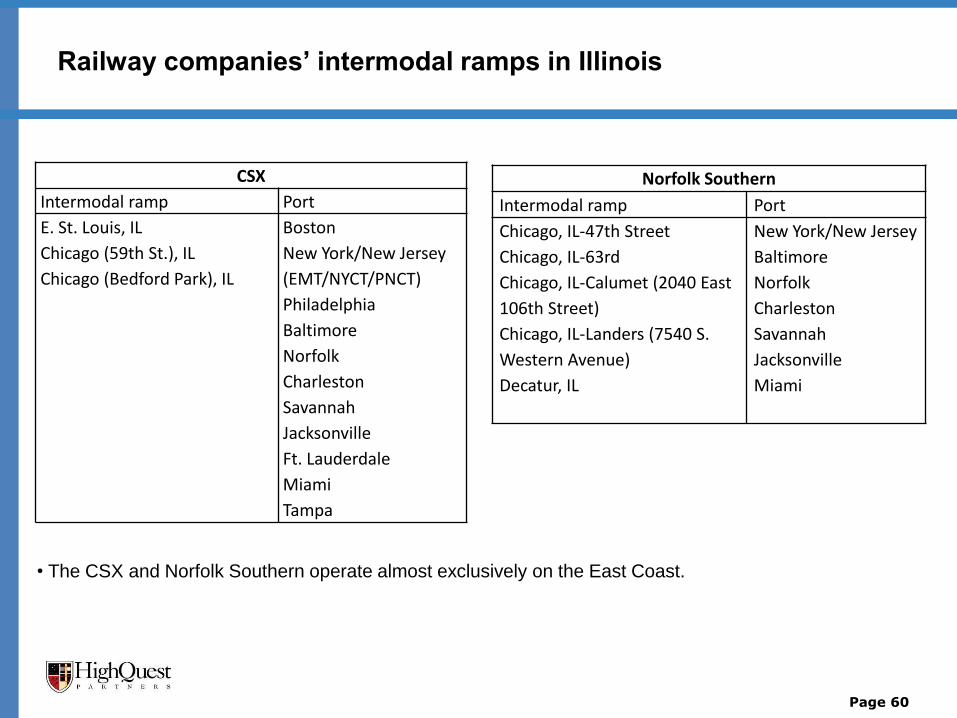
Railway companies’ intermodal ramps in Illinois
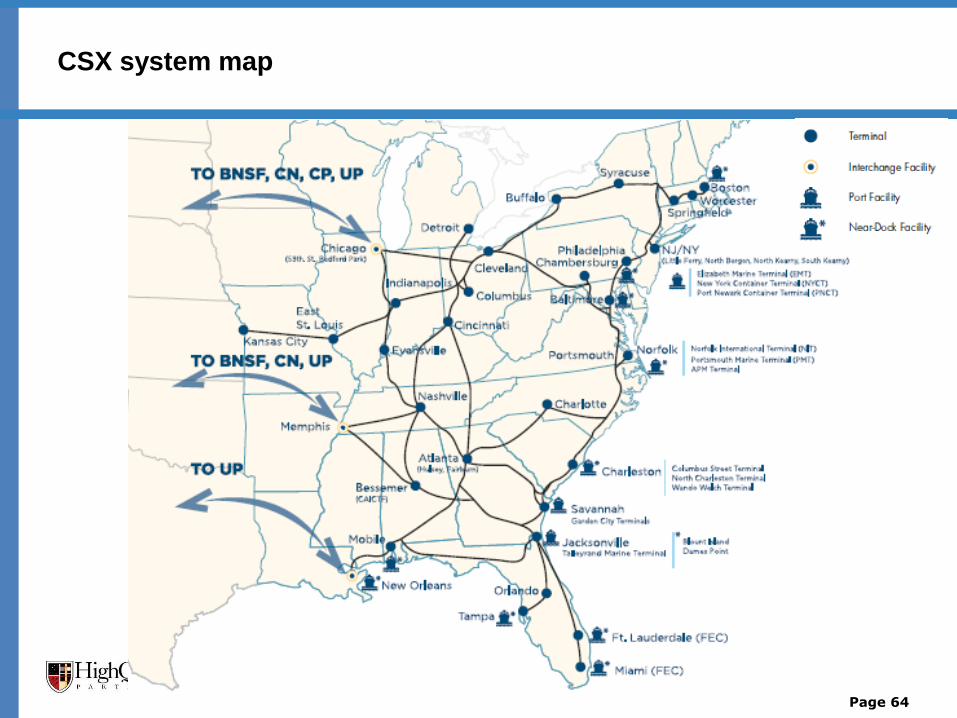
CSX
Intermodal ramp Port
E. St. Louis, IL
Chicago (59th St.), IL
Chicago (Bedford Park), IL
Boston
New York/New Jersey
(EMT/NYCT/PNCT)
Philadelphia
Baltimore
Norfolk
Charleston
Savannah
Jacksonville
Ft. Lauderdale
Miami
Tampa
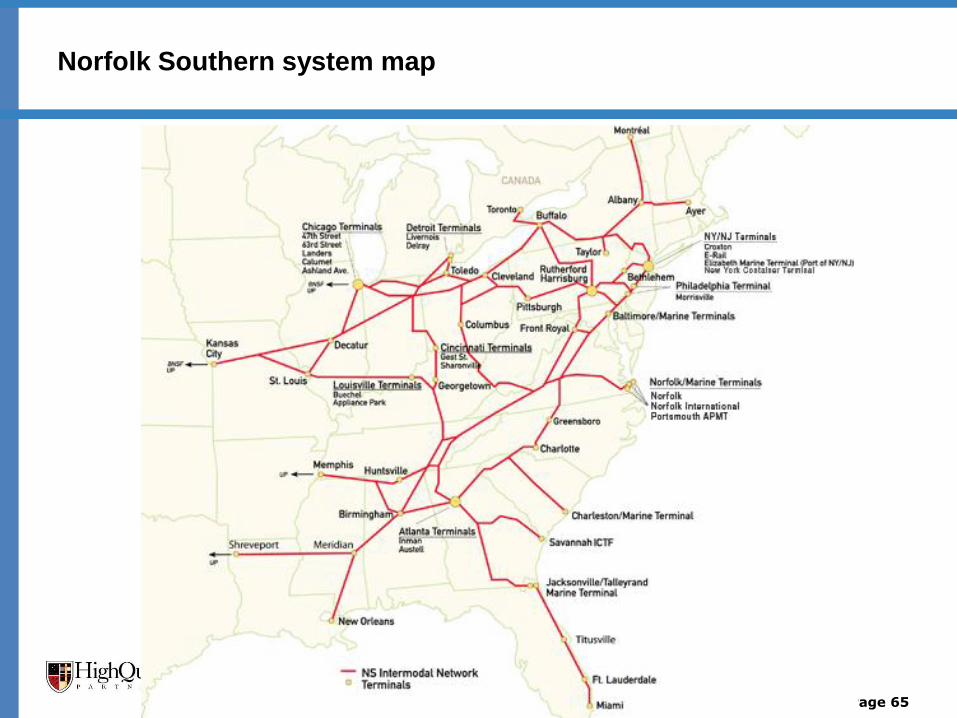
Norfolk Southern
Intermodal ramp Port
Chicago, IL-47th Street
Chicago, IL-63rd
Chicago, IL-Calumet (2040 East
106th Street)
Chicago, IL-Landers (7540 S.
Western Avenue)
Decatur, IL
New York/New Jersey
Baltimore
Norfolk
Charleston
Savannah
Jacksonville
Miami
• The CSX and Norfolk Southern operate almost exclusively on the East Coast.
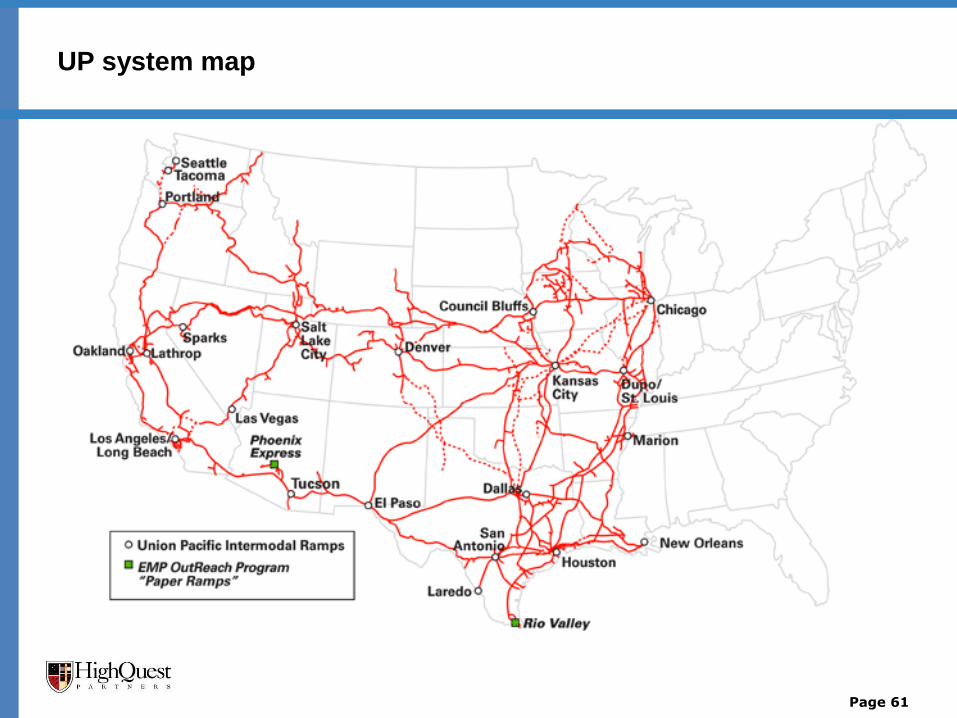
UP system map
Page 61
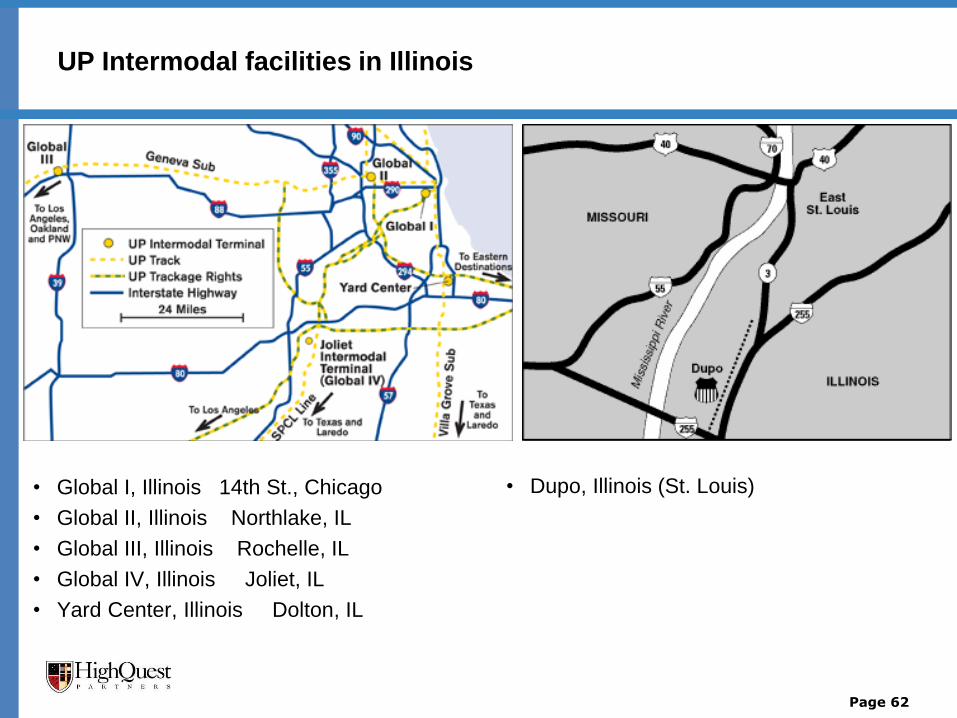
UP Intermodal facilities in Illinois
• Global I, Illinois 14th St., Chicago
• Global II, Illinois Northlake, IL
• Global III, Illinois Rochelle, IL
• Global IV, Illinois Joliet, IL
• Yard Center, Illinois Dolton, IL
Page 62
• Dupo, Illinois (St. Louis)
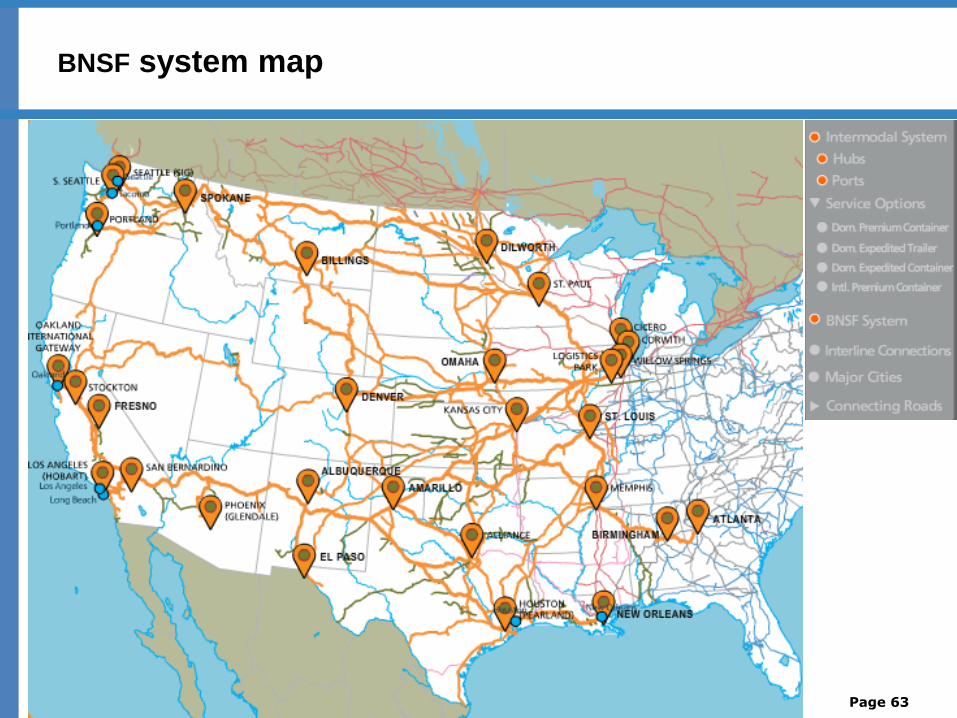
BNSF system map
Page 63
CSX system map
Page 64
Norfolk Southern system map
Page 65
CNRR system map
Page 66
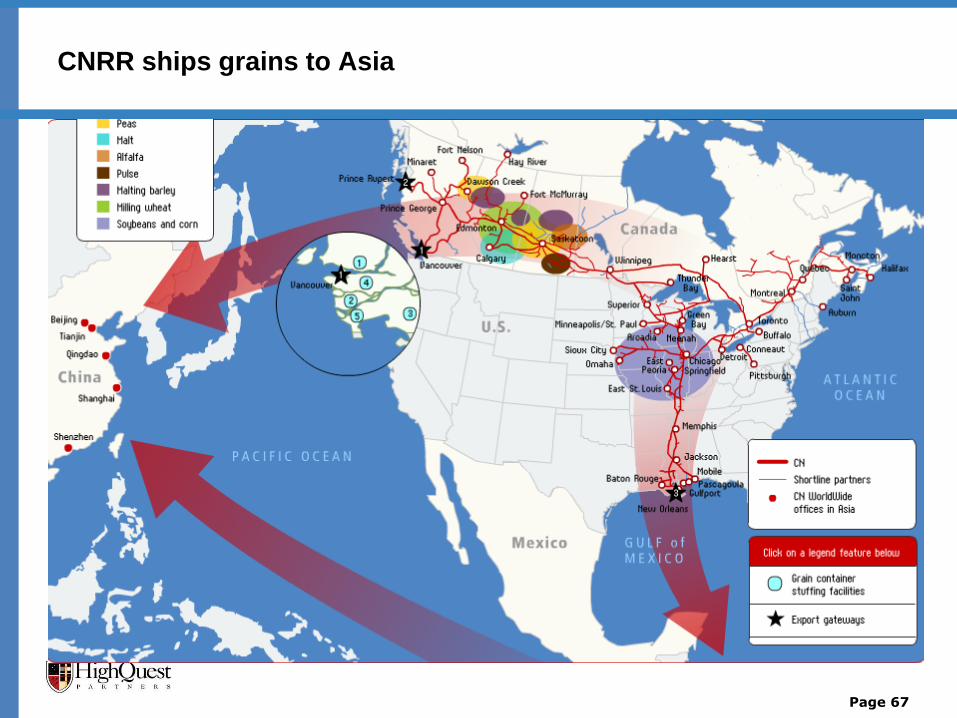
CNRR ships grains to Asia
Page 67
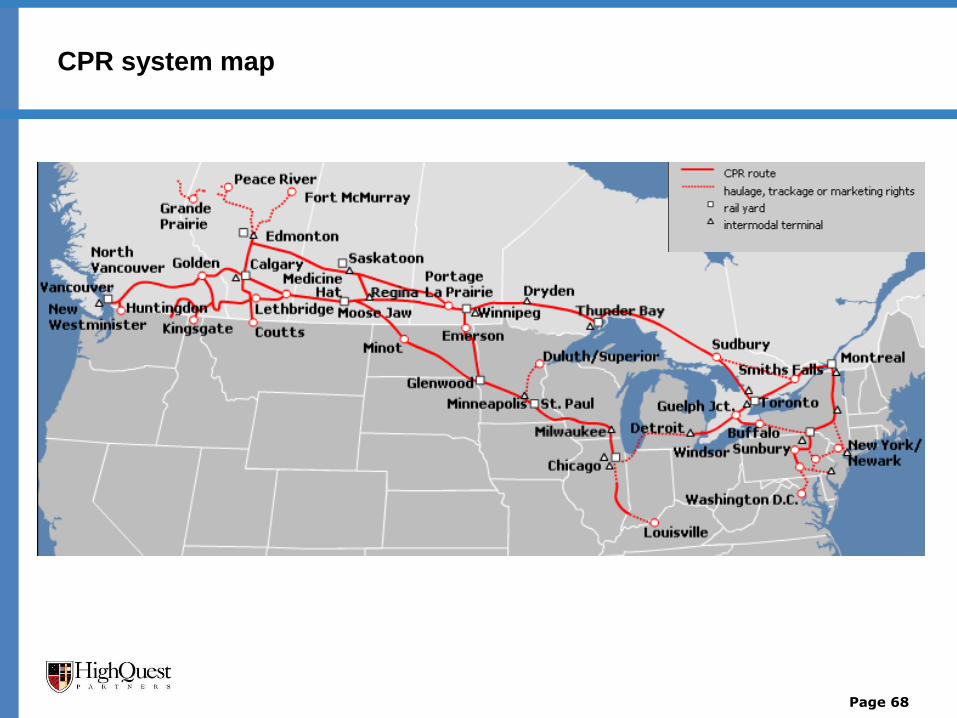
CPR system map
Page 68
Table of contents
1. Executive Summary
2. Overview of U.S. and Illinois soybeans and soybean trade flows
3. Major players in the U.S. and Illinois container shipping industry
4. Landed price analysis of soybeans and soybean meal moving from
Illinois to major destination markets
4. Recommendations for increasing container movements of Illinois
soybeans and soybean meal
Page 69
Landed prices of containerized and bulk soybean shipments to Asia
Page 70
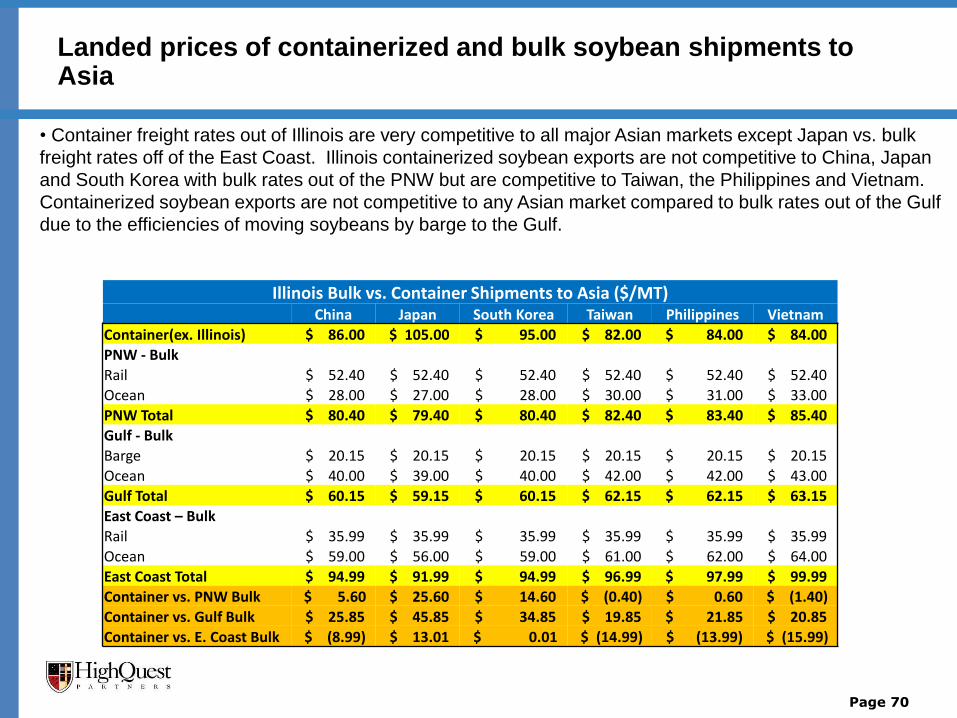
Illinois Bulk vs. Container Shipments to Asia ($/MT) China Japan South Korea Taiwan Philippines Vietnam
Container(ex. Illinois) $ 86.00 $ 105.00 $ 95.00 $ 82.00 $ 84.00 $ 84.00
PNW - Bulk
Rail $ 52.40 $ 52.40 $ 52.40 $ 52.40 $ 52.40 $ 52.40
Ocean $ 28.00 $ 27.00 $ 28.00 $ 30.00 $ 31.00 $ 33.00
PNW Total $ 80.40 $ 79.40 $ 80.40 $ 82.40 $ 83.40 $ 85.40
Gulf - Bulk
Barge $ 20.15 $ 20.15 $ 20.15 $ 20.15 $ 20.15 $ 20.15
Ocean $ 40.00 $ 39.00 $ 40.00 $ 42.00 $ 42.00 $ 43.00
Gulf Total $ 60.15 $ 59.15 $ 60.15 $ 62.15 $ 62.15 $ 63.15
East Coast – Bulk
Rail $ 35.99 $ 35.99 $ 35.99 $ 35.99 $ 35.99 $ 35.99
Ocean $ 59.00 $ 56.00 $ 59.00 $ 61.00 $ 62.00 $ 64.00
East Coast Total $ 94.99 $ 91.99 $ 94.99 $ 96.99 $ 97.99 $ 99.99
Container vs. PNW Bulk $ 5.60 $ 25.60 $ 14.60 $ (0.40) $ 0.60 $ (1.40)
Container vs. Gulf Bulk $ 25.85 $ 45.85 $ 34.85 $ 19.85 $ 21.85 $ 20.85
Container vs. E. Coast Bulk $ (8.99) $ 13.01 $ 0.01 $ (14.99) $ (13.99) $ (15.99)
• Container freight rates out of Illinois are very competitive to all major Asian markets except Japan vs. bulk
freight rates off of the East Coast. Illinois containerized soybean exports are not competitive to China, Japan
and South Korea with bulk rates out of the PNW but are competitive to Taiwan, the Philippines and Vietnam.
Containerized soybean exports are not competitive to any Asian market compared to bulk rates out of the Gulf
due to the efficiencies of moving soybeans by barge to the Gulf.
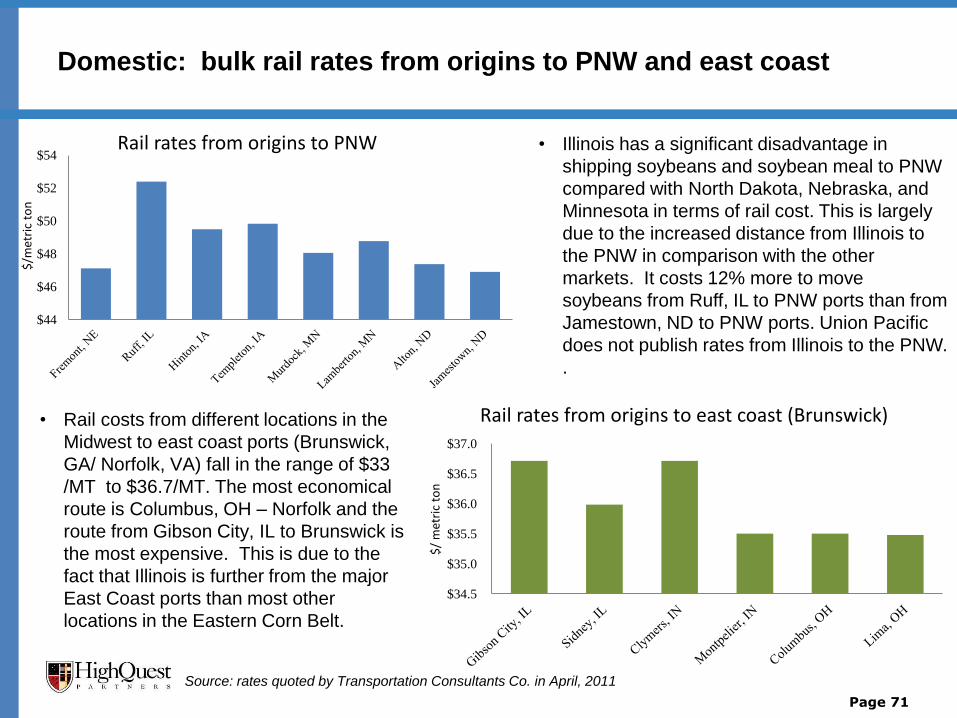
Domestic: bulk rail rates from origins to PNW and east coast
• Rail costs from different locations in the
Midwest to east coast ports (Brunswick,
GA/ Norfolk, VA) fall in the range of $33
/MT to $36.7/MT. The most economical
route is Columbus, OH – Norfolk and the
route from Gibson City, IL to Brunswick is
the most expensive. This is due to the
fact that Illinois is further from the major
East Coast ports than most other
locations in the Eastern Corn Belt.
Page 71
$34.5
$35.0
$35.5
$36.0
$36.5
$37.0$
/ m
etri
c to
n
Rail rates from origins to east coast (Brunswick)
Source: rates quoted by Transportation Consultants Co. in April, 2011
• Illinois has a significant disadvantage in
shipping soybeans and soybean meal to PNW
compared with North Dakota, Nebraska, and
Minnesota in terms of rail cost. This is largely
due to the increased distance from Illinois to
the PNW in comparison with the other
markets. It costs 12% more to move
soybeans from Ruff, IL to PNW ports than from
Jamestown, ND to PNW ports. Union Pacific
does not publish rates from Illinois to the PNW.
.
$44
$46
$48
$50
$52
$54
$/m
etri
c to
n
Rail rates from origins to PNW
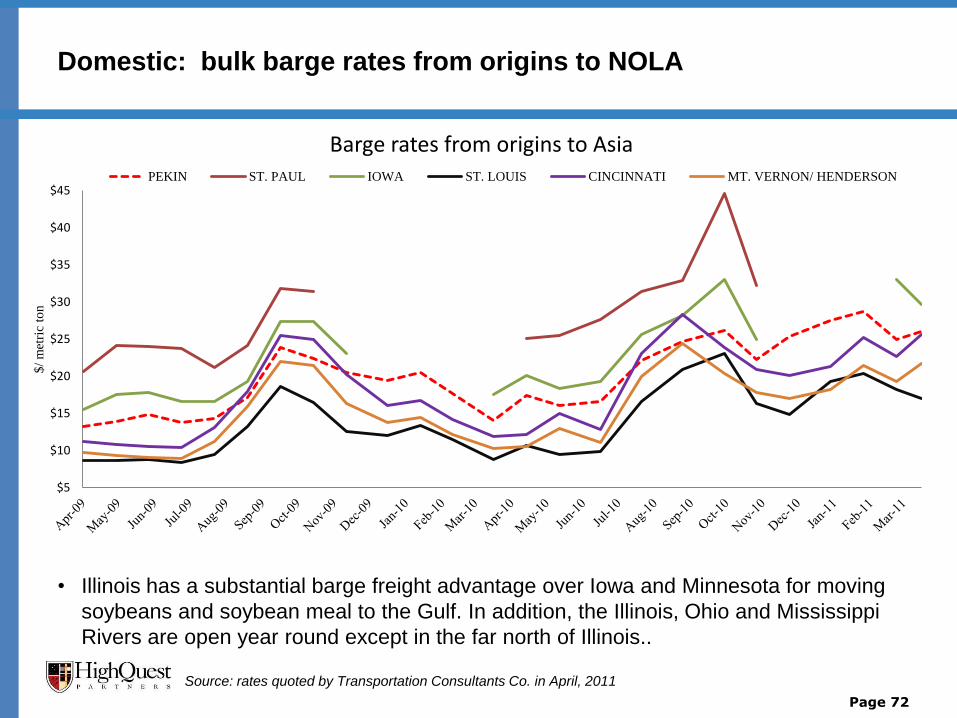
• Illinois has a substantial barge freight advantage over Iowa and Minnesota for moving
soybeans and soybean meal to the Gulf. In addition, the Illinois, Ohio and Mississippi
Rivers are open year round except in the far north of Illinois..
Page 72
Domestic: bulk barge rates from origins to NOLA
Source: rates quoted by Transportation Consultants Co. in April, 2011
$5
$10
$15
$20
$25
$30
$35
$40
$45
$/
met
ric
ton
Barge rates from origins to Asia PEKIN ST. PAUL IOWA ST. LOUIS CINCINNATI MT. VERNON/ HENDERSON
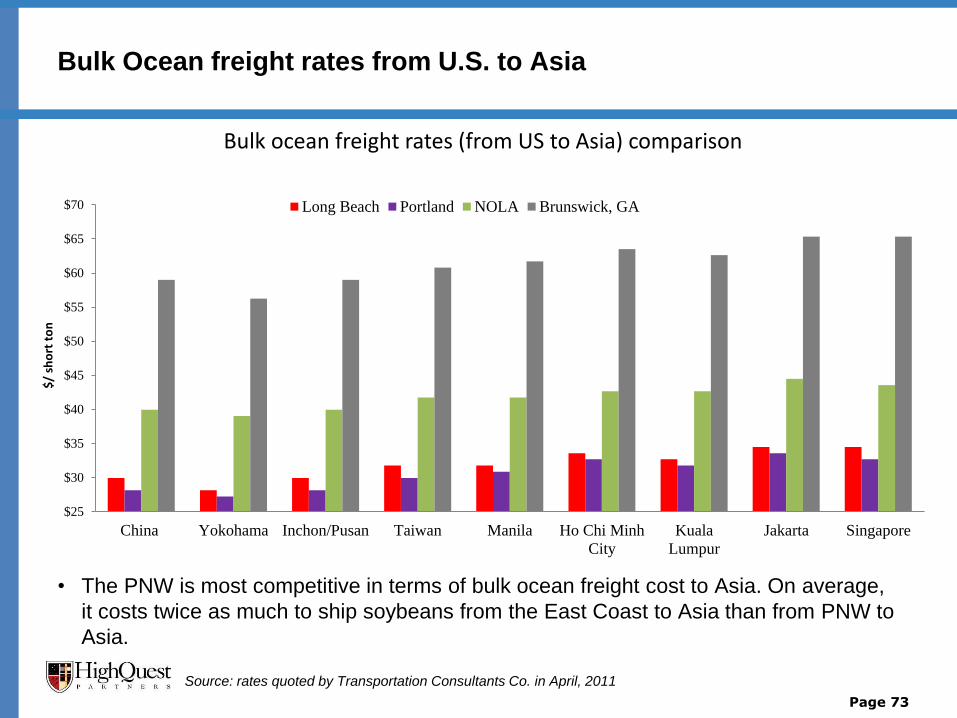
Bulk Ocean freight rates from U.S. to Asia
• The PNW is most competitive in terms of bulk ocean freight cost to Asia. On average,
it costs twice as much to ship soybeans from the East Coast to Asia than from PNW to
Asia.
Page 73
Source: rates quoted by Transportation Consultants Co. in April, 2011
$25
$30
$35
$40
$45
$50
$55
$60
$65
$70
China Yokohama Inchon/Pusan Taiwan Manila Ho Chi Minh
City
Kuala
Lumpur
Jakarta Singapore
$/
sho
rt t
on
Bulk ocean freight rates (from US to Asia) comparison
Long Beach Portland NOLA Brunswick, GA
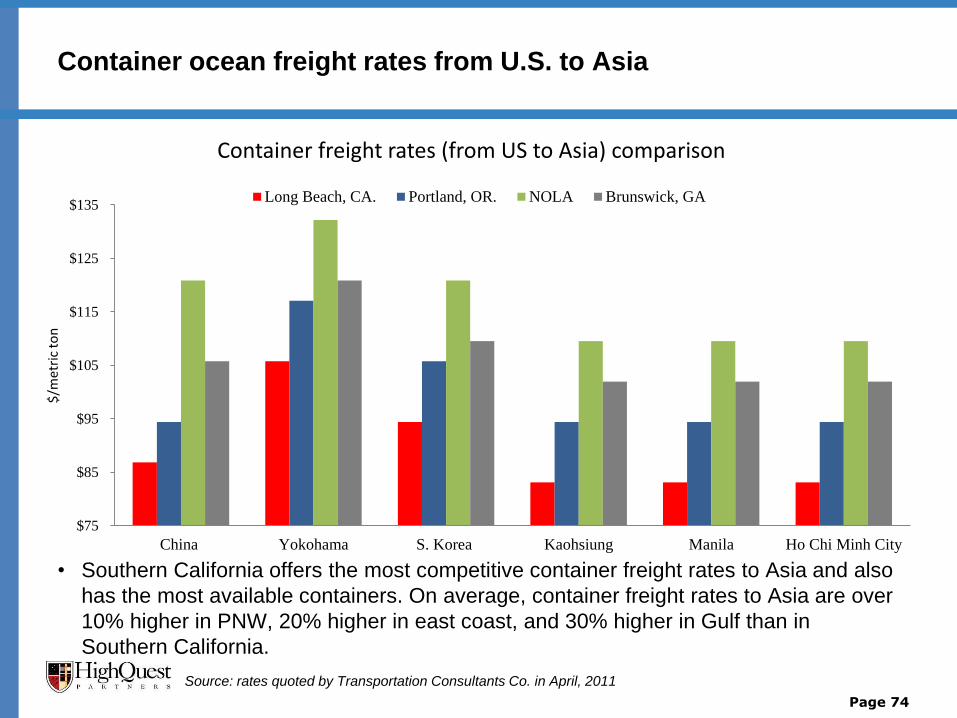
• Southern California offers the most competitive container freight rates to Asia and also
has the most available containers. On average, container freight rates to Asia are over
10% higher in PNW, 20% higher in east coast, and 30% higher in Gulf than in
Southern California.
Page 74
Container ocean freight rates from U.S. to Asia
$75
$85
$95
$105
$115
$125
$135
China Yokohama S. Korea Kaohsiung Manila Ho Chi Minh City
$/m
etri
c to
n
Container freight rates (from US to Asia) comparison
Long Beach, CA. Portland, OR. NOLA Brunswick, GA
Source: rates quoted by Transportation Consultants Co. in April, 2011
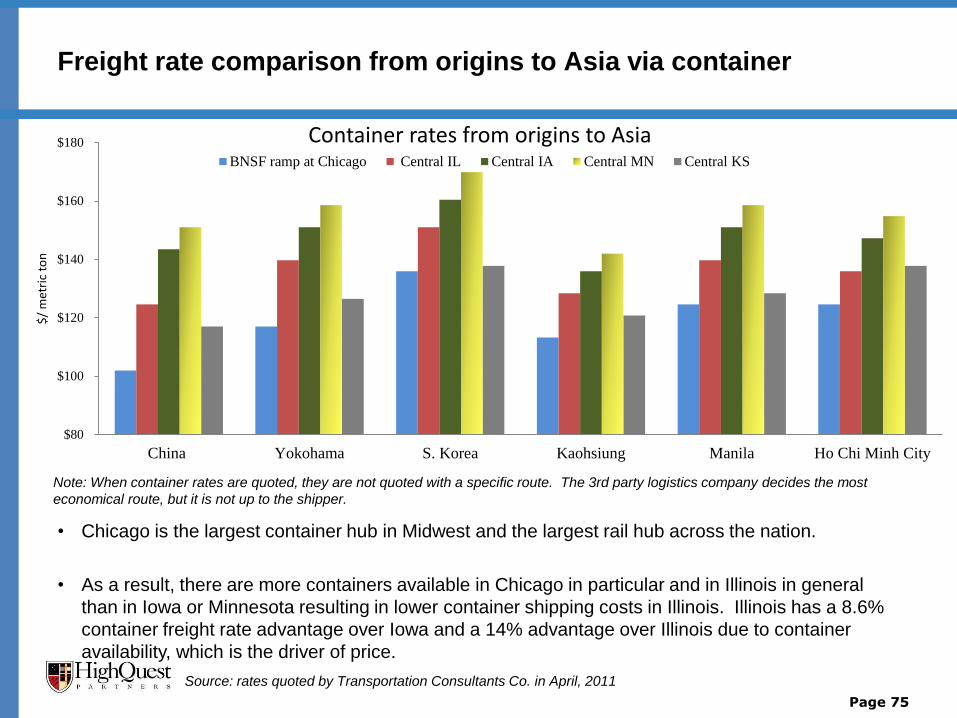
Freight rate comparison from origins to Asia via container
Note: When container rates are quoted, they are not quoted with a specific route. The 3rd party logistics company decides the most
economical route, but it is not up to the shipper.
Page 75
Source: rates quoted by Transportation Consultants Co. in April, 2011
$80
$100
$120
$140
$160
$180
China Yokohama S. Korea Kaohsiung Manila Ho Chi Minh City
$/
met
ric
ton
Container rates from origins to Asia BNSF ramp at Chicago Central IL Central IA Central MN Central KS
• Chicago is the largest container hub in Midwest and the largest rail hub across the nation.
• As a result, there are more containers available in Chicago in particular and in Illinois in general
than in Iowa or Minnesota resulting in lower container shipping costs in Illinois. Illinois has a 8.6%
container freight rate advantage over Iowa and a 14% advantage over Illinois due to container
availability, which is the driver of price.
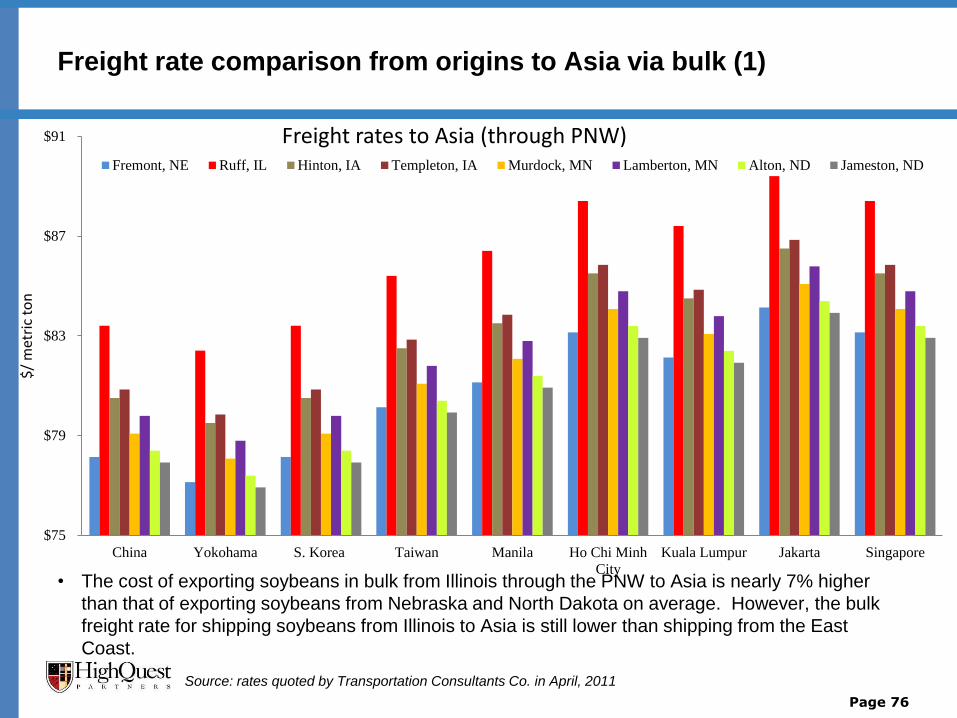
• The cost of exporting soybeans in bulk from Illinois through the PNW to Asia is nearly 7% higher
than that of exporting soybeans from Nebraska and North Dakota on average. However, the bulk
freight rate for shipping soybeans from Illinois to Asia is still lower than shipping from the East
Coast.
Page 76
Freight rate comparison from origins to Asia via bulk (1)
Source: rates quoted by Transportation Consultants Co. in April, 2011
$75
$79
$83
$87
$91
China Yokohama S. Korea Taiwan Manila Ho Chi Minh
City
Kuala Lumpur Jakarta Singapore
$/
met
ric
ton
Freight rates to Asia (through PNW) Fremont, NE Ruff, IL Hinton, IA Templeton, IA Murdock, MN Lamberton, MN Alton, ND Jameston, ND
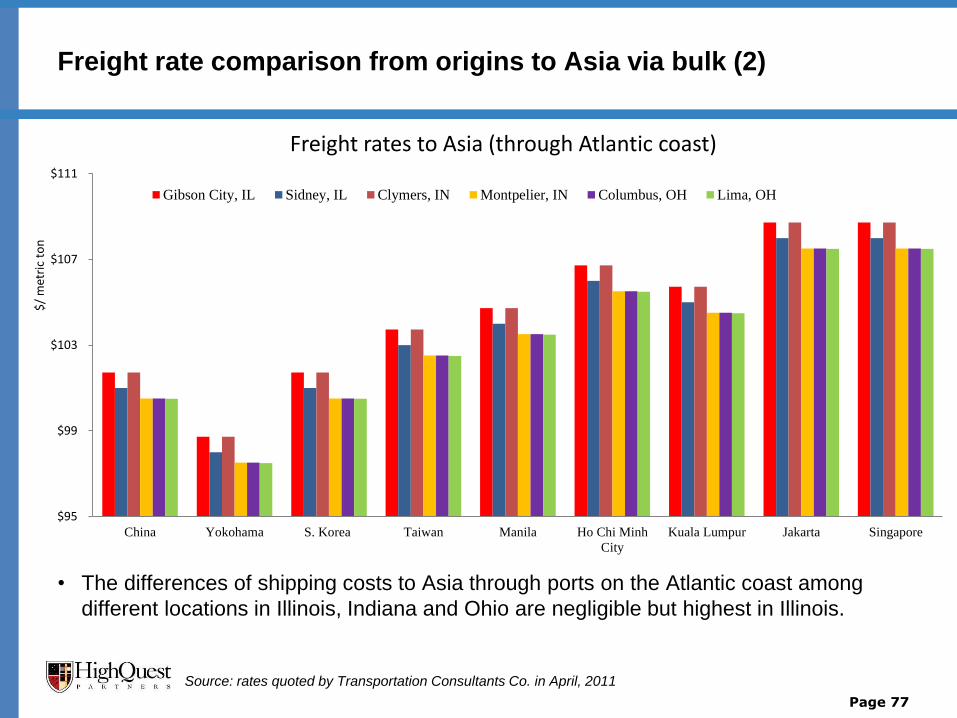
• The differences of shipping costs to Asia through ports on the Atlantic coast among
different locations in Illinois, Indiana and Ohio are negligible but highest in Illinois.
Page 77
Freight rate comparison from origins to Asia via bulk (2)
Source: rates quoted by Transportation Consultants Co. in April, 2011
$95
$99
$103
$107
$111
China Yokohama S. Korea Taiwan Manila Ho Chi Minh
City
Kuala Lumpur Jakarta Singapore
$/
met
ric
ton
Freight rates to Asia (through Atlantic coast)
Gibson City, IL Sidney, IL Clymers, IN Montpelier, IN Columbus, OH Lima, OH
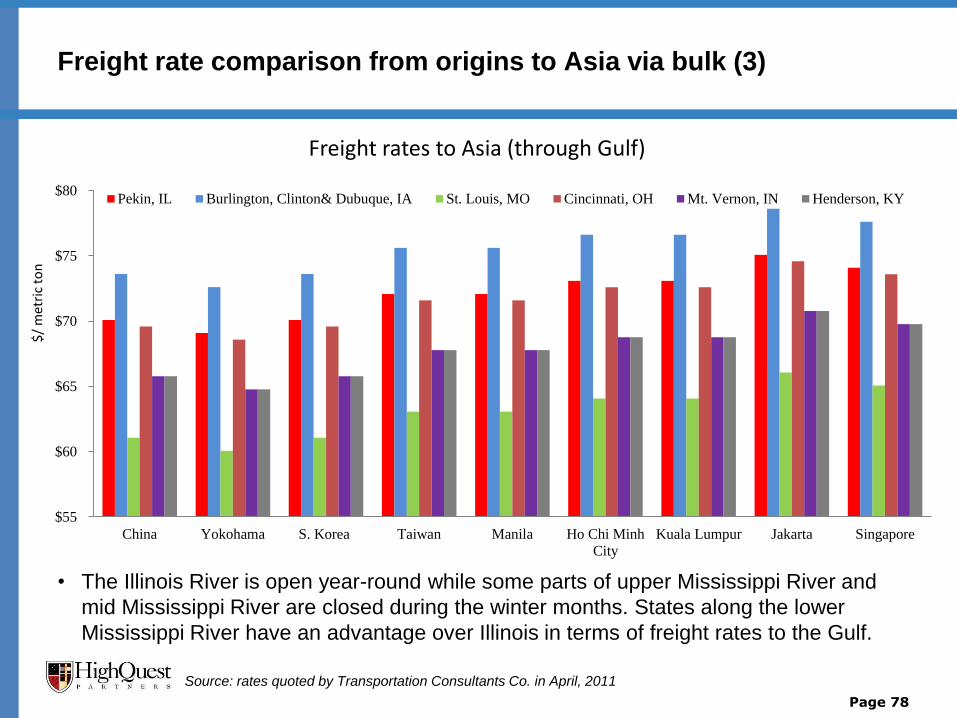
• The Illinois River is open year-round while some parts of upper Mississippi River and
mid Mississippi River are closed during the winter months. States along the lower
Mississippi River have an advantage over Illinois in terms of freight rates to the Gulf.
Page 78
Freight rate comparison from origins to Asia via bulk (3)
$55
$60
$65
$70
$75
$80
China Yokohama S. Korea Taiwan Manila Ho Chi Minh
City
Kuala Lumpur Jakarta Singapore
$/
met
ric
ton
Freight rates to Asia (through Gulf)
Pekin, IL Burlington, Clinton& Dubuque, IA St. Louis, MO Cincinnati, OH Mt. Vernon, IN Henderson, KY
Source: rates quoted by Transportation Consultants Co. in April, 2011
Table of contents
1. Executive Summary
2. Overview of U.S. and Illinois soybeans and soybean trade flows
3. Major players in the U.S. and Illinois container shipping industry
4. Landed price analysis of soybeans and soybean meal moving from
Illinois to major destination markets
4. Recommendations for increasing container movements of Illinois
soybeans and soybean meal
Page 79
Conclusions –grain exporting market outlook
• The significant growth in containers moving from Asian manufacturing plants to U.S.
consumer markets has generated a tremendous opportunity to use backhaul flow of
containers to Asia to ship grains to the region. U.S. containerized soybean exports
have increased about 160% since 2000 to over 91,000 TEUs in 2010, accounting for
4.7% of total soybean exports.
• South East Asia is the region importing the largest volume of containerized soybeans
and soybean meal from the U.S., accounting for 62% of total U.S. grain exports via
container. As new sources for low cost production of manufactured goods continue to
develop in Southeast Asia, demand for filling backhaul containers returning to this
region will increase. This presents a growing opportunity for U.S. soybean exporters.
• The prospects for containerized U.S. soybean and soybean meal exports to Asia are
promising because of:
– increasing grain and protein demand in Asia, particularly in China and Southeast Asia;
– rising imbalance of US- Asia containerized trade (2.6:1) leaving more opportunities for
container backhauls and
– the expansion of the Panama Canal which will bring larger container vessels to the Gulf coast
providing opportunities to barge containers from the Midwest to Gulf ports.
Page 80
Conclusions – container market outlook
• Global containership capacity has increased to nearly 14 million TEUs, representing
approximately a 286% increase in the last decade. Over-capacity in the containership
market is expected to last for at least one more year, which should put downward
pressure on container freight rates.
• The rising demand for containers in Asia due to the explosion in intra-Asian trade has
led to a global shipping container shortage. It is estimated that the industry needs up to
6 million containers (2 years’ worth of production) to restore the imbalance to
conventional levels.
• However, there are a large volume of containers available in the southern California
and south Atlantic port regions due to the imbalance of container traffic between the
U.S. and Asia. Westbound containerized soybean and soybean meal exports
represent good business for ocean carriers because they help to minimize costs to
reposition containers to Asia.
• Union Pacific Railroad Co., is building a transloading facility transferring grains from
covered hopper cars directly to containers in Barstow/Yermo area, just outside of the
L.A. Basin and before the congested rail corridors.
Page 81
Recommendation – new transloading facility
• We recommend that the Illinois Soybean Association consider making an
investment to build a transloading facility in Peoria, IL to drive the future
growth of containerized Illinois soybean and soybean meal exports to Asia.
– Peoria, which is one of hubs of the grain marketing network in Illinois, is
located about 180 miles southwest of Chicago, the largest container hub
in Midwest and the nation’s largest rail hub and is also a major industrial
center.
– Because of competitiveness of bulk shipping, soybeans and soybean
meal must be located adjacent to intermodal facilities to avoid costly
drayage costs. Peoria is located about 78 miles northwest of Decatur
which is a Norfolk Southern inter-modal terminal, about 117 miles
southwest of UP’s intermodal ramp in Joliet and 113 miles southwest of
the BNSF Logistics Park inter-modal ramp.
– Peoria is the largest city on the Illinois River. The expansion of Panama
Canal will create more opportunities to ship containerized soybeans and
soybean meal via barge from the Illinois River to Gulf ports.
Page 82
Recommended