DOCUMENT RESUME
ED 161 681 SE 024 995
AUTHOR Lawrenz, Frances TITLE Student Perception of the Classroom Learning
Environment in Biology, Chemistry, and Physics Courses. Research Paper No. 12.
INSTITUTION Minnesota gniv., Minneapolis. Coll. of Education. SPONS AGENCY National Science Foundation, Washington, D.C. PUB DATE [ 75] GRANT NSF-GW-6800 NOTE 22p.; For related documents, see SE 024 989-999 and
ED 148 632-640
EDRS PRICE MF-$0.83 HC-$1.67 Plus Postage. DESCRIPTORS *Academic Achievement; Biology; Chemistry;
Educational Environment; *Educational Research; *Learning; *Perception; Physics; *Science Education; Secondary Education; Secondary School Science; *Student Science Interests
IDENTIFIERS *Minnesota Research & Evaluation Project; National Science Foundation; Research Reports
ABSTRACT This research study investigated student perception
of the social learning environment in biology, chemistry and physics courses. A stratified random sample of secondary schools fro three regions was sélected. The principal of each sampled school randomly selected a biology, chemistry or physics teacher who, in turn, randomly selected one of his classes to complete two instruments:
-Learning Environment Inventory (LEI); and the Test of Achievement in Science (TAS). The statistical procedures used were multivariate and univariate analyses of variance, and discriminant function analyses. Achievement level (high, middle, low) and science course (biology, chemistry, physics) were the two independent factors. The combined mean score for each science course on ten scales of LEI were the dependent variables. Results showed that there were significant differences tetween the students, perception of their environment in the three science courses. (HM)
Research Paper #12
Student Perception of the Classroom Learning Environment in Biology, Chemistry, and Physics Courses
Frances Lawrenz
This study was supported by grant GW-6800 from the National Science Foundation to the University of Minnesota; Wayne W. Welch, Project Director.
Student Perception of the Classroo•.n Learning Environment In Biology, Chemistry, and Physics Courses
Frances Lawrenz University of Minnesota
Several recent studies have reported a decline in student interest in
science as a result of their participation in science classes (Ahlgren, .
1969; Pella, 1969; Mackay, 1970; Kaphingst, 1971). The loss in interest
appears more pronounced in the physical sciences than in the biological
sciences. This :suggests tha possibility of a difilfference in the manner in
which students perceive their biological and physical science courses.
Possible perceptual differences were noted in an article by Robinson (1969)
in which he proposed that physics and biology are separate entities which
may have different perceptual impacts on children. The need for research
to determine the extent and effect of these differences was pointed out by
Shulman and Tamir in the Second Handbook of Research in Teaching. A study
of these differences could perhaps provide insight into some of the problems
encountered by science educators--namely, counseling, curriculum development,
and student interest.
The purpose of this investigation is to examine student perception of
the social learning environment in biology, chemistry, and physics courses.
If any differences exist among the course perceptions, they will be
examined in light of student loss of interest in science.
Procedure
The data were collected in March 1971 from a random sample of classes'
stratified on levels of'population from three general regions, which
included 12 states', These regions were the experimental and control areas
for three National Science Foundation Comprehensive Projects. The principal
of each sampled school randomly selected a biology, chemistry, or physics
teacher who, in turn, randomly selected one of his classes to complete-two
instruments: Learning Environment Inventory (L'EI) (Anderson, 1973), and
the Test of Achievement in Seiende (TAS) (Lawrenz, 1972). In order to
reduce test administration time, the testing was completed in one class
period,.utilizing the randomized data collection described by Walberg and
Welch (1967). The student instruments were ordered before being mailed
to the teacher to insure a random distribution within each class.
The LEI'has been shown to be a discriminating measure among secondary
school students, both within and between courses (Aftderson, Walberg, and
Welch, 1969; Yamamoto, Thomas, and Karns, 1969; Anderson, 1971). The form
of the LEI used here contained ten scales related to classroom social
situations. A description of each scale' along with its reliability is
given in Table 1. Each item was scored 4-1 for a strongly agree, agree,
disagree, and a strongly disagree response. Some items were reversed
scored to reduce response bias. A high score indicates agreement with
the scale.
The TAS, which contained items pertaining to biology, chemistry, and
physics courses, lias a Kuder-Richardson I#20 reliability of .87. It is a
45-item, six-option, multiple choice test compiled from the items released
for public use from the National Assessment Test for Science. A measure
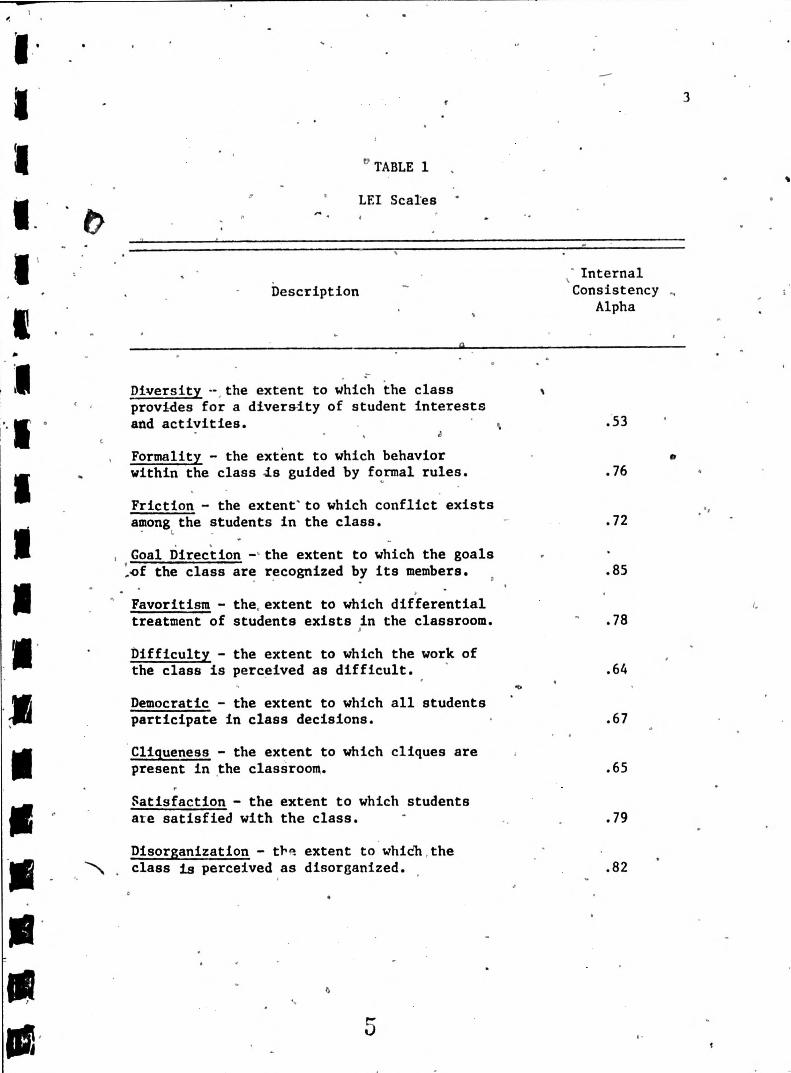
TABLE 1
LEI Scales
Internal Description Consistency
Alpha
Diversity -- the extent to which the class provides for a diversity of student interests and activities. .53
Formality - the extent to which behavior within the class is guided by formal rules. .76
Friction - the extent'to which conflict exists among the students in the class. .72
Goal Direction - the extent to which the goals .of the class are recognized by its members. .85
Favoritism - the,extent to which differential treatment of students exists in the classroom. .78
Difficulty - the extent to which the work of the class is perceived as difficult. .64
Democratic - the extent to which all students participate in class decisions. .67
Cliqueness - the extent to which cliques are present in the classroom. .65
Satisfaction - the extent to which students are satisfied with the class. .79
Disorganization - the extent to which the class is perceived as disorganized. .82
of achievement was included because stratification by achievement helps to
insure group comparability, increases the power to detect differences, and
allows for the detection of interactions.
Analyses were carried out to answer the following questions: (1) Are
there any .overall perceptual differences among the science courses? (2)
What specific components of the environment are perceived differently?
(3) Do these specific components differentiate between. each pair of courses?
and (4) Can the specific components considered as a group be ordered on, the
basis of their ability to discriminate among the courses?' The statistical
procedures used to, test null hypotheses associated with the above questions
were (1) multivariate, and (2) univariate analyses of variance, (3) Newñtan-
Keuls multiple comparisons, and (4) discriminant function analysis,
respectively. The'ten scales of the LEI served'ás fhe dependent variables.
Achievement level--high, middle, and low (based on class mean scores on
the TAS within each science course)--and science course--biology, chemistry,
and physics--were the two independent factors in the design.
Results
Overall differences were tested based upon F-statistics from a multi-
variate analysis of variance. The results of this analysis, presented in
Table 2, showed that the hypothesis of no multivariate diff rrence could be
rejected (p < .01), so that there was a significant difference between the
students' perception of their environment in the three science,courses.
Because there was no significant interaction (p < .26) between achievement
level and type of science çourse, achievement level and type of'coûrse
were considered to be independent. .
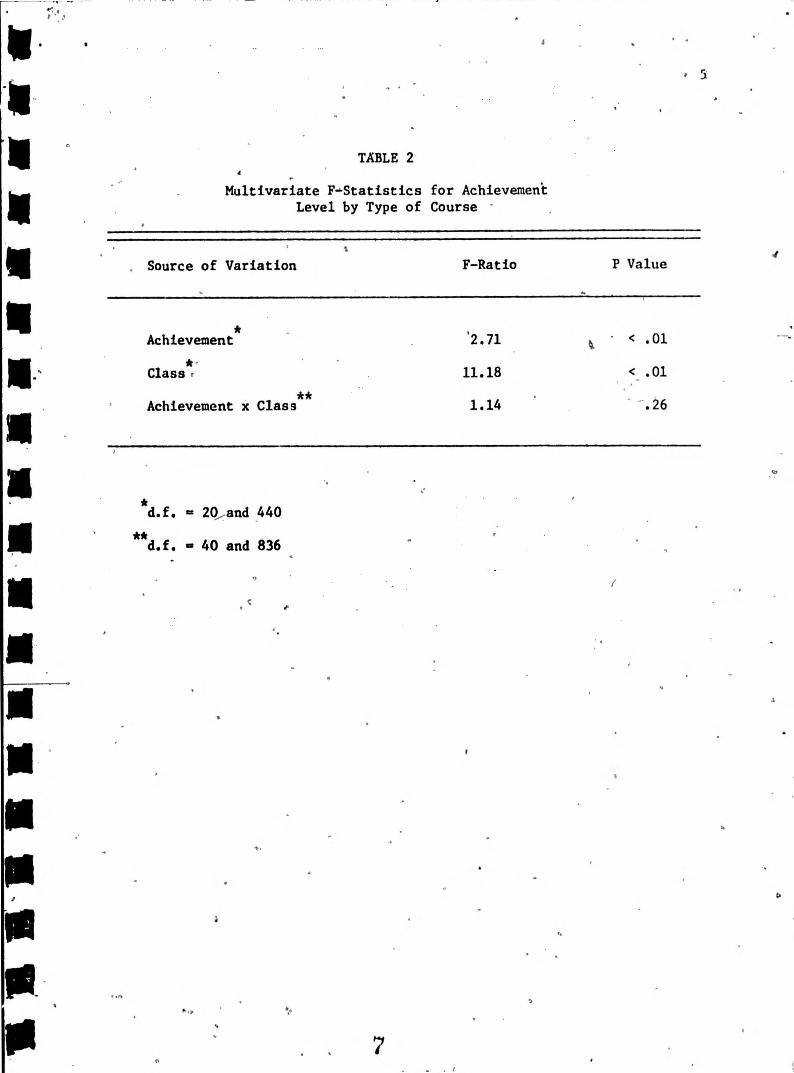
TABLE 2
Multivariate F-'Statistics for Achievement Level by Type of Course
Source of Variation F-Ratio P Value
Achievement* '2.71 < .01
Class ~ - 11.18 < .01
** Achievement x Class 1.14 .26
*d.f. Q 20,and 440
`d.f. - 40 and 836
Because the multivariate analysis produced significant results, the
univariate F-statistics were examined. This procedure tested for possibl
differences among the science courses for each LEI scale. AN shown to
Table 3, nine of the ten LEI scales revealed significant differences among
the courses. The combined mean scores for biology, chemistry, and physics
classes on these nine scales--Diversity, Formality, Friction, Favoritism,
Difficulty, Democratic, Cliqueness, Satisfaction, and Goal Direction--are
presented in Table 4. Biology classes were rated highest, then chemistry,
then physics on the Diversity, Formality, Friction, Favoritism, Cliqueness
scales. Chemistry classes, followed by physics and then biology classes,
were rated as highest on the Difficulty scale and lowest on the Disorgani-
zation scale.
To investigate further those scales for which the univariate analysis
indicated a significant difference among the science courses, Newman-Keuls
multiple comparisons were made on the combined course means. Multiple
comparisons are techniques for identifying significant differences among
a set of three or more means. The Newman-Keuls method can be used to do
all possible simple contrasts with good power (Hopkins, 1972). The means
of the levels for the factor considered are ordered, and the q-value for a
desired alpha level is dependent on the number of means between the two
being compared. The twc means with the largest difference between them
must be considered fi-st, then the two means with the secohd largest
difference, and so on, resulting in ql, q2, and q3 values.
For the combined course means, there were three contrasts of interest:
biology with physics, biology with chemistry, and chemistry with physics.
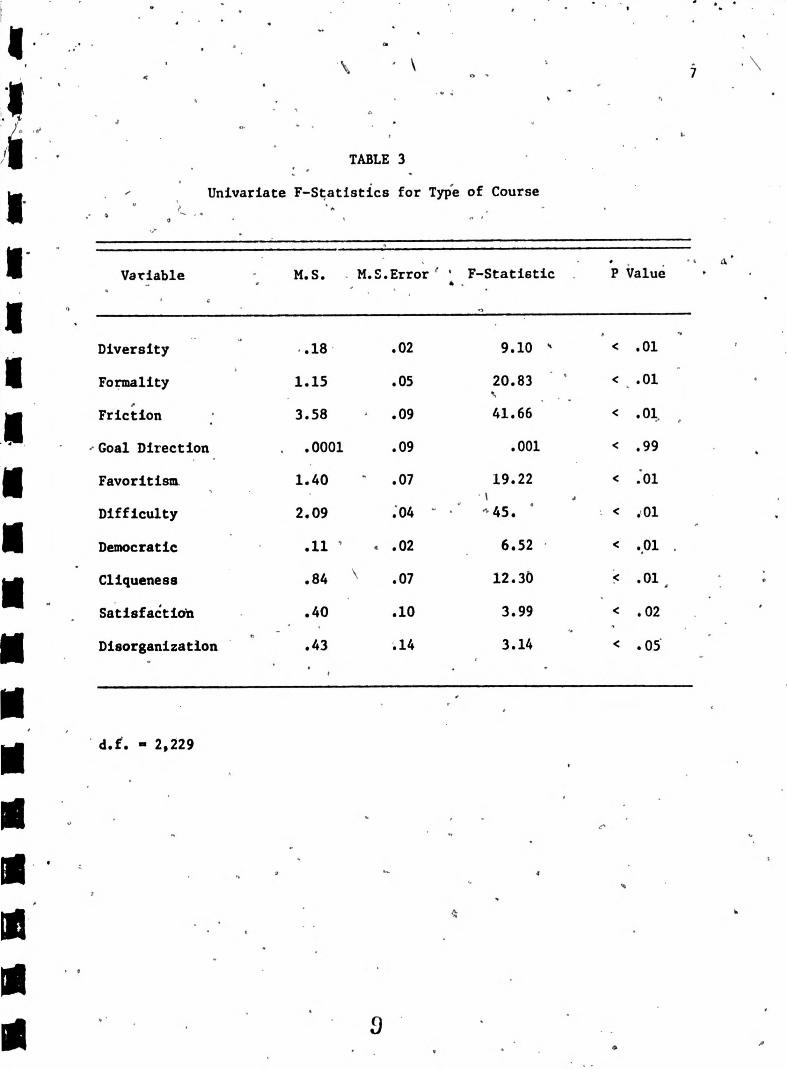
TABLE 3
Univariate F-Statistics for Type of Course
Variable M.S. M.S.Error` F-Statistic P Value
Diversity .18 .02 9.10 < .01
Formality
Friction
1.15 .05
3.58 .09
20.83
41.66
<
<
.01
.01,
Goal Direction .0001 .09 .001 < .99
Favoritism
Difficulty
1.40 .07
2.09 .04
19.22
45.
<
<
:01
.01
Democratic .11 .02 6.52 < .01
Cliqueness .84 .07 12.30 < .01
Satisfaction .40 .10 3.99 < .02
Disorganization .43 .14 3.14 < .05
d.f. = 2,229

TABLE 4
Combined Course Mean Scores
Diver- Formal- Fric- Favorit- Diffi- Demo- Clique- Satis- Disorgan- sity ity tion ism culty cratic ness faction ization
iology B 2.91 2.67 2.51 2.16 2.63 '2445 2 .73 2.51 2.32
hemistry C 2.84 2.62, 2.25 1.99 2.92 2.48 2.60 2.57 2.18
hysics P 2.81 2.39 2:13 1.86 2.87 2.54 2.49 2.68 2.24
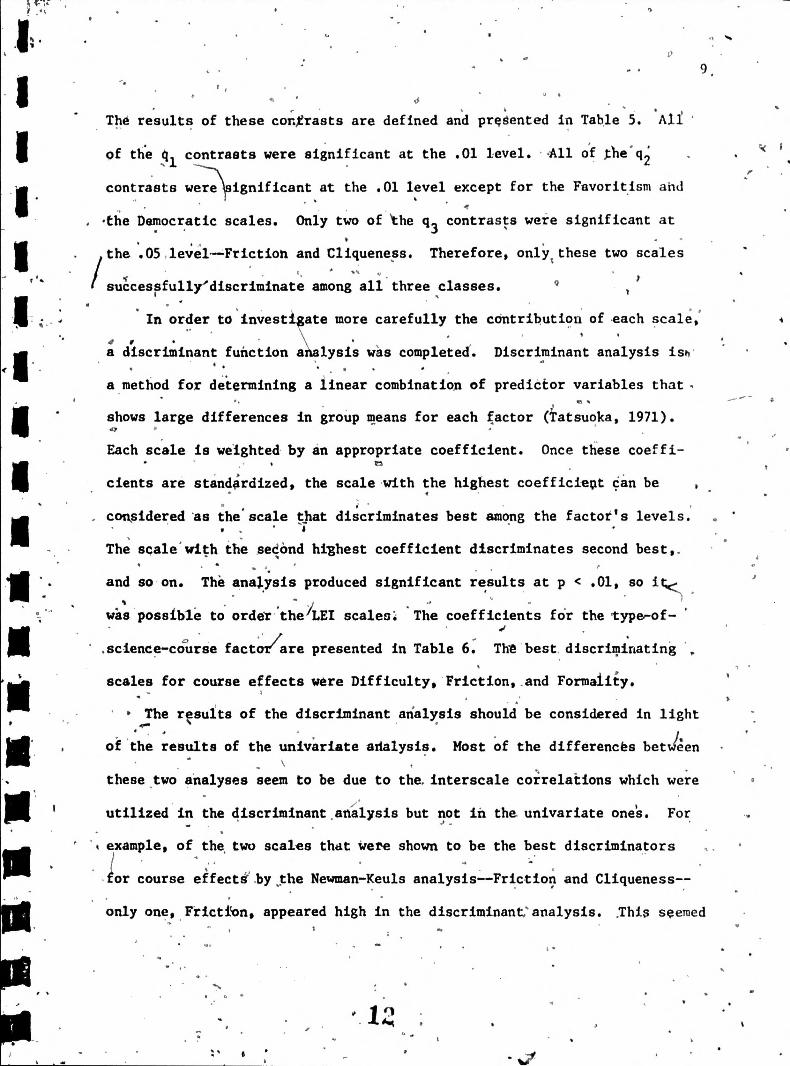
The results of these contrasts are defined and presented in Table 5. All
of the q1 contrasts were significant at the .01 level. -All of the q2
contrasts were significant at the .01 level except for the Favoritism and
the Democratic scales. Only two of the q3 contrasts were significant at
the .05 level--Friction and Cliqueness. Therefore, only, these two scales
successfully discriminate among all three classes.
In order to investigate more carefully the contribution of each scale,
a discriminant function analysis was completed. Discriminant analysis isn
a method for determining a linear combination of predictor variables that,
shows large differences in group means for each factor (iatsuoka, 1971).
Each scale is weighted by an appropriate coefficient. Once these coeffi-
cients are standardized, the scale with the highest coefficient On be
, considered' as thescale that discriminates best among the factor's levels.
The scale with the sedùnd highest coefficient discriminates second best,.
and so on. Thè analysis produced significant results at p < .01, so it
wàs possible to order the'LEI scales'. 'The coefficients fór the type-of-
' .science-course factor are presented in Table 6. The best discriminating
scales for course effects were Difficulty, Friction, and Formality.
The results of the discriminant analysis should be considered in light
of the results of the univariate analysis. Most of the differences betwéen
these two analyses seem to be due to the.interscale correlations which were
utilized in the discriminant.analysis but not iñ the univariate ones. For
, example, of the two scales that were shown to be the best discriminators
for course effectd.by the Newman-Keuls analysis--Friction and Cliqueness--
only one, Friction, appeared high in the discriminant,' analysis. .Thia seemed
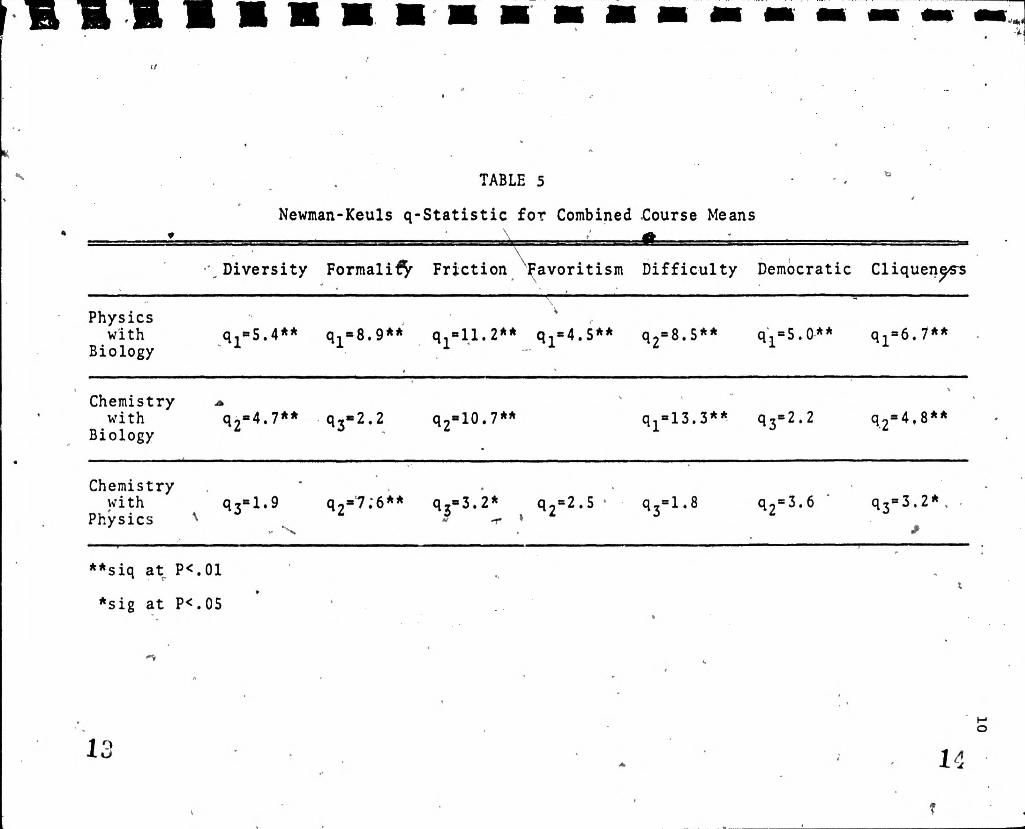
TABLE 5
Newman-Keuls q-Statistic for Combined Course Means
',Diversity Formality Friction Favoritism Difficulty Democratic Cliqueness
Physics with
Biology q1=5.4** q1=8.9** q1=11.2**
q1=4.S** q2=8.5** q'1=5.0-** q1=6.7**
Chemistry with
Biology
A
q2=4.7** q3=2.2 q2=10.7** q1=13.3** q3=2.2 q2=4.8**
Chemistry with
Physics q3=1.9 q2=7:6** q3=3.2* q2=2.S q3=1.8 q2=3.6 g3=3.2*,
**sig at P<.01
*sig at P<.05
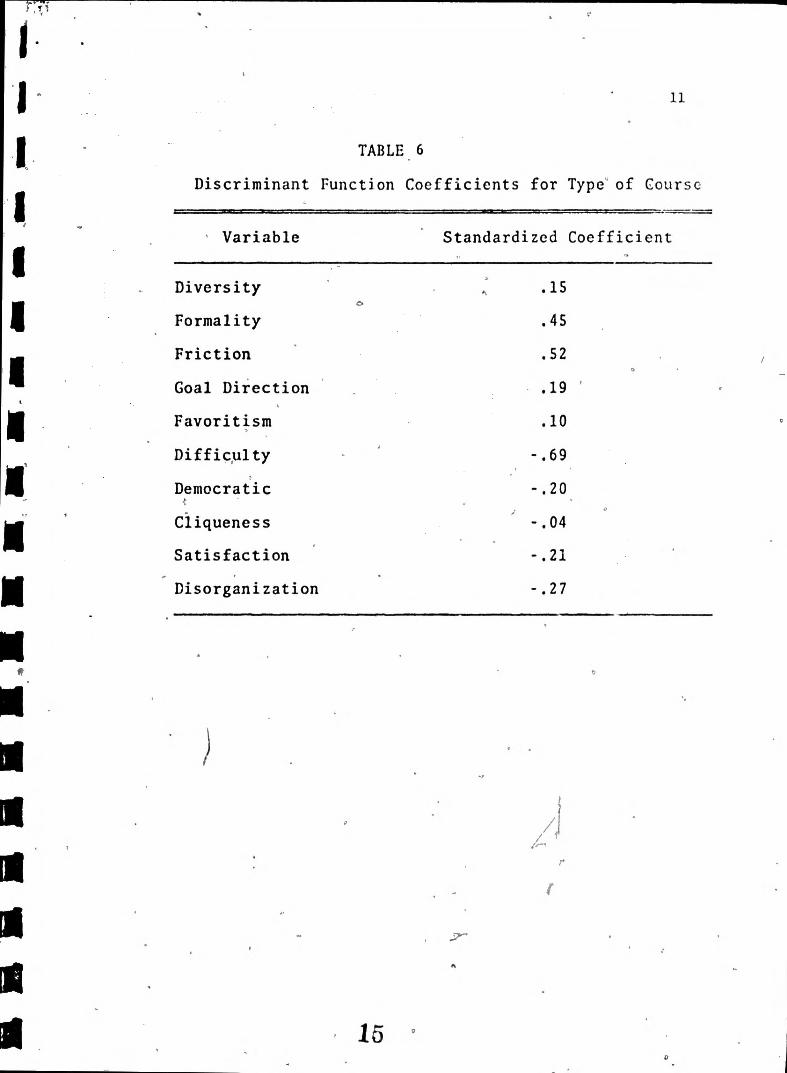
TABLE 6
Discriminant Function Coefficients for Type of Course
Variable Standardized Coefficient
Diversity .15
Formality .45
Friction .52
Goal Direction .19
Favoritism .10
Difficulty -.69
Democratic -.20
Cliqueness -.04
Satisfaction -.21
Disorganization -.27
contradictory, but an examination of the interscale correlations in Table 7
showed that Cliqueness was correlated with Friction. Since the two scales
were related, the discriminant analysis selected the one that discriminated
best.
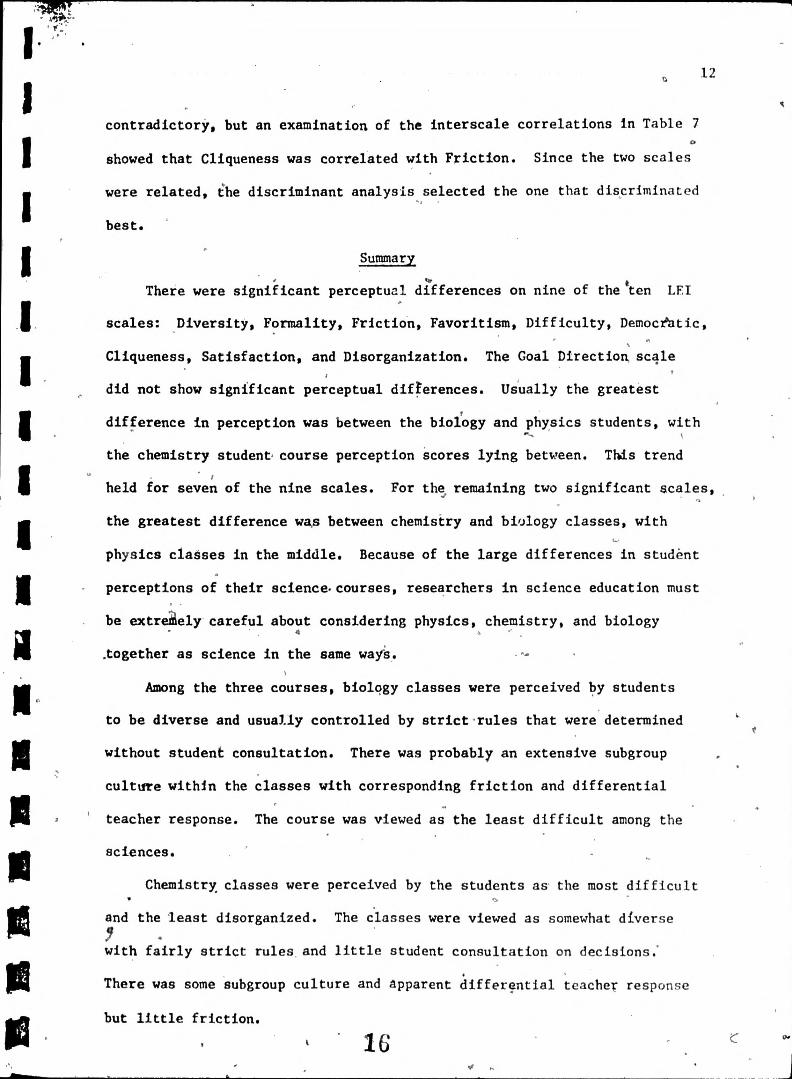
Summary
There were significant perceptual differences on nine of the ten LEI
scales: Diversity, Formality, Friction, Favoritism, Difficulty, Democratic,
Cliqueness, Satisfaction, and Disorganization. The Goal Direction scale
did not show significant perceptual differences. Usually the greatest
difference in perception was between the biology and physics students, with
the chemistry student course perception scores lying between. This trend
held for seven of the nine scales. For the remaining two significant scales,
the greatest difference was between chemistry and biology classes, with
physics classes in the middle. Because of the large differences in studènt
perceptions of their science. courses, researchers in science education must
be extremely careful about considering physics, chemistry, and biology
.together as science in the same ways.
Among the three courses, biology classes were perceived by students
to be diverse and usually controlled by strict-rules that were determined
without student consultation. There was probably an extensive subgroup
culture within the classes with corresponding friction and differential
teacher response. The course was viewed as the least difficult among the
sciences.
Chemistry, classes were perceived by the students as the most difficult
and the least disorganized. The classes were viewed as somewhat diverse
with fairly strict rules and little student consultation on decisions.'
There was some subgroup culture and apparent differential teacher response
but little friction.
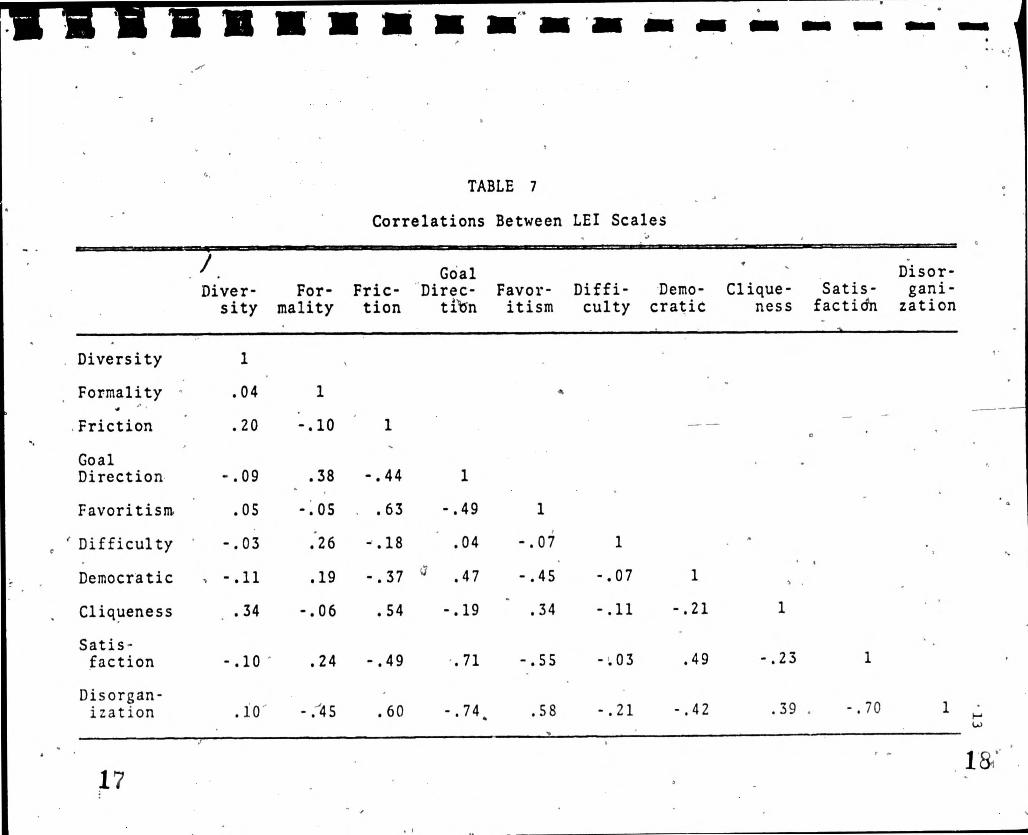
TABLE 7
Correlations Between LEI Scales
Diver-sity
For-mality
Fric-tion
Goal Direc-
ti 5n Favor-itism
Diffi-culty
Demo-cratic
Clique-ness
Satis-factidn
Disor-gani-
zation
Diversity 1
Formality .04 1
Friction .20 -.10 1
Goal Direction -.09 .38 -.44 1
Favoritism .05 -.OS .63 -.49 1
Difficulty -.03 .26 -.18 .04 -.07 1
Democratic -.11 .19 -.37 .47 -.45 -.07 1
Cliqueness .34 -.06 .54 -.19 .34 -.11 -.21 1
Satis-faction -.10 .24 -.49 .71 -.SS -.03 .49 -.23 1
Disorgan-ization .10 -.45 .60 -.74 .58 -.21 -.42 .39 -.70 1
Physics classes were perceived lly the students as being fairly cohesive
with little friction or teacher favoritism. The classes did not have strict
rules and the students had a voice in the dedisions. The course was viewed
as being almost as difficult as chemistry with a little less diversity, and
was viewed as most satisfying among the three courses.
The discriminant function analysis ordered the LEI scales on the basis of
their ability to discriminate among the science courses. Those scales that
discriminated best were Difficulty, Friction, and Formality.
Discussion
One purpose of, this investigation was to provide descriptions of the
different environments that were perceived within the individual science
courses to provide an aid to counselors arid in curriculum development.
Counselors will now be able to describe for students the nature of the
environment likely to be found in biology, chemistry, and physics classes.
This infoïmaLtion,should be.vsluable to the student in the selection of his
courses. Course descriptions resulting from knowledge of student perception
of the usual environment in biology, chemistry, and physics courses can be
used in attempts to revise science courses to produce desired perceptual
changes.
Another purpose of this investigation was to examine the results in
the hope of shedding some light on the loss of interest that occurs in
biological and physical science courses. Examination of those scales that
were shown to be the best discriminators by the multiple comparisons and
the discriminant function analysis would probably be most fruitful. The
Newman-Keuls q-statistics revealed that, while seven scales discriminated
between biology and bhysics classes, only two scales, Friction and Cliqueness,
successfully discriminated among all three courses. The discriminant function
analysis'selected the Difficulty, Friction, and Formality scales As the best
discriminators among the three courses.
The Difficulty scale seems to provide the most logical explanation of
interest loss. The physical science courses are viewed as much more difficult
than the biology courses, even though the physical sciences usually have a
more select group of high ability students. Many people tend to lose interest
in things they find:particularly difficult.• Students usually prefer courses
which are less difficult and in which they can excel. Some way should be
found to present physical science material in such a way that students will
find it easier and therefore less threatening. One way to accomplish this
at least for some students, would be to cover the science concepts and
principles with less emphasis on the related mathematic-s. Students often can
understand the physical science concept but are unable to handle its mathe-
matical interpretation'.
One possible effect of the presence of an extensive subgroup culture in
the biology classes, as evidenced by the high Friction score, could be the
creation of a cooperative class situation. It has been shown that students
prefer cooperative classroom situations (Johnson, ],973). The subgroup members
of biology classes could be working together rather than each-student working
alone and competing with the other students as is likely to occur in physics
classes. It is also poséible that in biology class the subgroup members
cooperate among themselves while they compete with the other groups, thus,
combining aspects of both the competitive and the cooperative learning
environments.
In summary, then, it may be possible to make physical science classes
more interesting by encouraging a cooperative subgroup structure with inter-
group competition and by presenting scientific concepts in the simplest
manner possible. Care must be taken in implementing these changes to insure
that the achievement level of the classes is not subsequently lowered.
There ate two areas in which further research could be completed. A
longitudinal study which would follow the biology students through chemistry
and physics and measure their perceptions of each learning environment to
determine (1) if these perceptions match those obtained in this study, and
(2) if the differences in perceptions of biology, chemistry, and physics
classes would still exist even though the same people would do the rating.
Another study could be completed to determine if student perceptions of the
learning environment change while the student is enrolled in the particular
course. If differences do exist, they may be contributing to the reduced
student interest that occurs upon course completion.
References
Ahlgren, A.,.. "Evaluation of Harvard Project Physics Course Interim Report," mimeo of remarks delivered at AAPT, February 3, 1969.
Anderson, G. J., "Effects of Course Content and • Sex on LEI," American 'Educational Research Journal 8:4, 1971, pp. 649-663.
Anderson, G. J., The Assessment of Learning Environments: A Manual for the Learning, Environment Inventory and the My Class Inventory. Atlantic Institute of Education, Halifax, Nova Scotia, Canada, 1973.
Anderson, G. J., Walberg,. H. 1., and Welch, W. W., "Curriculum Effects on the Social Climate of Learning: A New Representation of Discrimination Functions," American Educational Research Journal, 6, 1969, pp. 315-328.
Hopkins, K., "Expository Notes on Multiple Comparisons," unpublished mimeo, University of Colorado, 1972.
Johnson, R. T., "Cooperation and Competition in the Classroom," Elemeñtary School Journal, 74:172-81, December, 1973.
Kaphingst,Lee M., "Study of Some Junior High School Student Attitudes Toward Science and Factors Relating to These Attitudes," unpublished M.A. thesis, University of Minnesota, 1971.
Lawrenz, F. P., "Test of Achievement in Science," unpublished mimeo, University of Minnesota, 1971.
Mackay, L. D., "Changes in Victorian Physics Students During Two Years of Physics Study," The Australian Physicist, July, 1970, pp.,103-109.,
Pella, M,, and Sherman, J., "A Comparison of Two Methods of Utilizing Laboratory Activities in Tedching the Course IPS," School Science and Mathematics, April, 1969, pp. 303-314.
Robinson, J. T., "Philosophical and Historical.Bases of Science Teaching," Review of Educational Research, 39, 1969, pp. 459-471.
Tatsuoka, M.'M., Multivariate analysis; Terhniques fgr.gducational and. Psychological Research John Wiley & Sons, Inc., New York, 1971.
Travers, R., Editor, Second Handbook of Research in Teaching, Rand McNally and Company, Chicago, 1973.
Walberg, H. J., and Welch, W.'W., "A New Use of Randomization in Experimental Curriculum Evaluation," School Review, 75, 1967, pp. 369-377.
Winer, B. J.,a Statistical Principles in Experimental Design, Second Edition, McGraw Hill Books; New York, 1971.
Yamamoto, K., Thomas, E. C., and Karns, E. A., "School-Related Attitudes in Middle-School Age Students," American Educational Research Journal, 6, 1969,
.pp. 191-206.
Recommended