Structure and properties of aluminium–magnesium casting alloysafter heat treatment
Mariusz Krol1 • Tomasz Tanski1 • Przemysław Snopinski1 •
Bła _zej Tomiczek1
Received: 10 December 2015 / Accepted: 11 September 2016 / Published online: 21 September 2016
� The Author(s) 2016. This article is published with open access at Springerlink.com
Abstract Since the forming of the microstructure depends
on the specific of the casting method, which directly affects
further mechanical and physical properties of the material,
it is important to understand how to control the
microstructure of the cast to understand changes that taking
place during the crystallisation process. For estimating the
metallurgical quality of the liquid metal before casting, the
thermal-derivative analysis (TDA) is utilised. The TDA has
been used for a long time, in both ferrous and non-ferrous
industries casting. The Universal Metallurgical Simulator
and Analyser (UMSA) platform is a rapid, sensitive and
economical method of determining a full range of solidi-
fication features. The work focuses on the thermal analysis
and heat treatment of aluminium alloys. The liquidus and
solidus temperatures and dendrite coherency point (DCP)
are then characterised. The research shows that the UMSA
platform allows precise determination and calculation of
thermal parameters. The influence of the heat treatment on
structure and properties of aluminium castings has been
determined as well. Heat treatment was carried out to
increase the mechanical properties of aluminium alloys.
Based on the findings above, the influence of microstruc-
ture on properties of the alloys is discussed.
Keywords Thermal-derivative analysis � Dendrite
coherency point � Heat treatment � Structure � Aluminium
alloy � Tensile properties
Introduction
Aluminium–magnesium casting alloys have a wide range
of application, especially in the automotive and shipborne
industry that is directly related to their good mechanical
properties [1, 2]. These alloys are characterised by rela-
tively good castability and are distinguished by excellent
corrosion resistance due to high magnesium content [3, 4].
However, application of aluminium casting alloys for
structural components requires high strength and suit-
able high elongations. Grain size, their morphology,
interdendritic distance and distribution of secondary phases
are crucial factors affecting mechanical properties of cast
parts [1, 5–7]. The quality of the microstructure of alu-
minium alloys mainly depends on the chemical composi-
tion, melting process and cooling rate [7–9]. Due to those
facts, it is important to understand how to control structure
forming of aluminium alloys through casting or heat
treatment.
The grain size of alloys related closely to their solidi-
fication characteristics under equilibrium and non-equilib-
rium conditions. Due to its comfort of use and inexpensive
cost, thermal-derivative analysis (TDA) is much more
suitable for industrial applications related to other thermal
techniques and TDA method has been successfully used to
analyse the features of aluminium, magnesium and zinc
alloys in recent years [10–12]. In this method, the
& Mariusz Krol
Tomasz Tanski
Przemysław Snopinski
Bła _zej Tomiczek
1 Faculty of Mechanical Engineering, Institute of Engineering
Materials and Biomaterials, Silesian University of
Technology, Konarskiego 18a St., 44-100 Gliwice, Poland
123
J Therm Anal Calorim (2017) 127:299–308
DOI 10.1007/s10973-016-5845-4
temperature changes in the sample are recorded from
wholly liquid to completely solidified phases creating a
curve plot of temperature as a function of time. A cooling
curve reflects the release of latent heat of solidification.
This release of latent heat in multicomponent alloys
changes the slope of the cooling curve which is then used
to detect the characteristics of transitions and phase reac-
tions during solidification [11–13]. The solidification
characteristics, e.g., dendrite nucleation and dendrite
coherency, can be derived from thermal analysis of the
alloy solidification. The dendrite coherency point temper-
ature refers to the state of solidifying alloys at which a
coherent dendrite network is established through the for-
mation of grains. Once the dendrites become coherent,
liquid metal flow is restricted to interdendritic regions.
There exist four main DCP temperature testing approaches:
the rheological technique (however, this method may
influence DCP measurement), thermal analysis of the
minimum temperature differences between two cooling
curves, thermal analysis of the second derivative of cooling
curve and the thermal diffusivity measurements techniques
[12, 14].
The dendrite coherency point (DCP) temperature refers
to the state of a solidifying alloy at which a coherent
dendrite network is established during the formation of
grains. In agreement with this understanding, the grain size
in solidifying microstructure has been decided and will not
change at/after this point. Correspondingly, the solid frac-
tion (f) at DCP has been defined as fDCP, and a higher fDCP
means finer grain size after solidification of alloy [14].
Specialists have been working for many years to
improve mechanical properties of light alloys through the
microstructure controlling using special casting techniques
(sand casting, high-pressure die casting, mould casting),
adding micro-additions that cause obtaining fine-grained
microstructure, applying surface treatments or using heat
treatment that should ensure increase in material properties
[15–17].
The effect of precipitation treatment on the structure
forming and mechanical properties of Al–Mg binary alloys
in recent years has been very precisely investigated. Sci-
entist described precipitation sequence accurately during
artificial ageing of aluminium–magnesium alloys and pro-
posed sequence:
sssa ! GP zones ! b0 ! b00 ! b ð1Þ
where supersaturated solid solution is sssa, GP forming of
Guinier–Preston zones, b00 is an L12 (Al3Mg) and b0
forming of phase Al3Mg2, which directly increases
mechanical properties of Al–Mg alloys. It was also found
that when Al–Mg alloy with\18 % Mg content is aged at a
temperature between 100 and 250 �C, the b0 forms first and
the presence of b phase could be observed only when Mg
depletion of the matrix is almost complete [9, 18].
The presented investigation was initiated to determine
an influence of heat treatment on the structure and prop-
erties of EN AC 51100 and EN AC 51300 alloys. The first
stage of the experiment was to examine the influence of
cooling rate on the solidification process in studied alloys.
The second stage was determination of the most beneficial
type of heat treatment based on the mechanical examina-
tions such as hardness measurements and static tensile test.
Experimental
Material
The investigation has been carried out on commercial
aluminium alloy—appointed by the standard EN
1706:2010 (51100 and 51300). Because of high magne-
sium content, these alloys are characterised by high cor-
rosion resistance and relatively high strength. The chemical
composition of the alloys is given in Table 1.
Metallographic investigations
The metallographic studies of EN AC 51100 and EN AC
51300 alloys were made on the as-cast samples taken from
the ingot and on samples after solution treatment and
artificial ageing. The change of the microstructure of
samples subjected to different types of heat treatment has
been investigated. Specimens were cold mounted and
ground on 240#, 320#, 400#, 600# and 1200# SiC abrasive
and then finished with 6-, 3- and 1-lm diamond paste. To
reveal microstructure prepared specimens were etched
using Keller’s reagent (0.5 mL HF, 1.5 mL HCl, 2.5 mL
HNO3, 95.5 mL H2O) and Weck’s reagent (4 g KMnO4,
1 g NaOH, 100 mL H2O) immersed for 60 s. To obtain
grain contrast, the polished samples were subjected to
electrolytic etching using Barker’s reagent (5 mL HBF4
(40 %), 200 mL H2O) under a current of 20 V and then
observed under bright field and polarised light (using
sensitive tint). The microstructure of characteristic states of
investigated alloy was observed using an optical micro-
scope Axio Observer Image Analyser.
Table 1 Chemical composition of investigated alloys/mass/%
Mg Si Fe Cu Al
EN AC 51100 2.86 0.07 0.07 0.01 Bal
EN AC 51300 5.55 0.08 0.07 0.01 Bal
300 M. Krol et al.
123
Thermal analysis
The thermal analysis through melting and solidification
sequences was performed using the Universal Metallurgi-
cal Simulator and Analyser (UMSA) [13]. The melting and
solidification trails for the aluminium alloy were performed
using argon as cover gas. The data for thermal analysis
(TA) was gathered using a high-speed National Instruments
data acquisition system linked to a personal computer. The
recorded data were imported into Fityk for data analysis.
The cooling curves and corresponding derivative curves
were plotted to determine characteristic thermal events,
based on the first and second derivative of cooling curve.
To ensure the reproducibility of testing results, a thermal
analysis of each alloy was performed at least three times.
The procedure consisted of following steps. First, the test
specimen was heated to 700 ± 2 �C and isothermally held
at this temperature for 90 s to stabilise the melt conditions.
Next, the test sample was solidified at a cooling rate of
approximately 0.5 and 0.9 �C s-1 that was equivalent to
the solidification process under natural and accelerated
cooling conditions.
For the determination of solid fraction at DCP, the
Newtonian baseline has been estimated by sixth
polynomial fitting (dT/dt)BL = a0 ? a1T ? a2T2 ?
a3T3 ? a4T
4 ? a5T5 ? a6T
6 between the beginning and
the end of solidification in the first derivative curve. The
sixth-order polynomial yields a correlation coefficient
[0.99. The solid fraction at DCP was calculated from the
accumulative area between the first derivative and the
baseline at tDCP as a fraction of the area between these
curves.
Heat treatment
The solid solution temperature of EN AC 51100 and EN
AC 51300 alloy was selected experimentally and based on
the results obtained from the thermal-derivative analysis
(UMSA). The test samples were heated for 8 and 12 h in
the furnace in a wide range of temperatures and then
immediately cooled in cold water. The influence of solid
solution hardening and the artificial ageing mechanism of
EN AC 51100 and EN AC 51300 alloys was precisely
investigated. The temperature of artificial ageing was
160 �C. To analyse the influence of ageing time on the
ageing potential of studied alloys hardness and tensile test
measurements were taken.
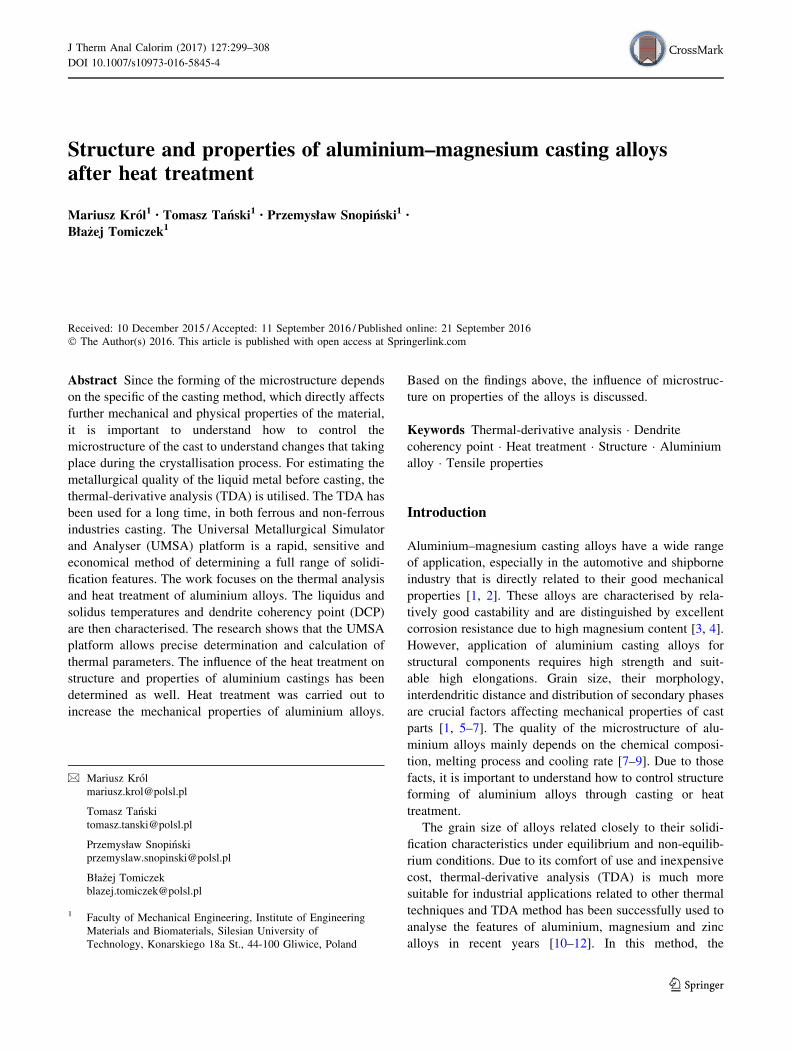
Fig. 1 Microstructure of a EN AC 51100, b EN AC 51300 alloy in
as-cast condition observed in polarised light
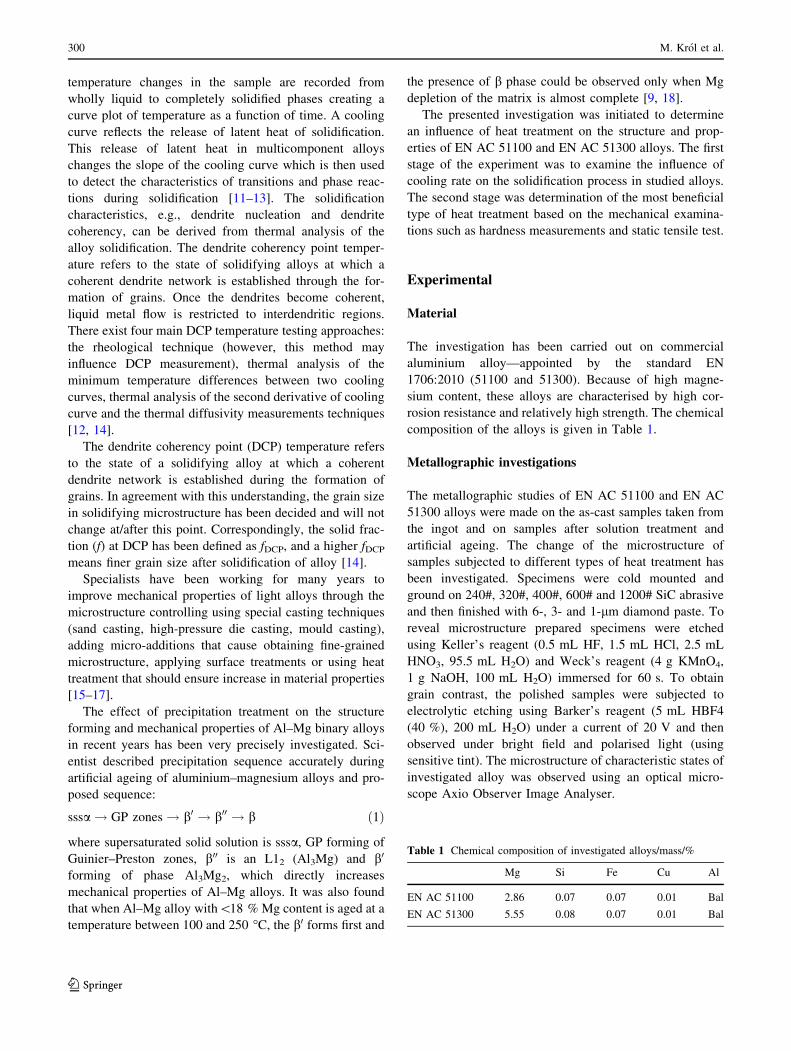
Fig. 2 Microstructure of EN AC 51100 in as-cast condition a etched
using Keller’s reagent, b etched using Weck’s reagent (bright field)
Structure and properties of aluminium–magnesium casting alloys after heat treatment 301
123
Mechanical properties
To determine mechanical properties of the examined
alloys, the test pieces were deformed in a static tensile test
using universal tensile testing machine ZWICK Z/100
according to standard PN-EN 10002-1:2004. The hardness
was measured using Automatic Rockwell hardness tester
ZWICK ZHR 4150 under a load of 60 kg. Tensile tests and
hardness measurements were carried out on the as-cast
samples, after solution treatment and after various numbers
of artificially aged specimens. To obtain precise results, ten
hardness measurements were taken on each sample.
Results and discussion
Structure
The representative grain structures of the Al–Mg alloys in
the as-received state with different Mg contents are pre-
sented in Fig. 1. It is clear that both samples characterise a
similar equiaxed dendritic structure. In addition to the
rosette-like primary Al, there is b phase distributed in the
interdendritic region as a result of non-equilibrium solidi-
fication. To perform precise phase identification of as-re-
ceived state material, two types of etchants were used to
reveal a microstructure. Keller’s reagent (Fig. 2a) that is
commonly used for etching of aluminium alloys revealed
the secondary precipitates on the grain boundaries, but does
not allow a clear distinction of structure constituents.
Application of Weck’s reagent allows distinguishing indi-
vidual precipitations by its shade. Thus, it can be stated that
the microstructure in the as-received state consists of three
phases: a-Al (bright matrix), Al3Mg2 (dark precipitations)
and Mg2Si (grey precipitations) which forms near grain
boundaries (Fig. 2b). The presence of main phases has
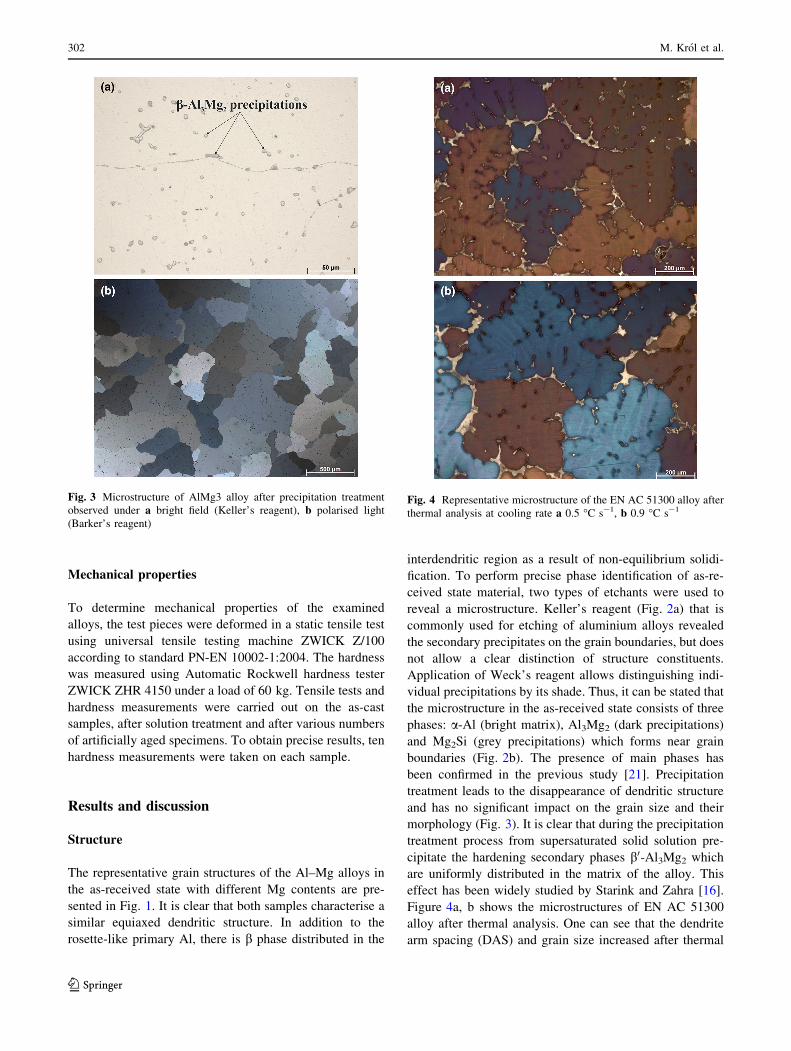
been confirmed in the previous study [21]. Precipitation
treatment leads to the disappearance of dendritic structure
and has no significant impact on the grain size and their
morphology (Fig. 3). It is clear that during the precipitation
treatment process from supersaturated solid solution pre-
cipitate the hardening secondary phases b0-Al3Mg2 which
are uniformly distributed in the matrix of the alloy. This
effect has been widely studied by Starink and Zahra [16].
Figure 4a, b shows the microstructures of EN AC 51300
alloy after thermal analysis. One can see that the dendrite
arm spacing (DAS) and grain size increased after thermal
Fig. 3 Microstructure of AlMg3 alloy after precipitation treatment
observed under a bright field (Keller’s reagent), b polarised light
(Barker’s reagent)
Fig. 4 Representative microstructure of the EN AC 51300 alloy after
thermal analysis at cooling rate a 0.5 �C s-1, b 0.9 �C s-1
302 M. Krol et al.
123
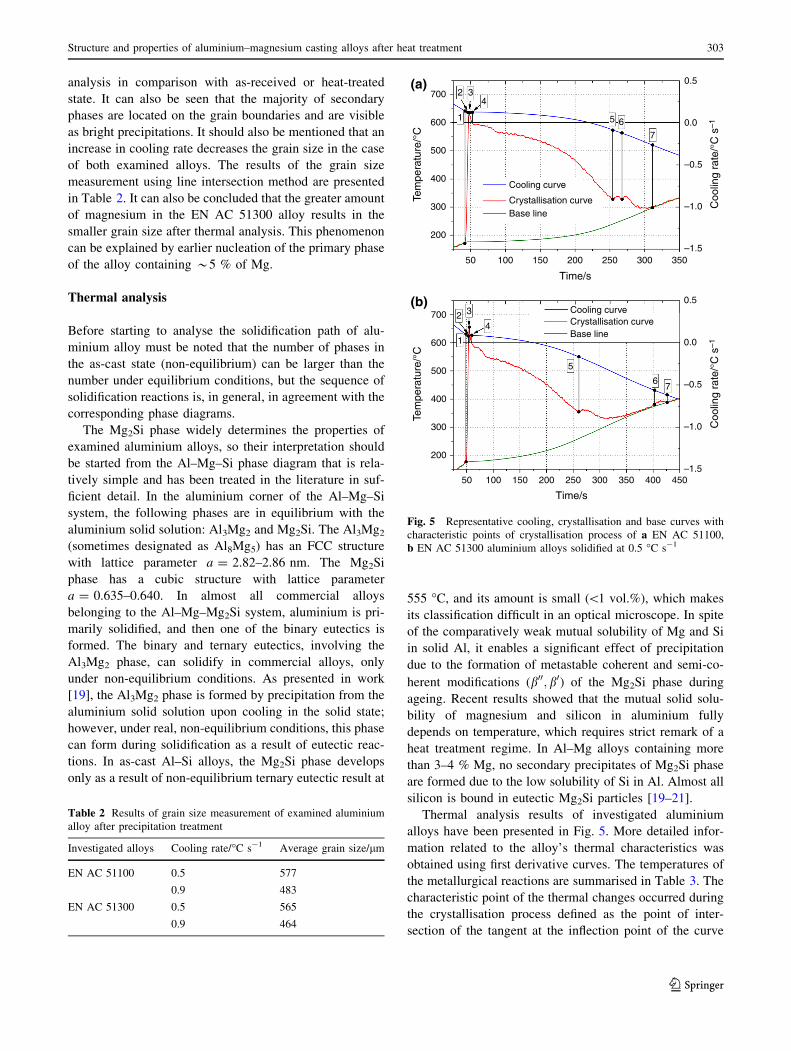
analysis in comparison with as-received or heat-treated
state. It can also be seen that the majority of secondary
phases are located on the grain boundaries and are visible
as bright precipitations. It should also be mentioned that an
increase in cooling rate decreases the grain size in the case
of both examined alloys. The results of the grain size
measurement using line intersection method are presented
in Table 2. It can also be concluded that the greater amount
of magnesium in the EN AC 51300 alloy results in the
smaller grain size after thermal analysis. This phenomenon
can be explained by earlier nucleation of the primary phase
of the alloy containing *5 % of Mg.
Thermal analysis
Before starting to analyse the solidification path of alu-
minium alloy must be noted that the number of phases in
the as-cast state (non-equilibrium) can be larger than the
number under equilibrium conditions, but the sequence of
solidification reactions is, in general, in agreement with the
corresponding phase diagrams.
The Mg2Si phase widely determines the properties of
examined aluminium alloys, so their interpretation should
be started from the Al–Mg–Si phase diagram that is rela-
tively simple and has been treated in the literature in suf-
ficient detail. In the aluminium corner of the Al–Mg–Si
system, the following phases are in equilibrium with the
aluminium solid solution: Al3Mg2 and Mg2Si. The Al3Mg2
(sometimes designated as Al8Mg5) has an FCC structure
with lattice parameter a = 2.82–2.86 nm. The Mg2Si
phase has a cubic structure with lattice parameter
a = 0.635–0.640. In almost all commercial alloys
belonging to the Al–Mg–Mg2Si system, aluminium is pri-
marily solidified, and then one of the binary eutectics is
formed. The binary and ternary eutectics, involving the
Al3Mg2 phase, can solidify in commercial alloys, only
under non-equilibrium conditions. As presented in work
[19], the Al3Mg2 phase is formed by precipitation from the
aluminium solid solution upon cooling in the solid state;
however, under real, non-equilibrium conditions, this phase
can form during solidification as a result of eutectic reac-
tions. In as-cast Al–Si alloys, the Mg2Si phase develops
only as a result of non-equilibrium ternary eutectic result at
555 �C, and its amount is small (\1 vol.%), which makes
its classification difficult in an optical microscope. In spite
of the comparatively weak mutual solubility of Mg and Si
in solid Al, it enables a significant effect of precipitation
due to the formation of metastable coherent and semi-co-
herent modifications (b00; b0) of the Mg2Si phase during
ageing. Recent results showed that the mutual solid solu-
bility of magnesium and silicon in aluminium fully
depends on temperature, which requires strict remark of a
heat treatment regime. In Al–Mg alloys containing more
than 3–4 % Mg, no secondary precipitates of Mg2Si phase
are formed due to the low solubility of Si in Al. Almost all
silicon is bound in eutectic Mg2Si particles [19–21].
Thermal analysis results of investigated aluminium
alloys have been presented in Fig. 5. More detailed infor-
mation related to the alloy’s thermal characteristics was
obtained using first derivative curves. The temperatures of
the metallurgical reactions are summarised in Table 3. The
characteristic point of the thermal changes occurred during
the crystallisation process defined as the point of inter-
section of the tangent at the inflection point of the curve
Table 2 Results of grain size measurement of examined aluminium
alloy after precipitation treatment
Investigated alloys Cooling rate/�C s-1 Average grain size/lm
EN AC 51100 0.5 577
0.9 483
EN AC 51300 0.5 565
0.9 464
50
200
300
400
500
600
700
1
1
2 34
2 3
4
5 67
5
67
100 150
Cooling curve
Crystallisation curveBase line
Cooling curveCrystallisation curveBase line
200
Time/s
Tem
pera
ture
/°C
200
300
400
500
600
700
Tem
pera
ture
/°C
Coo
ling
rate
/°C
s–1
250 300 350
50 100 150 200
Time/s
250 300 350 400 450
0.5
0.0
–0.5
–1.0
–1.5
Coo
ling
rate
/°C
s–1
0.5
0.0
–0.5
–1.0
–1.5
(a)
(b)
Fig. 5 Representative cooling, crystallisation and base curves with
characteristic points of crystallisation process of a EN AC 51100,
b EN AC 51300 aluminium alloys solidified at 0.5 �C s-1
Structure and properties of aluminium–magnesium casting alloys after heat treatment 303
123
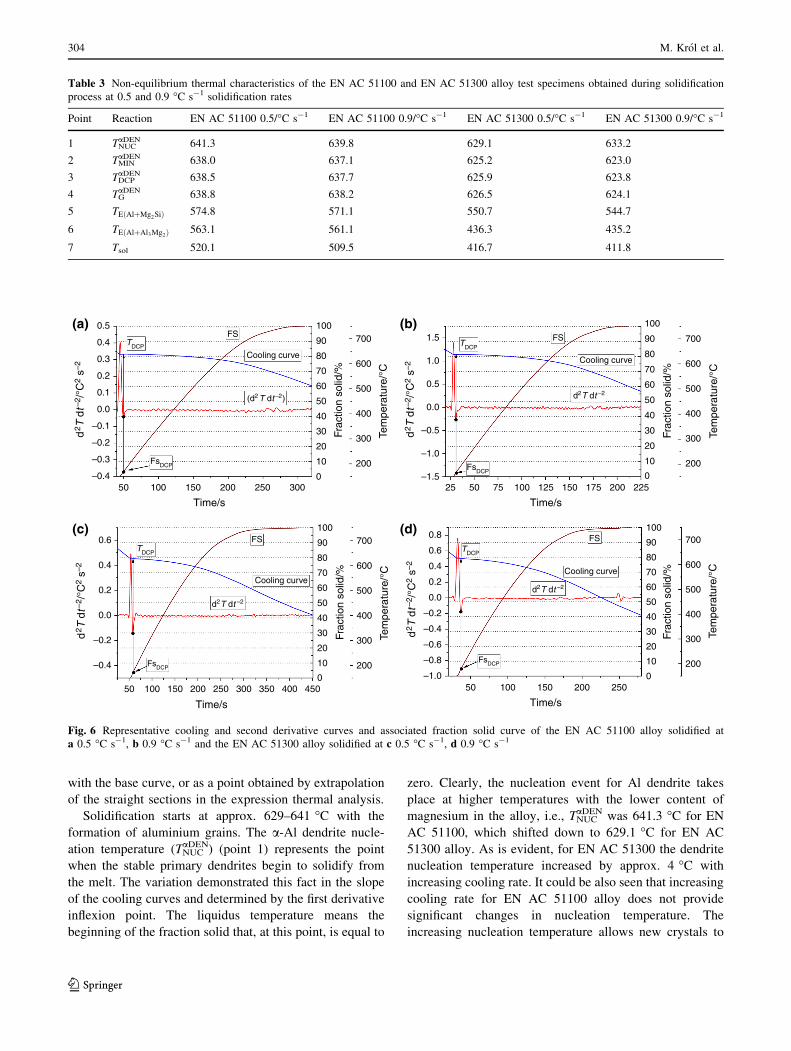
with the base curve, or as a point obtained by extrapolation
of the straight sections in the expression thermal analysis.
Solidification starts at approx. 629–641 �C with the
formation of aluminium grains. The a-Al dendrite nucle-
ation temperature (TNUCaDEN) (point 1) represents the point
when the stable primary dendrites begin to solidify from
the melt. The variation demonstrated this fact in the slope
of the cooling curves and determined by the first derivative
inflexion point. The liquidus temperature means the
beginning of the fraction solid that, at this point, is equal to
zero. Clearly, the nucleation event for Al dendrite takes
place at higher temperatures with the lower content of
magnesium in the alloy, i.e., TNUCaDEN was 641.3 �C for EN
AC 51100, which shifted down to 629.1 �C for EN AC
51300 alloy. As is evident, for EN AC 51300 the dendrite
nucleation temperature increased by approx. 4 �C with
increasing cooling rate. It could be also seen that increasing
cooling rate for EN AC 51100 alloy does not provide
significant changes in nucleation temperature. The
increasing nucleation temperature allows new crystals to
Table 3 Non-equilibrium thermal characteristics of the EN AC 51100 and EN AC 51300 alloy test specimens obtained during solidification
process at 0.5 and 0.9 �C s-1 solidification rates
Point Reaction EN AC 51100 0.5/�C s-1 EN AC 51100 0.9/�C s-1 EN AC 51300 0.5/�C s-1 EN AC 51300 0.9/�C s-1
1 TNUCaDEN 641.3 639.8 629.1 633.2
2 TMINaDEN 638.0 637.1 625.2 623.0
3 TDCPaDEN 638.5 637.7 625.9 623.8
4 TGaDEN 638.8 638.2 626.5 624.1
5 TE AlþMg2Sið Þ 574.8 571.1 550.7 544.7
6 TE AlþAl3Mg2ð Þ 563.1 561.1 436.3 435.2
7 Tsol 520.1 509.5 416.7 411.8
0.0
50 50 75 100 125 150 175 200 22525100 150
Time/s
Cooling curve
Cooling curve
FS FS
FS
TDCP TDCP
TDCPTDCP
FsDCP FsDCP
FsDCPFsDCP
(d2 T dt –2)
Cooling curve
d2 T dt –2
d2 T dt –2
d2 T dt –2
FS
Cooling curve
Time/s
d2 T
dt–
2 /°C
2 s–
2d
2 T d
t–2 /
°C2
s–2
d2 T
dt–
2 /°C
2 s–
2d
2 T d
t–2 /
°C2
s–2
Frac
tion
solid
/%
Tem
pera
ture
/°C
200 250
50 100 150
Time/s
200 250
300
50 100 150
Time/s
200 250 300 350 400 450
0
10
20
200
300
400
500
600
700
30
40
50
60
70
80
90
100
Frac
tion
solid
/%
Tem
pera
ture
/°C
0
10
20
200
300
400
500
600
700
30
40
50
60
70
80
90
100
Frac
tion
solid
/%
Tem
pera
ture
/°C
0
10
20
200
300
400
500
600
700
30
40
50
60
70
80
90
100
Frac
tion
solid
/%
Tem
pera
ture
/°C
0
10
20
200
300
400
500
600
700
30
40
50
60
70
80
90
100
–0.1
–0.2
–0.2
–0.4
–0.3
–0.4
0.1
0.2
0.0
0.0
0.0
–0.5
–1.0
–1.5
0.5
1.0
1.5
–0.2
–0.4
–0.6
–0.8
–1.0
0.2
0.4
0.6
0.8
0.2
0.4
0.6
0.3
0.4
0.5(a) (b)
(c) (d)
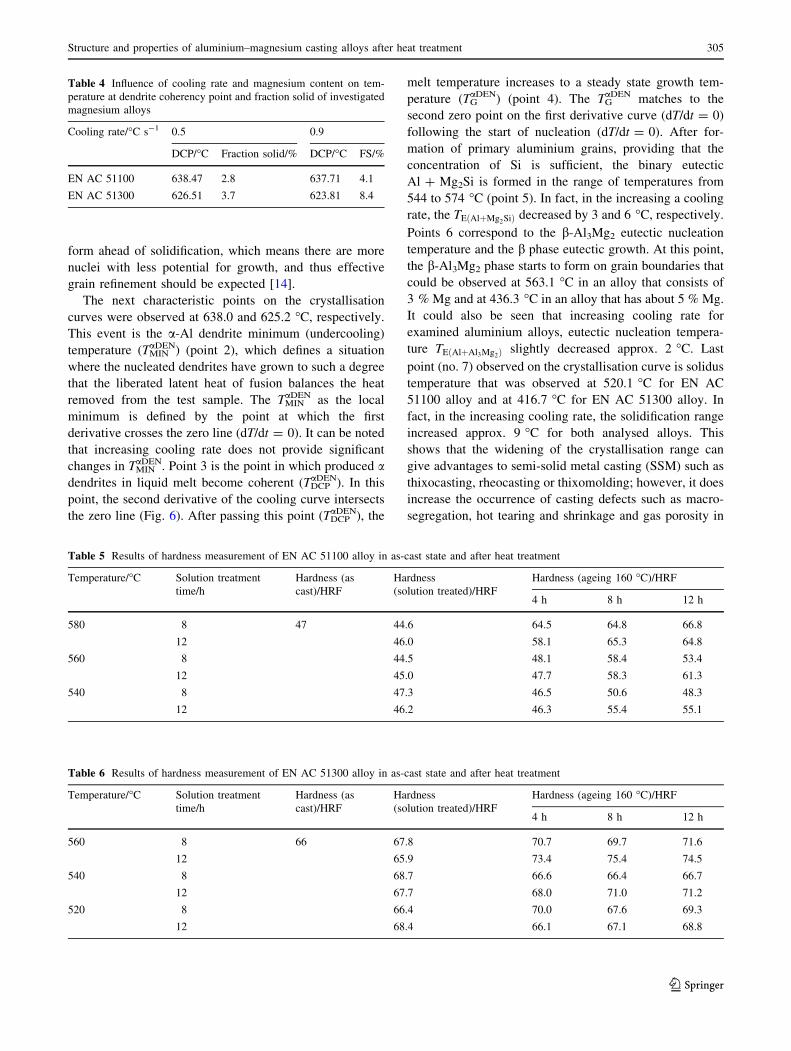
Fig. 6 Representative cooling and second derivative curves and associated fraction solid curve of the EN AC 51100 alloy solidified at
a 0.5 �C s-1, b 0.9 �C s-1 and the EN AC 51300 alloy solidified at c 0.5 �C s-1, d 0.9 �C s-1
304 M. Krol et al.
123
form ahead of solidification, which means there are more
nuclei with less potential for growth, and thus effective
grain refinement should be expected [14].
The next characteristic points on the crystallisation
curves were observed at 638.0 and 625.2 �C, respectively.
This event is the a-Al dendrite minimum (undercooling)
temperature (TMINaDEN) (point 2), which defines a situation
where the nucleated dendrites have grown to such a degree
that the liberated latent heat of fusion balances the heat
removed from the test sample. The TMINaDEN as the local
minimum is defined by the point at which the first
derivative crosses the zero line (dT/dt = 0). It can be noted
that increasing cooling rate does not provide significant
changes in TMINaDEN. Point 3 is the point in which produced a
dendrites in liquid melt become coherent (TDCPaDEN). In this
point, the second derivative of the cooling curve intersects
the zero line (Fig. 6). After passing this point (TDCPaDEN), the
melt temperature increases to a steady state growth tem-
perature (TGaDEN) (point 4). The TG
aDEN matches to the
second zero point on the first derivative curve (dT/dt = 0)
following the start of nucleation (dT/dt = 0). After for-
mation of primary aluminium grains, providing that the
concentration of Si is sufficient, the binary eutectic
Al ? Mg2Si is formed in the range of temperatures from
544 to 574 �C (point 5). In fact, in the increasing a cooling
rate, the TE AlþMg2Sið Þ decreased by 3 and 6 �C, respectively.
Points 6 correspond to the b-Al3Mg2 eutectic nucleation
temperature and the b phase eutectic growth. At this point,
the b-Al3Mg2 phase starts to form on grain boundaries that
could be observed at 563.1 �C in an alloy that consists of
3 % Mg and at 436.3 �C in an alloy that has about 5 % Mg.
It could also be seen that increasing cooling rate for
examined aluminium alloys, eutectic nucleation tempera-
ture TE AlþAl3Mg2ð Þ slightly decreased approx. 2 �C. Last
point (no. 7) observed on the crystallisation curve is solidus
temperature that was observed at 520.1 �C for EN AC
51100 alloy and at 416.7 �C for EN AC 51300 alloy. In
fact, in the increasing cooling rate, the solidification range
increased approx. 9 �C for both analysed alloys. This
shows that the widening of the crystallisation range can
give advantages to semi-solid metal casting (SSM) such as
thixocasting, rheocasting or thixomolding; however, it does
increase the occurrence of casting defects such as macro-
segregation, hot tearing and shrinkage and gas porosity in
Table 4 Influence of cooling rate and magnesium content on tem-
perature at dendrite coherency point and fraction solid of investigated
magnesium alloys
Cooling rate/�C s-1 0.5 0.9
DCP/�C Fraction solid/% DCP/�C FS/%
EN AC 51100 638.47 2.8 637.71 4.1
EN AC 51300 626.51 3.7 623.81 8.4
Table 5 Results of hardness measurement of EN AC 51100 alloy in as-cast state and after heat treatment
Temperature/�C Solution treatment
time/h
Hardness (as
cast)/HRF
Hardness
(solution treated)/HRF
Hardness (ageing 160 �C)/HRF
4 h 8 h 12 h
580 8 47 44.6 64.5 64.8 66.8
12 46.0 58.1 65.3 64.8
560 8 44.5 48.1 58.4 53.4
12 45.0 47.7 58.3 61.3
540 8 47.3 46.5 50.6 48.3
12 46.2 46.3 55.4 55.1
Table 6 Results of hardness measurement of EN AC 51300 alloy in as-cast state and after heat treatment
Temperature/�C Solution treatment
time/h
Hardness (as
cast)/HRF
Hardness
(solution treated)/HRF
Hardness (ageing 160 �C)/HRF
4 h 8 h 12 h
560 8 66 67.8 70.7 69.7 71.6
12 65.9 73.4 75.4 74.5
540 8 68.7 66.6 66.4 66.7
12 67.7 68.0 71.0 71.2
520 8 66.4 70.0 67.6 69.3
12 68.4 66.1 67.1 68.8
Structure and properties of aluminium–magnesium casting alloys after heat treatment 305
123
conventional casting. Local deviations from equilibrium
result in micro-segregation and eventually in the shift of
local equilibrium to the concentrations where new phases
are formed.
The second derivative of the cooling curve was used to
determine the dendrite coherency point (Fig. 6). The first
minimum value of the second derivative of the cooling rate
is defined as the DCP, which indicates the transition from
liquid to a liquid–solid state. After passing this point,
dendrites continued to grow and become thicker with fur-
ther melt cooling.
The changes of the temperature at dendrite coherency
point and the solid fraction corresponding to the dendrite
coherency (fDCP) as a function of Mg content and cooling
rate are presented in Table 4. It can be seen that fraction
solid of primary Al dendrite coherency point increased
from 2.8 to 3.7 % with increasing Mg content and
increased for EN AC 51100 from 2.8 to 4.1 % and
increased for EN AC 51300 from 3.7 to 8.4 % with
increasing cooling rate. For both analysed series of alu-
minium alloys can be observed that the increasing cooling
rate caused decreases in the temperature at dendrite
coherency point from 638.47 to 637.71 �C for EN AC
51100, and from 626.51 to 623.81 �C for EN AC 51300. In
other words, the coherency parameters exhibit that grain
refinement reduces the dendrite coherency temperature and
can delay dendrite coherency. The DCP has a direct cor-
relation with fluidity; if DCP is delayed, greater fluidity
will be achieved. In summary, the investigation of DCP
formation by way of TDA shows that the dendrite becomes
coherent later with a higher cooling rate and with higher
concentration of Mg.
Mechanical properties
Based on the hardness measurement results of EN AC
51100 and EN AC 51300 alloy that are given in Tables 5
and 6, it was found that increased magnesium content
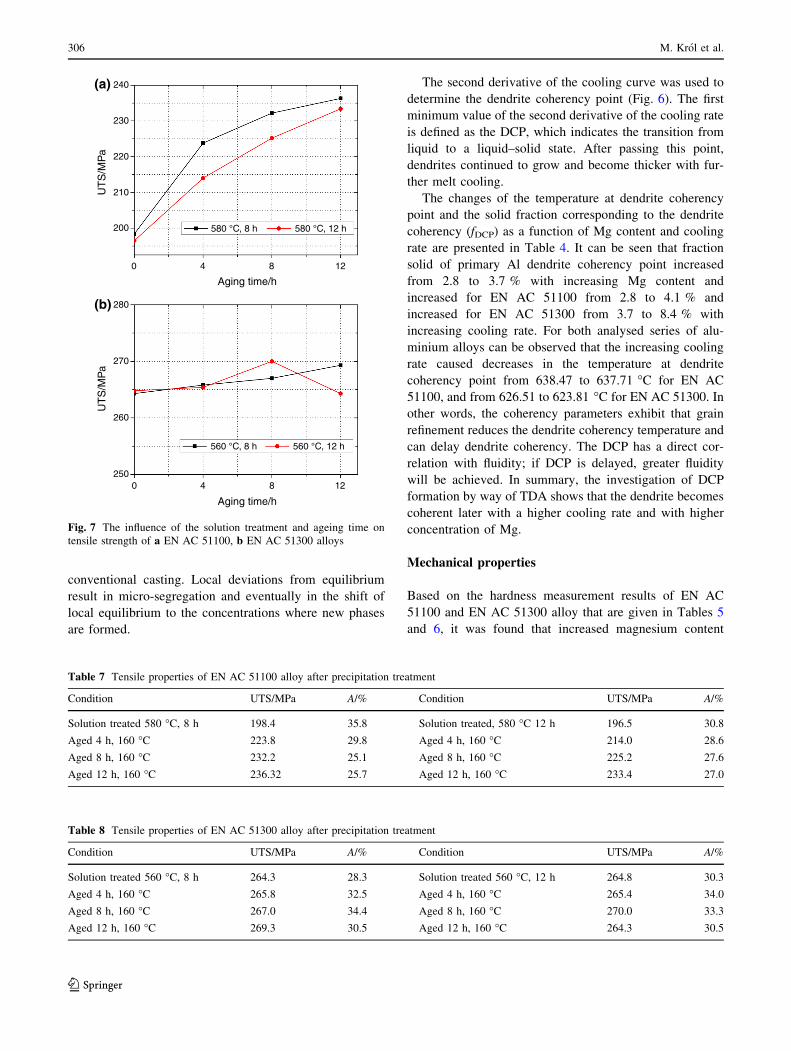
Table 7 Tensile properties of EN AC 51100 alloy after precipitation treatment
Condition UTS/MPa A/% Condition UTS/MPa A/%
Solution treated 580 �C, 8 h 198.4 35.8 Solution treated, 580 �C 12 h 196.5 30.8
Aged 4 h, 160 �C 223.8 29.8 Aged 4 h, 160 �C 214.0 28.6
Aged 8 h, 160 �C 232.2 25.1 Aged 8 h, 160 �C 225.2 27.6
Aged 12 h, 160 �C 236.32 25.7 Aged 12 h, 160 �C 233.4 27.0
0
200 580 °C, 8 h 580 °C, 12 h
560 °C, 8 h 560 °C, 12 h
250
260
270
280
UT
S/M
Pa
UT
S/M
Pa
210
220
230
240
4 8
Aging time/h
12
0 4 8
Aging time/h
12
(a)
(b)
Fig. 7 The influence of the solution treatment and ageing time on
tensile strength of a EN AC 51100, b EN AC 51300 alloys
Table 8 Tensile properties of EN AC 51300 alloy after precipitation treatment
Condition UTS/MPa A/% Condition UTS/MPa A/%
Solution treated 560 �C, 8 h 264.3 28.3 Solution treated 560 �C, 12 h 264.8 30.3
Aged 4 h, 160 �C 265.8 32.5 Aged 4 h, 160 �C 265.4 34.0
Aged 8 h, 160 �C 267.0 34.4 Aged 8 h, 160 �C 270.0 33.3
Aged 12 h, 160 �C 269.3 30.5 Aged 12 h, 160 �C 264.3 30.5
306 M. Krol et al.
123
influences on the hardness of the alloys which is a result of
solid solution hardening. To found most favourable con-
ditions of heat treatment process of investigated alloys, a
series of experiments were conducted.
The analysis of data obtained from hardness measure-
ment allows judging that EN AC 51100 alloy has highest
ageing potential. As it could be observed after solutionising
from temperature 580 �C, there is a significant increase in
hardness even after 4 h of artificial ageing. Further quench
ageing results in a subsequent small increase in hardness,
and after 12 h of artificial ageing the material exhibits the
highest hardness. Lower temperatures of solid solution
treatment do not allow obtaining such a significant increase
in hardness, but it can be seen that after quenching from
temperature 560 �C and ageing through 12 h it is possible
to get similar results as earlier. During precipitation treat-
ment of EN AC 51300 alloy, an only small increase in
hardness was observed. It could be caused by too short
solution treatment time that did not allow the full solution
of Mg in a matrix of the alloy and subsequent precipitation
from solid solution when the alloy was artificially aged. As
it is presented in Table 6, solution treatment from tem-
perature 560 �C and subsequent ageing for 12 h at 160 �Ccause the highest increase in hardness about 14 % in
comparison with as-cast state. Quenching from lower
temperature results in obtaining considerably lower hard-
ness independent of ageing time that affords conclusion
that those heat treatments are not economical because they
do not permit to achieving a significant increase in material
properties.
To characterise ductility and tensile strength of inves-
tigated aluminium alloys after heat treatment, static tensile
tests were carried out. Hardness measurements that were
taken earlier were used to choose the most beneficial type
of heat treatment. For the EN AC 51100 alloy, the tensile
tests were carried on samples that were quenched at 580 �Cand, respectively, for EN AC 51300 alloy the temperature
of quenching was at 560 �C. Based on the results obtained
from static tensile tests of examined alloys, an increase in
tensile strength was observed (Table 7). The influence of a
solution treatment and ageing time is shown in Fig. 7. As it
can be seen the artificial ageing characteristics demon-
strating the changes of tensile strength are comparative
with hardness measurements obtained earlier. As it was
expected the highest tensile strength exhibits alloy that
contains 5 % magnesium; however, highest ageing poten-
tial presents EN AC 51100 alloy. The increase in tensile
strength after 12 h of artificial ageing is approximately
20 % in comparison with solution-treated specimen. It is
also demonstrated that during artificial ageing there is an
only small decrease in the ductility of the material. Table 8
also shows that during artificial ageing of EN AC 51300
alloy there are no significant changes in tensile strength. It
could be compared to results obtained from hardness
measurements where was observed only a small increase in
hardness of this alloy. It could be also seen that artificial
ageing of EN AC 51300 alloy does not provide significant
changes in the ductility of the material. It could also be
seen that EN AC 51300 alloy after precipitation treatment
exhibits higher ductility than after solution treatment.
Conclusions
The major conclusions drawn from the study are as
follows:
1. Structure examinations of presented aluminium alloys
confirm the presence of phases that influence on the
hardness of the material. It was also observed that
many of precipitated phases during precipitation
treatment are considerably lower in comparison with
as-cast state that certifies that a lot of Mg stays in solid
solution and during artificial ageing precipitated uni-
formly in the core material.
2. The higher cooling rate causes a decrease of solidus
temperature in investigated alloys, resulting in an
extension of the crystallisation range approx. 9 �C for
both analysed alloys.
3. A solid fraction at the dendrite coherency point
determined from the second derivative of cooling
curve increases with increasing Mg content and
cooling rate.
4. Despite micro-additions presence, it was not seen any
changes in crystallisation curve that certify forming
phases that contain Si or Cu which is caused by too
little mass fraction of these additions in investigated
alloys.
5. As a result of conducted heat treatment process with
different parameters of temperature and time and based
on the hardness measurement best types of precipita-
tion treatment were selected to carry out tensile tests. It
has been proven that heat treatment has a significant
effect on the hardness and tensile strength EN AC
51100 alloy, but results in a decrease in ductility of the
material; however, precipitation treatment of EN AC
51300 alloy resulted in only a slight improvement in
mechanical properties that could be caused by too
short time of solution treatment.
6. Based on the investigation results presented above,
optimum heat treatment conditions were selected. For
the EN AC 51100 aluminium alloy solution treatment
temperature and time were 580 �C and 8 h with
artificial ageing for 8 h at 160 �C; however, in the
case of the EN AC 51300 solution treatment
Structure and properties of aluminium–magnesium casting alloys after heat treatment 307
123
temperature and time were 560 �C and 12 h with
ageing treatment for 8 h at 160 �C.
7. The thermal analysis of the heating cycle permits the
development of an optimum two- and/or multi-step
solution treatment capable of improving the dissolution
of the soluble phases and which results in achieving
significantly higher mechanical characteristics in
slowly solidified section of the automotive compo-
nents.
Acknowledgements This publication was financed by the Ministry
of Science and Higher Education of Poland as the statutory financial
grant of the Faculty of Mechanical Engineering SUT.
Open Access This article is distributed under the terms of the
Creative Commons Attribution 4.0 International License (http://crea
tivecommons.org/licenses/by/4.0/), which permits unrestricted use,
distribution, and reproduction in any medium, provided you give
appropriate credit to the original author(s) and the source, provide a
link to the Creative Commons license, and indicate if changes were
made.
References
1. Canales AA, Carrera E, Talamantes-Silva J, Valtierra S, Colas R.
Mechanical properties in as-cast and heat treated Al–Si–Cu
alloys. Int J Microstruct Mater Prop. 2012;7(4):281–300.
2. Jayalakshmi S, Dezhi Q, Sankaranarayanan S, Gupta M.
Microstructure and mechanical properties of Mg–Al alloys with
in situ Al4C3 phase synthesised by CO2 incorporation during
liquid state processing. Int J Microstruct Mater Prop. 2013;8(4/
5):283–98.
3. Kaygisiz Y, Marasli N. Microstructural, mechanical and electri-
cal characterization of directionally solidified Al–Si–Mg eutectic
alloy. J Alloys Compd. 2014;618:197–203.
4. Shu-qing Y, Xing-fu L. The effect of Si morphology on the
microstructure and wear property of ZA48 alloy. Int J Microstruct
Mater Prop. 2014;9(1):88–96.
5. Luna I, Molinar H, Roman M, Bocardo J, Trejo M. Improvement
of the tensile properties of an Al–Si–Cu–Mg aluminium industrial
alloy by using multi stage solution heat treatments. Mater Sci Eng
A Struct. 2013;561:1–6.
6. Shokuhfar A, Nejadseyfi O. A comparison of the effects of severe
plastic deformation and heat treatment on the tensile properties
and impact toughness of aluminium alloy 6061. Mater Sci Eng A
Struct. 2014;594:140–8.
7. Krupinski M, Labisz K, Tanski T, Krupinska B, Krol M, Polok-
Rubiniec M. Influence of Mg addition on crystallisation kinetics
and structure of the Zn–Al–Cu alloy. Arch Metall Mater.
2016;61(2):785–90. doi:10.1515/amm-2016-0132.
8. Krol M, Tanski T, Matula G, Snopinski P, Tomiczek AE.
Analysis of crystallisation process of cast magnesium alloys
based on thermal derivative analysis. Arch Metall Mater.
2015;60(4):2993–3000. doi:10.1515/amm-2015-0478.
9. Xia S, Ma M, Zhang J, Wang W, Liu W. Effect of heating rate on
the microstructure, texture and tensile properties of continuous
cast AA 5083 aluminium alloy. Mater Sci Eng A. 2014;609:
168–76.
10. Krupinska B, Krupinski M, Labisz K, Rdzawski Z, Tanski T.
Additives and thermal treatment influence on microstructure of
nonferrous alloys. J Therm Anal Calorim. 2015;3:1573–83.
doi:10.1007/s10973-015-4497-0.
11. Tanski T, Pakieła W, Janicki D, Tomiczek B, Krol M. Properties
of the aluminium alloy EN AC 51100 after the laser surface
treatment. Arch Metall Mater. 2016;61(1):199–204. doi:10.1515/
amm-2016-0035.
12. Krol M, Tanski T, Sitek W. Thermal analysis and microstructural
characterization of Mg–Al–Zn system alloys. In: IOP conference
series: materials science and engineering, vol. 95; 2015.
p. 012006. doi:10.1088/1757-899X/95/1/012006.
13. Method and Apparatus for Universal Metallurgical Simulation
and Analysis—United States Patent, Patent No.: US 7,354,491
B2, Date of Patent: 8 April 2008.
14. Farahany S, Idris MH, Ourdjini A, Faris F, Ghandvar H. Evalu-
ation of the effect of grain refiners on the solidification charac-
teristics of an Sr-modified ADC12 die-casting alloy by cooling
curve thermal analysis. J Therm Anal Calorim. 2015;119(3):
1593–601.
15. Hamana D, Baziz L, Bouchear M. Kinetics and mechanism of
formation and transformation of metastable b0-phase in Al–Mg
alloys. Mater Chem Phys. 2004;84(1):112–9.
16. Starink MJ, Zahra AM. b0 and b precipitation in an Al–Mg alloy
studied by DSC and TEM. Acta Mater. 1998;46(10):3381–97.
17. Venkatachalam P, Ravisankar B, Kumaran S. Microstructure and
mechanical properties of 2014 Al alloy processed by equal
channel angular pressing (ECAP). Int J Microstruct Mater Prop.
2010;5(1):88–100.
18. Zagar S, Grum J. Residual stress, fatigue and electrical conduc-
tivity analysis after shot peening of aluminium alloy
AlZn5.5MgCu. Int J Microstruct Mater Prop. 2013;8(6):447–61.
19. Belov NA, Eskin DG, Aksenov AA. Multicomponent phase
diagrams: applications for commercial aluminum alloys. Ams-
terdam: Elsevier Ltd.; 2005.
20. Eskin DG. Physical metallurgy of direct chill casting of alu-
minum alloys. London: Taylor&Francis Group; 2008.
21. Snopinski P, Tanski T, Labisz K, Rusz S, Jonsta P, Krol M.
Wrought aluminium–magnesium alloys subjected to SPD pro-
cessing. Int J Mater Res. 2016;107:1–9. doi:10.3139/146.111383.
308 M. Krol et al.
123
Recommended


![Investigation on mechanical properties of aluminium 7075 ... · the elongation. Venkat & Subramanian [13] investigated the mechanical properties and wear behaviour of fly ash and](https://img.pdfslide.us/doc/110x75/5f09f4997e708231d4294faf/investigation-on-mechanical-properties-of-aluminium-7075-the-elongation-venkat.jpg)