1
Strategy for Success Innovation, Integration and Improvement
Paul Huck Senior Vice President and Chief Financial Officer
Nomura Global Chemical Industry Leaders Conference
March 2012
2
Forward Looking Statement This presentation contains "forward-looking statements" within the safe harbor provisions of the Private Securities Litigation Reform Act of 1995, including statements about earnings guidance, projections, targets and business outlook. These forward-looking statements are based on management's reasonable expectations and assumptions as of the date this release. Actual performance and financial results may differ materially from projections and estimates expressed in the forward-looking statements because of many factors not anticipated by management, including, without limitation, slowing of global economic recovery; renewed deterioration in global or regional economic and business conditions; weakening demand for the Company's products; future financial and operating performance of major customers and industries served by the Company; unanticipated contract terminations or customer cancellations or postponement of projects and sales; the success of commercial negotiations; asset impairments due to economic conditions or specific product or customer events; the impact of competitive products and pricing; interruption in ordinary sources of supply of raw materials; the ability to recover unanticipated increased energy and raw material costs from customers; costs and outcomes of litigation or regulatory activities; successful development and market acceptance of new products and applications, the ability to attract, hire and retain qualified personnel in all regions of the world where the Company operates; the success of productivity programs; the success and impact of restructuring and cost reduction initiatives; achieving anticipated acquisition synergies; the timing, impact, and other uncertainties of future acquisitions or divestitures; significant fluctuations in interest rates and foreign currencies from that currently anticipated; the continued availability of capital funding sources in all of the Company's foreign operations; the impact of environmental, healthcare, tax or other legislation and regulations in jurisdictions in which the Company and its affiliates operate; the impact of new or changed financial accounting guidance; the impact on the effective tax rate of changes in the mix of earnings among our U.S. and international operations; and other risk factors described in the Company's Form 10K for its fiscal year ended September 30, 2011. The Company disclaims any obligation or undertaking to disseminate any updates or revisions to any forward-looking statements contained in this document to reflect any change in the Company's assumptions, beliefs or expectations or any change in events, conditions, or circumstances upon which any such forward-looking statements are based.
3
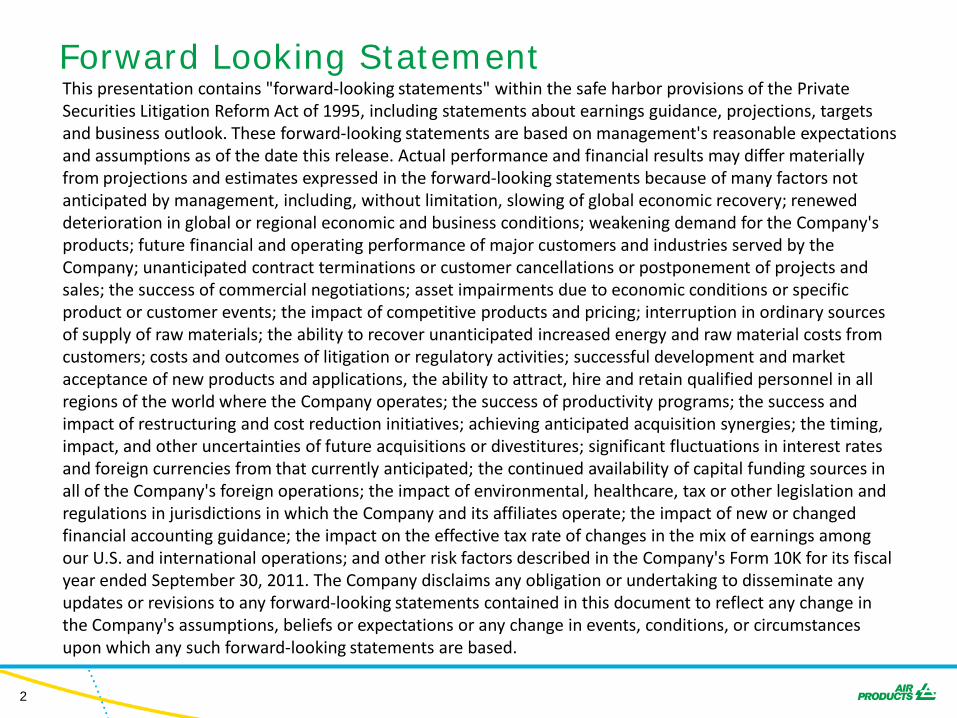
Air Products At a Glance
• $10B in revenues across diverse markets and geographies
• Positioned for continued long-term value creation
Manufacturing 13%
Food 4% Healthcare
7%
Metals 10%
Chemicals 19%
Electronics 16%
Energy 22%
Other 9%
Europe 31%
Asia 24%
Canada/L.A. 7%
U.S. 38%
4
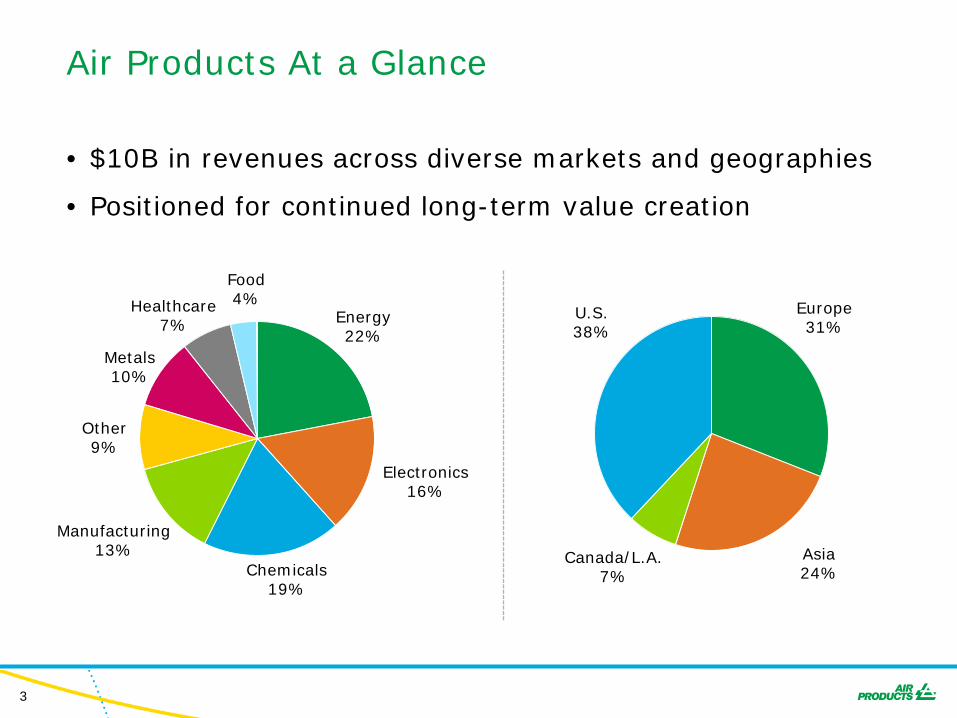
Package Gases & Specialty Materials
Air Products Supply Modes Stability and Profitable Growth
15-20 year Contracts Limited Volume Risk Energy Pass through
Onsite/Pipeline
Equipment & Services
Sale of Equipment PO Based
Liquid/Bulk
3-5 year Contracts Cost Recovery
Short-Term Contracts Differentiated Positions
27%
11%
21%
41%
Onsite/Pipeline
Packaged Gases & Specialty Material
Equipment & Services
Liquid/Bulk
FY11
5
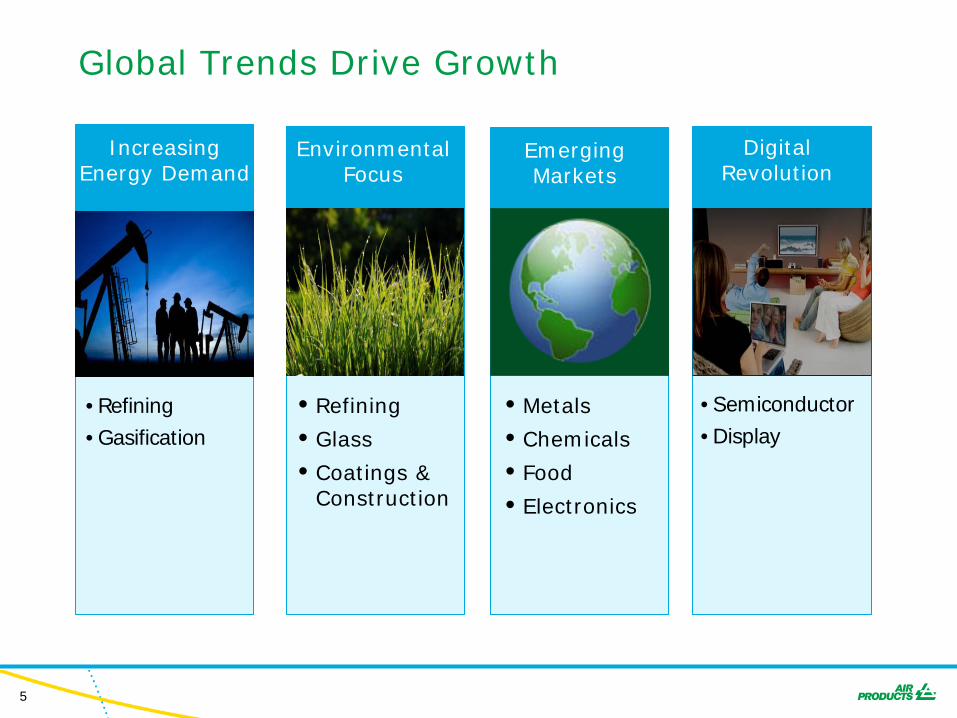
Global Trends Drive Growth
Digital Revolution
• Semiconductor • Display
Increasing Energy Demand
• Refining • Gasification
• Refining
• Glass
• Coatings & Construction
Environmental Focus
Emerging Markets
• Metals
• Chemicals
• Food
• Electronics
6
0
5
10
15
20
25
30
35
Sales Growth
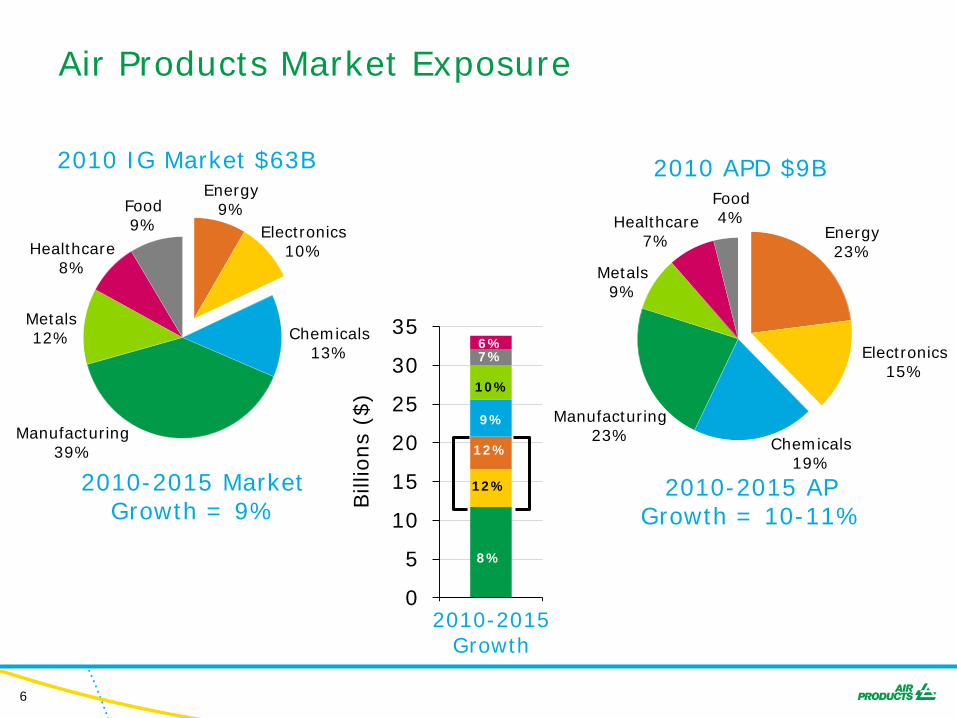
Air Products Market Exposure
2010-2015 AP Growth = 10-11%
2010 APD $9B
Manufacturing 23%
Food 4% Healthcare
7%
Metals 9%
Chemicals 19%
2010-2015 Market Growth = 9%
Food 9%
Healthcare 8%
Metals 12%
Manufacturing 39%
Chemicals 13%
2010 IG Market $63B
Electronics 10%
Energy 9%
Electronics 15%
Energy 23%
10%
6%
8%
12%
12%
9%
7% Bill
ions
($)
2010-2015 Growth
7
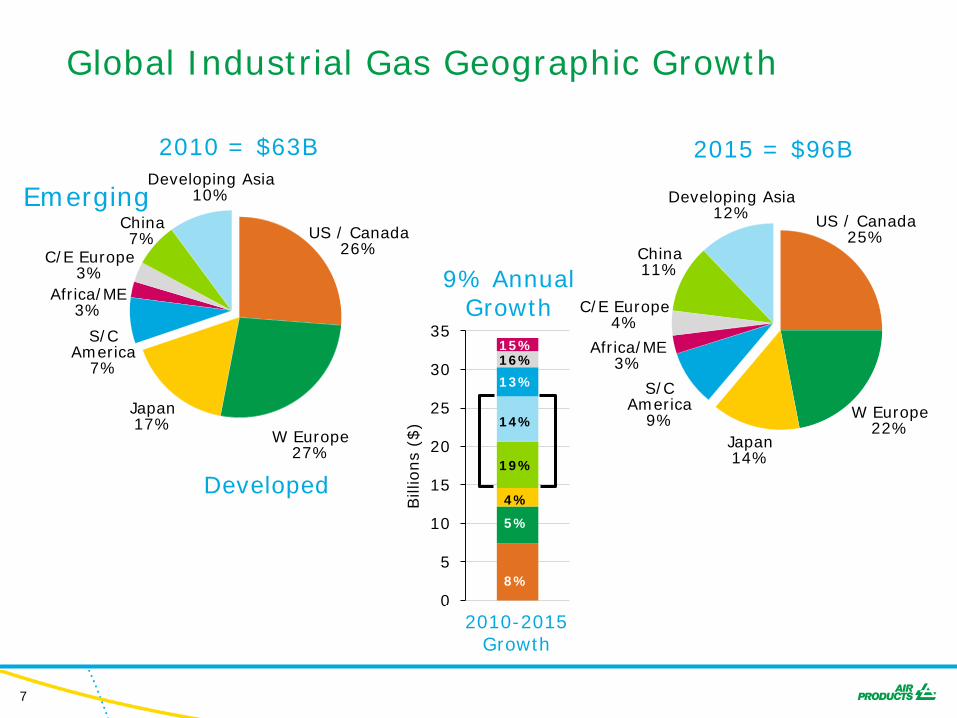
Global Industrial Gas Geographic Growth
0
5
10
15
20
25
30
35
16%
5%
14%
19%
13%
15%
8%
4% Bill
ions
($)
9% Annual Growth
2015 = $96B
W Europe 22%
US / Canada 25%
Japan 14%
China 11%
Developing Asia 12%
C/E Europe 4%
Africa/ME 3%
S/C America
9%
Developed
2010 = $63B
W Europe 27%
US / Canada 26%
S/C America
7%
China 7%
Developing Asia 10%
C/E Europe 3%
Africa/ME 3%
Japan 17%
Emerging
Sales Growth 2010-2015 Growth
8
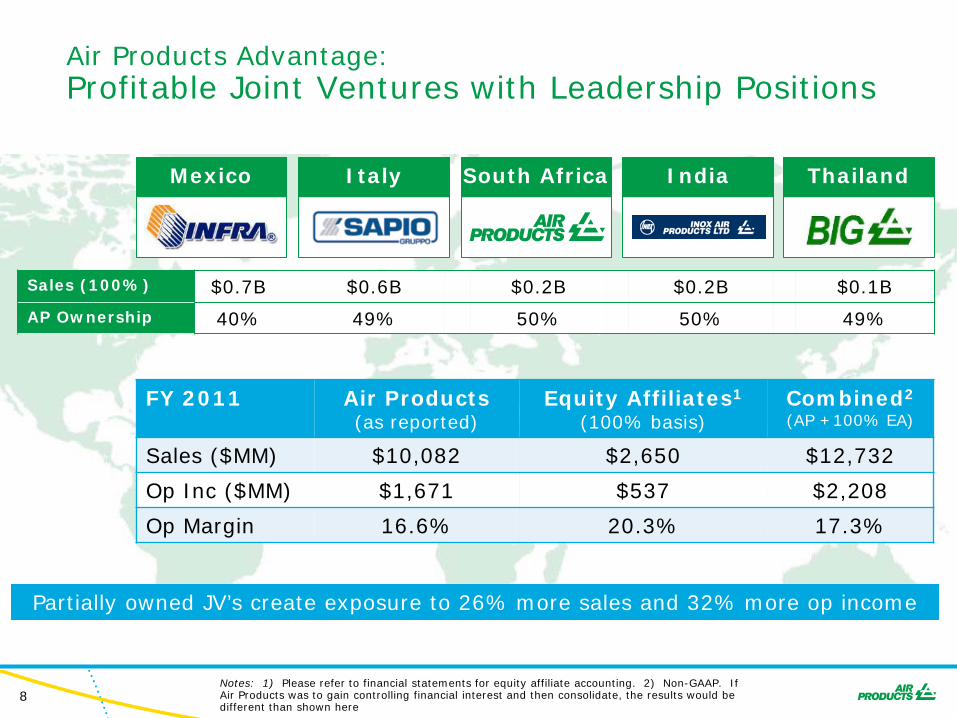
Mexico Italy South Africa India Thailand
FY 2011 Air Products (as reported)
Equity Affiliates1 (100% basis)
Combined2
(AP +100% EA)
Sales ($MM) $10,082 $2,650 $12,732
Op Inc ($MM) $1,671 $537 $2,208
Op Margin 16.6% 20.3% 17.3%
Air Products Advantage: Profitable Joint Ventures with Leadership Positions
Notes: 1) Please refer to financial statements for equity affiliate accounting. 2) Non-GAAP. If Air Products was to gain controlling financial interest and then consolidate, the results would be different than shown here
Partially owned JV’s create exposure to 26% more sales and 32% more op income
Sales (100%) $0.7B $0.6B $0.2B $0.2B $0.1B
AP Ownership 40% 49% 50% 50% 49%
9
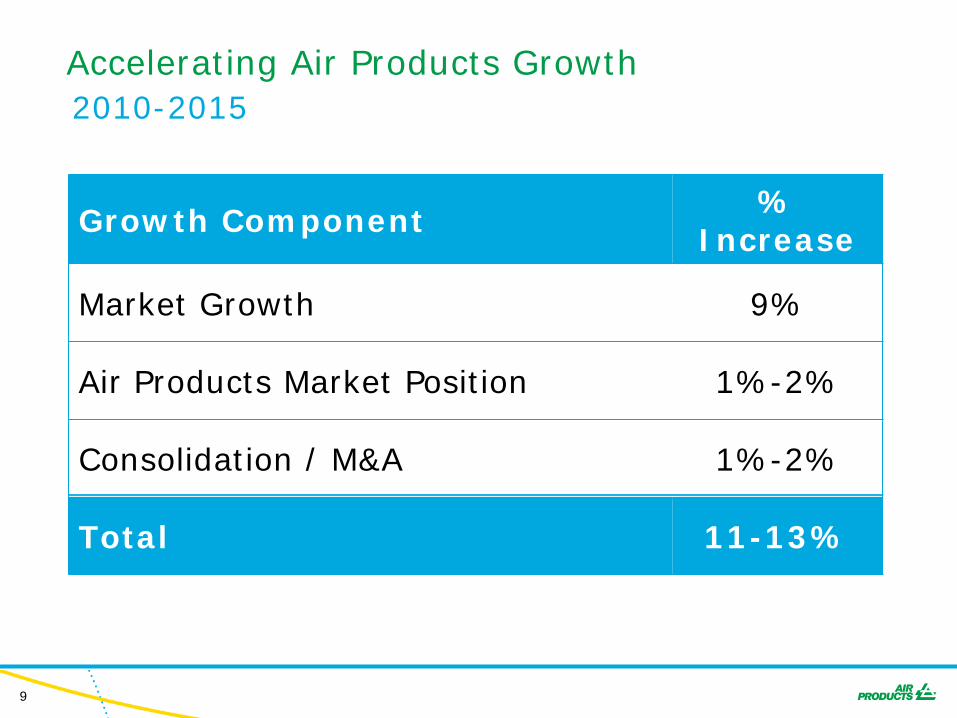
Accelerating Air Products Growth
Growth Component % Increase
Market Growth 9%
Air Products Market Position 1%-2%
Consolidation / M&A 1%-2%
Total 11-13%
2010-2015
10
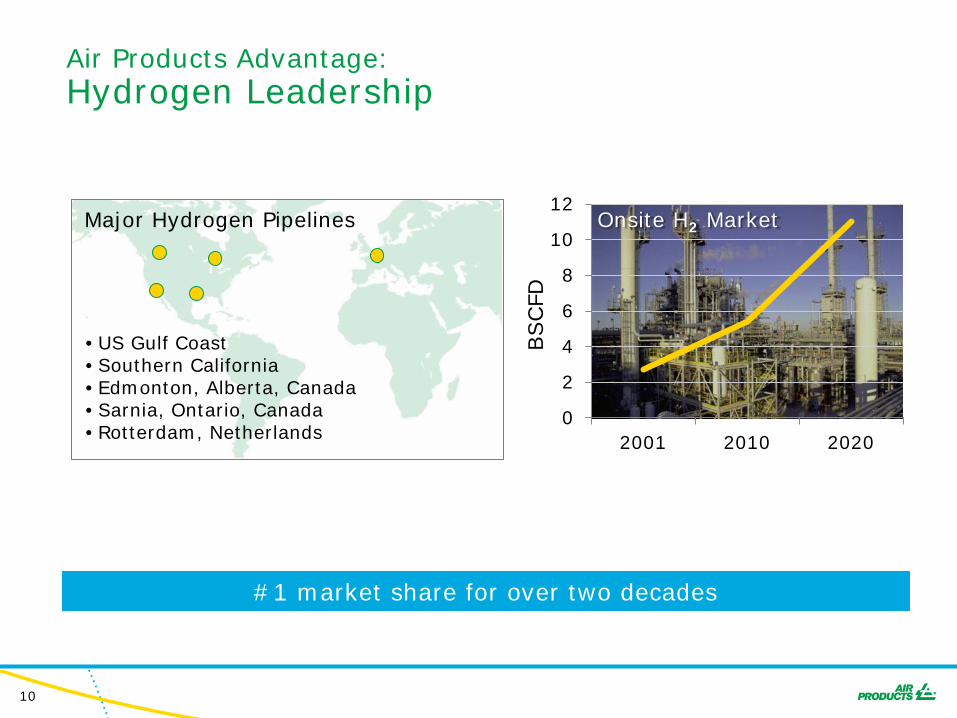
Air Products Advantage: Hydrogen Leadership
#1 market share for over two decades
0
2
4
6
8
10
12
2001 2010 2020
BSCFD
Onsite H2 Market
• US Gulf Coast • Southern California • Edmonton, Alberta, Canada • Sarnia, Ontario, Canada • Rotterdam, Netherlands
Major Hydrogen Pipelines
11
0
2
4
6
8
10
12
NAFTA LASA Europe Middle East
Asia
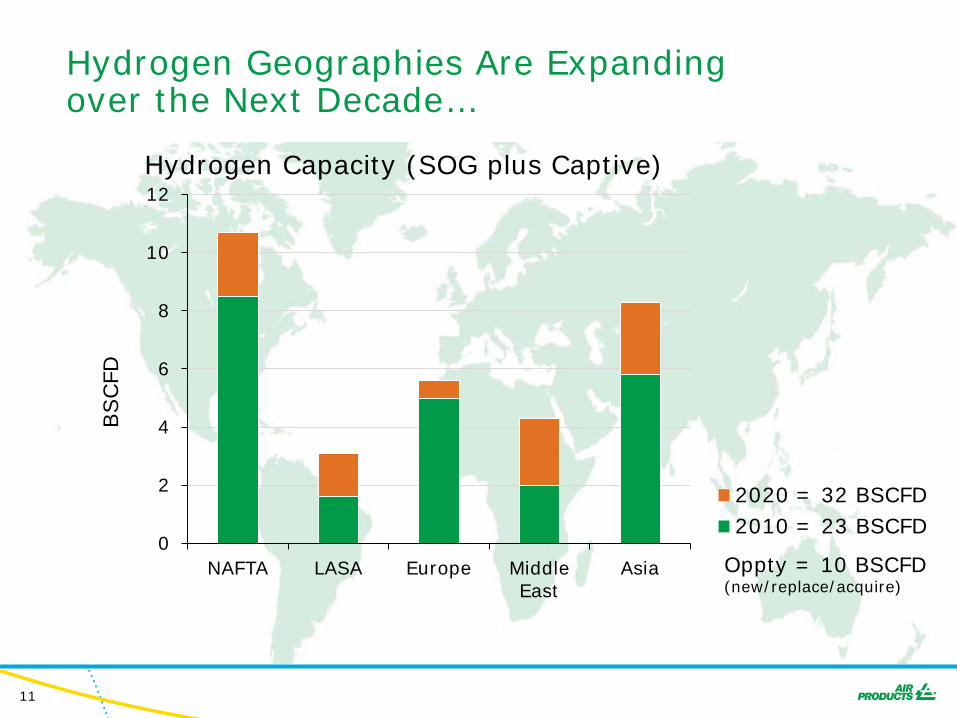
Hydrogen Geographies Are Expanding over the Next Decade…
Hydrogen Capacity (SOG plus Captive)
BSCFD
2010 = 23 BSCFD 2020 = 32 BSCFD
Oppty = 10 BSCFD (new/replace/acquire)
12
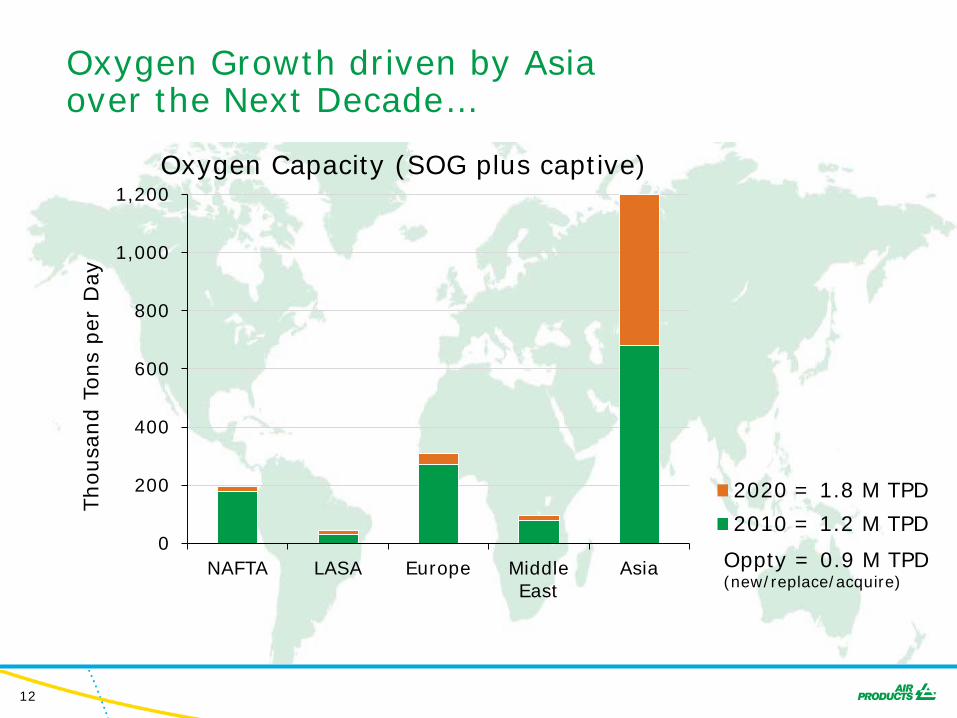
Oxygen Growth driven by Asia over the Next Decade…
Oxygen Capacity (SOG plus captive)
0
200
400
600
800
1,000
1,200
NAFTA LASA Europe Middle East
Asia
Thousa
nd T
ons
per
Day
2010 = 1.2 M TPD 2020 = 1.8 M TPD
Oppty = 0.9 M TPD (new/replace/acquire)
13
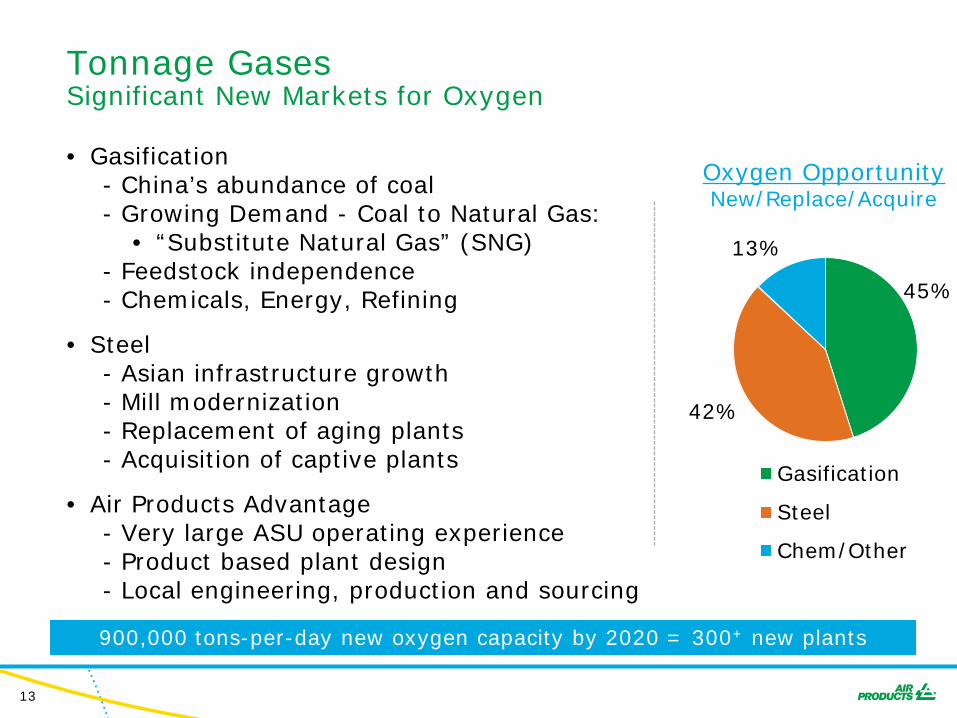
Tonnage Gases Significant New Markets for Oxygen • Gasification
- China’s abundance of coal - Growing Demand - Coal to Natural Gas:
• “Substitute Natural Gas” (SNG) - Feedstock independence - Chemicals, Energy, Refining
• Steel - Asian infrastructure growth - Mill modernization - Replacement of aging plants - Acquisition of captive plants
• Air Products Advantage - Very large ASU operating experience - Product based plant design - Local engineering, production and sourcing
45%
42%
13%
Gasification
Steel
Chem/Other
Oxygen Opportunity New/Replace/Acquire
900,000 tons-per-day new oxygen capacity by 2020 = 300+ new plants
14
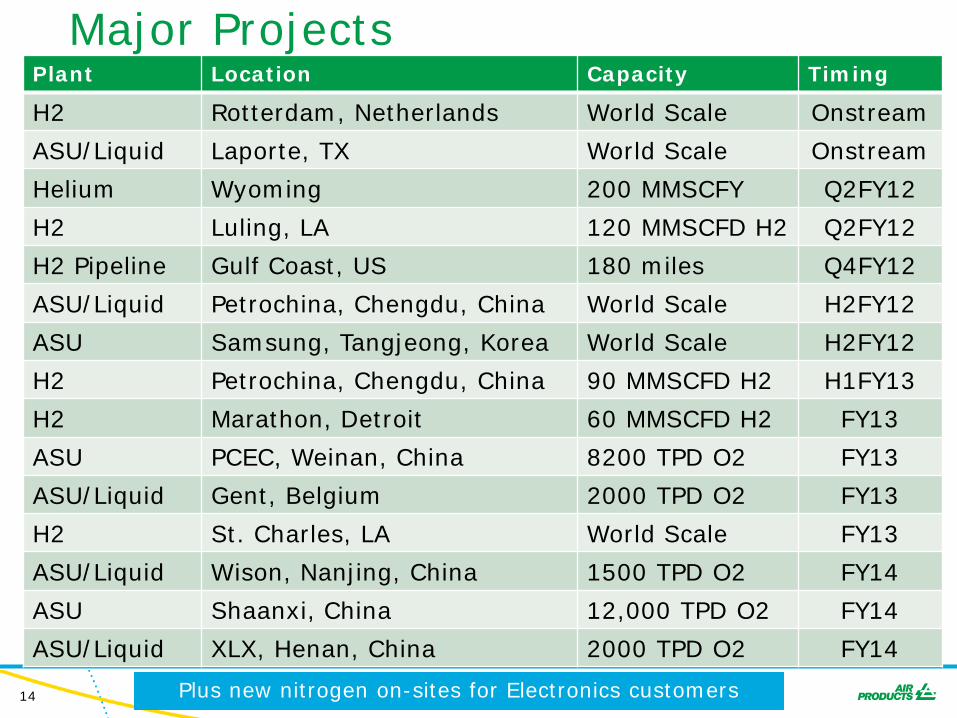
Plant Location Capacity Timing
H2 Rotterdam, Netherlands World Scale Onstream
ASU/Liquid Laporte, TX World Scale Onstream
Helium Wyoming 200 MMSCFY Q2FY12
H2 Luling, LA 120 MMSCFD H2 Q2FY12
H2 Pipeline Gulf Coast, US 180 miles Q4FY12
ASU/Liquid Petrochina, Chengdu, China World Scale H2FY12
ASU Samsung, Tangjeong, Korea World Scale H2FY12
H2 Petrochina, Chengdu, China 90 MMSCFD H2 H1FY13
H2 Marathon, Detroit 60 MMSCFD H2 FY13
ASU PCEC, Weinan, China 8200 TPD O2 FY13
ASU/Liquid Gent, Belgium 2000 TPD O2 FY13
H2 St. Charles, LA World Scale FY13
ASU/Liquid Wison, Nanjing, China 1500 TPD O2 FY14
ASU Shaanxi, China 12,000 TPD O2 FY14
ASU/Liquid XLX, Henan, China 2000 TPD O2 FY14
Major Projects
Plus new nitrogen on-sites for Electronics customers
15
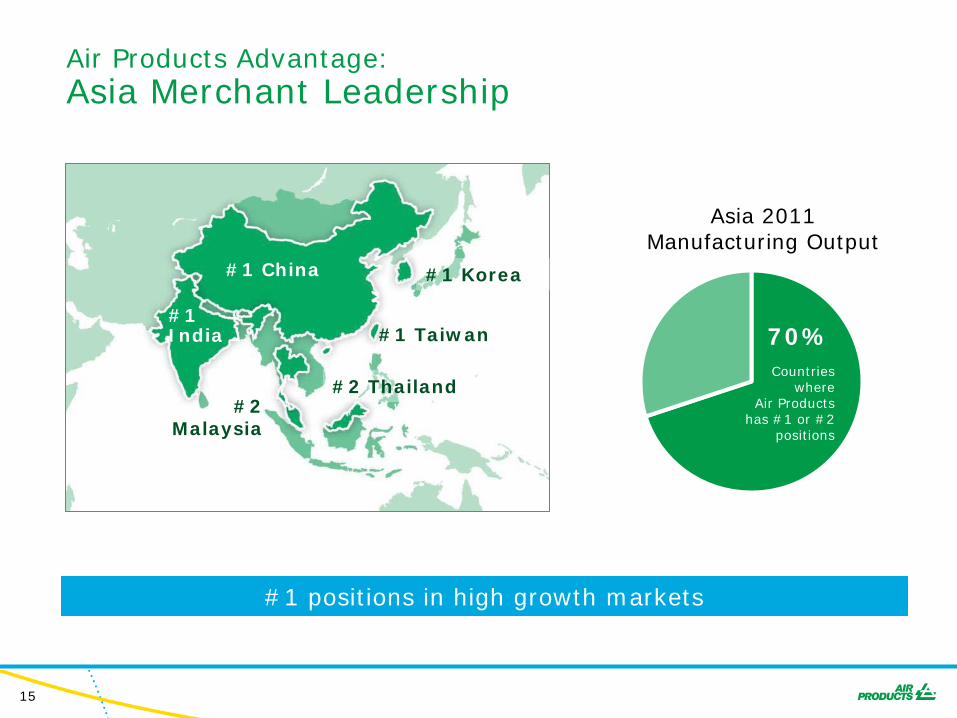
Air Products Advantage: Asia Merchant Leadership
Asia 2011 Manufacturing Output
Countries where
Air Products has #1 or #2
positions
70%
#1 China
#1 India
#1 Korea
#1 Taiwan
#2 Thailand #2
Malaysia
#1 positions in high growth markets
16
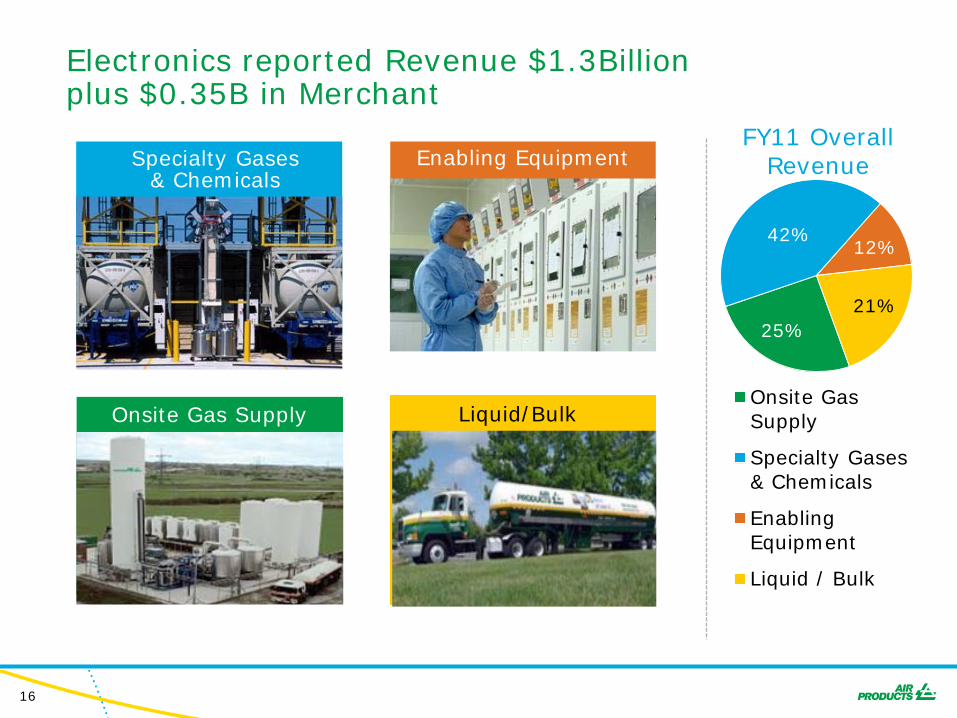
Electronics reported Revenue $1.3Billion plus $0.35B in Merchant
Services
Enabling Equipment
25%
42% 12%
21%
Onsite Gas Supply
Specialty Gases & Chemicals
Enabling Equipment
Liquid / Bulk
Onsite Gas Supply
Specialty Gases & Chemicals
FY11 Overall Revenue
Liquid/Bulk
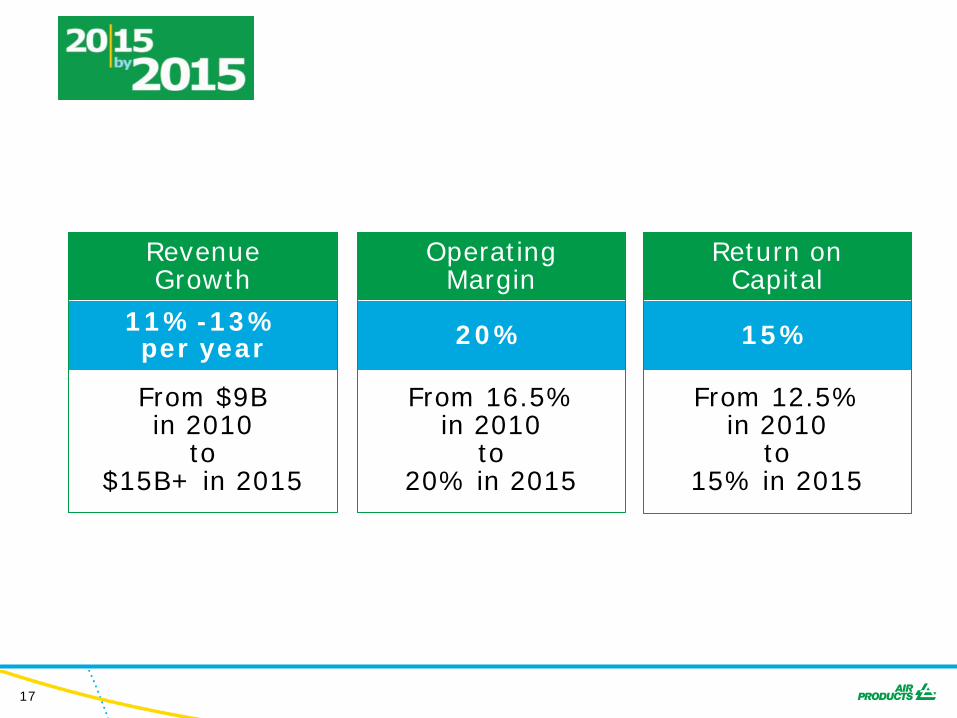
17
Revenue Growth
20%
Return on Capital
15% 11%-13% per year
Operating Margin
From 16.5% in 2010
to 20% in 2015
From 12.5% in 2010
to 15% in 2015
From $9B in 2010
to $15B+ in 2015
18
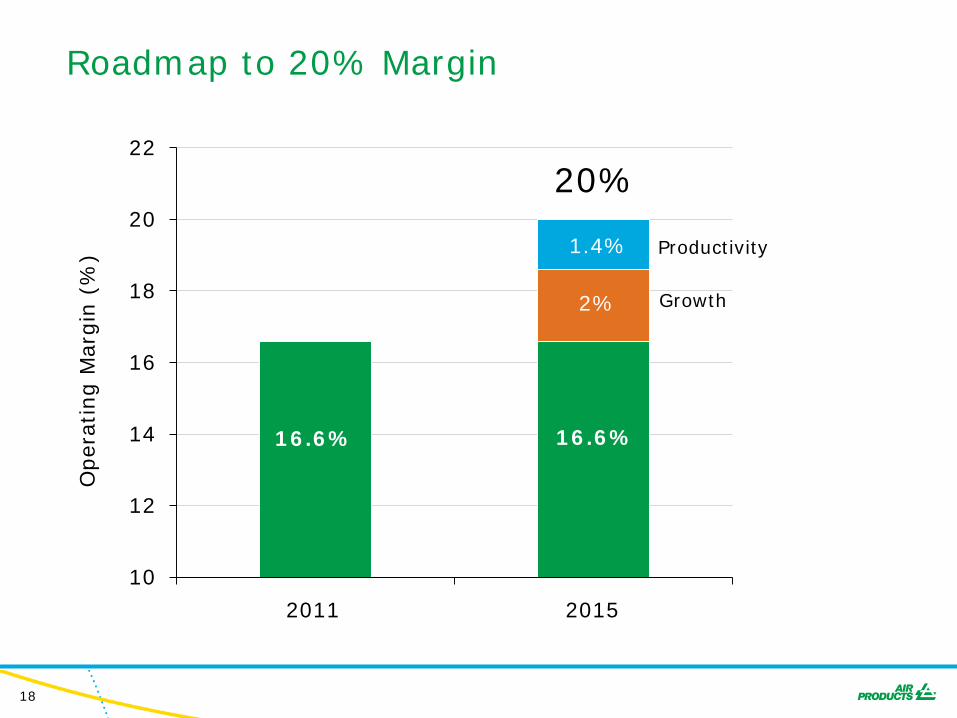
Roadmap to 20% Margin
10
12
14
16
18
20
22
20%
2011 2015
2% Growth
Oper
atin
g M
argin
(%
) 1.4% Productivity
16.6% 16.6%
19
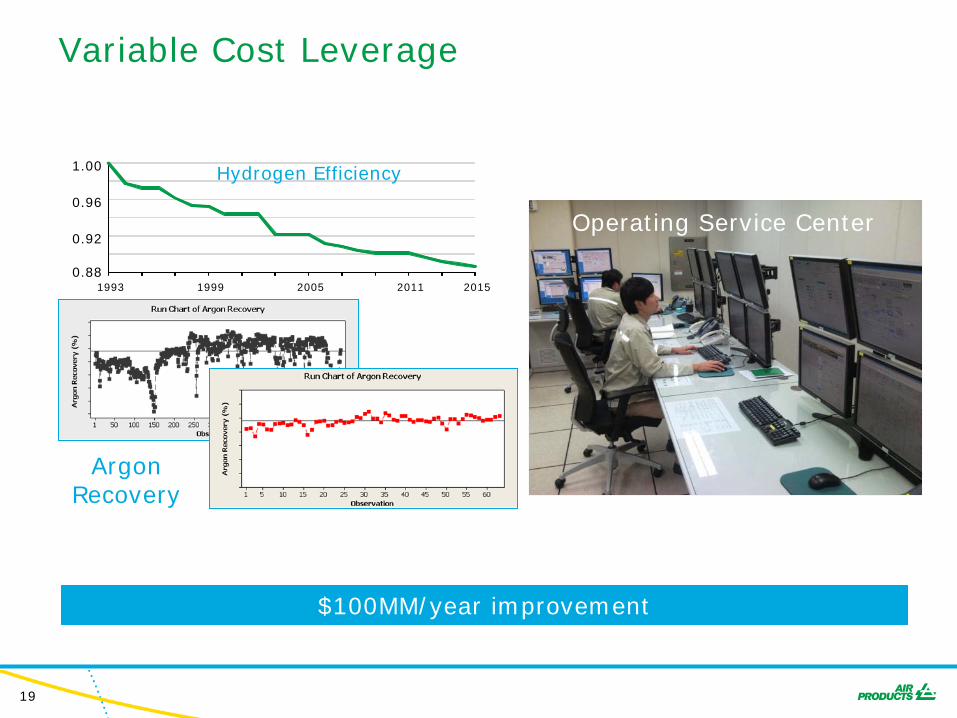
Variable Cost Leverage
$100MM/year improvement
Operating Service Center
Argon Recovery
0.88
0.92
0.96
1.00
2005 2011 1993 1999 2015
Hydrogen Efficiency
20
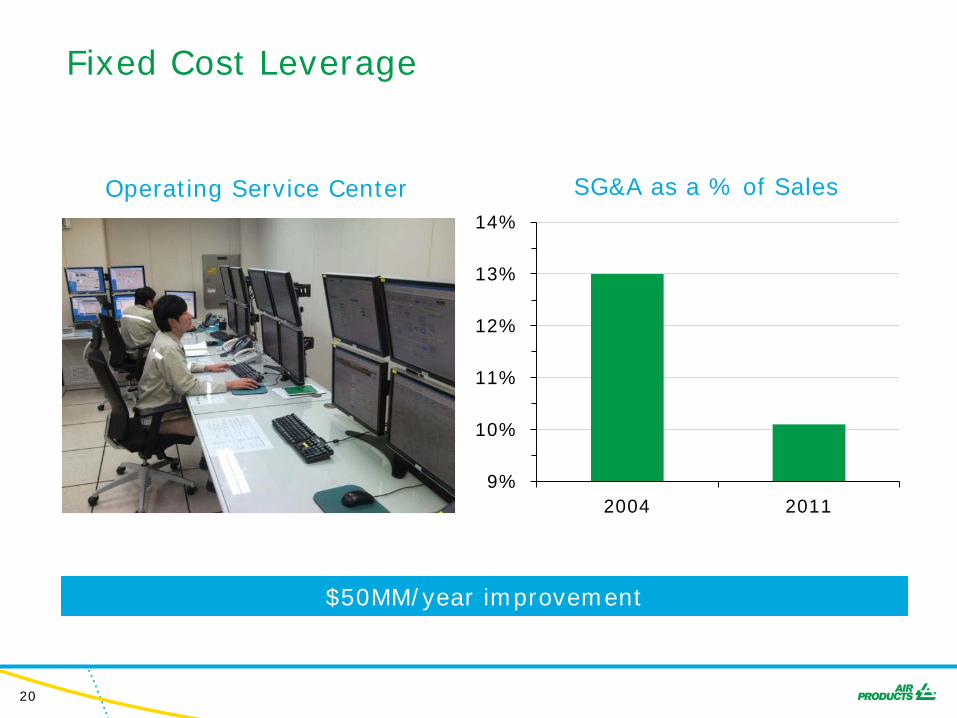
Fixed Cost Leverage
$50MM/year improvement
Operating Service Center
9%
10%
11%
12%
13%
14%
2004 2011
SG&A as a % of Sales
21
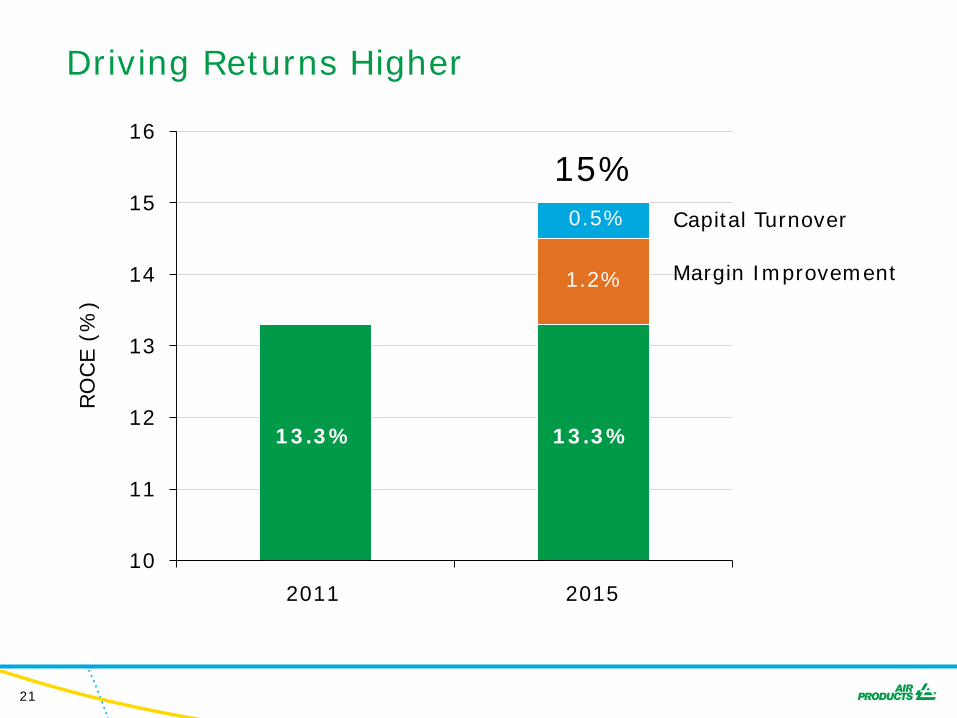
Driving Returns Higher
10
11
12
13
14
15
16
15%
2011 2015
1.2% Margin Improvement
0.5% Capital Turnover
13.3% 13.3%
RO
CE (
%)
22
20
40
60
80
100
120
2009 2010 2012 2015
Cap
ital
Cost
Index
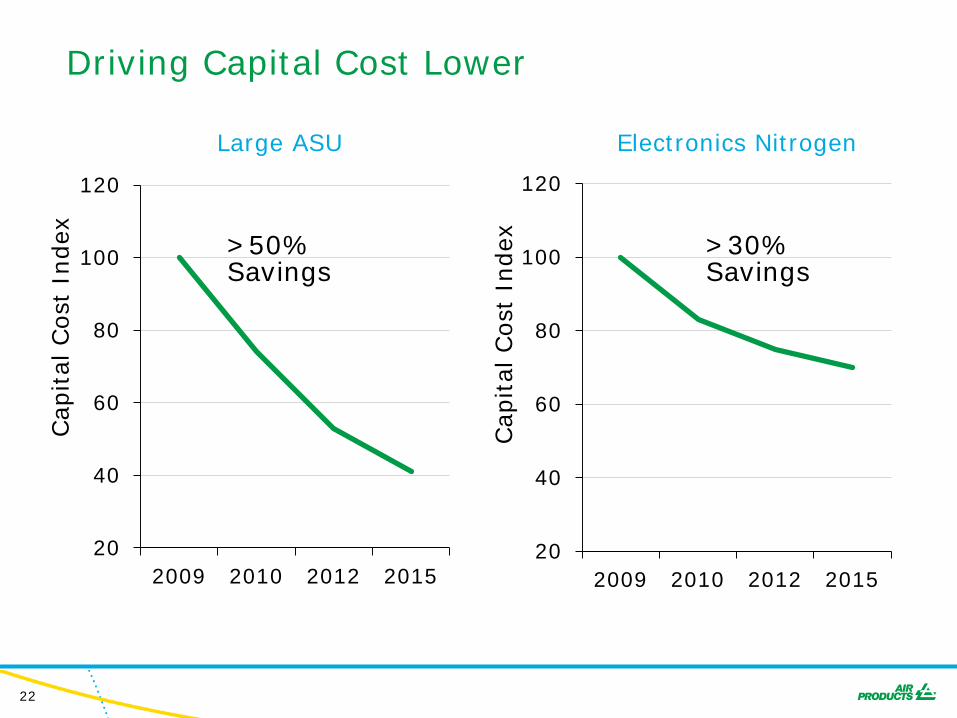
Driving Capital Cost Lower
Electronics Nitrogen Large ASU
20
40
60
80
100
120
2009 2010 2012 2015
Cap
ital
Cost
Index
>50% Savings
>30% Savings
23
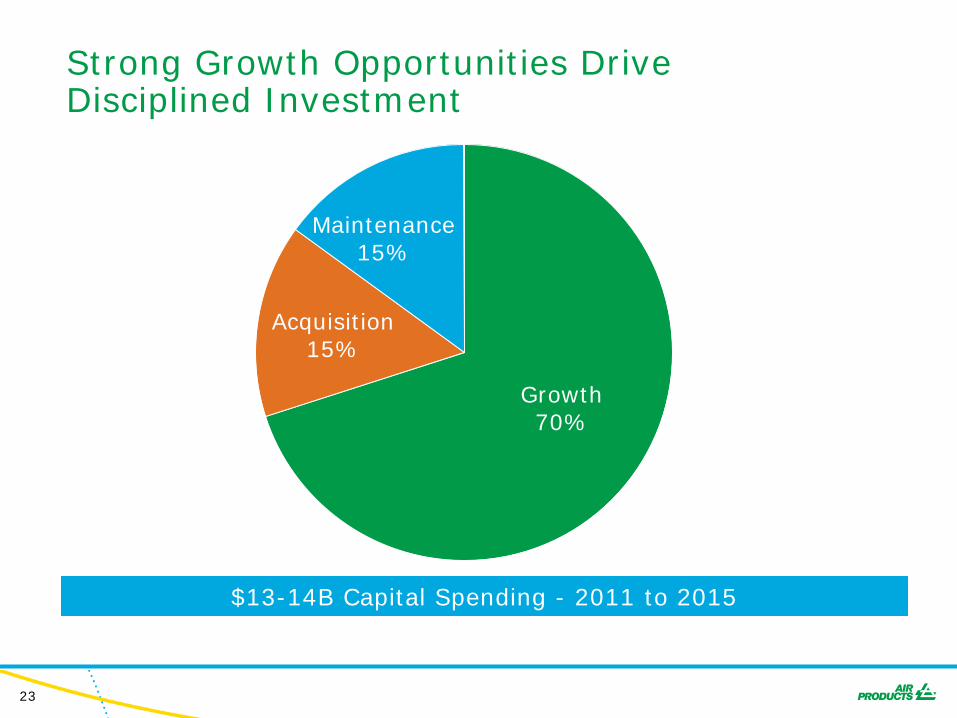
$13-14B Capital Spending - 2011 to 2015
Growth 70%
Acquisition 15%
Maintenance 15%
Strong Growth Opportunities Drive Disciplined Investment
24
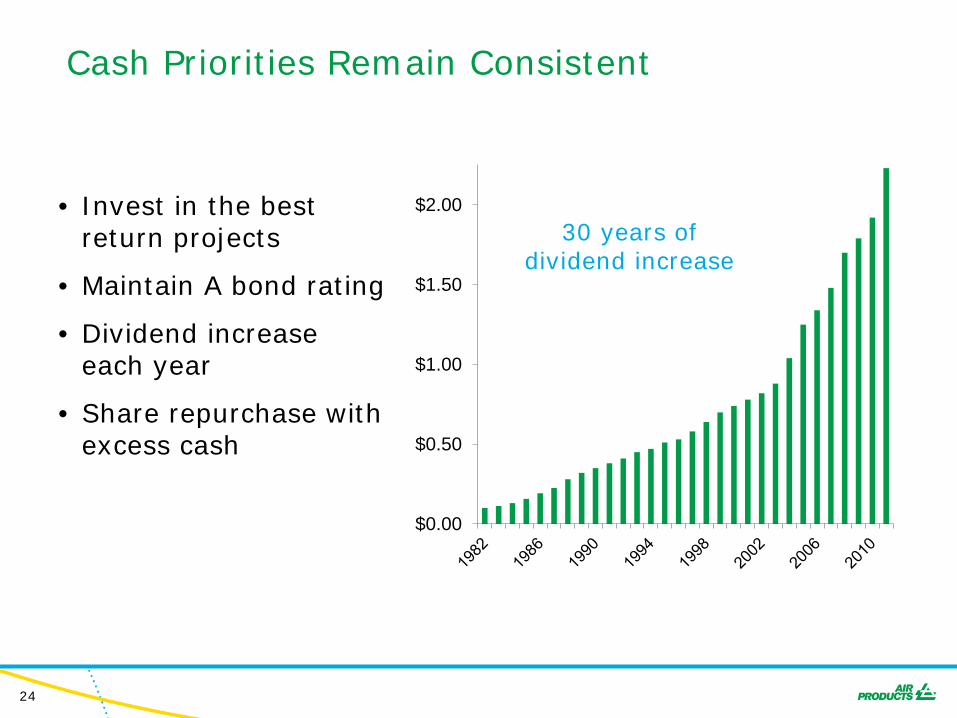
Cash Priorities Remain Consistent
• Invest in the best return projects
• Maintain A bond rating
• Dividend increase each year
• Share repurchase with excess cash
$0.00
$0.50
$1.00
$1.50
$2.00 30 years of
dividend increase
25
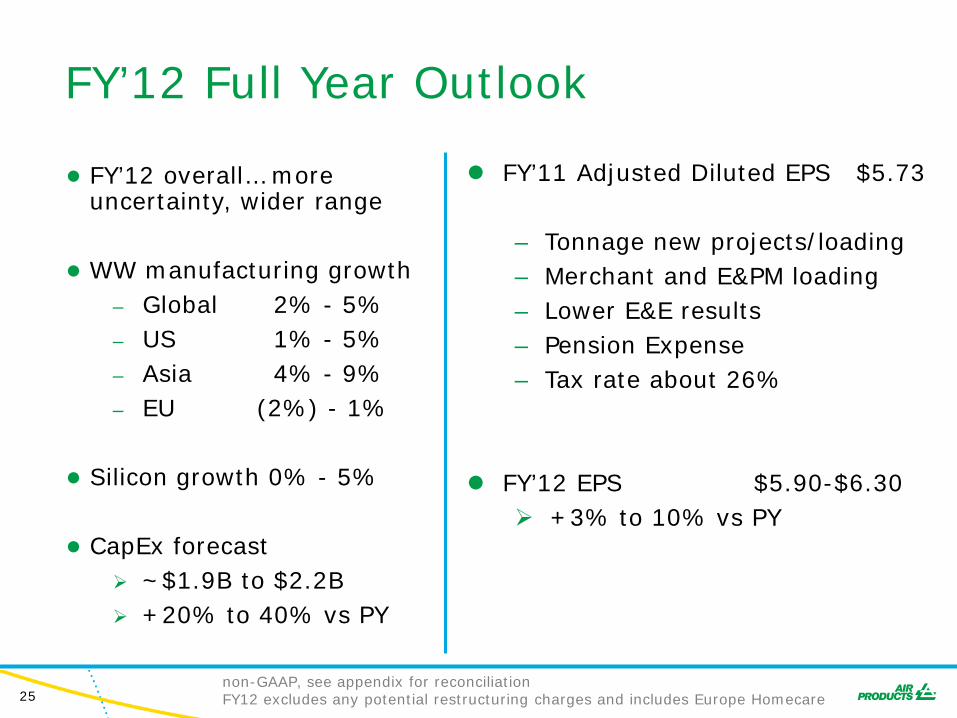
FY’12 Full Year Outlook
● FY’12 overall… more uncertainty, wider range
● WW manufacturing growth – Global 2% - 5% – US 1% - 5% – Asia 4% - 9% – EU (2%) - 1%
● Silicon growth 0% - 5%
● CapEx forecast
~$1.9B to $2.2B +20% to 40% vs PY
FY’11 Adjusted Diluted EPS $5.73
– Tonnage new projects/loading – Merchant and E&PM loading – Lower E&E results – Pension Expense – Tax rate about 26%
FY’12 EPS $5.90-$6.30
+3% to 10% vs PY
non-GAAP, see appendix for reconciliation FY12 excludes any potential restructuring charges and includes Europe Homecare
26
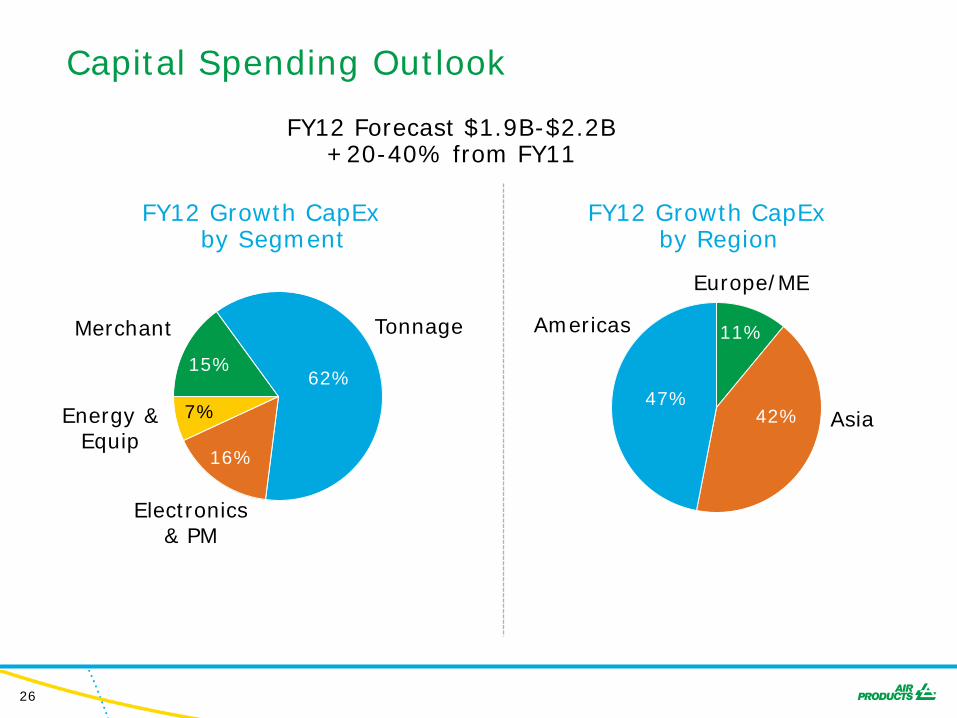
15% 62%
16%
7%
Capital Spending Outlook
FY12 Forecast $1.9B-$2.2B +20-40% from FY11
11%
42% 47%
FY12 Growth CapEx by Segment
FY12 Growth CapEx by Region
Europe/ME
Asia
Americas Merchant
Energy & Equip
Electronics & PM
Tonnage
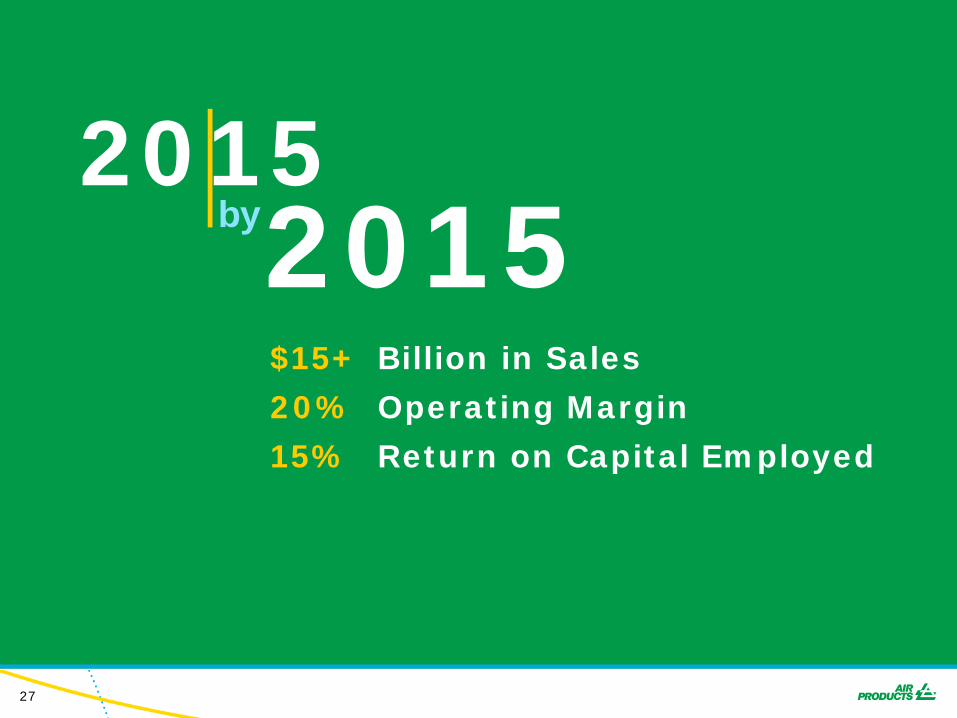
27
$15+ Billion in Sales
20% Operating Margin
15% Return on Capital Employed
20 15 2015 by
28
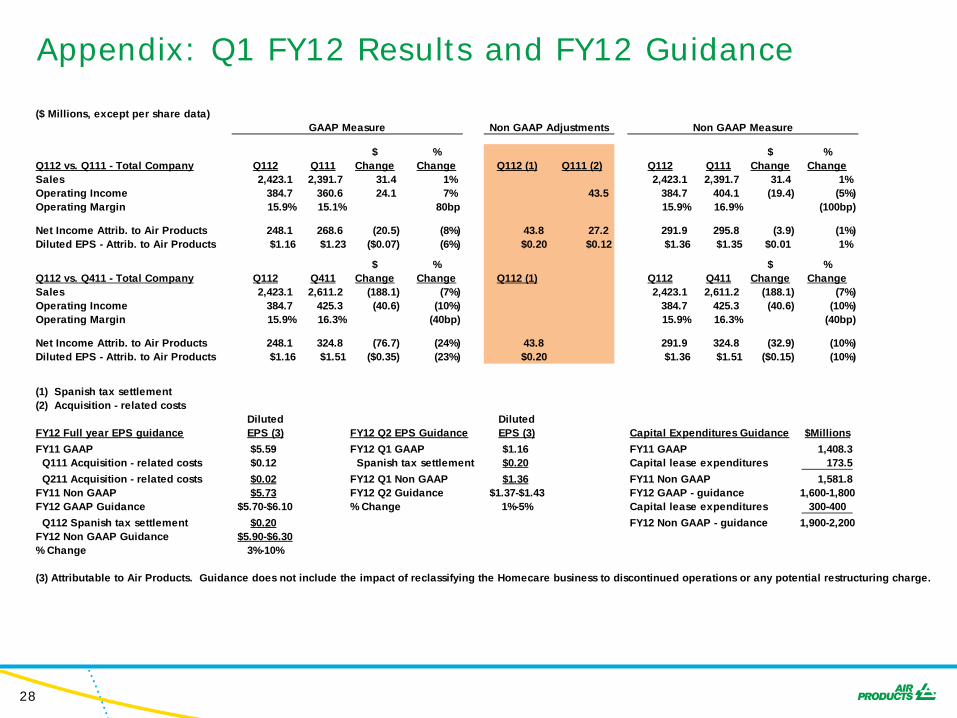
Appendix: Q1 FY12 Results and FY12 Guidance
($ Millions, except per share data)
$ % $ %Q112 vs. Q111 - Total Company Q112 Q111 Change Change Q112 (1) Q111 (2) Q112 Q111 Change ChangeSales 2,423.1 2,391.7 31.4 1% 2,423.1 2,391.7 31.4 1%Operating Income 384.7 360.6 24.1 7% 43.5 384.7 404.1 (19.4) (5%)Operating Margin 15.9% 15.1% 80bp 15.9% 16.9% (100bp)
Net Income Attrib. to Air Products 248.1 268.6 (20.5) (8%) 43.8 27.2 291.9 295.8 (3.9) (1%)Diluted EPS - Attrib. to Air Products $1.16 $1.23 ($0.07) (6%) $0.20 $0.12 $1.36 $1.35 $0.01 1%
$ % $ %Q112 vs. Q411 - Total Company Q112 Q411 Change Change Q112 (1) Q112 Q411 Change ChangeSales 2,423.1 2,611.2 (188.1) (7%) 2,423.1 2,611.2 (188.1) (7%)Operating Income 384.7 425.3 (40.6) (10%) 384.7 425.3 (40.6) (10%)Operating Margin 15.9% 16.3% (40bp) 15.9% 16.3% (40bp)
Net Income Attrib. to Air Products 248.1 324.8 (76.7) (24%) 43.8 291.9 324.8 (32.9) (10%)Diluted EPS - Attrib. to Air Products $1.16 $1.51 ($0.35) (23%) $0.20 $1.36 $1.51 ($0.15) (10%)
(1) Spanish tax settlement(2) Acquisition - related costs
Diluted DilutedFY12 Full year EPS guidance EPS (3) FY12 Q2 EPS Guidance EPS (3) Capital Expenditures Guidance $MillionsFY11 GAAP $5.59 FY12 Q1 GAAP $1.16 FY11 GAAP 1,408.3 Q111 Acquisition - related costs $0.12 Spanish tax settlement $0.20 Capital lease expenditures 173.5 Q211 Acquisition - related costs $0.02 FY12 Q1 Non GAAP $1.36 FY11 Non GAAP 1,581.8 FY11 Non GAAP $5.73 FY12 Q2 Guidance $1.37-$1.43 FY12 GAAP - guidance 1,600-1,800FY12 GAAP Guidance $5.70-$6.10 % Change 1%-5% Capital lease expenditures 300-400 Q112 Spanish tax settlement $0.20 FY12 Non GAAP - guidance 1,900-2,200FY12 Non GAAP Guidance $5.90-$6.30% Change 3%-10%
(3) Attributable to Air Products. Guidance does not include the impact of reclassifying the Homecare business to discontinued operations or any potential restructuring charge.
GAAP Measure Non GAAP MeasureNon GAAP Adjustments

Thank you… tell me more
Recommended