Warwickshire County Council Stratford-on-Avon Strategic Transport Assessment Phase 2 Studley Scenario Analysis
211439-19.R015
Issue | 25 July 2013
This report takes into account the particular instructions and requirements of our client.
It is not intended for and should not be relied upon by any third party and no responsibility is undertaken to any third party. Job number 211439-19
Ove Arup & Partners Ltd The Arup Campus Blythe Gate Blythe Valley Park Solihull B90 8AE United Kingdom www.arup.com
ED.4.7.6

Warwickshire County Council Stratford-on-Avon Strategic Transport Assessment Phase 2 Studley Scenario Analysis
211439-19.R015 | Issue | 25 July 2013 J:\211000\211439-19\4 INTERNAL PROJECT DATA\4-05 REPORTS\STRATFORD STA PHASE 2\ISSUE\211439-19 R015 2 - SDC STA PHASE 2 - STUDLEY SCENARIO MODELLING REPORT_ISSUE.DOCX
Contents Page
1 Introduction 1
1.1 Overview 1 1.2 Scope 1 1.3 Study Objectives 1 1.4 Study Area 1
2 Scenario Development 3
2.1 2028 Reference Case Development 3 2.2 Core Strategy Scenarios 4 2.3 Trip Distributions 9 2.4 Scenario Demands 10
3 Results Analysis 13
3.1 Overview 13 3.2 Model Stability 13 3.3 Number of Runs 14 3.4 Network Wide Statistics 14 3.5 Average Maximum Queue Length Analysis 14 3.6 Additional Analysis 16
4 Studley Scenario Testing – Outline Impact Analysis 17
4.1 2028 Core Strategy Allocation: Results Analysis 17 4.2 Model Stability 17 4.3 Network Wide Statistics 17 4.4 Maximum Queue Length Analysis 21 4.5 Summary 21
5 AQMA Analysis 22
5.1 Overview 24 5.2 Results Analysis 25 5.3 Summary 25
Appendices
Appendix A
Studley Average Maximum Queue Difference Plots
Warwickshire County Council Stratford-on-Avon Strategic Transport Assessment Phase 2 Studley Scenario Analysis
211439-19.R015 | Issue | 25 July 2013 J:\211000\211439-19\4 INTERNAL PROJECT DATA\4-05 REPORTS\STRATFORD STA PHASE 2\ISSUE\211439-19 R015 2 - SDC STA PHASE 2 - STUDLEY SCENARIO MODELLING REPORT_ISSUE.DOCX
Page 1
1 Introduction
1.1 Overview Arup have been commissioned by Warwickshire County Council and Stratford on Avon District Council to undertake strategic level testing and impact analysis of potential Core Strategy allocations for Stratford on Avon District Council (SDC).
The majority of the analysis associated with the SDC STA Phase 2 testing has been summarised within the SDC STA Phase 2 modelling report1. The purpose of this report is to document the specific testing, undertaken within the Studley PARAMICS model, of a number of potential developments.
1.2 Scope This report outlines some initial impact analysis outputs, extracted from the Studley PARAMICS model, in relation to the following potential development sites:
� Land at Winyates Green Triangle and Gorcott Hill (Gross 28Ha Employment)
� A435 Mappleborough Green (300 Dwellings) � Edge of Studley (150 Dwellings).
1.3 Study Objectives The objectives of this stage of analysis are as follows:
� To understand the potential impacts on the Studley area, of the allocation of each of the aforementioned potential development sites in isolation.
� To understand the potential cumulative impacts and, conversely the feasibility of, the delivery of all the sites in unison
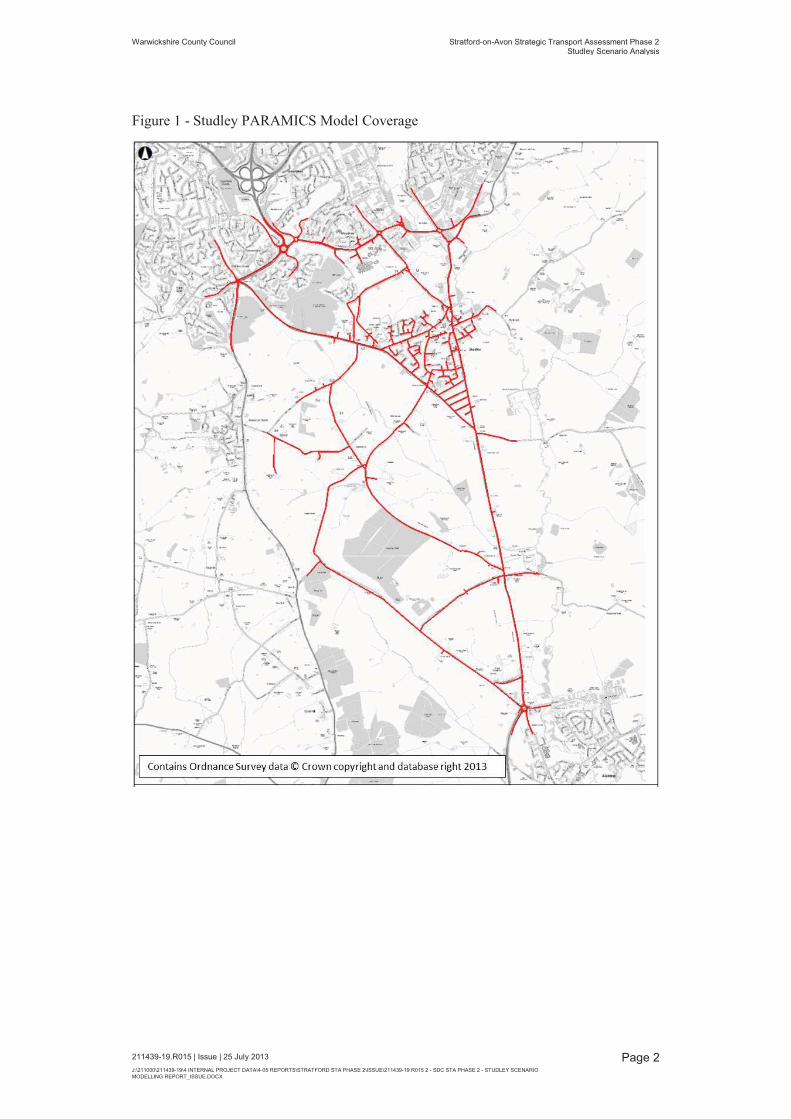
1.4 Study Area The focus of the study area is that which is encompassed by the coverage of the Studley PARAMICS model. An overview of the coverage of this model is provided within Figure 1
1 211439-19.R014 Stratford-on-Avon Strategic Transport Assessment, Phase 2 Modelling Report, Arup, June 2013
Warwickshire County Council Stratford-on-Avon Strategic Transport Assessment Phase 2 Studley Scenario Analysis
211439-19.R015 | Issue | 25 July 2013 J:\211000\211439-19\4 INTERNAL PROJECT DATA\4-05 REPORTS\STRATFORD STA PHASE 2\ISSUE\211439-19 R015 2 - SDC STA PHASE 2 - STUDLEY SCENARIO MODELLING REPORT_ISSUE.DOCX
Page 2
Figure 1 - Studley PARAMICS Model Coverage
Warwickshire County Council Stratford-on-Avon Strategic Transport Assessment Phase 2 Studley Scenario Analysis
211439-19.R015 | Issue | 25 July 2013 J:\211000\211439-19\4 INTERNAL PROJECT DATA\4-05 REPORTS\STRATFORD STA PHASE 2\ISSUE\211439-19 R015 2 - SDC STA PHASE 2 - STUDLEY SCENARIO MODELLING REPORT_ISSUE.DOCX
Page 3
2 Scenario Development
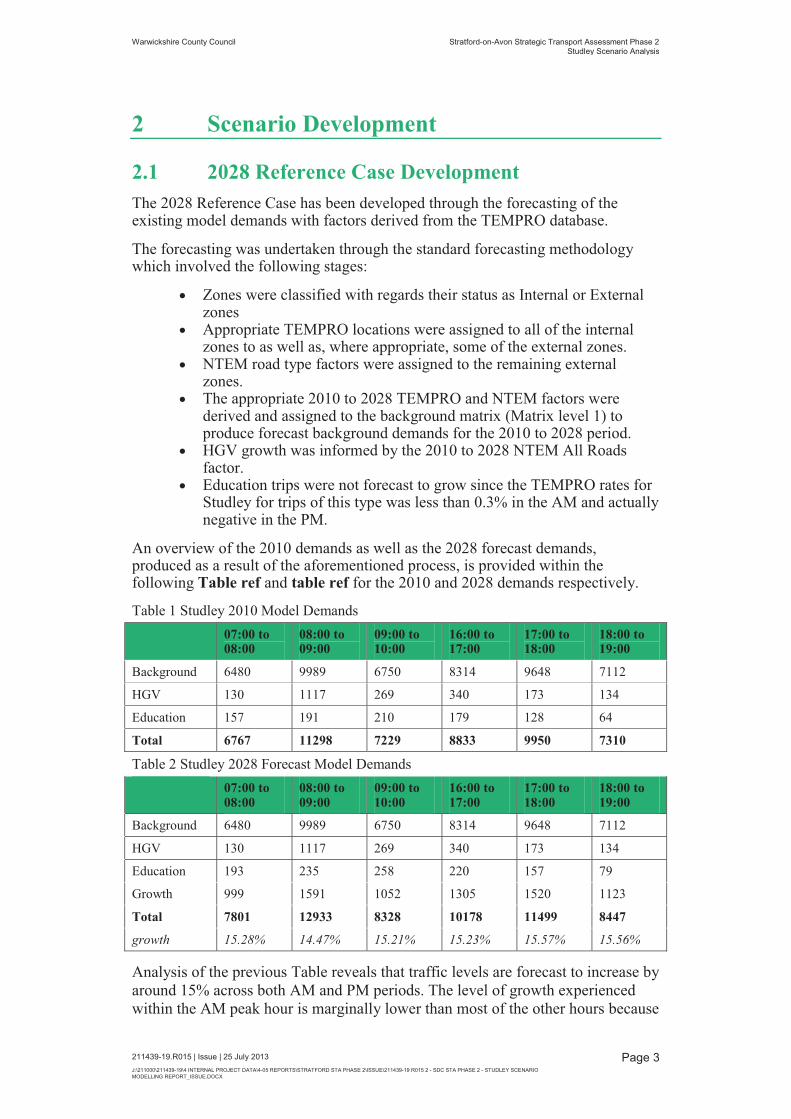
2.1 2028 Reference Case Development The 2028 Reference Case has been developed through the forecasting of the existing model demands with factors derived from the TEMPRO database.
The forecasting was undertaken through the standard forecasting methodology which involved the following stages:
� Zones were classified with regards their status as Internal or External zones
� Appropriate TEMPRO locations were assigned to all of the internal zones to as well as, where appropriate, some of the external zones.
� NTEM road type factors were assigned to the remaining external zones.
� The appropriate 2010 to 2028 TEMPRO and NTEM factors were derived and assigned to the background matrix (Matrix level 1) to produce forecast background demands for the 2010 to 2028 period.
� HGV growth was informed by the 2010 to 2028 NTEM All Roads factor.
� Education trips were not forecast to grow since the TEMPRO rates for Studley for trips of this type was less than 0.3% in the AM and actually negative in the PM.
An overview of the 2010 demands as well as the 2028 forecast demands, produced as a result of the aforementioned process, is provided within the following Table ref and table ref for the 2010 and 2028 demands respectively.
Table 1 Studley 2010 Model Demands 07:00 to
08:00 08:00 to 09:00
09:00 to 10:00
16:00 to 17:00
17:00 to 18:00
18:00 to 19:00
Background 6480 9989 6750 8314 9648 7112
HGV 130 1117 269 340 173 134
Education 157 191 210 179 128 64
Total 6767 11298 7229 8833 9950 7310
Table 2 Studley 2028 Forecast Model Demands 07:00 to
08:00 08:00 to 09:00
09:00 to 10:00
16:00 to 17:00
17:00 to 18:00
18:00 to 19:00
Background 6480 9989 6750 8314 9648 7112
HGV 130 1117 269 340 173 134
Education 193 235 258 220 157 79
Growth 999 1591 1052 1305 1520 1123
Total 7801 12933 8328 10178 11499 8447
growth 15.28% 14.47% 15.21% 15.23% 15.57% 15.56%
Analysis of the previous Table reveals that traffic levels are forecast to increase by around 15% across both AM and PM periods. The level of growth experienced within the AM peak hour is marginally lower than most of the other hours because
Warwickshire County Council Stratford-on-Avon Strategic Transport Assessment Phase 2 Studley Scenario Analysis
211439-19.R015 | Issue | 25 July 2013 J:\211000\211439-19\4 INTERNAL PROJECT DATA\4-05 REPORTS\STRATFORD STA PHASE 2\ISSUE\211439-19 R015 2 - SDC STA PHASE 2 - STUDLEY SCENARIO MODELLING REPORT_ISSUE.DOCX
Page 4
of the presence of a large number of education based trips within this hour and the fact that no additional growth has been assumed for these trip types.
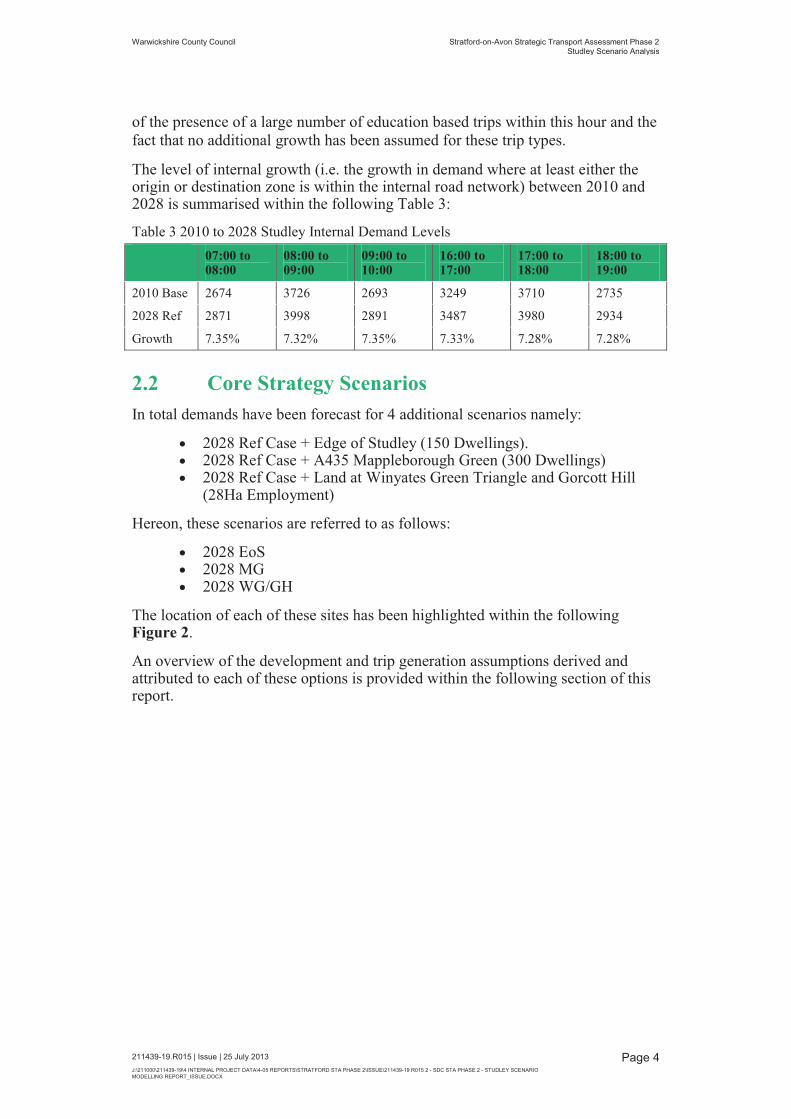
The level of internal growth (i.e. the growth in demand where at least either the origin or destination zone is within the internal road network) between 2010 and 2028 is summarised within the following Table 3:
Table 3 2010 to 2028 Studley Internal Demand Levels 07:00 to
08:00 08:00 to 09:00
09:00 to 10:00
16:00 to 17:00
17:00 to 18:00
18:00 to 19:00
2010 Base 2674 3726 2693 3249 3710 2735
2028 Ref 2871 3998 2891 3487 3980 2934
Growth 7.35% 7.32% 7.35% 7.33% 7.28% 7.28%
2.2 Core Strategy Scenarios In total demands have been forecast for 4 additional scenarios namely:
� 2028 Ref Case + Edge of Studley (150 Dwellings). � 2028 Ref Case + A435 Mappleborough Green (300 Dwellings) � 2028 Ref Case + Land at Winyates Green Triangle and Gorcott Hill
(28Ha Employment)
Hereon, these scenarios are referred to as follows:
� 2028 EoS � 2028 MG � 2028 WG/GH
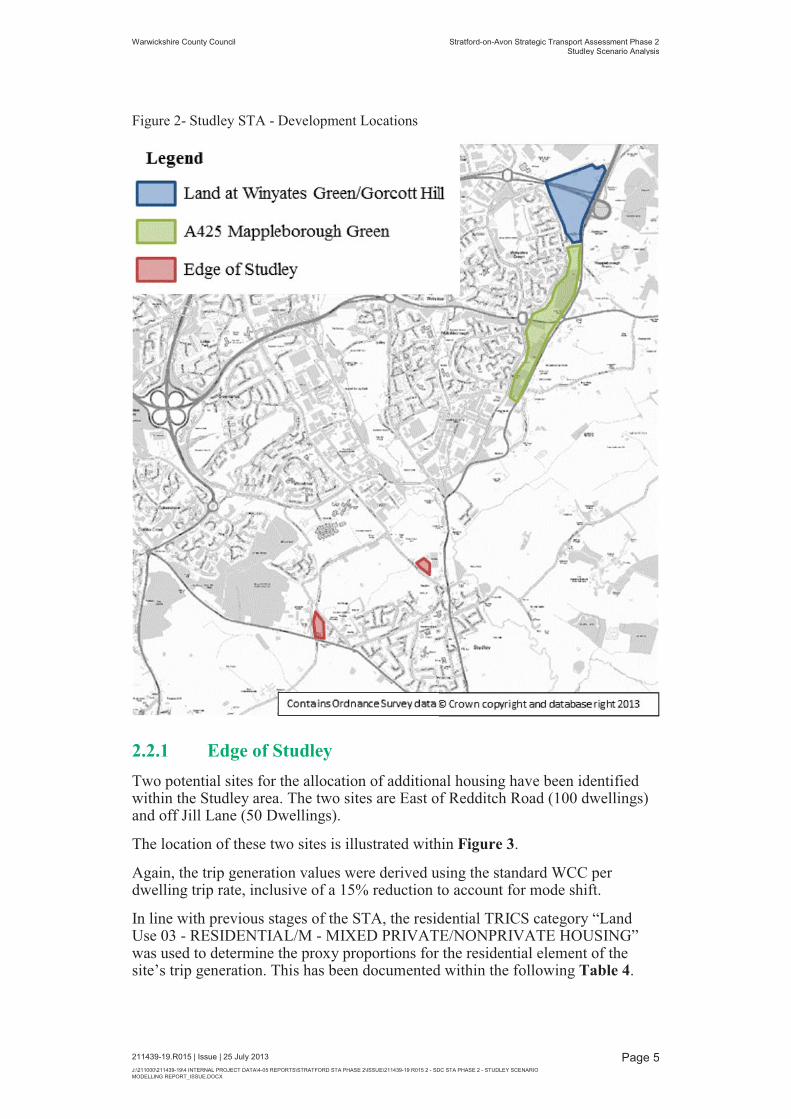
The location of each of these sites has been highlighted within the following Figure 2.
An overview of the development and trip generation assumptions derived and attributed to each of these options is provided within the following section of this report.
Warwickshire County Council Stratford-on-Avon Strategic Transport Assessment Phase 2 Studley Scenario Analysis
211439-19.R015 | Issue | 25 July 2013 J:\211000\211439-19\4 INTERNAL PROJECT DATA\4-05 REPORTS\STRATFORD STA PHASE 2\ISSUE\211439-19 R015 2 - SDC STA PHASE 2 - STUDLEY SCENARIO MODELLING REPORT_ISSUE.DOCX
Page 5
Figure 2- Studley STA - Development Locations
2.2.1 Edge of Studley Two potential sites for the allocation of additional housing have been identified within the Studley area. The two sites are East of Redditch Road (100 dwellings) and off Jill Lane (50 Dwellings).
The location of these two sites is illustrated within Figure 3.
Again, the trip generation values were derived using the standard WCC per dwelling trip rate, inclusive of a 15% reduction to account for mode shift.
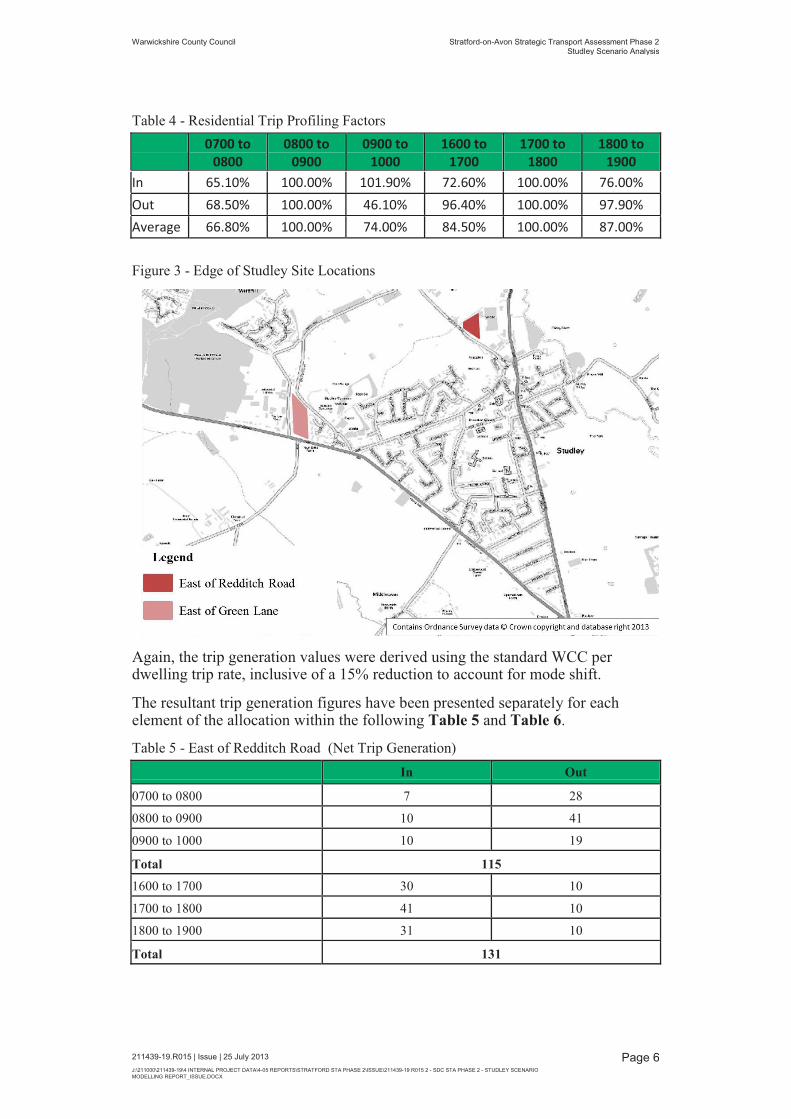
In line with previous stages of the STA, the residential TRICS category “Land Use 03 - RESIDENTIAL/M - MIXED PRIVATE/NONPRIVATE HOUSING” was used to determine the proxy proportions for the residential element of the site’s trip generation. This has been documented within the following Table 4.
Warwickshire County Council Stratford-on-Avon Strategic Transport Assessment Phase 2 Studley Scenario Analysis
211439-19.R015 | Issue | 25 July 2013 J:\211000\211439-19\4 INTERNAL PROJECT DATA\4-05 REPORTS\STRATFORD STA PHASE 2\ISSUE\211439-19 R015 2 - SDC STA PHASE 2 - STUDLEY SCENARIO MODELLING REPORT_ISSUE.DOCX
Page 6
Table 4 - Residential Trip Profiling Factors 0700 to
0800 0800 to
0900 0900 to
1000 1600 to
1700 1700 to
1800 1800 to
1900 In 65.10% 100.00% 101.90% 72.60% 100.00% 76.00% Out 68.50% 100.00% 46.10% 96.40% 100.00% 97.90% Average 66.80% 100.00% 74.00% 84.50% 100.00% 87.00%
Figure 3 - Edge of Studley Site Locations
Again, the trip generation values were derived using the standard WCC per dwelling trip rate, inclusive of a 15% reduction to account for mode shift.
The resultant trip generation figures have been presented separately for each element of the allocation within the following Table 5 and Table 6.
Table 5 - East of Redditch Road (Net Trip Generation) In Out
0700 to 0800 7 28
0800 to 0900 10 41
0900 to 1000 10 19
Total 115 1600 to 1700 30 10
1700 to 1800 41 10
1800 to 1900 31 10
Total 131
Warwickshire County Council Stratford-on-Avon Strategic Transport Assessment Phase 2 Studley Scenario Analysis
211439-19.R015 | Issue | 25 July 2013 J:\211000\211439-19\4 INTERNAL PROJECT DATA\4-05 REPORTS\STRATFORD STA PHASE 2\ISSUE\211439-19 R015 2 - SDC STA PHASE 2 - STUDLEY SCENARIO MODELLING REPORT_ISSUE.DOCX
Page 7
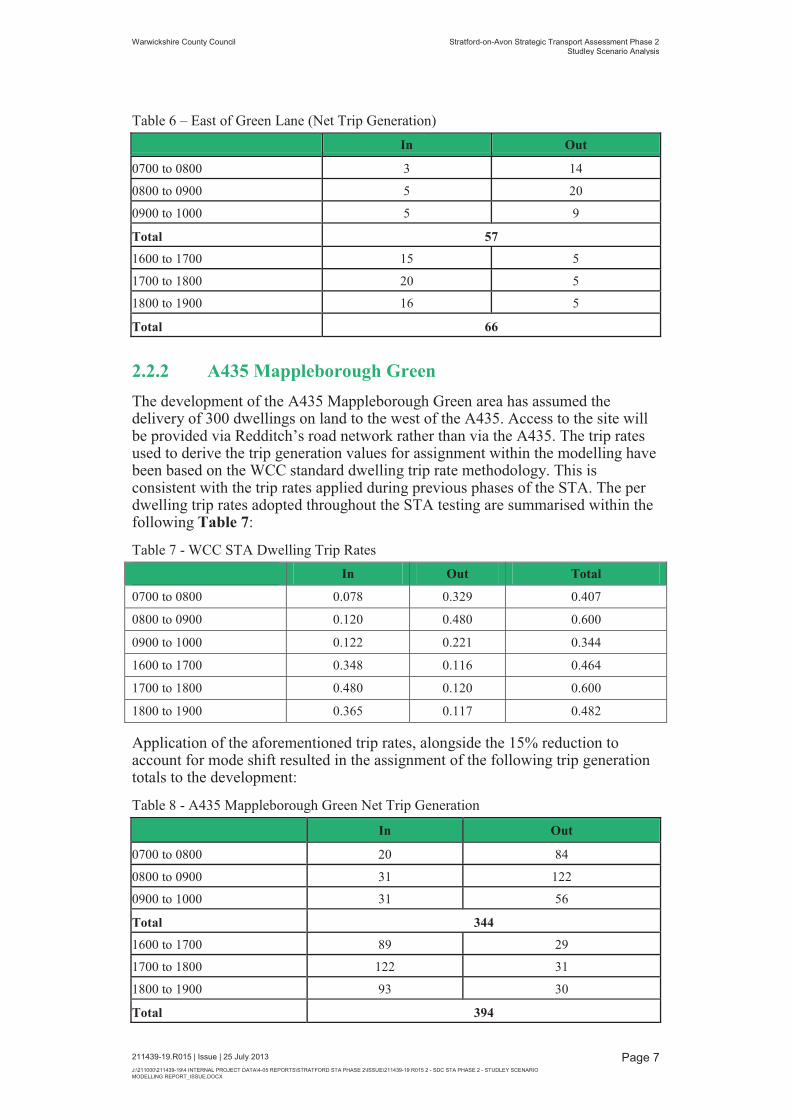
Table 6 – East of Green Lane (Net Trip Generation) In Out
0700 to 0800 3 14
0800 to 0900 5 20
0900 to 1000 5 9
Total 57
1600 to 1700 15 5
1700 to 1800 20 5
1800 to 1900 16 5
Total 66
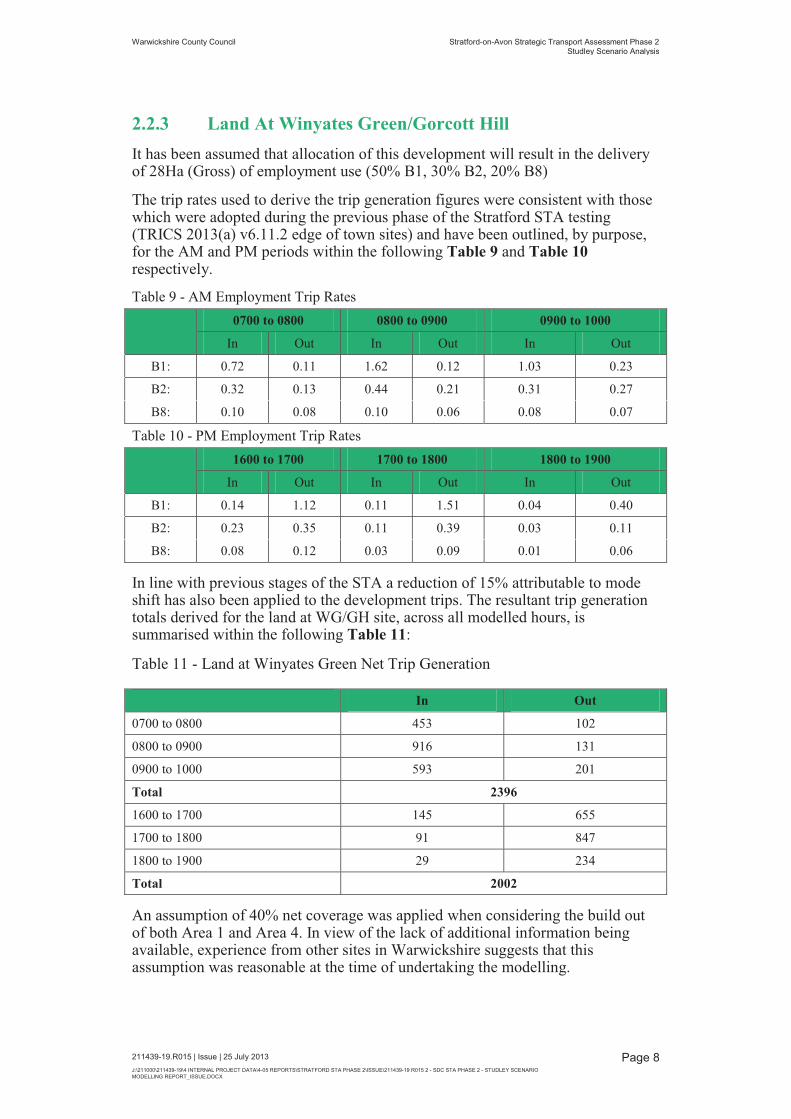
2.2.2 A435 Mappleborough Green The development of the A435 Mappleborough Green area has assumed the delivery of 300 dwellings on land to the west of the A435. Access to the site will be provided via Redditch’s road network rather than via the A435. The trip rates used to derive the trip generation values for assignment within the modelling have been based on the WCC standard dwelling trip rate methodology. This is consistent with the trip rates applied during previous phases of the STA. The per dwelling trip rates adopted throughout the STA testing are summarised within the following Table 7:
Table 7 - WCC STA Dwelling Trip Rates In Out Total
0700 to 0800 0.078 0.329 0.407
0800 to 0900 0.120 0.480 0.600
0900 to 1000 0.122 0.221 0.344
1600 to 1700 0.348 0.116 0.464
1700 to 1800 0.480 0.120 0.600
1800 to 1900 0.365 0.117 0.482
Application of the aforementioned trip rates, alongside the 15% reduction to account for mode shift resulted in the assignment of the following trip generation totals to the development:
Table 8 - A435 Mappleborough Green Net Trip Generation
In Out
0700 to 0800 20 84
0800 to 0900 31 122
0900 to 1000 31 56
Total 344
1600 to 1700 89 29
1700 to 1800 122 31
1800 to 1900 93 30
Total 394
Warwickshire County Council Stratford-on-Avon Strategic Transport Assessment Phase 2 Studley Scenario Analysis
211439-19.R015 | Issue | 25 July 2013 J:\211000\211439-19\4 INTERNAL PROJECT DATA\4-05 REPORTS\STRATFORD STA PHASE 2\ISSUE\211439-19 R015 2 - SDC STA PHASE 2 - STUDLEY SCENARIO MODELLING REPORT_ISSUE.DOCX
Page 8
2.2.3 Land At Winyates Green/Gorcott Hill It has been assumed that allocation of this development will result in the delivery of 28Ha (Gross) of employment use (50% B1, 30% B2, 20% B8)
The trip rates used to derive the trip generation figures were consistent with those which were adopted during the previous phase of the Stratford STA testing (TRICS 2013(a) v6.11.2 edge of town sites) and have been outlined, by purpose, for the AM and PM periods within the following Table 9 and Table 10 respectively.
Table 9 - AM Employment Trip Rates
0700 to 0800 0800 to 0900 0900 to 1000
In Out In Out In Out
B1: 0.72 0.11 1.62 0.12 1.03 0.23
B2: 0.32 0.13 0.44 0.21 0.31 0.27
B8: 0.10 0.08 0.10 0.06 0.08 0.07
Table 10 - PM Employment Trip Rates
1600 to 1700 1700 to 1800 1800 to 1900
In Out In Out In Out
B1: 0.14 1.12 0.11 1.51 0.04 0.40
B2: 0.23 0.35 0.11 0.39 0.03 0.11
B8: 0.08 0.12 0.03 0.09 0.01 0.06
In line with previous stages of the STA a reduction of 15% attributable to mode shift has also been applied to the development trips. The resultant trip generation totals derived for the land at WG/GH site, across all modelled hours, is summarised within the following Table 11:
Table 11 - Land at Winyates Green Net Trip Generation
In Out
0700 to 0800 453 102
0800 to 0900 916 131
0900 to 1000 593 201
Total 2396
1600 to 1700 145 655
1700 to 1800 91 847
1800 to 1900 29 234
Total 2002
An assumption of 40% net coverage was applied when considering the build out of both Area 1 and Area 4. In view of the lack of additional information being available, experience from other sites in Warwickshire suggests that this assumption was reasonable at the time of undertaking the modelling.
Warwickshire County Council Stratford-on-Avon Strategic Transport Assessment Phase 2 Studley Scenario Analysis
211439-19.R015 | Issue | 25 July 2013 J:\211000\211439-19\4 INTERNAL PROJECT DATA\4-05 REPORTS\STRATFORD STA PHASE 2\ISSUE\211439-19 R015 2 - SDC STA PHASE 2 - STUDLEY SCENARIO MODELLING REPORT_ISSUE.DOCX
Page 9
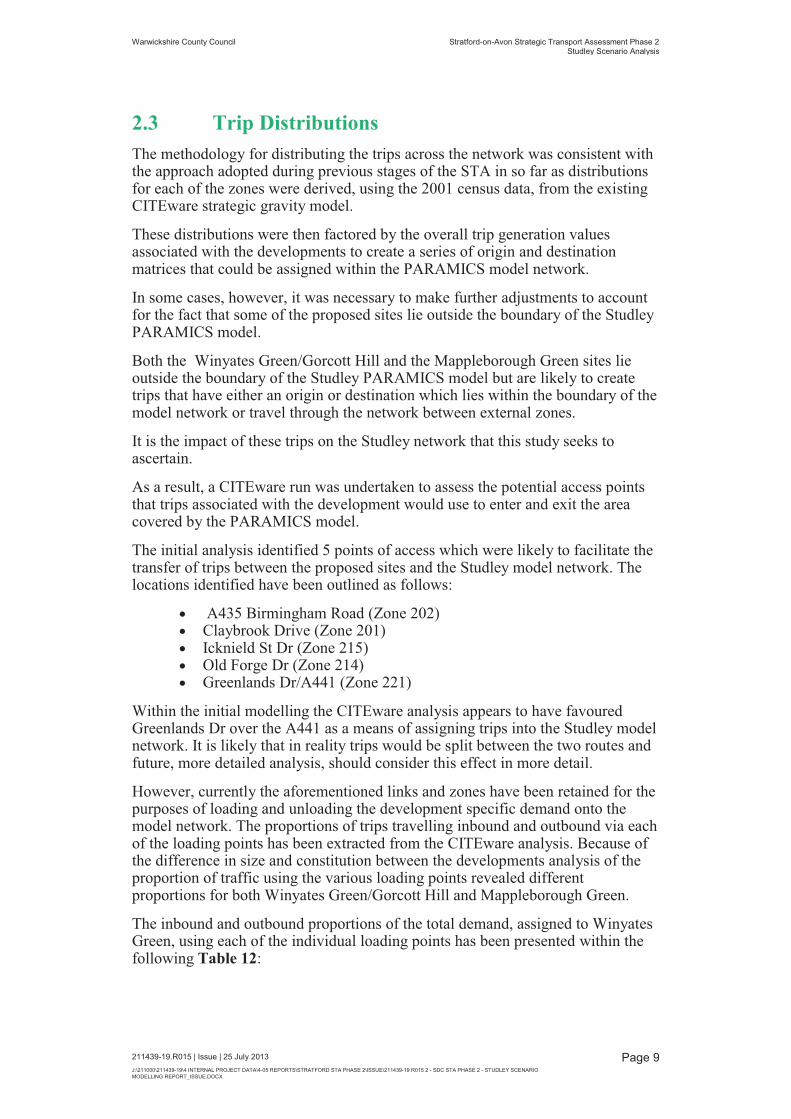
2.3 Trip Distributions The methodology for distributing the trips across the network was consistent with the approach adopted during previous stages of the STA in so far as distributions for each of the zones were derived, using the 2001 census data, from the existing CITEware strategic gravity model.
These distributions were then factored by the overall trip generation values associated with the developments to create a series of origin and destination matrices that could be assigned within the PARAMICS model network.
In some cases, however, it was necessary to make further adjustments to account for the fact that some of the proposed sites lie outside the boundary of the Studley PARAMICS model.
Both the Winyates Green/Gorcott Hill and the Mappleborough Green sites lie outside the boundary of the Studley PARAMICS model but are likely to create trips that have either an origin or destination which lies within the boundary of the model network or travel through the network between external zones.
It is the impact of these trips on the Studley network that this study seeks to ascertain.
As a result, a CITEware run was undertaken to assess the potential access points that trips associated with the development would use to enter and exit the area covered by the PARAMICS model.
The initial analysis identified 5 points of access which were likely to facilitate the transfer of trips between the proposed sites and the Studley model network. The locations identified have been outlined as follows:
� A435 Birmingham Road (Zone 202) � Claybrook Drive (Zone 201) � Icknield St Dr (Zone 215) � Old Forge Dr (Zone 214) � Greenlands Dr/A441 (Zone 221)
Within the initial modelling the CITEware analysis appears to have favoured Greenlands Dr over the A441 as a means of assigning trips into the Studley model network. It is likely that in reality trips would be split between the two routes and future, more detailed analysis, should consider this effect in more detail.
However, currently the aforementioned links and zones have been retained for the purposes of loading and unloading the development specific demand onto the model network. The proportions of trips travelling inbound and outbound via each of the loading points has been extracted from the CITEware analysis. Because of the difference in size and constitution between the developments analysis of the proportion of traffic using the various loading points revealed different proportions for both Winyates Green/Gorcott Hill and Mappleborough Green.
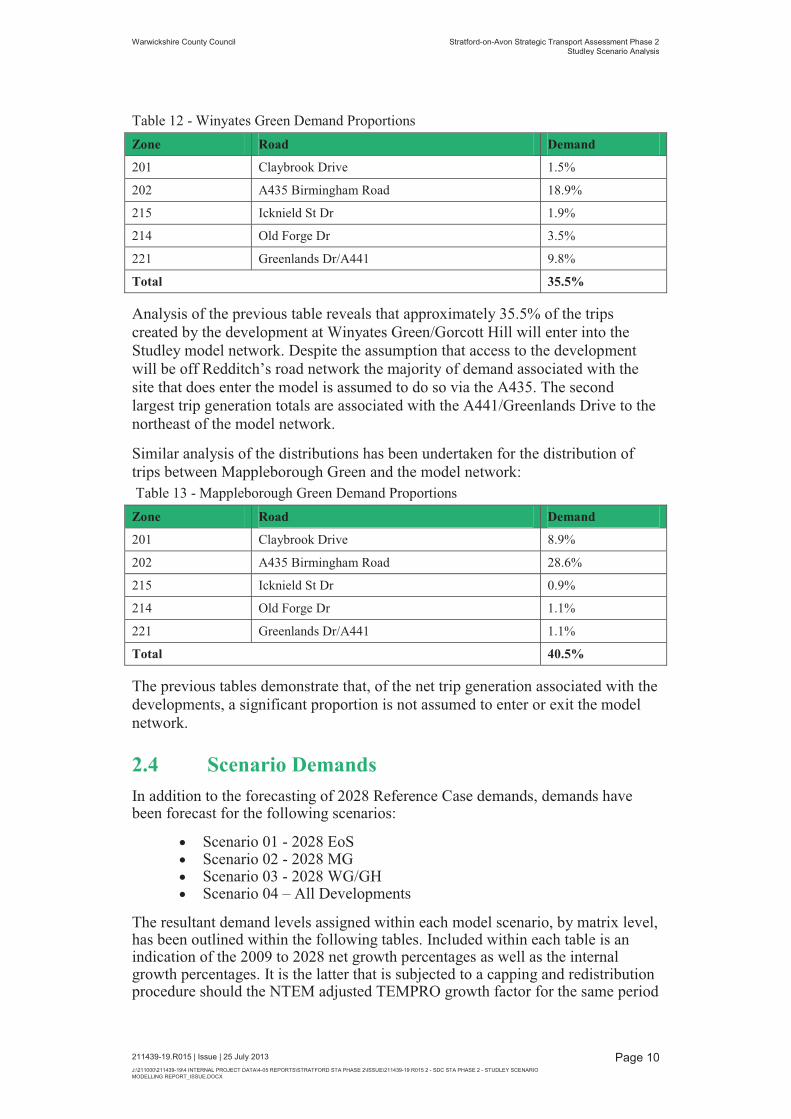
The inbound and outbound proportions of the total demand, assigned to Winyates Green, using each of the individual loading points has been presented within the following Table 12:
Warwickshire County Council Stratford-on-Avon Strategic Transport Assessment Phase 2 Studley Scenario Analysis
211439-19.R015 | Issue | 25 July 2013 J:\211000\211439-19\4 INTERNAL PROJECT DATA\4-05 REPORTS\STRATFORD STA PHASE 2\ISSUE\211439-19 R015 2 - SDC STA PHASE 2 - STUDLEY SCENARIO MODELLING REPORT_ISSUE.DOCX
Page 10
Table 12 - Winyates Green Demand Proportions Zone Road Demand
201 Claybrook Drive 1.5%
202 A435 Birmingham Road 18.9%
215 Icknield St Dr 1.9%
214 Old Forge Dr 3.5%
221 Greenlands Dr/A441 9.8%
Total 35.5%
Analysis of the previous table reveals that approximately 35.5% of the trips created by the development at Winyates Green/Gorcott Hill will enter into the Studley model network. Despite the assumption that access to the development will be off Redditch’s road network the majority of demand associated with the site that does enter the model is assumed to do so via the A435. The second largest trip generation totals are associated with the A441/Greenlands Drive to the northeast of the model network.
Similar analysis of the distributions has been undertaken for the distribution of trips between Mappleborough Green and the model network: Table 13 - Mappleborough Green Demand Proportions Zone Road Demand
201 Claybrook Drive 8.9%
202 A435 Birmingham Road 28.6%
215 Icknield St Dr 0.9%
214 Old Forge Dr 1.1%
221 Greenlands Dr/A441 1.1%
Total 40.5%
The previous tables demonstrate that, of the net trip generation associated with the developments, a significant proportion is not assumed to enter or exit the model network.
2.4 Scenario Demands In addition to the forecasting of 2028 Reference Case demands, demands have been forecast for the following scenarios:
� Scenario 01 - 2028 EoS � Scenario 02 - 2028 MG � Scenario 03 - 2028 WG/GH � Scenario 04 – All Developments
The resultant demand levels assigned within each model scenario, by matrix level, has been outlined within the following tables. Included within each table is an indication of the 2009 to 2028 net growth percentages as well as the internal growth percentages. It is the latter that is subjected to a capping and redistribution procedure should the NTEM adjusted TEMPRO growth factor for the same period
Warwickshire County Council Stratford-on-Avon Strategic Transport Assessment Phase 2 Studley Scenario Analysis
211439-19.R015 | Issue | 25 July 2013 J:\211000\211439-19\4 INTERNAL PROJECT DATA\4-05 REPORTS\STRATFORD STA PHASE 2\ISSUE\211439-19 R015 2 - SDC STA PHASE 2 - STUDLEY SCENARIO MODELLING REPORT_ISSUE.DOCX
Page 11
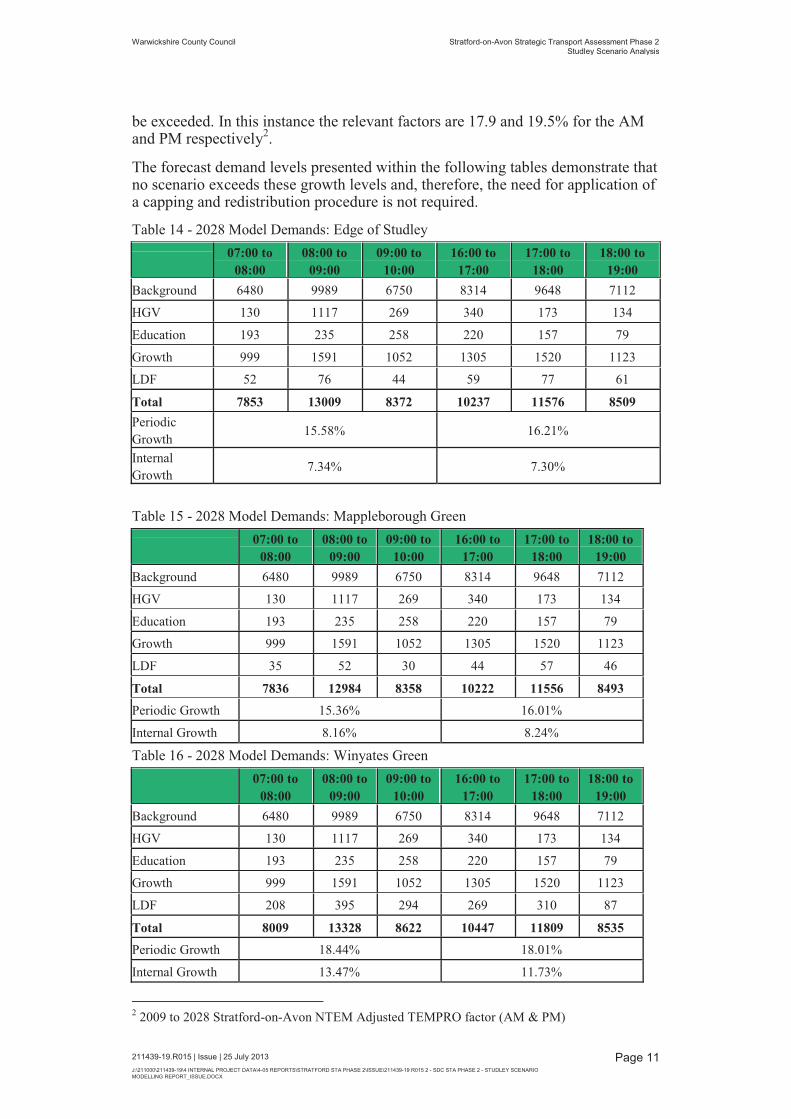
be exceeded. In this instance the relevant factors are 17.9 and 19.5% for the AM and PM respectively2.
The forecast demand levels presented within the following tables demonstrate that no scenario exceeds these growth levels and, therefore, the need for application of a capping and redistribution procedure is not required.
Table 14 - 2028 Model Demands: Edge of Studley
07:00 to 08:00
08:00 to 09:00
09:00 to 10:00
16:00 to 17:00
17:00 to 18:00
18:00 to 19:00
Background 6480 9989 6750 8314 9648 7112
HGV 130 1117 269 340 173 134
Education 193 235 258 220 157 79
Growth 999 1591 1052 1305 1520 1123
LDF 52 76 44 59 77 61
Total 7853 13009 8372 10237 11576 8509 Periodic Growth 15.58% 16.21%
Internal Growth 7.34% 7.30%
Table 15 - 2028 Model Demands: Mappleborough Green
07:00 to 08:00
08:00 to 09:00
09:00 to 10:00
16:00 to 17:00
17:00 to 18:00
18:00 to 19:00
Background 6480 9989 6750 8314 9648 7112
HGV 130 1117 269 340 173 134
Education 193 235 258 220 157 79
Growth 999 1591 1052 1305 1520 1123
LDF 35 52 30 44 57 46
Total 7836 12984 8358 10222 11556 8493 Periodic Growth 15.36% 16.01%
Internal Growth 8.16% 8.24%
Table 16 - 2028 Model Demands: Winyates Green
07:00 to 08:00
08:00 to 09:00
09:00 to 10:00
16:00 to 17:00
17:00 to 18:00
18:00 to 19:00
Background 6480 9989 6750 8314 9648 7112
HGV 130 1117 269 340 173 134
Education 193 235 258 220 157 79
Growth 999 1591 1052 1305 1520 1123
LDF 208 395 294 269 310 87
Total 8009 13328 8622 10447 11809 8535 Periodic Growth 18.44% 18.01%
Internal Growth 13.47% 11.73%
2 2009 to 2028 Stratford-on-Avon NTEM Adjusted TEMPRO factor (AM & PM)
Warwickshire County Council Stratford-on-Avon Strategic Transport Assessment Phase 2 Studley Scenario Analysis
211439-19.R015 | Issue | 25 July 2013 J:\211000\211439-19\4 INTERNAL PROJECT DATA\4-05 REPORTS\STRATFORD STA PHASE 2\ISSUE\211439-19 R015 2 - SDC STA PHASE 2 - STUDLEY SCENARIO MODELLING REPORT_ISSUE.DOCX
Page 12
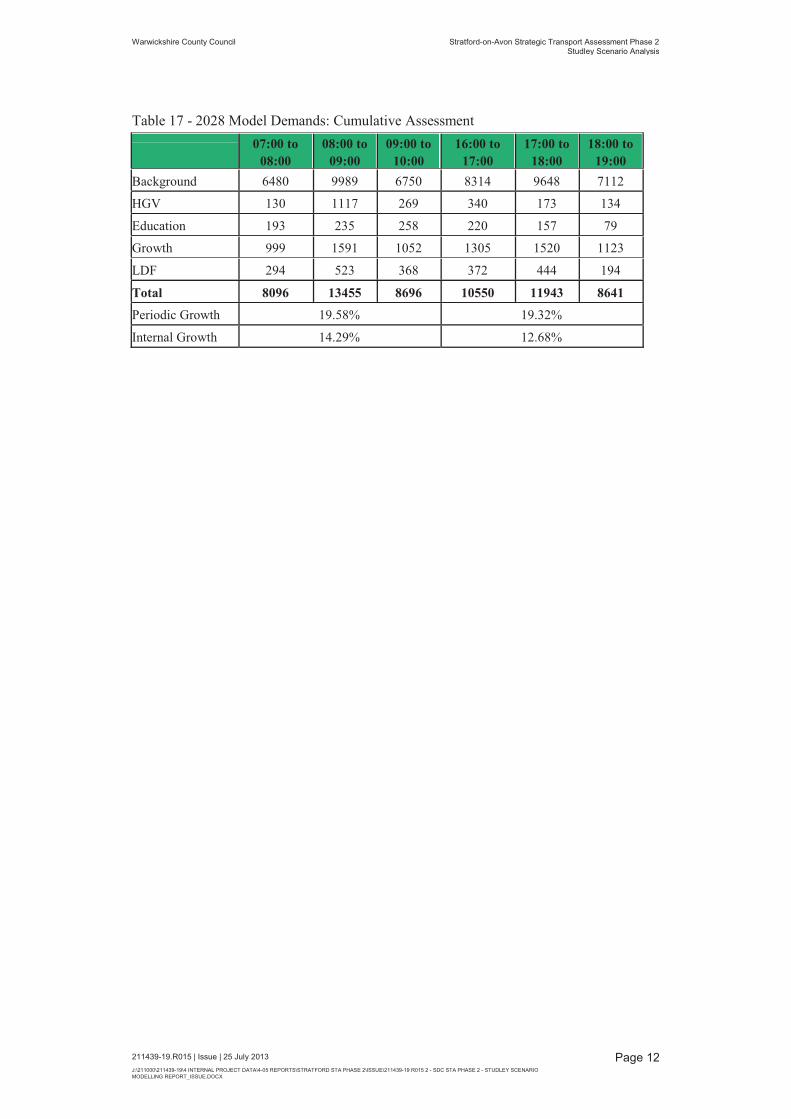
Table 17 - 2028 Model Demands: Cumulative Assessment
07:00 to 08:00
08:00 to 09:00
09:00 to 10:00
16:00 to 17:00
17:00 to 18:00
18:00 to 19:00
Background 6480 9989 6750 8314 9648 7112
HGV 130 1117 269 340 173 134
Education 193 235 258 220 157 79
Growth 999 1591 1052 1305 1520 1123
LDF 294 523 368 372 444 194
Total 8096 13455 8696 10550 11943 8641
Periodic Growth 19.58% 19.32%
Internal Growth 14.29% 12.68%
Warwickshire County Council Stratford-on-Avon Strategic Transport Assessment Phase 2 Studley Scenario Analysis
211439-19.R015 | Issue | 25 July 2013 J:\211000\211439-19\4 INTERNAL PROJECT DATA\4-05 REPORTS\STRATFORD STA PHASE 2\ISSUE\211439-19 R015 2 - SDC STA PHASE 2 - STUDLEY SCENARIO MODELLING REPORT_ISSUE.DOCX
Page 13
3 Results Analysis
3.1 Overview The following sections of the report are intended to present the results obtained from the detailed testing undertaken with the Studley PARAMICS model.
A tiered assessment has been adopted since the results analysis is still largely focussed on a strategic level assessment at this stage. The majority of results analysis that has been undertaken corresponds to the analysis undertaken during the previous stages of the Stratford-on-Avon STA. A number of the measures used to inform the assessment are outlined as follows:
3.2 Model Stability Due to the deterministic nature of assignment within PARAMICS it is possible for vehicles to continue to attempt to enter a network even when congestion has reached such an extent that the network is effectively ‘grid-locked’. In some cases the grid-lock can occur due to problems that will require mitigation, in other cases it can be something as simple as vehicles entering a mini-roundabout from all three approaches at exactly the same time.
When a model becomes grid-locked vehicles still continue to be assigned to the network and so delay begins to increase exponentially. It should be acknowledged that these issues may be occurring due to a need for mitigation in one or more areas of the model but, if the models do not lock up every time it can be concluded that the problem is not severe enough to cause the network to cease to function. Furthermore, the fact that some model runs are completed without mitigation indicates that a mitigation strategy can only provide additional improvements and should be deliverable. If it is model error causing the issues then these results should also be discounted due to the fact that they cannot be considered realistic.
It should also be acknowledged that experience gained elsewhere in the application of PARAMICS micro simulation modelling, in projects of a similar size, has highlighted that the level of instability within the models frequently improves as the options are looked at in more detail. Partly this is because of the fact that, as developments are progressed in isolation, more localised impacts are identified and mitigated than can be achieved during such a high level assessment and partly this is because the existing mitigation that has been proposed will be subject to further refinement and improvement beyond this stage of the assessment.
Twenty model runs were initially undertaken, where model stability has been particularly poor. The propensity for a model to lock up (and thus to be considered to have failed), is assessed to allow the reliability of the model network across the various scenarios to be better understood.
Additional runs were then collected to ensure that, where practicable, model outputs were based on a minimum of ten runs per time period.
Warwickshire County Council Stratford-on-Avon Strategic Transport Assessment Phase 2 Studley Scenario Analysis
211439-19.R015 | Issue | 25 July 2013 J:\211000\211439-19\4 INTERNAL PROJECT DATA\4-05 REPORTS\STRATFORD STA PHASE 2\ISSUE\211439-19 R015 2 - SDC STA PHASE 2 - STUDLEY SCENARIO MODELLING REPORT_ISSUE.DOCX
Page 14
3.3 Number of Runs Network statistics analysis has been based on 10 runs per scenario. Model runs deemed to have failed have been removed from the analysis.
3.4 Network Wide Statistics A number of statistics used in the analysis of the overall level of network performance have been obtained from analysing each individual trip that has occurred within the network. This information is collected within PARAMICS through the Trips-all file and contains information specific to each individual trip that has been completed within the model period. This information is then aggregated and processed to provide the following comparative statistics:
� Average Journey Time (seconds) – The average travel time of a completed trip during the model simulation period.
� Average Distance (Km) – The average distance travelled by a vehicle that completed their journey during the model simulation period.
� Average Speed (Km/h) – The average speed travelled by all vehicles that completed a journey during the model simulation period.
� Completed Trips (vehicles) – The number of completed trips recorded during the model simulation.
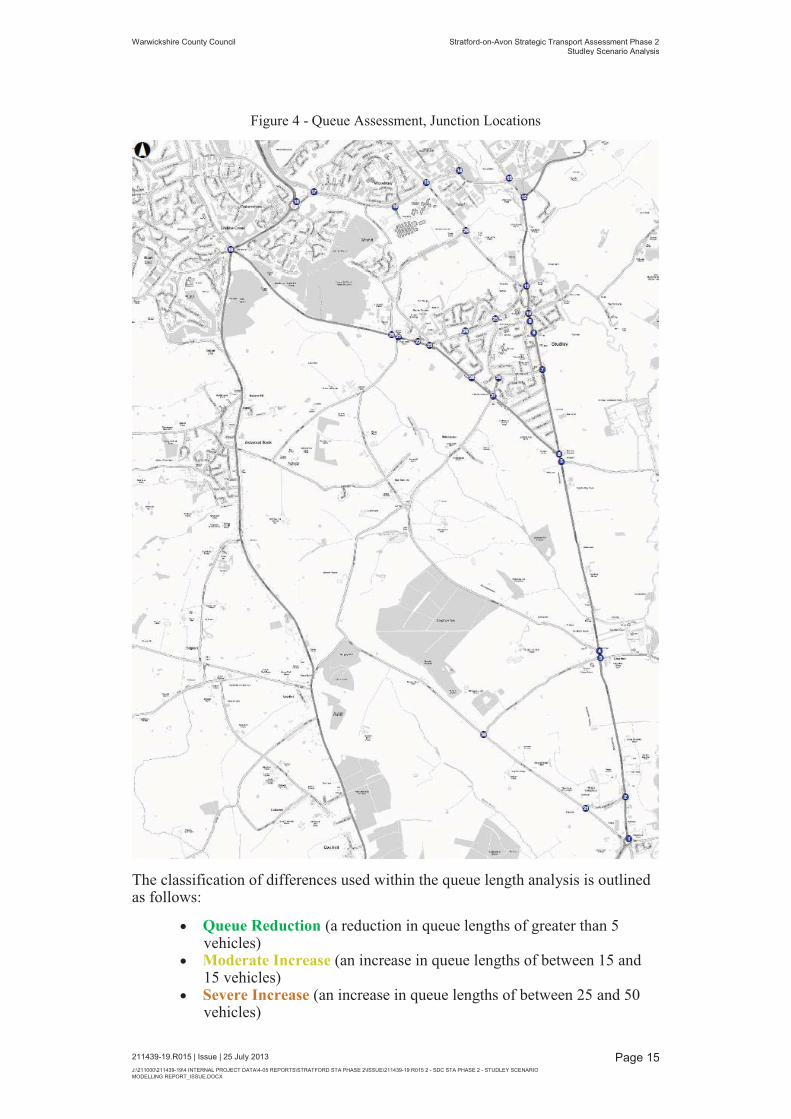
3.5 Average Maximum Queue Length Analysis A second, more detailed, level of analysis has been undertaken in the form of queue length analysis. Queue length analysis is intended to accompany the mean speed analysis as it provides a more detailed picture of the impacts at specific junctions within the model network.
At this stage the analysis of queue lengths has been based on the average hourly maximum queue length. Results presented for each junction are based on the worst performing single approach. The hourly maximum for each individual model run has been calculated and then the average of all runs has been calculated for each hour. The average of these values, across all model hours, is reported as the periodic average maximum queue length and is reported in vehicles.
The junctions for which average hourly maximum queue lengths have been calculated and compared are illustrated within the following Figure 4:
Junctions where queue differences have not been plotted on the maps represent junctions which did not trigger any of the assessment criteria across any one approach.
At this stage these results simply identify areas where further attention is required. A queue length increase of 50 vehicles does not necessarily mean that a scheme will not work, it may indicate that further optimisation of the layout or any signal times are required. Furthermore it may not account for improvements on other arms of the same junction which, when investigated further, may contain additional capacity which could be unlocked to reduce the queue length on the offending approach.
Warwickshire County Council Stratford-on-Avon Strategic Transport Assessment Phase 2 Studley Scenario Analysis
211439-19.R015 | Issue | 25 July 2013 J:\211000\211439-19\4 INTERNAL PROJECT DATA\4-05 REPORTS\STRATFORD STA PHASE 2\ISSUE\211439-19 R015 2 - SDC STA PHASE 2 - STUDLEY SCENARIO MODELLING REPORT_ISSUE.DOCX
Page 15
Figure 4 - Queue Assessment, Junction Locations
The classification of differences used within the queue length analysis is outlined as follows:
� Queue Reduction (a reduction in queue lengths of greater than 5 vehicles)
� Moderate Increase (an increase in queue lengths of between 15 and 15 vehicles)
� Severe Increase (an increase in queue lengths of between 25 and 50 vehicles)

Warwickshire County Council Stratford-on-Avon Strategic Transport Assessment Phase 2 Studley Scenario Analysis
211439-19.R015 | Issue | 25 July 2013 J:\211000\211439-19\4 INTERNAL PROJECT DATA\4-05 REPORTS\STRATFORD STA PHASE 2\ISSUE\211439-19 R015 2 - SDC STA PHASE 2 - STUDLEY SCENARIO MODELLING REPORT_ISSUE.DOCX
Page 16
� Very Severe Increase (an increase in queue length of over 50 vehicles)
3.6 Additional Analysis In addition to the measures outlined previously, in some cases, specific types of analysis have been used to inform certain stages of the analysis. Where this has been necessary the method of extraction and the measures presented have been detailed within the relevant sections of this report.
Warwickshire County Council Stratford-on-Avon Strategic Transport Assessment Phase 2 Studley Scenario Analysis
211439-19.R015 | Issue | 25 July 2013 J:\211000\211439-19\4 INTERNAL PROJECT DATA\4-05 REPORTS\STRATFORD STA PHASE 2\ISSUE\211439-19 R015 2 - SDC STA PHASE 2 - STUDLEY SCENARIO MODELLING REPORT_ISSUE.DOCX
Page 17
4 Studley Scenario Testing – Outline Impact Analysis
4.1 2028 Core Strategy Allocation: Results Analysis The following section of this reports details the results that have been extracted from the five key scenarios namely:
� 2028 Reference Case (Ref) � 2028 Edge of Studley (EoS) � 2028 Mappleborough Green (MG) � 2028 Winyates Green/Gorcott Hill (WG/GH) � 2028 ‘All Developments’ Cumulative Assessment (CA)
4.2 Model Stability An initial assessment of the level of model stability was undertaken by comparing the number of completed runs against the number of runs assumed to have failed, as outlined earlier within section 3.2 of this report.
The apparent network stability exhibited within the AM and PM simulation runs across the two scenarios is illustrated within the following Table 18:
Table 18 - Model Stability Assessment 2028 Studley Core Strategy Scenarios Ref EoS MG WG CA
AM 75% 75% 85% 60% 55%
PM 95% 85% 95% 85% 85%
Given the relatively limited sample size of 20 runs it is reasonable to conclude, from the previous table, that there are no notable differences between the scenarios when considering network stability within the PM period. All scenarios effectively demonstrate the same level of stability to within two runs.
Similarly within the AM, EoS and MG demonstrate levels of stability in line with those experienced within the 2028 Ref Case. There is however, a notable reduction in the levels of stability exhibited within the WG/GH and CA scenarios. This is likely to indicate that there are problems occurring within these model networks that are increasing the propensity for the model to ‘lock-up’. These occurrences may indicate the need for mitigation measures to better accommodate the flow of traffic across certain sections of the network. The drop in stability could be considered to be an early indicator that mitigation measures are likely to be required to accompany both the WG/GH and CA approach to the allocation of land for development within the area.
4.3 Network Wide Statistics The following sets out the changes in network wide statistics between the 2028 Reference Case and the four Allocation scenarios.
Warwickshire County Council Stratford-on-Avon Strategic Transport Assessment Phase 2 Studley Scenario Analysis
211439-19.R015 | Issue | 25 July 2013 J:\211000\211439-19\4 INTERNAL PROJECT DATA\4-05 REPORTS\STRATFORD STA PHASE 2\ISSUE\211439-19 R015 2 - SDC STA PHASE 2 - STUDLEY SCENARIO MODELLING REPORT_ISSUE.DOCX
Page 18
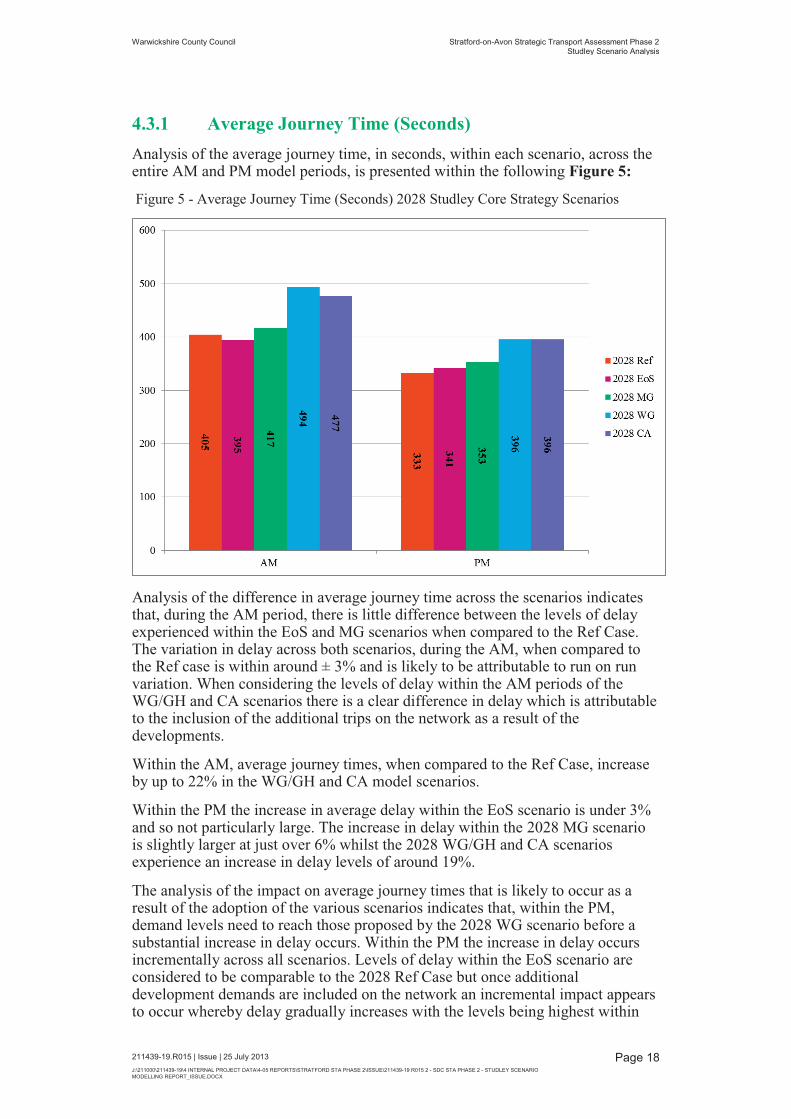
4.3.1 Average Journey Time (Seconds) Analysis of the average journey time, in seconds, within each scenario, across the entire AM and PM model periods, is presented within the following Figure 5:
Figure 5 - Average Journey Time (Seconds) 2028 Studley Core Strategy Scenarios
Analysis of the difference in average journey time across the scenarios indicates that, during the AM period, there is little difference between the levels of delay experienced within the EoS and MG scenarios when compared to the Ref Case. The variation in delay across both scenarios, during the AM, when compared to the Ref case is within around ± 3% and is likely to be attributable to run on run variation. When considering the levels of delay within the AM periods of the WG/GH and CA scenarios there is a clear difference in delay which is attributable to the inclusion of the additional trips on the network as a result of the developments.
Within the AM, average journey times, when compared to the Ref Case, increase by up to 22% in the WG/GH and CA model scenarios.
Within the PM the increase in average delay within the EoS scenario is under 3% and so not particularly large. The increase in delay within the 2028 MG scenario is slightly larger at just over 6% whilst the 2028 WG/GH and CA scenarios experience an increase in delay levels of around 19%.
The analysis of the impact on average journey times that is likely to occur as a result of the adoption of the various scenarios indicates that, within the PM, demand levels need to reach those proposed by the 2028 WG scenario before a substantial increase in delay occurs. Within the PM the increase in delay occurs incrementally across all scenarios. Levels of delay within the EoS scenario are considered to be comparable to the 2028 Ref Case but once additional development demands are included on the network an incremental impact appears to occur whereby delay gradually increases with the levels being highest within
Warwickshire County Council Stratford-on-Avon Strategic Transport Assessment Phase 2 Studley Scenario Analysis
211439-19.R015 | Issue | 25 July 2013 J:\211000\211439-19\4 INTERNAL PROJECT DATA\4-05 REPORTS\STRATFORD STA PHASE 2\ISSUE\211439-19 R015 2 - SDC STA PHASE 2 - STUDLEY SCENARIO MODELLING REPORT_ISSUE.DOCX
Page 19
the 2028 WG/GH and CA scenarios. This is to be expected as it is these scenarios which allocate the highest levels of demand to the network.
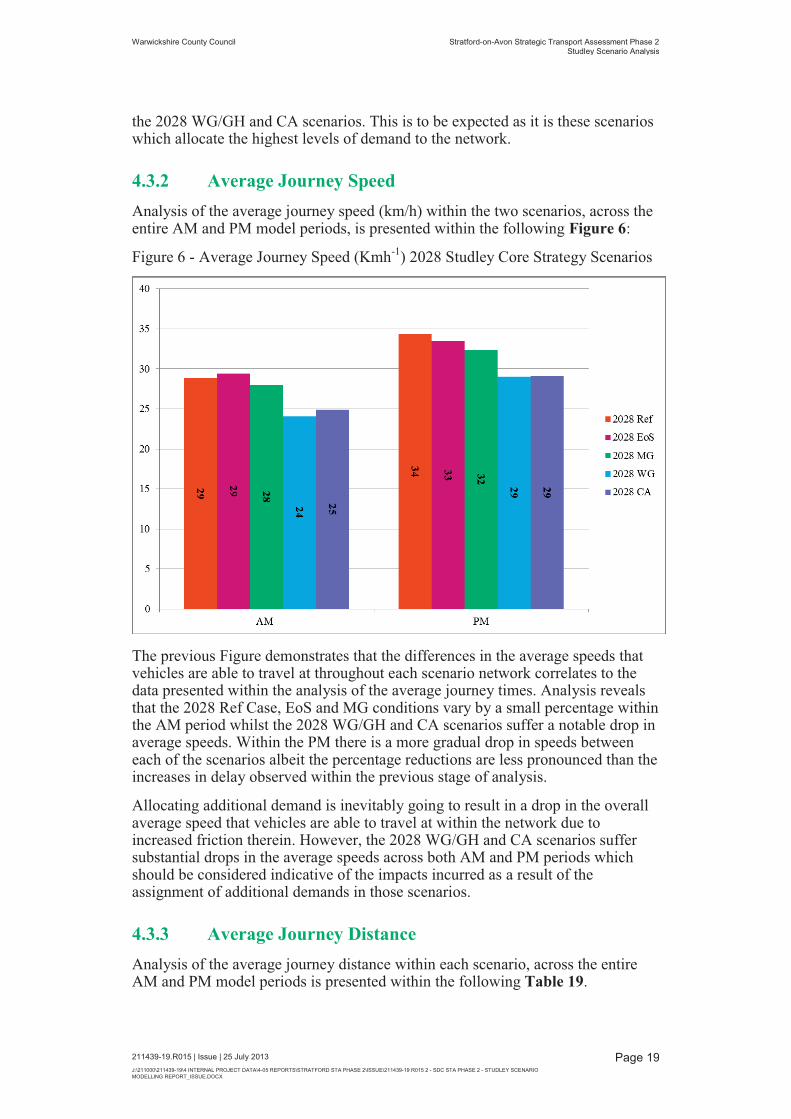
4.3.2 Average Journey Speed Analysis of the average journey speed (km/h) within the two scenarios, across the entire AM and PM model periods, is presented within the following Figure 6:
Figure 6 - Average Journey Speed (Kmh-1) 2028 Studley Core Strategy Scenarios
The previous Figure demonstrates that the differences in the average speeds that vehicles are able to travel at throughout each scenario network correlates to the data presented within the analysis of the average journey times. Analysis reveals that the 2028 Ref Case, EoS and MG conditions vary by a small percentage within the AM period whilst the 2028 WG/GH and CA scenarios suffer a notable drop in average speeds. Within the PM there is a more gradual drop in speeds between each of the scenarios albeit the percentage reductions are less pronounced than the increases in delay observed within the previous stage of analysis.
Allocating additional demand is inevitably going to result in a drop in the overall average speed that vehicles are able to travel at within the network due to increased friction therein. However, the 2028 WG/GH and CA scenarios suffer substantial drops in the average speeds across both AM and PM periods which should be considered indicative of the impacts incurred as a result of the assignment of additional demands in those scenarios.
4.3.3 Average Journey Distance Analysis of the average journey distance within each scenario, across the entire AM and PM model periods is presented within the following Table 19.
Warwickshire County Council Stratford-on-Avon Strategic Transport Assessment Phase 2 Studley Scenario Analysis
211439-19.R015 | Issue | 25 July 2013 J:\211000\211439-19\4 INTERNAL PROJECT DATA\4-05 REPORTS\STRATFORD STA PHASE 2\ISSUE\211439-19 R015 2 - SDC STA PHASE 2 - STUDLEY SCENARIO MODELLING REPORT_ISSUE.DOCX
Page 20
Table 19 Average Journey Distance (Km) 2028 Studley Core Strategy Scenarios 2028 Ref 2028 EoS 2028 MG 2028 WG 2028 CA
AM 3.2 3.2 3.2 3.3 3.3
PM 3.2 3.2 3.2 3.2 3.2
Analysis of the previous table reveals very little difference in the average distances that vehicles travel within each of the scenarios. This indicates that the propensity for vehicles to switch onto alternative routes when faced with increased delay and congestion is likely to be limited. This is to be expected given the limited number of routes through Studley.
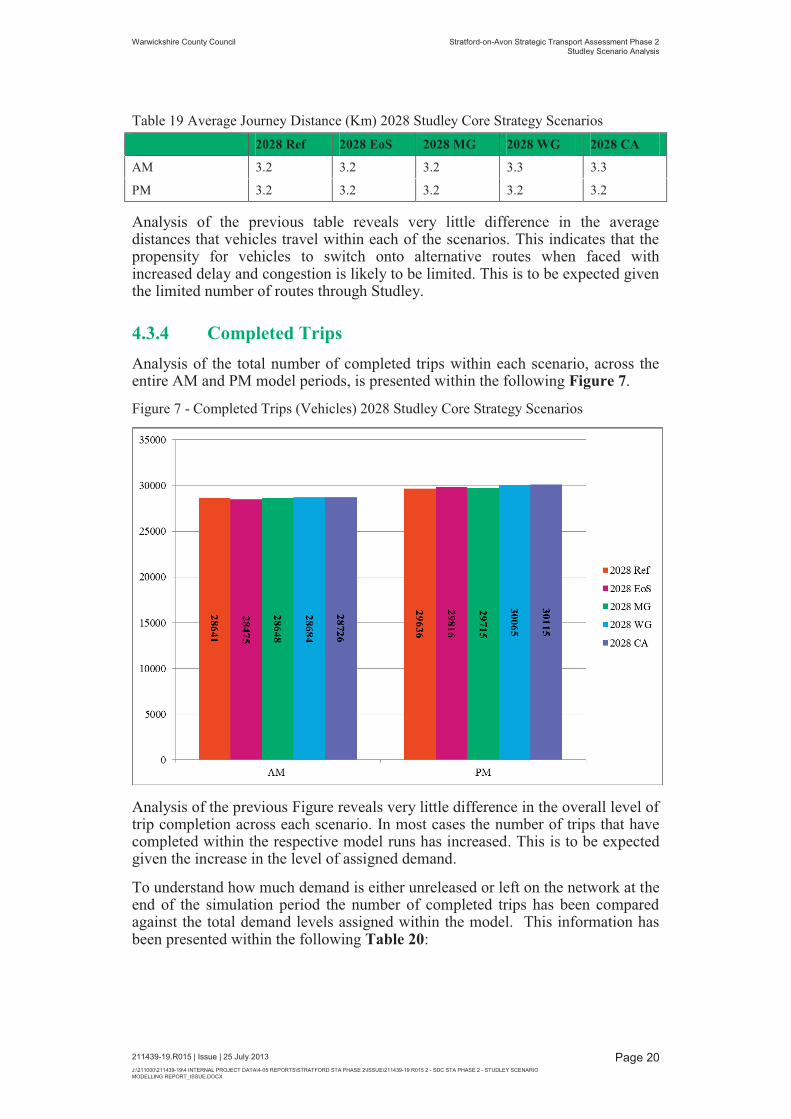
4.3.4 Completed Trips Analysis of the total number of completed trips within each scenario, across the entire AM and PM model periods, is presented within the following Figure 7.
Figure 7 - Completed Trips (Vehicles) 2028 Studley Core Strategy Scenarios
Analysis of the previous Figure reveals very little difference in the overall level of trip completion across each scenario. In most cases the number of trips that have completed within the respective model runs has increased. This is to be expected given the increase in the level of assigned demand.
To understand how much demand is either unreleased or left on the network at the end of the simulation period the number of completed trips has been compared against the total demand levels assigned within the model. This information has been presented within the following Table 20:
Warwickshire County Council Stratford-on-Avon Strategic Transport Assessment Phase 2 Studley Scenario Analysis
211439-19.R015 | Issue | 25 July 2013 J:\211000\211439-19\4 INTERNAL PROJECT DATA\4-05 REPORTS\STRATFORD STA PHASE 2\ISSUE\211439-19 R015 2 - SDC STA PHASE 2 - STUDLEY SCENARIO MODELLING REPORT_ISSUE.DOCX
Page 21
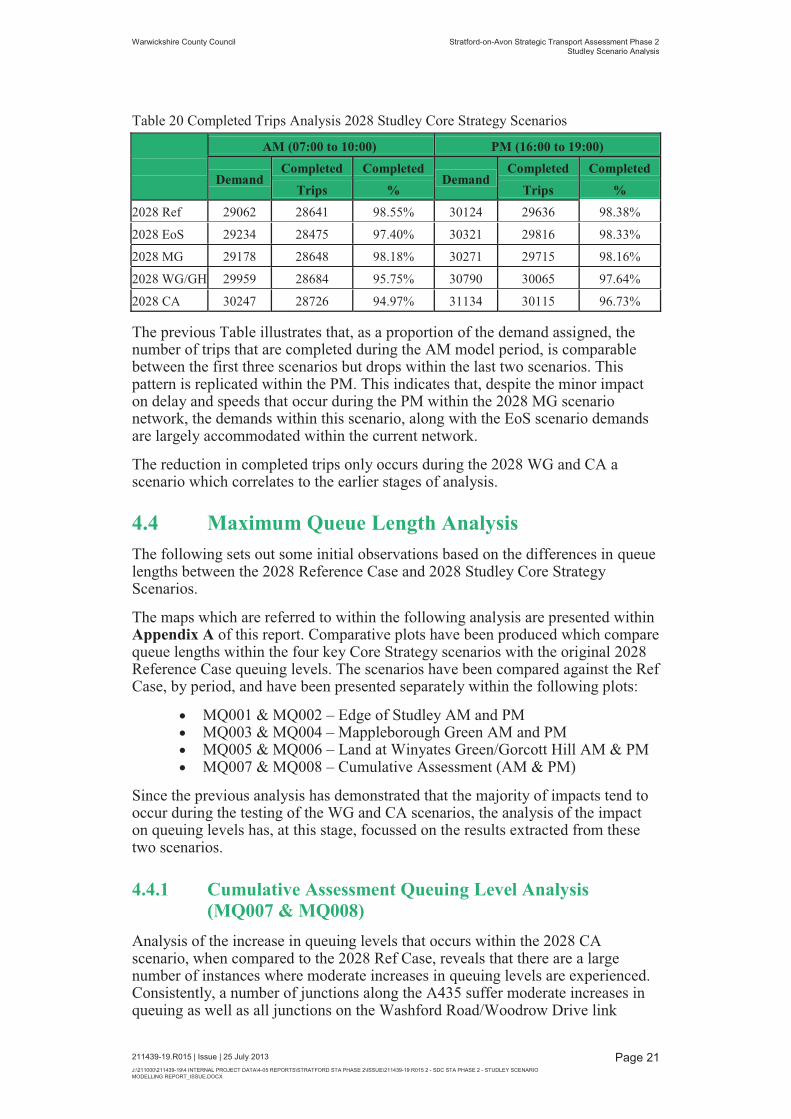
Table 20 Completed Trips Analysis 2028 Studley Core Strategy Scenarios
AM (07:00 to 10:00) PM (16:00 to 19:00)
Demand Completed Completed
Demand Completed Completed
Trips % Trips % 2028 Ref 29062 28641 98.55% 30124 29636 98.38%
2028 EoS 29234 28475 97.40% 30321 29816 98.33%
2028 MG 29178 28648 98.18% 30271 29715 98.16%
2028 WG/GH 29959 28684 95.75% 30790 30065 97.64%
2028 CA 30247 28726 94.97% 31134 30115 96.73%
The previous Table illustrates that, as a proportion of the demand assigned, the number of trips that are completed during the AM model period, is comparable between the first three scenarios but drops within the last two scenarios. This pattern is replicated within the PM. This indicates that, despite the minor impact on delay and speeds that occur during the PM within the 2028 MG scenario network, the demands within this scenario, along with the EoS scenario demands are largely accommodated within the current network.
The reduction in completed trips only occurs during the 2028 WG and CA a scenario which correlates to the earlier stages of analysis.
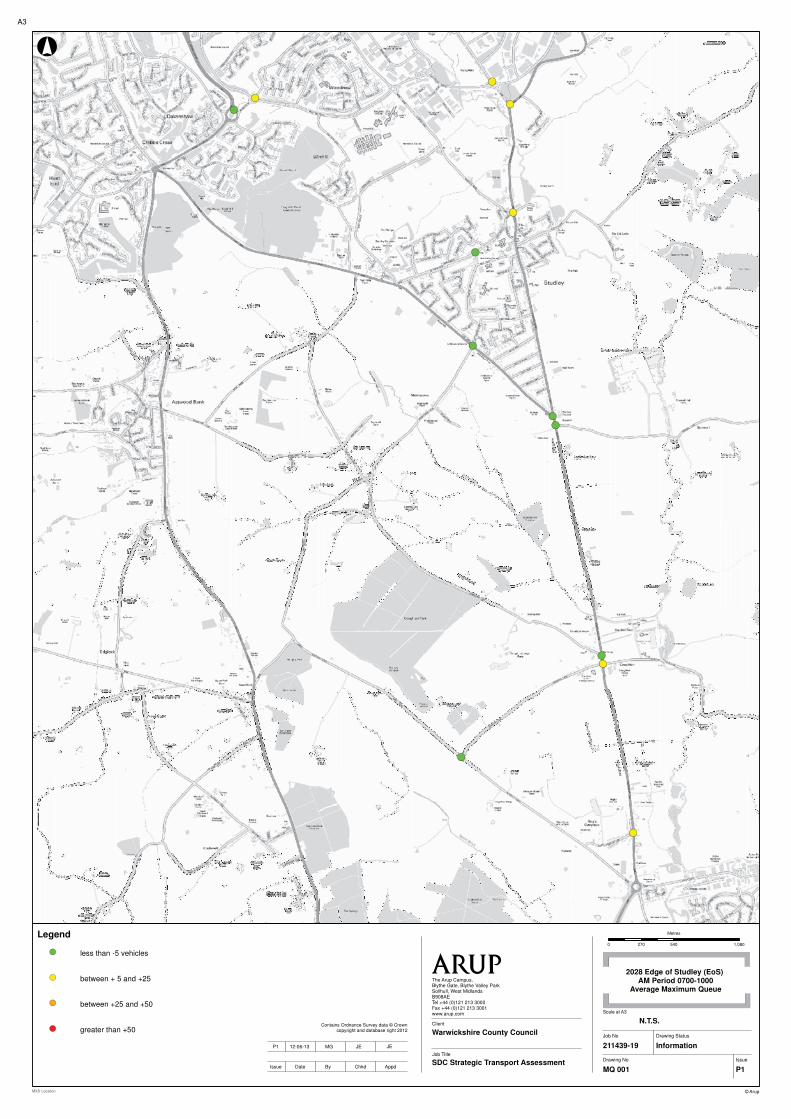
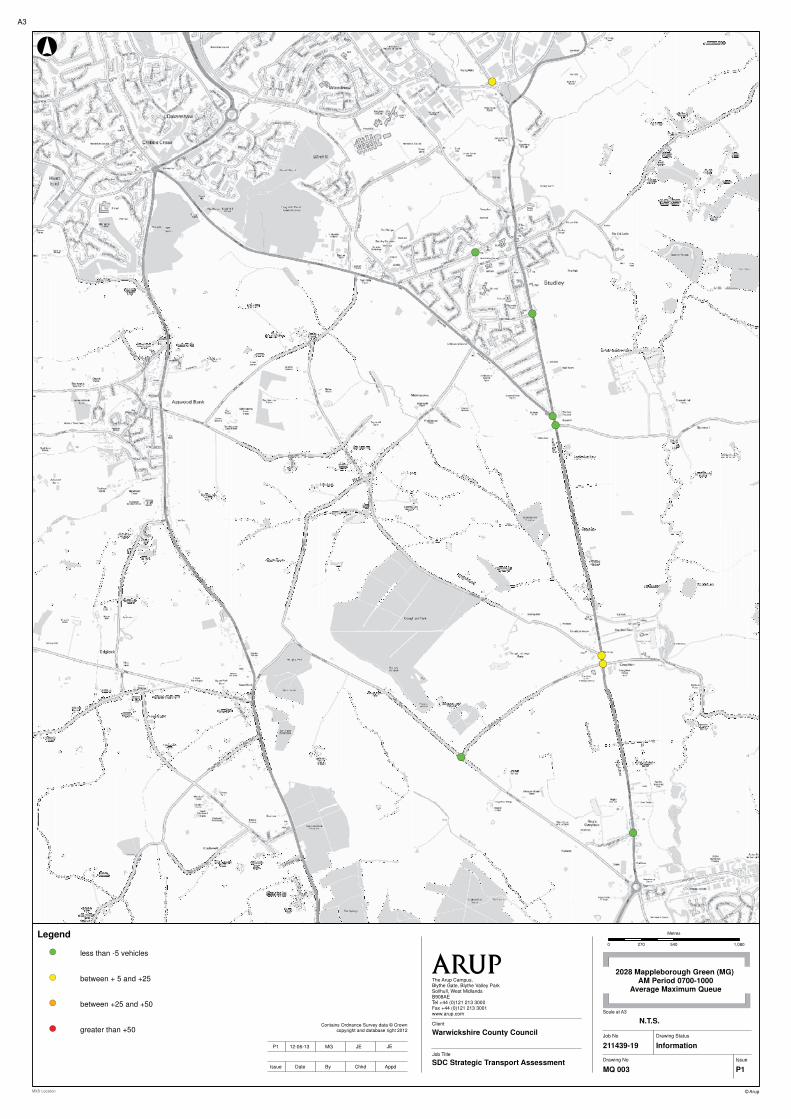
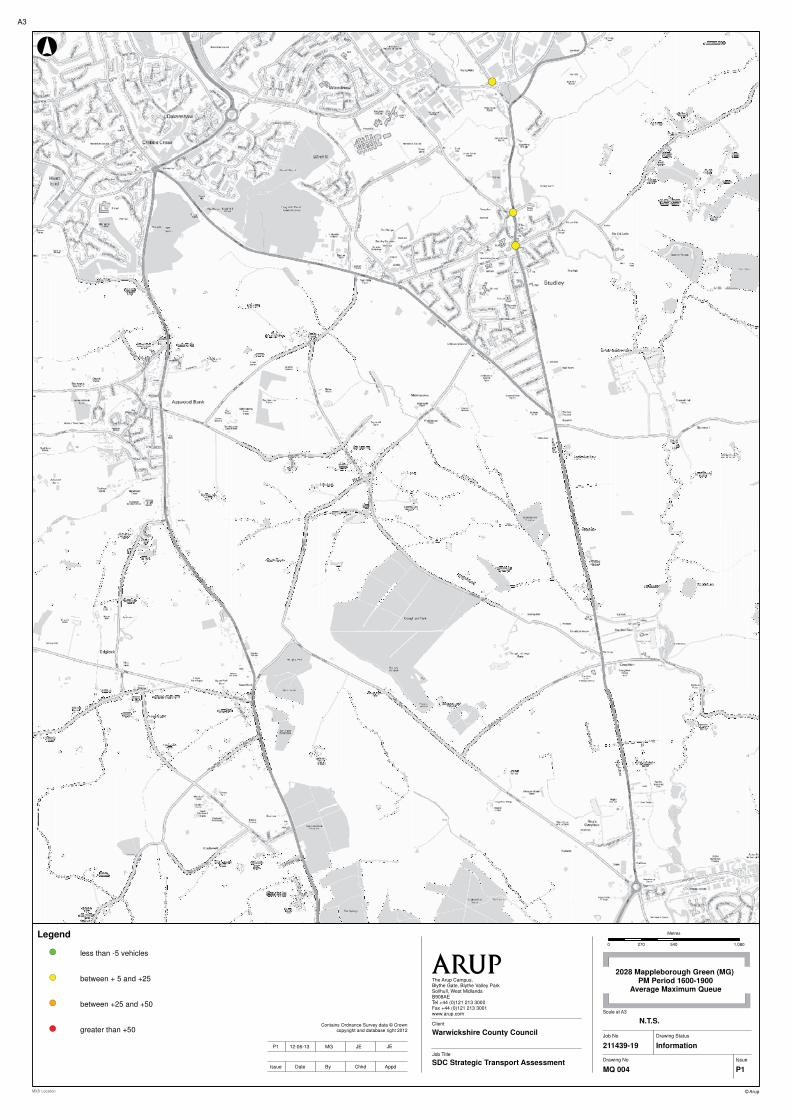
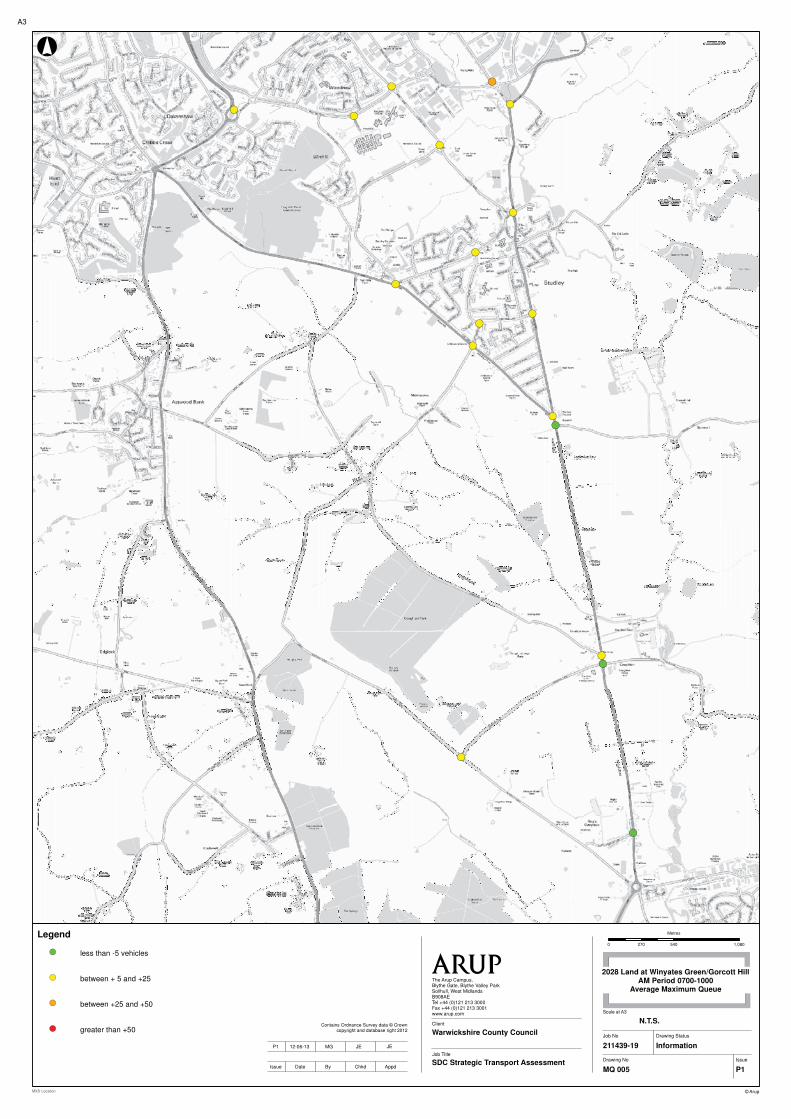
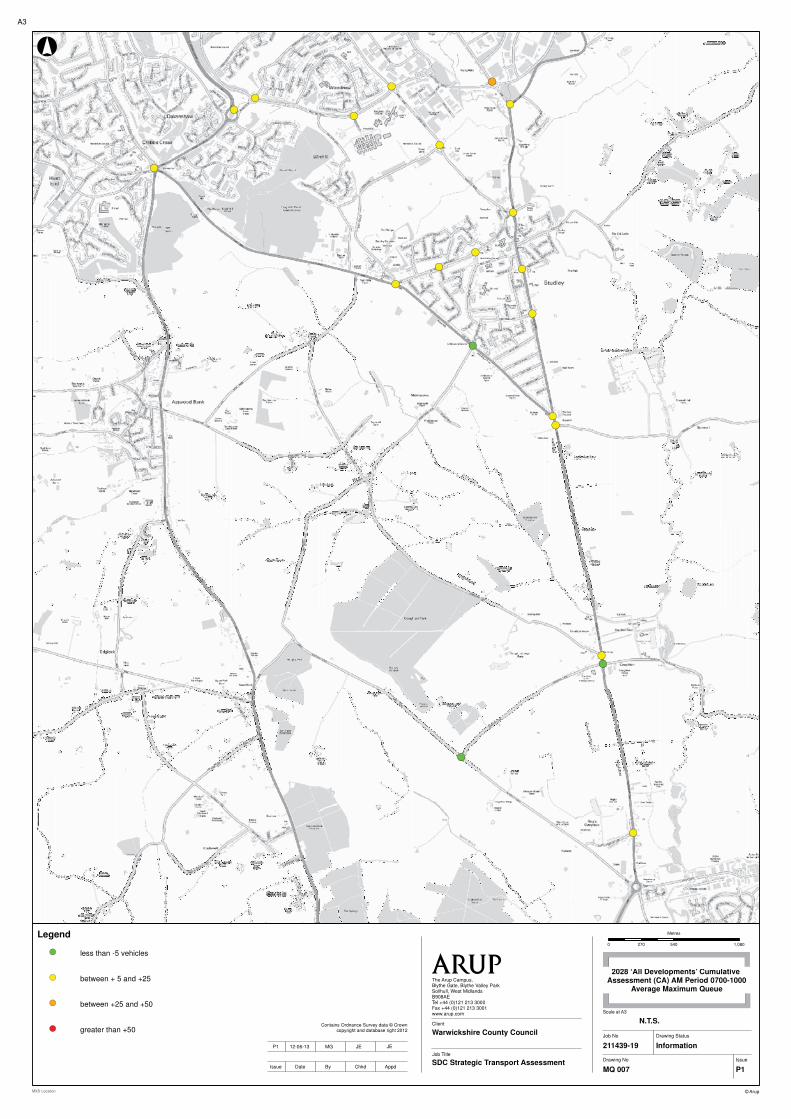
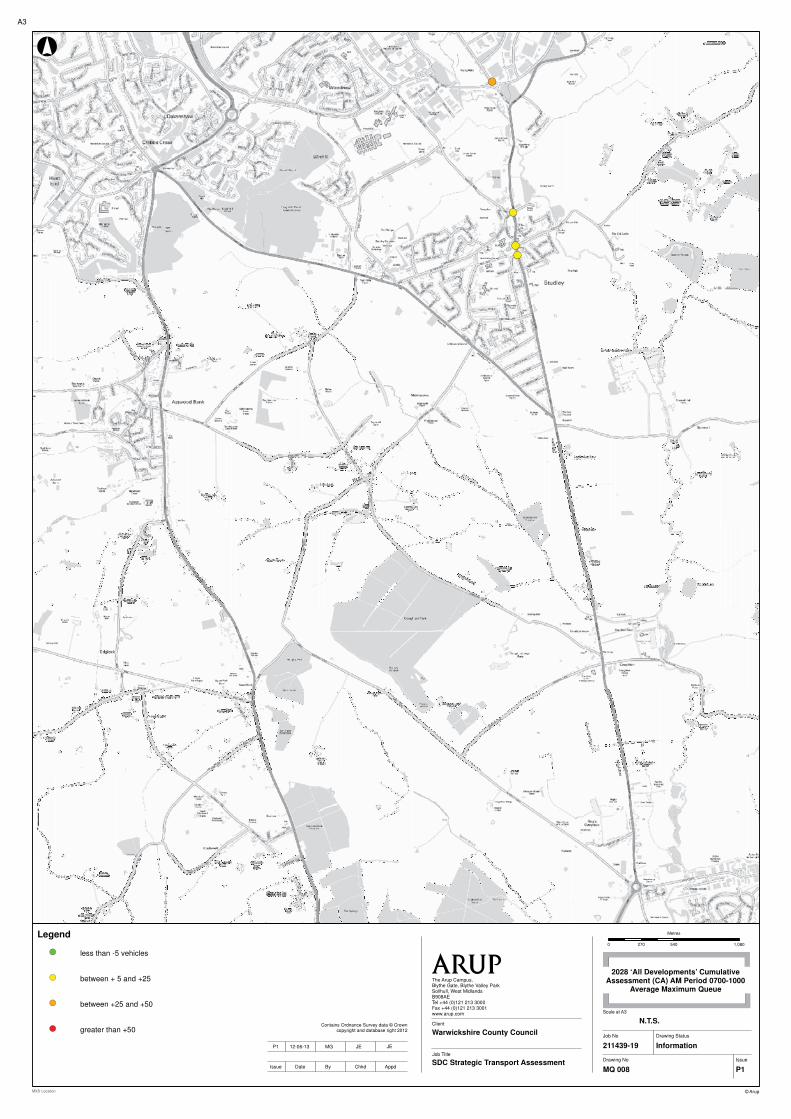
4.4 Maximum Queue Length Analysis The following sets out some initial observations based on the differences in queue lengths between the 2028 Reference Case and 2028 Studley Core Strategy Scenarios.
The maps which are referred to within the following analysis are presented within Appendix A of this report. Comparative plots have been produced which compare queue lengths within the four key Core Strategy scenarios with the original 2028 Reference Case queuing levels. The scenarios have been compared against the Ref Case, by period, and have been presented separately within the following plots:
� MQ001 & MQ002 – Edge of Studley AM and PM � MQ003 & MQ004 – Mappleborough Green AM and PM � MQ005 & MQ006 – Land at Winyates Green/Gorcott Hill AM & PM � MQ007 & MQ008 – Cumulative Assessment (AM & PM)
Since the previous analysis has demonstrated that the majority of impacts tend to occur during the testing of the WG and CA scenarios, the analysis of the impact on queuing levels has, at this stage, focussed on the results extracted from these two scenarios.
4.4.1 Cumulative Assessment Queuing Level Analysis (MQ007 & MQ008)
Analysis of the increase in queuing levels that occurs within the 2028 CA scenario, when compared to the 2028 Ref Case, reveals that there are a large number of instances where moderate increases in queuing levels are experienced. Consistently, a number of junctions along the A435 suffer moderate increases in queuing as well as all junctions on the Washford Road/Woodrow Drive link
Warwickshire County Council Stratford-on-Avon Strategic Transport Assessment Phase 2 Studley Scenario Analysis
211439-19.R015 | Issue | 25 July 2013 J:\211000\211439-19\4 INTERNAL PROJECT DATA\4-05 REPORTS\STRATFORD STA PHASE 2\ISSUE\211439-19 R015 2 - SDC STA PHASE 2 - STUDLEY SCENARIO MODELLING REPORT_ISSUE.DOCX
Page 22
between the A435 and the A441. Similarly the junctions along Station Road in Studley suffer the same magnitude of increases.
The only location where a severe increase in queuing levels occurs, when comparing the 2028 CA conditions with the 2028 Ref conditions, is the Icknield St Dr/Claybrook Dr/Washford Dr roundabout. This indicates that any proposed approach to the mitigation of potential impacts, as far as the cumulative scenario is concerned, should focus firstly on the conditions at this junction.
Within the PM there is a marked reduction in the number of junctions which suffer increases in queuing levels compared to the 2028 Ref Case. Notably however the Icknield St Dr/Claybrook Dr/Washford Dr roundabout suffers a severe increase in queuing levels within the PM and this correlates with the impacts observed during the AM. In addition to the aforementioned severe increase there are 3 locations which suffer moderate increases in queue lengths namely:
� A435 Birmingham Road/Redditch Road � A435 Alcester Road/Castle Rd � A435 Alcester Road/New Road
The queue increase which occurs at the A435 Birmingham Road/Redditch Road roundabout mirrors that which occurs within the AM analysis and, as such, is likely to indicate that additional mitigation may be required within this area should either the land at Winyates Green/Gorcott Hill or all development sites be allocated.
4.4.2 Winyates Green/Gorcott Hill Queuing Level Analysis (MQ005 & MQ006)
In general, when assessing the impact of the WG/GH scenario the impacts appear to mirror those which occur within the cumulative assessment. It is therefore reasonable to assume that the majority of the impacts that have been identified previously are primarily attributable to the delivery of these two sites, detailed analysis may reveal a difference in the magnitude of impact between the WG and CA scenarios but these differences are unlikely to be significant when considered alongside the magnitude of difference between either of these scenarios and the 2028 Ref Case.
4.5 Summary Whilst more detailed analysis is still required to determine any localised impacts that are likely to occur as a result of the delivery of one or all of the potential development sites, the initial analysis set out within the previous section of this report reveals the following:
� That, within the AM there is little impact on the key network performance indicators when considering the 2028 EoS or 2028 MG scenarios vs. the 2028 Ref Case.
� That, within the PM there is an incremental increase in the impact on average delay and vehicle speeds across the 2028 MG, 2028 WG/GH and 2028 CA scenarios. A small impact is determinable when
Warwickshire County Council Stratford-on-Avon Strategic Transport Assessment Phase 2 Studley Scenario Analysis
211439-19.R015 | Issue | 25 July 2013 J:\211000\211439-19\4 INTERNAL PROJECT DATA\4-05 REPORTS\STRATFORD STA PHASE 2\ISSUE\211439-19 R015 2 - SDC STA PHASE 2 - STUDLEY SCENARIO MODELLING REPORT_ISSUE.DOCX
Page 23
assessing the impacts of the 2028 MG scenario and these impacts increase when considering the 2028 WG/GH and CA scenarios
� There is little difference in the network performance indicators between the 2028 WG/GH and 2028 CA scenarios which is likely to indicate that the primary contributing factor to the occurrence of the impacts is the vehicular demand associated with the land at Winyates Green/Gorcott Hill.
� When considering the impact of the 2028 CA scenario the impacts on queuing across the network appear to be more widespread with impacts occurring along the A435, Station Road and Woodrow Drive/Washford Drive corridors. Within the PM the impacts are concentrated around the Icknield St Dr/Claybrook Dr/Washford Dr and A435 Birmingham Road/Redditch Road roundabouts.
� The impacts on queuing observed when assessing the CA scenario are largely mirrored when considering the impact, on queuing levels, of the WG/GH scenario in isolation; this indicates that the demand associated with these employment sites is likely to be the primary contributing factor to the increases in queuing levels.
Warwickshire County Council Stratford-on-Avon Strategic Transport Assessment Phase 2 Studley Scenario Analysis
211439-19.R015 | Issue | 25 July 2013 J:\211000\211439-19\4 INTERNAL PROJECT DATA\4-05 REPORTS\STRATFORD STA PHASE 2\ISSUE\211439-19 R015 2 - SDC STA PHASE 2 - STUDLEY SCENARIO MODELLING REPORT_ISSUE.DOCX
Page 24
5 AQMA Analysis
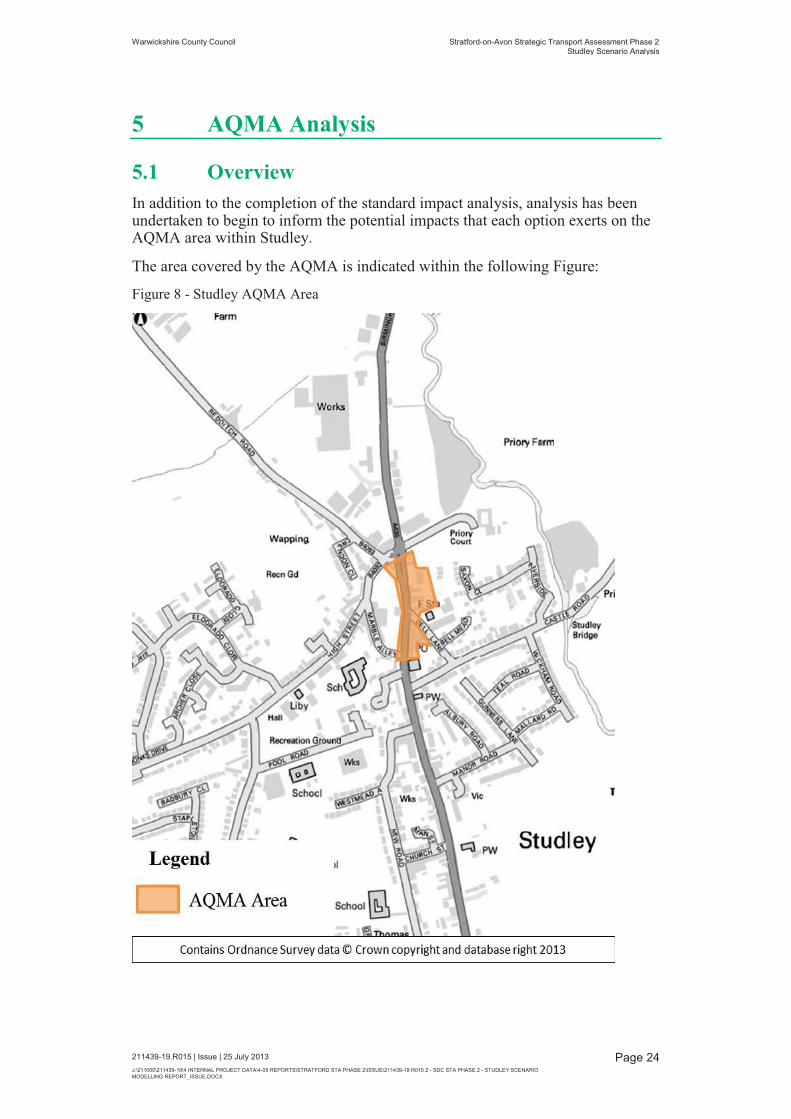
5.1 Overview In addition to the completion of the standard impact analysis, analysis has been undertaken to begin to inform the potential impacts that each option exerts on the AQMA area within Studley.
The area covered by the AQMA is indicated within the following Figure:
Figure 8 - Studley AQMA Area
Warwickshire County Council Stratford-on-Avon Strategic Transport Assessment Phase 2 Studley Scenario Analysis
211439-19.R015 | Issue | 25 July 2013 J:\211000\211439-19\4 INTERNAL PROJECT DATA\4-05 REPORTS\STRATFORD STA PHASE 2\ISSUE\211439-19 R015 2 - SDC STA PHASE 2 - STUDLEY SCENARIO MODELLING REPORT_ISSUE.DOCX
Page 25
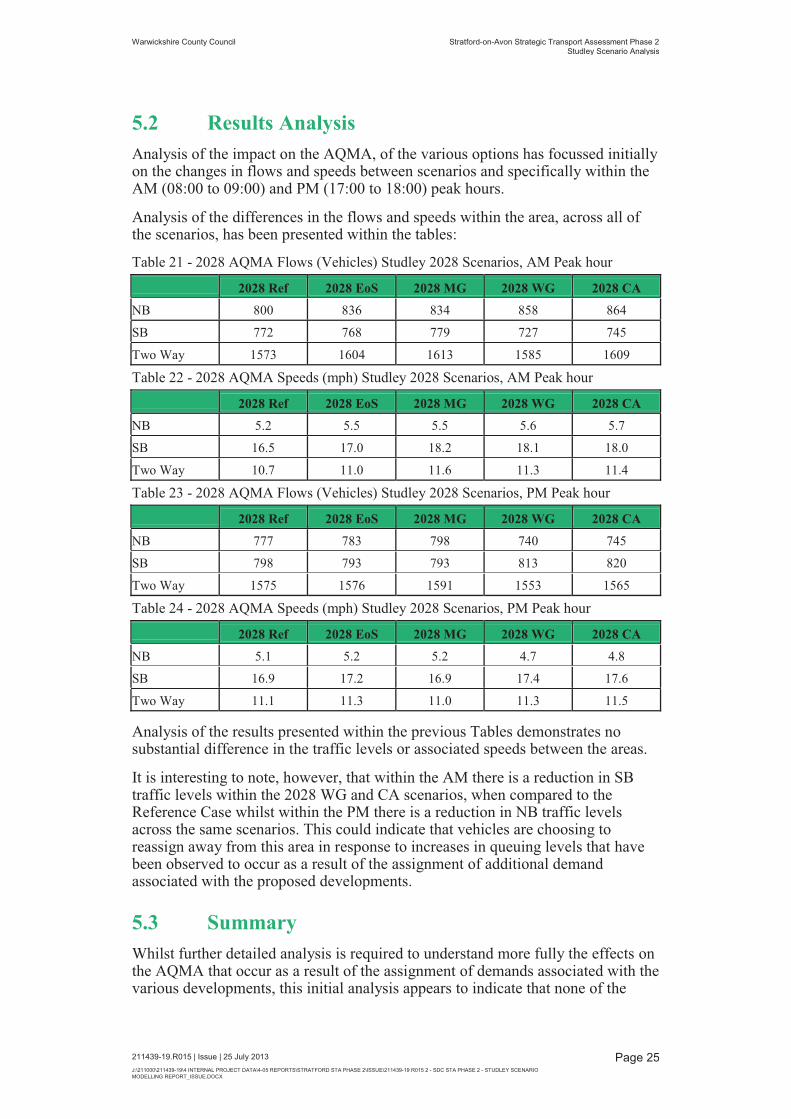
5.2 Results Analysis Analysis of the impact on the AQMA, of the various options has focussed initially on the changes in flows and speeds between scenarios and specifically within the AM (08:00 to 09:00) and PM (17:00 to 18:00) peak hours.
Analysis of the differences in the flows and speeds within the area, across all of the scenarios, has been presented within the tables:
Table 21 - 2028 AQMA Flows (Vehicles) Studley 2028 Scenarios, AM Peak hour 2028 Ref 2028 EoS 2028 MG 2028 WG 2028 CA
NB 800 836 834 858 864
SB 772 768 779 727 745
Two Way 1573 1604 1613 1585 1609
Table 22 - 2028 AQMA Speeds (mph) Studley 2028 Scenarios, AM Peak hour 2028 Ref 2028 EoS 2028 MG 2028 WG 2028 CA
NB 5.2 5.5 5.5 5.6 5.7
SB 16.5 17.0 18.2 18.1 18.0
Two Way 10.7 11.0 11.6 11.3 11.4
Table 23 - 2028 AQMA Flows (Vehicles) Studley 2028 Scenarios, PM Peak hour 2028 Ref 2028 EoS 2028 MG 2028 WG 2028 CA
NB 777 783 798 740 745
SB 798 793 793 813 820
Two Way 1575 1576 1591 1553 1565
Table 24 - 2028 AQMA Speeds (mph) Studley 2028 Scenarios, PM Peak hour 2028 Ref 2028 EoS 2028 MG 2028 WG 2028 CA
NB 5.1 5.2 5.2 4.7 4.8
SB 16.9 17.2 16.9 17.4 17.6
Two Way 11.1 11.3 11.0 11.3 11.5
Analysis of the results presented within the previous Tables demonstrates no substantial difference in the traffic levels or associated speeds between the areas.
It is interesting to note, however, that within the AM there is a reduction in SB traffic levels within the 2028 WG and CA scenarios, when compared to the Reference Case whilst within the PM there is a reduction in NB traffic levels across the same scenarios. This could indicate that vehicles are choosing to reassign away from this area in response to increases in queuing levels that have been observed to occur as a result of the assignment of additional demand associated with the proposed developments.
5.3 Summary Whilst further detailed analysis is required to understand more fully the effects on the AQMA that occur as a result of the assignment of demands associated with the various developments, this initial analysis appears to indicate that none of the
Warwickshire County Council Stratford-on-Avon Strategic Transport Assessment Phase 2 Studley Scenario Analysis
211439-19.R015 | Issue | 25 July 2013 J:\211000\211439-19\4 INTERNAL PROJECT DATA\4-05 REPORTS\STRATFORD STA PHASE 2\ISSUE\211439-19 R015 2 - SDC STA PHASE 2 - STUDLEY SCENARIO MODELLING REPORT_ISSUE.DOCX
Page 26
options that have been tested result in a significant impact on flows and speeds within the AQMA area.
Given that the impact analysis of the scenarios tends to indicate that the WG/GH and cumulative scenarios are likely to impact upon the junctions within the middle of Studley the impacts on the AQMA area appears contradictory. However, further analysis of the queuing on the approaches to the A435/Redditch Road junction is already forecast to be extensive within the Reference Case network. Thus, the impacts that have been identified during the previous stage of analysis tend to lie outside of the AQMA area. This is likely to be a significant consideration should the coverage of the AQMA be extended at any point in the future as such an extension would mean the inclusion of these potential developments would likely have a negative impact on the AQMA area in terms of speeds and flow.
Warwickshire County Council Stratford-on-Avon Strategic Transport Assessment Phase 2 Studley Scenario Analysis
211439-19.R015 | Issue | 25 July 2013 J:\211000\211439-19\4 INTERNAL PROJECT DATA\4-05 REPORTS\STRATFORD STA PHASE 2\ISSUE\211439-19 R015 2 - SDC STA PHASE 2 - STUDLEY SCENARIO MODELLING REPORT_ISSUE.DOCX
Page 27
6 Summary and Conclusions
6.1 Summary
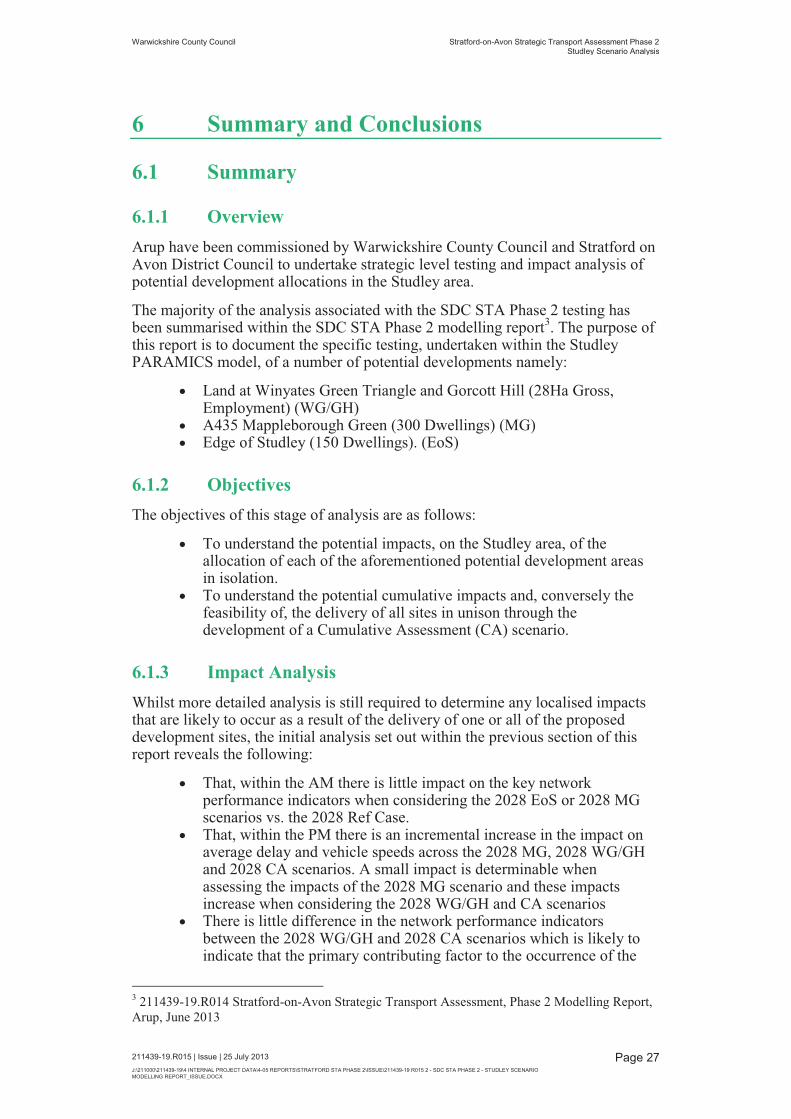
6.1.1 Overview Arup have been commissioned by Warwickshire County Council and Stratford on Avon District Council to undertake strategic level testing and impact analysis of potential development allocations in the Studley area.
The majority of the analysis associated with the SDC STA Phase 2 testing has been summarised within the SDC STA Phase 2 modelling report3. The purpose of this report is to document the specific testing, undertaken within the Studley PARAMICS model, of a number of potential developments namely:
� Land at Winyates Green Triangle and Gorcott Hill (28Ha Gross, Employment) (WG/GH)
� A435 Mappleborough Green (300 Dwellings) (MG) � Edge of Studley (150 Dwellings). (EoS)
6.1.2 Objectives The objectives of this stage of analysis are as follows:
� To understand the potential impacts, on the Studley area, of the allocation of each of the aforementioned potential development areas in isolation.
� To understand the potential cumulative impacts and, conversely the feasibility of, the delivery of all sites in unison through the development of a Cumulative Assessment (CA) scenario.
6.1.3 Impact Analysis Whilst more detailed analysis is still required to determine any localised impacts that are likely to occur as a result of the delivery of one or all of the proposed development sites, the initial analysis set out within the previous section of this report reveals the following:
� That, within the AM there is little impact on the key network performance indicators when considering the 2028 EoS or 2028 MG scenarios vs. the 2028 Ref Case.
� That, within the PM there is an incremental increase in the impact on average delay and vehicle speeds across the 2028 MG, 2028 WG/GH and 2028 CA scenarios. A small impact is determinable when assessing the impacts of the 2028 MG scenario and these impacts increase when considering the 2028 WG/GH and CA scenarios
� There is little difference in the network performance indicators between the 2028 WG/GH and 2028 CA scenarios which is likely to indicate that the primary contributing factor to the occurrence of the
3 211439-19.R014 Stratford-on-Avon Strategic Transport Assessment, Phase 2 Modelling Report, Arup, June 2013
Warwickshire County Council Stratford-on-Avon Strategic Transport Assessment Phase 2 Studley Scenario Analysis
211439-19.R015 | Issue | 25 July 2013 J:\211000\211439-19\4 INTERNAL PROJECT DATA\4-05 REPORTS\STRATFORD STA PHASE 2\ISSUE\211439-19 R015 2 - SDC STA PHASE 2 - STUDLEY SCENARIO MODELLING REPORT_ISSUE.DOCX
Page 28
impacts is the vehicular demand associated with the land at Winyates Green/Gorcott Hill.
� When considering the impact of the 2028 CA scenario the impacts on queuing across the network, within the AM, appear to be more widespread with impacts occurring along the A435, Station Road and Woodrow Drive/Washford Drive corridors. Within the PM the impacts are concentrated around the Icknield St Dr/Claybrook Dr/Washford Dr and A435 Birmingham Road/Redditch Road roundabouts. This situation is largely replicated within the 2028 WG/GH scenario testing.
6.2 AQMA Assessment Whilst further detailed analysis is required to understand more fully the effects on the AQMA that occur as a result of the assignment of demands associated with the various developments, this initial analysis appears to indicate that none of the options that have been tested result in a significant impact on flows and speeds within the AQMA area.
Given that the impact analysis of the scenarios tends to indicate that the WG/GH and cumulative scenarios are likely to impact upon the junctions within the middle of Studley the impacts on the AQMA area appears contradictory. However, further analysis of the queuing on the approaches to the A435/Redditch Road junction is already forecast to be extensive within the Reference Case network. Thus, the impacts that have been identified during the previous stage of analysis tend to lie outside of the AQMA area. This is likely to be a significant consideration should the coverage of the AQMA be extended at any point in the future as such an extension would mean the inclusion of these potential developments would likely have a negative impact on the AQMA area in terms of speeds and flow.
6.3 Conclusions Whilst it should be recognised that the analysis undertaken to date has only focussed on the strategic level impacts, based on the analysis presented within this report, the following conclusions have been drawn:
� That the strategic impacts of delivering the Edge of Studley sites are likely to be limited.
� That there are minor impacts discernible as a result of developing the land at Mappleborough Green which may be overcome with some more detailed analysis.
� That the impacts likely to occur as a result of either the land at Winyates Green/Gorcott Hill or cumulative developments are likely to be more severe and will require further investigation. A focused package of mitigation measures should be considered to accompany the allocation of land at Winyates Green/Gorcott Hill in order that the predicted impacts can be minimised.
� That, at this stage, the predicted impacts on the AQMA areas across all scenarios, when compared to the 2028 Ref Case conditions appears to be minimal. This would not be the case if the coverage of the AQMA were extended.
Warwickshire County Council Stratford-on-Avon Strategic Transport Assessment Phase 2 Studley Scenario Analysis
211439-19.R015 | Issue | 25 July 2013 J:\211000\211439-19\4 INTERNAL PROJECT DATA\4-05 REPORTS\STRATFORD STA PHASE 2\ISSUE\211439-19 R015 2 - SDC STA PHASE 2 - STUDLEY SCENARIO MODELLING REPORT_ISSUE.DOCX
Page 29
6.4 Recommendations Any future assessment of the proposed impacts of these sites should, in the first instance, focus primarily on the delivery of localised mitigation.
When considering the need for a focussed package of mitigation measures to be delivered alongside either the land at Winyates Green/Gorcott Hill or the cumulative development it is recommended that mitigation of the impacts at the following areas should take precedence:
� Icknield St Dr/Claybrook Dr/Washford Dr roundabout. � A435 Birmingham Road/Redditch Road roundabout.

Appendix A
Studley Average Maximum Queue Difference Plots
��
����
����
��
��
��
��
��
��
��
��
Contains Ordnance Survey data © Crowncopyright and database right 2012
© Arup
��A3
MXD Location
Job No
211439-19
Drawing No Issue
MQ 001 P1
Drawing Status
Information
Scale at A3
2028 Edge of Studley (EoS) AM Period 0700-1000
Average Maximum QueueThe Arup Campus,Blythe Gate, Blythe Valley ParkSolihull, West MidlandsB908AETel +44 (0)121 213 3000 Fax +44 (0)121 213 3001www.arup.com
Issue Date By Chkd Appd
P1 12-06-13 MG JE JE
Job Title
Client
Warwickshire County Council
SDC Strategic Transport Assessment
0 540 1,080270
Metres
N.T.S.
Legend
less than -5 vehicles
between + 5 and +25
between +25 and +50
greater than +50
��
��
��
��

��
Contains Ordnance Survey data © Crowncopyright and database right 2012
© Arup
��A3
MXD Location
Job No
211439-19
Drawing No Issue
MQ 002 P1
Drawing Status
Information
Scale at A3
2028 Edge of Studley (EoS) PM Period 1600-1900
Average Maximum QueueThe Arup Campus,Blythe Gate, Blythe Valley ParkSolihull, West MidlandsB908AETel +44 (0)121 213 3000 Fax +44 (0)121 213 3001www.arup.com
Issue Date By Chkd Appd
P1 12-06-13 MG JE JE
Job Title
Client
Warwickshire County Council
SDC Strategic Transport Assessment
0 540 1,080270
Metres
N.T.S.
Legend
less than -5 vehicles
between + 5 and +25
between +25 and +50
greater than +50
��
��
��
��

��
����
����
��
��
��
��
Contains Ordnance Survey data © Crowncopyright and database right 2012
© Arup
��A3
MXD Location
Job No
211439-19
Drawing No Issue
MQ 003 P1
Drawing Status
Information
Scale at A3
2028 Mappleborough Green (MG) AM Period 0700-1000
Average Maximum QueueThe Arup Campus,Blythe Gate, Blythe Valley ParkSolihull, West MidlandsB908AETel +44 (0)121 213 3000 Fax +44 (0)121 213 3001www.arup.com
Issue Date By Chkd Appd
P1 12-06-13 MG JE JE
Job Title
Client
Warwickshire County Council
SDC Strategic Transport Assessment
0 540 1,080270
Metres
N.T.S.
Legend
less than -5 vehicles
between + 5 and +25
between +25 and +50
greater than +50
��
��
��
��

��
��
��
Contains Ordnance Survey data © Crowncopyright and database right 2012
© Arup
��A3
MXD Location
Job No
211439-19
Drawing No Issue
MQ 004 P1
Drawing Status
Information
Scale at A3
2028 Mappleborough Green (MG) PM Period 1600-1900
Average Maximum QueueThe Arup Campus,Blythe Gate, Blythe Valley ParkSolihull, West MidlandsB908AETel +44 (0)121 213 3000 Fax +44 (0)121 213 3001www.arup.com
Issue Date By Chkd Appd
P1 12-06-13 MG JE JE
Job Title
Client
Warwickshire County Council
SDC Strategic Transport Assessment
0 540 1,080270
Metres
N.T.S.
Legend
less than -5 vehicles
between + 5 and +25
between +25 and +50
greater than +50
��
��
��
��

��
����
����
��
��
��
����
����
��
��
��
��
��
��
Contains Ordnance Survey data © Crowncopyright and database right 2012
© Arup
��A3
MXD Location
Job No
211439-19
Drawing No Issue
MQ 005 P1
Drawing Status
Information
Scale at A3
2028 Land at Winyates Green/Gorcott HillAM Period 0700-1000
Average Maximum QueueThe Arup Campus,Blythe Gate, Blythe Valley ParkSolihull, West MidlandsB908AETel +44 (0)121 213 3000 Fax +44 (0)121 213 3001www.arup.com
Issue Date By Chkd Appd
P1 12-06-13 MG JE JE
Job Title
Client
Warwickshire County Council
SDC Strategic Transport Assessment
0 540 1,080270
Metres
N.T.S.
Legend
less than -5 vehicles
between + 5 and +25
between +25 and +50
greater than +50
��
��
��
��

��
��
����
Contains Ordnance Survey data © Crowncopyright and database right 2012
© Arup
��A3
MXD Location
Job No
211439-19
Drawing No Issue
MQ 006 P1
Drawing Status
Information
Scale at A3
2028 Land at Winyates Green/Gorcott HillPM Period 1600-1900
Average Maximum QueueThe Arup Campus,Blythe Gate, Blythe Valley ParkSolihull, West MidlandsB908AETel +44 (0)121 213 3000 Fax +44 (0)121 213 3001www.arup.com
Issue Date By Chkd Appd
P1 12-06-13 MG JE JE
Job Title
Client
Warwickshire County Council
SDC Strategic Transport Assessment
0 540 1,080270
Metres
N.T.S.
Legend
less than -5 vehicles
between + 5 and +25
between +25 and +50
greater than +50
��
��
��
��

��
����
����
��
��
��
��
����
��
��
��
��
��
��
��
��
��
��
Contains Ordnance Survey data © Crowncopyright and database right 2012
© Arup
��A3
MXD Location
Job No
211439-19
Drawing No Issue
MQ 007 P1
Drawing Status
Information
Scale at A3
2028 ‘All Developments’ Cumulative Assessment (CA) AM Period 0700-1000
Average Maximum QueueThe Arup Campus,Blythe Gate, Blythe Valley ParkSolihull, West MidlandsB908AETel +44 (0)121 213 3000 Fax +44 (0)121 213 3001www.arup.com
Issue Date By Chkd Appd
P1 12-06-13 MG JE JE
Job Title
Client
Warwickshire County Council
SDC Strategic Transport Assessment
0 540 1,080270
Metres
N.T.S.
Legend
less than -5 vehicles
between + 5 and +25
between +25 and +50
greater than +50
��
��
��
��

����
��
��
Contains Ordnance Survey data © Crowncopyright and database right 2012
© Arup
��A3
MXD Location
Job No
211439-19
Drawing No Issue
MQ 008 P1
Drawing Status
Information
Scale at A3
2028 ‘All Developments’ CumulativeAssessment (CA) PM Period 1600-1900
Average Maximum QueueThe Arup Campus,Blythe Gate, Blythe Valley ParkSolihull, West MidlandsB908AETel +44 (0)121 213 3000 Fax +44 (0)121 213 3001www.arup.com
Issue Date By Chkd Appd
P1 12-06-13 MG JE JE
Job Title
Client
Warwickshire County Council
SDC Strategic Transport Assessment
0 540 1,080270
Metres
N.T.S.
Legend
less than -5 vehicles
between + 5 and +25
between +25 and +50
greater than +50
��
��
��
��

��
����
����
��
��
��
��
��
��
��
��
Contains Ordnance Survey data © Crowncopyright and database right 2012
© Arup
��A3
MXD Location
Job No
211439-19
Drawing No Issue
MQ 001 P1
Drawing Status
Information
Scale at A3
2028 Edge of Studley (EoS) AM Period 0700-1000
Average Maximum QueueThe Arup Campus,Blythe Gate, Blythe Valley ParkSolihull, West MidlandsB908AETel +44 (0)121 213 3000 Fax +44 (0)121 213 3001www.arup.com
Issue Date By Chkd Appd
P1 12-06-13 MG JE JE
Job Title
Client
Warwickshire County Council
SDC Strategic Transport Assessment
0 540 1,080270
Metres
N.T.S.
Legend
less than -5 vehicles
between + 5 and +25
between +25 and +50
greater than +50
��
��
��
��

��
Contains Ordnance Survey data © Crowncopyright and database right 2012
© Arup
��A3
MXD Location
Job No
211439-19
Drawing No Issue
MQ 002 P1
Drawing Status
Information
Scale at A3
2028 Edge of Studley (EoS) PM Period 1600-1700
Average Maximum QueueThe Arup Campus,Blythe Gate, Blythe Valley ParkSolihull, West MidlandsB908AETel +44 (0)121 213 3000 Fax +44 (0)121 213 3001www.arup.com
Issue Date By Chkd Appd
P1 12-06-13 MG JE JE
Job Title
Client
Warwickshire County Council
SDC Strategic Transport Assessment
0 540 1,080270
Metres
N.T.S.
Legend
less than -5 vehicles
between + 5 and +25
between +25 and +50
greater than +50
��
��
��
��
��
����
����
��
��
��
��
Contains Ordnance Survey data © Crowncopyright and database right 2012
© Arup
��A3
MXD Location
Job No
211439-19
Drawing No Issue
MQ 003 P1
Drawing Status
Information
Scale at A3
2028 Mappleborough Green (MG) AM Period 0700-1000
Average Maximum QueueThe Arup Campus,Blythe Gate, Blythe Valley ParkSolihull, West MidlandsB908AETel +44 (0)121 213 3000 Fax +44 (0)121 213 3001www.arup.com
Issue Date By Chkd Appd
P1 12-06-13 MG JE JE
Job Title
Client
Warwickshire County Council
SDC Strategic Transport Assessment
0 540 1,080270
Metres
N.T.S.
Legend
less than -5 vehicles
between + 5 and +25
between +25 and +50
greater than +50
��
��
��
��
��
��
��
Contains Ordnance Survey data © Crowncopyright and database right 2012
© Arup
��A3
MXD Location
Job No
211439-19
Drawing No Issue
MQ 004 P1
Drawing Status
Information
Scale at A3
2028 Mappleborough Green (MG) PM Period 1600-1900
Average Maximum QueueThe Arup Campus,Blythe Gate, Blythe Valley ParkSolihull, West MidlandsB908AETel +44 (0)121 213 3000 Fax +44 (0)121 213 3001www.arup.com
Issue Date By Chkd Appd
P1 12-06-13 MG JE JE
Job Title
Client
Warwickshire County Council
SDC Strategic Transport Assessment
0 540 1,080270
Metres
N.T.S.
Legend
less than -5 vehicles
between + 5 and +25
between +25 and +50
greater than +50
��
��
��
��
��
����
����
��
��
��
����
����
��
��
��
��
��
��
Contains Ordnance Survey data © Crowncopyright and database right 2012
© Arup
��A3
MXD Location
Job No
211439-19
Drawing No Issue
MQ 005 P1
Drawing Status
Information
Scale at A3
2028 Land at Winyates Green/Gorcott HillAM Period 0700-1000
Average Maximum QueueThe Arup Campus,Blythe Gate, Blythe Valley ParkSolihull, West MidlandsB908AETel +44 (0)121 213 3000 Fax +44 (0)121 213 3001www.arup.com
Issue Date By Chkd Appd
P1 12-06-13 MG JE JE
Job Title
Client
Warwickshire County Council
SDC Strategic Transport Assessment
0 540 1,080270
Metres
N.T.S.
Legend
less than -5 vehicles
between + 5 and +25
between +25 and +50
greater than +50
��
��
��
��

��
��
����
Contains Ordnance Survey data © Crowncopyright and database right 2012
© Arup
��A3
MXD Location
Job No
211439-19
Drawing No Issue
MQ 006 P1
Drawing Status
Information
Scale at A3
2028 Land at Winyates Green/Gorcott HillPM Period 1600-1900
Average Maximum QueueThe Arup Campus,Blythe Gate, Blythe Valley ParkSolihull, West MidlandsB908AETel +44 (0)121 213 3000 Fax +44 (0)121 213 3001www.arup.com
Issue Date By Chkd Appd
P1 12-06-13 MG JE JE
Job Title
Client
Warwickshire County Council
SDC Strategic Transport Assessment
0 540 1,080270
Metres
N.T.S.
Legend
less than -5 vehicles
between + 5 and +25
between +25 and +50
greater than +50
��
��
��
��
��
����
����
��
��
��
��
����
��
��
��
��
��
��
��
��
��
��
Contains Ordnance Survey data © Crowncopyright and database right 2012
© Arup
��A3
MXD Location
Job No
211439-19
Drawing No Issue
MQ 007 P1
Drawing Status
Information
Scale at A3
2028 ‘All Developments’ Cumulative Assessment (CA) AM Period 0700-1000
Average Maximum QueueThe Arup Campus,Blythe Gate, Blythe Valley ParkSolihull, West MidlandsB908AETel +44 (0)121 213 3000 Fax +44 (0)121 213 3001www.arup.com
Issue Date By Chkd Appd
P1 12-06-13 MG JE JE
Job Title
Client
Warwickshire County Council
SDC Strategic Transport Assessment
0 540 1,080270
Metres
N.T.S.
Legend
less than -5 vehicles
between + 5 and +25
between +25 and +50
greater than +50
��
��
��
��
����
��
��
Contains Ordnance Survey data © Crowncopyright and database right 2012
© Arup
��A3
MXD Location
Job No
211439-19
Drawing No Issue
MQ 008 P1
Drawing Status
Information
Scale at A3
2028 ‘All Developments’ CumulativeAssessment (CA) AM Period 0700-1000
Average Maximum QueueThe Arup Campus,Blythe Gate, Blythe Valley ParkSolihull, West MidlandsB908AETel +44 (0)121 213 3000 Fax +44 (0)121 213 3001www.arup.com
Issue Date By Chkd Appd
P1 12-06-13 MG JE JE
Job Title
Client
Warwickshire County Council
SDC Strategic Transport Assessment
0 540 1,080270
Metres
N.T.S.
Legend
less than -5 vehicles
between + 5 and +25
between +25 and +50
greater than +50
��
��
��
��
Recommended