Strategic Resource Plan 2015/16 to 2018/19

Melton City Council – Strategic Resource Plan 2015/16 to 2018/19
TTaabbllee ooff CCoonntteennttss
Pages
EXECUTIVE SUMMARY ………….………….………….………….................... 1
PROJECTED FINANCIAL OUTCOMES
Financial Performance ……………………………………………………………... 2
Financial Position ……………………………………………………………........... 4
Cash Flow ……………………………………………………………...................... 5
Capital Expenditure/Borrowing……………………………………...................... 6
Non Financial Resources …………………………………………….................... 7
Assumptions ………………………………………………………......................... 9
APPENDIX A: BUDGETED STANDARD STATEMENTS
Budgeted Standard Income Statement …………………………………………... 13
Budgeted Standard Balance Sheet …………………………………………......... 14
Budgeted Standard Cash Flow Statement ………………………………………. 15
Budgeted Standard Capital Works Statement …………………………………… 16
Budgeted Statement of Changes in Equity ……………………………………… 21
Budgeted Statement of Human Resources ……………………………………… 22
Melton City Council – Strategic Resource Plan 2015/16 to 2018/19
11..00 EEXXEECCUUTTIIVVEE SSUUMMMMAARRYY The key elements of Melton City Council’s Strategic Planning Framework are our Council Plan, Strategic Resource Plan and the Annual Budget. In accordance with The Local Government Act 1989, the Strategic Resource Plan must be reviewed and adopted by Council by 30 June 2015. The Strategic Resource Plan provides direction in future service planning and is a critical tool in identifying and managing Council’s financial risks. The Plan informs Council decision-making in areas such as service levels, infrastructure management, rating strategy and investment targets, and then reflects the future impact of those decisions. The Plan also provides the long term, prudent and “sustainable’ financial framework within which Council will develop, consider and adopt the 2015/16 Budget. Within this report there are some specific projects detailed (i.e. Capital Works over the next four years on page 17). It should be noted however; that this financial strategy does not attempt to set in concrete any item in particular; rather, it provides a financial framework that shows the amount of funds Council will have at its discretion over a period. It is in this way that financial modeling can be undertaken as project costs are firmed and submitted to the annual budget process. Council, in adopting a long-term financial strategy (and carrying out regular reviews) is ensuring financial resources are available over the long term. It also reinforces the Council’s ability to renew the required infrastructure and fund new capital works, plus adequately resource the business plans contained in the Council Plan enabling the overarching Council vision to become a reality. Strong financial management has become a necessary ingredient for Local Government and in particular for Melton City Council which is currently in an environment of rapid growth with increasing demand for facilities and services for the growing community. In facing this challenge, Melton City Council will be confronted with some difficult decisions regarding revenue streams particularly rating, borrowing limits, increasing costs and the desire for new and refurbished facilities which will also impact on expenditures over the next few years. The Strategic Resource Plan is based on the following key objectives: -
To build community wealth through the achievement of operating surpluses growth in cash reserves.
To continue to deliver high quality services to the community; To minimize net borrowing in the medium and long term. To fund Council’s capital works program mainly from internally generated funds and
moderate net new borrowings during the currency of this Strategic Resource Plan. To maximise returns on Council’s investments. To maintain a responsible and sustainable asset management program and Early delivery of infrastructure to growth areas.
In turn, specific financial goals have been established to support management and Council decision making, and to track progress against objectives. These goals are:
Improve underlying surplus from annual operations during the currency of this Strategic Resource Plan;
Maintain a balanced, or cash flow positive, annual cash budget; Target a minimum of $25.0 million and above in cash and investment reserves; Maintain a minimum working capital of $12.0 million to $14.0 million Maintain growth in net assets.
Page 1

Melton City Council – Strategic Resource Plan 2015/16 to 2018/19
The Strategic Resource Plan is not a static document, but is reviewed annually as part of Council’s strategic planning and budget process and is updated to reflect changing internal and external circumstances. 2.0 FINANCIAL PERFORMANCE Financial performance refers to the net outcome of all revenues and expenditure from Council’s operating activities during a financial year. It is presented in the budget documents in terms of both an underlying surplus or deficit and also a comprehensive result. The underlying result is the net surplus or deficit for the year adjusted for cash and non cash developer contributions, gains or losses on disposal of non operating assets sold, capital grants and other once-off adjustments. It is a measure of financial sustainability, as it is not impacted by non-recurring or once-off items of revenues and expenses, which can often mask the operating result. The projected trend in the underlying surplus illustrated in the chart below, shows the challenges faced by Council’s in terms of maintaining and improving the recurrent service delivery year by year without relying on cash reserves or increased debt. The underlying result is a surplus of $2.0 million in 2015/16 and is expected to improve significantly to $10.8 million by 2018/19, during the currency of this Strategic Resource Plan.
‐$3.7
$2.0
$4.9
$6.7
$10.8
‐6
‐4
‐2
0
2
4
6
8
10
12
$ (Millions)
Financial Year
Underlying Operating Result in $ Millions
The comprehensive surplus or deficit is the total after accounting for both operating and non operating items. These include gain/loss on sale of assets, capital grants and contributed assets.
Page 2

Melton City Council – Strategic Resource Plan 2015/16 to 2018/19
Council’s comprehensive surplus is projected to increase from a forecast surplus of $67.3 million in 2014/15 to $88.7 million by 2018/19.
$67.3
$82.9 $85.5$81.1
$88.7
0
20
40
60
80
100
120
140
$ Millions
Financial Year
Operating Results ‐ (Comprehensive Result)in $ Millions
Total revenue is projected to increase from a forecast $195.2 million in 2014/15 to $234.2 million by 2018/19. This is an increase of over $39.0 million or 20.0% compared to 2014/15 forecast results. Other assumptions built in for revenue and operating expenditure are outlined in detail under Section 8, Assumptions on Pages 9 to 11.
$195.2$211.1 $219.3 $220.7
$234.2
0
50
100
150
200
250
$ (M
illions)
Financial Year
Operating Revenue in $ Millions
Page 3

Melton City Council – Strategic Resource Plan 2015/16 to 2018/19
3.0 FINANCIAL POSITION Financial Position refers to a “snap shot” of all assets (what Council owns) and Liabilities (what Council owes) at the end of the financial year. It is presented as the Budgeted Balance Sheet and the reported net assets (i.e. Assets less liabilities), representing the net worth, or value of Council. The Current (Liquidity) Ratio (or Current assets over Current Liabilities) measures the liquidity situation of Council, or our ability to meet short term (less than twelve months) financial obligations. Throughout the planning period, Council’s liquidity ratio exceeds the target ratio between of 1.25 to 2.5.
$1,378$1,465
$1,546$1,629
$1,716
0
200
400
600
800
1,000
1,200
1,400
1,600
1,800
2,000
$ Millions
Financial Year
Financial Position ‐ Net Assets in $ Millions
Council’s net assets will increase in value from a forecast $1.378 billion in 2013/14 to $1.716 billion by 30 June 2019. This is a net increase of $338 million reflecting the net outcome of annual capital expenditure, contributed assets, asset disposals, depreciation including the impact of biennial revaluation.
Page 4

Melton City Council – Strategic Resource Plan 2015/16 to 2018/19
4.0 CASH FLOW Cash flow refers to the inflows and outflows of cash during the financial year in the performance of all activities. The Budgeted Cash Flow Statement presents this information in three main areas – operating activities (i.e. normal receipts and payments from operations), investing activities (addition and disposal of non current assets) and financing activities (loan borrowings and repayments). The statement explains the reasons for movement in cash reserves between the start and end of year. The Council cash holding during the planning period is illustrated in the attached chart. Cash and equivalents at end of the year depends heavily on the level of capital expenditure budgeted in each year. The projected balances are based on the assumption that the Capital expenditure budgeted for the year will be completed before the end of the financial year.
$22.94
$38.96 $37.86 $36.11
$23.01
0
20
40
60
80
$ Millions
Financial Year
Cash & Investments$ Millions
The 2015/2016 Strategic Resource Plan is framed around having sufficient cash reserves to cover restricted assets which are primarily developer contributions, construction retentions, maintenance bonds and also a working capital limit of $2.0 million to meet day to day needs. This however will be a significant challenge in 2018/19 with a budgeted capital works effort of $55.4 million with the Council’s strategy of minimizing borrowings by adopting a nil borrowing policy in 2017/18 and 2018/19 and net loan repayments of 8.0 from 2016/17 to 2018/19. This strategy, whilst generally resulting in reduction in debt and debt servicing costs, does mean the depletion of cash and investment reserves in the short term, being used as an alternative funding source to maintain a robust capital works program. Cash and investment balances are nevertheless expected to remain at acceptable level from 2015/16 to 2017/18 in this Strategic Resource Plan.
Page 5

Melton City Council – Strategic Resource Plan 2015/16 to 2018/19
5.0 CAPITAL EXPENDITURE Capital expenditure refers to Council’s expenditure in constructing, renewing, expanding or upgrading its physical assets (infrastructure, facilities etc.) to meet the community’s service needs. Capital expenditure is added to Council’s non-current assets value on the Statement of Financial Position at the end of the financial year, and represents a significant component of council’s annual cash outflows. Council’s Strategic Resource Plan ensures that a significant proportion of cash flow from operating activities is directed to the capital works program over the next 4 years.
$50.1
$25.4
$41.1
$29.5
$55.4
0
10
20
30
40
50
60
$ Millions
Financial Year
Capital Expenditure$ Millions
The budgeted capital expenditure in 2015/16 is $25.4 million. An extensive capital works program of over $151.4 million is proposed over the next 4-year period, from 2015/2016 to 2018/19 averaging around $37.85 million each year. The capital works program is funded from general rate revenue, developer contributions, capital contributions, asset sales and net borrowing. 6.0 Borrowings Council’s net borrowing in 2015/16 is a modest $0.613 million and is planned to be utilsed as a funding source to deliver a capital works program of $25.4 million by the end of the current financial year. There is no net borrowing in the next three years from 2016/17 to 2018/19 and as stated earlier Council plans to repay $8.0 million of debt by the end of 2018/19. This is in line with the Council’s borrowing strategy to restrict borrowing to refinancing maturing debt and to reduce level of borrowings to $21.0 million by 2018/19 from the 28.5 million borrowings level forecast at the end of 2014/15.
Page 6

Melton City Council – Strategic Resource Plan 2015/16 to 2018/19
7.0 NON FINANCIAL RESOURCES In determining the long term financial strategy, the Council has paid due consideration to the need for increasing the level of non financial resources each year such as additional staff numbers, plant, furniture and equipment, facilities and infrastructure that are required to service the growing demand for services in the planning period.
Page 7

Melton City Council – Strategic Resource Plan 2015/16 to 2018/19
Budgeted Statement of Forecast Budget
Human Resources 2014/15 2015/16 2016/17 2017/18 2018/19
$’000 $’000 $’000 $’000 $’000
Staff Expenditure
Employee Costs - Operating 45,111 47,008 49,363 51,832 54,423
Employee Cots - Capital
Total Staff Costs 45,111 47,008 49,363 51,832 54,423
Total Staff Numbers
Employees (EFT) 476.5 484.5 494.5 506.5 521.5
Total Staff Numbers (EFT) 476.5 484.5 494.5 506.5 521.5
Strategic Resource Plan
Page 8

Melton City Council – Strategic Resource Plan 2015/16 to 2018/19
8.0 ASSUMPTIONS Factors applied in the development of the financial forecasts are summarised below: 8.1 Cash Flow For cash flow projection purposes, collection of revenues and payment of accounts are assumed to hold a pattern similar to previous years and close to 100% of the amount accrued in the year. 8.2 Consumer Price Index (CPI) Consumer Price Index (CPI) over the planning period is projected at rates shown in the table below:
2015/16 2016/17 2017/18 2018/19
CPI (projected) Local Government Cost Index
2.5% 3.4%
2.5%
2.5%
2.5%
. 8.3 Rates & Charges Income Rates & charges Income are projected to increase during the next four years based on rate increases and growth in assessments as follows:
2015/16 2016/17 2017/18 2018/19 General Rate Increase
4.4% 3.0% 3.0% 3.0%
Growth in Assessments
4.0% 4.0% 4.0% 4.0%
8.4 User Fees & Charges Statutory fees & other fees charges are projected to increase from 2.5% to 3% from 2015/2016 to 2018/19.
2015/16 2016/17 2017/18 2018/19
Statutory 2.5% 2.5% 2.5% 2.5%
Other Fees & Charges
3.5% 3.5% 3.5% 3.5%
8.5 Developer Contributions Developer cash and non cash contributions are projected as follows.
2015/16 2016/17 2017/18 2018/19 Cash Contributions($ Millions)
9.55m 11.80m 5.17m 6.17m
Non Cash Contributions($ Millions)
$62.5m $63.0m $62.7m $62.5m
Page 9

Melton City Council – Strategic Resource Plan 2015/16 to 2018/19
8.6 Grants and Capital Contributions Specific forecasts have been used for grants and contributions where advice is presently available in 2014/2015, in other years; growth of 5% is applied to operating grants and capital contributions.
2015/16 2016/17 2017/18 2018/19 Grants Commission
$12.9m
2.0%
$13.14 2.0%
$13.76 4.7%
$14.4 4.7%
Operating Grants 3.0% 3.0% 3.0% 3.0%
Capital Grants ($ Millions)
$7.22m
$4.6m
$4.1m
$5.6m
8.7 Proceeds from Asset Sales Significant asset sales revenue has been assumed for the planning period going forward. This includes property sales revenue from joint development agreements entered into by the Council, which will have significant positive cash flow impact on the Council finances over the long term. Asset sales figures shown below also includes sale of Council fleet.
2015/16 2016/17 2017/18 2018/19
Assets Sales ($ Millions)
$3.16m $5.10m $4.47m
$6.19m
8.8 Other Revenue Other Revenue items are expected to increase by 2% to 2.5% from 2015/2016 to 2018/19.
2015/16 2016/17 2017/18 2018/19
Other Revenue 2.5% 2.0% 2.5%
2.5%
8.9 Interest on Investments Investment income is based on projected cash & investment balances available for investment each year. It is recognised that investment income will be based on the average cash funds available throughout the year for investment. This may vary significantly from the end of year cash balance at balance date shown in the Budgeted Cash Flow Statement and the Budgeted Balance Sheet.
2015/16 2016/17 2017/18 2018/19 Interest income ($ Millions)
$1.2m $1.23m $1.26m $1.29m
Page 10

Melton City Council – Strategic Resource Plan 2015/16 to 2018/19
8.10 Employee Costs
2015/16 2016/17 2017/18 2018/19
EBA 3.5% 2.5% 2.5% 2.5%
Other Increases 2.5% 1.5% 1.5% 1.5%
Staff Oncots 20% 20% 20% 20%
2015/16 2016/17 2017/18 2018/19
Employee Numbers (EFT)
484.5 494.5 506.5 521.5
8.11 General Expenditure Specific cost forecasts have been used for significant non-discretionary expenditure items in 2015/16, where such information is presently available. The remaining general operating expenditure items are projected to increase as outlined below:
2015/16 2016/17 2017/18 2018/19 Contracts Payments
7.0% 6.0% 6.0% 6.0%
Contracts & Materials
5.0% 5.0% 5.0% 5.0%
Maintenance Expenditure
5.0 5.0% 5.0% 5.0%
Utilities 6.0% 4.0% 4.0% 4.0%
Other Expenses 2.5% 2.5% 2.5% 2.5%
8.12 Capital Expenditure The Capital works expenditure projections are based on Council’s draft 10 year capital works program, reflecting works carried forward, committed future works, asset refurbishment works, plant replacement program and planned major projects. .
2015/16 2016/17 2017/18 2018/19 Capital Expenditure ($ Millions)
$25.4m $41.1m $29.5m $55.4m
8.13 Borrowing
2015/16 2016/17 2017/18 2018/19 Total Borrowings ($ Millions)
$7.850m $6.0
Total Repayment ($ Millions)
$7.237m $6.893m $3.853m $3.334m
8.14 Cost of Assets Sold Projected cost of assets sold year-by-year is based on the level of asset sales. The impact of asset revaluation is reflected in the written down value of assets sold.
Page 11

Melton City Council – Strategic Resource Plan 2015/16 to 2018/19
2015/16 2016/17 2017/18 2018/19 Written Down Value of Assets Sold ($ Millions)
$1.38m $2.23m $1.85m $2.46m
8.15 Depreciation The Depreciation charges for the year take into account the impact of capital expenditure, disposals, contributed assets and expected asset life during for the planning period.
2015/16 2016/17 2017/18 2018/19 Depreciation & Amortization ($ Millions)
$23.73m $24.31m $24.91m $25.52m
Page 12

Melton City Council – Strategic Resource Plan 2015/16 to 2018/19
Appendix A 1.0 Budgeted Comprehensive Income Statement
For the year ending 30 June
Budgeted Comprehensive Forecast Budget
Income Statement 2014/15 2015/16 2016/17 2017/18 2018/19
Year Ended 30th June $’000 $’000 $’000 $’000 $’000
Income
Rates and charges 86,225 93,067 99,165 106,984 115,841
Statutory fees and fines 2,261 2,290 2,347 2,406 2,466
User fees 8,482 8,780 9,010 9,253 9,493
Contributions - cash 6,151 9,550 11,795 5,167 6,167
Contributions - non-monetary assets 60,000 62,500 63,000 62,700 62,500
Grants - Operating (recurrent) 22,059 21,811 22,295 23,148 24,029
Grants - Operating (non-recurrent) 401 222 225 228 230
Grants - Capital (non-recurrent) 4,214 7,217 4,600 4,100 5,600
Net gain on disposal of assets 601 1,779 2,873 2,612 3,726
Other income 4,839 3,894 3,966 4,063 4,161
Share of net P/Lof assoc. and joint ventures
Total Income 195,232 211,110 219,277 220,661 234,215
Expenses
Employee costs 45,111 47,008 49,363 51,832 54,423
Materials and services 54,425 51,721 54,203 56,814 59,663
Bad and doubtful debts 350 400 410 420 431
Depreciation and amortisation 22,907 23,727 24,312 24,912 25,526
Finance costs 1,482 1,499 1,412 1,338 1,131
Utilities & telephone exps 3,672 3,898 4,053 4,215 4,383
Total Expenses 127,947 128,253 133,753 139,530 145,557
Surplus/(Deficit) 67,285 82,857 85,525 81,130 88,658
Other comprehensive income
Items that will not be reclassified to surplus or deficit:
Impairment of fire impacted infrastructure
Net asset revaluation increment /(decrement)Share of other comprehensive income of associates and joint ventures accounted for by the equity method
Total Comprehensive Result 67,285 82,857 85,525 81,130 88,658
Strategic Resource Plan
Page 13

Melton City Council – Strategic Resource Plan 2015/16 to 2018/19
2.0 Budgeted Balance Sheet For the year ending 30 June
Balance Sheet
As at 30 June Forecast Budget
2014/15 2015/16 2016/17 2017/18 2018/19
$’000 $’000 $’000 $’000 $’000
Current assets
Cash and cash equivalents 22,939 38,963 37,862 36,111 23,014
Trade and other receivables 10,517 11,447 11,627 11,735 12,844
Financial assets
Inventories 105 105 95 95 95
Non Current Assets held for resale 300 450 1,250 1,500 1,750
Other assets 500 1,250 1,500 1,750 1,750
Total current assets 34,361 52,215 52,334 51,190 39,453
Non-current assets
Trade & other Receivables
Property Plant & Equipment 1,383,220 1,454,959 1,535,475 1,616,037 1,712,037
Inventories 248 272 286 300 315
Investment property 6,000 6,000 6,000 6,000 6,000
Intangible assets 4,664 4,336 4,008 3,680 3,680
Other assets 2,087 2,077 2,072 2,067 2,067
Total non-current assets 1,396,218 1,467,644 1,547,841 1,628,084 1,724,099
Total Assets 1,430,579 1,519,859 1,600,175 1,679,275 1,763,552
Current liabilities
Trade and other payables 10,410 11,506 11,168 11,135 11,504
Trust funds & deposits 1,897 1,762 2,015 1,819 1,922
Provisions 6,828 7,097 7,310 7,529 7,755
Interest-bearing loans and borrowings 7,237 6,861 3,820 3,299 3,477
Other current liabilities 75 75 71 68 64
Total Current Liabilities 26,447 27,301 24,385 23,849 24,723
Non-current liabilities
Provisions 2,202 2,227 2,073 2,073 2,023
Interest bearing loans & borrowings 21,243 22,232 24,412 21,113 17,636
Other non current liabilities 3,000 3,250 3,100 3,250 3,150
Total non current liabilities 26,445 27,709 29,585 26,436 22,809
Total Liabilities 52,892 55,010 53,970 50,285 47,532
Net Assets 1,377,687 1,464,849 1,546,205 1,628,990 1,716,020
Equity
Accumulated surplus 894,229 977,086 1,062,611 1,143,741 1,232,399
Asset revaluation reserve 454,711 454,711 454,711 454,711 454,711
Other reserves 28,747 33,052 28,883 30,538 28,910
Total Equity 1,377,687 1,464,849 1,546,205 1,628,990 1,716,020
Strategic Resource Plan
Page 14

Melton City Council – Strategic Resource Plan 2015/16 to 2018/19
3.0 Budgeted Statement of Cash Flows For the year ending 30 June
Budgeted Statement of Cash FlowsAs at 30 June Forecast Budget
2014/15 2015/16 2016/17 2017/18 2018/19
$’000 $’000 $’000 $’000 $’000
Cash flows from operating Receipts
General rates 86,162 92,167 99,869 106,884 114,741
Grants Income - Operating & Capital 26,674 29,250 27,120 27,476 29,860
Interest 1,498 1,650 1,691 1,734 1,777
User charges 10,904 11,050 12,236 11,609 11,907
Contributions & Reimbursements 6,151 9,550 10,295 5,167 6,167
Other revenue 3,313 2,244 2,275 3,329 2,885
Total Receipts 134,702 145,911 153,487 156,199 167,336
Payments
Employee costs 45,049 46,714 49,304 51,612 54,247
Contractor Payments 34,488 36,807 38,072 43,705 46,967
Utlities, Materials & Services 24,465 23,216 28,920 32,447 25,502
Finance costs
Total Payments 104,002 106,737 116,297 127,765 126,716
Net cash provided by operating activities 30,700 39,174 37,190 28,434 40,620
Cash flows from investing activities
Proceeds from sales of property, plant and equipment 1,381 3,160 5,098 4,463 6,188
Payments for property, plant and equipment -50,055 -25,424 -41,084 -29,457 -55,441
Net cash used in investing activities -48,674 -22,264 -35,986 -24,994 -49,252
Cash flows from financing activities
Finance costs -1,482 -1,499 -1,412 -1,338 -1,131
Proceeds from borrowings 15,000 7,850 6,000
Repayment of borrowings -10,850 -7,237 -6,893 -3,853 -3,334Net cash provided by (used in) financing activities 2,668 -886 -2,305 -5,191 -4,465
Net decrease in cash & cash equivalents -15,306 16,024 -1,101 -1,751 -13,096
Cash & equivalents at begining of year 38,245 22,939 38,963 37,861 36,110
Cash & equivalents at 30 June 22,939 38,963 37,861 36,110 23,012
Strategic Resource Plan
Page 15

Melton City Council – Strategic Resource Plan 2015/16 to 2018/19
4.0 Budgeted Capital Works Statement - Summary
For the year ending 30 June
Budgeted Statement of Capital Forecast Budget
For the years ending 2014/15 2015/16 2016/17 2017/18 2018/19
30th June $’000 $’000 $’000 $’000 $’000
PropertyLand 745
Total land 745
Buildings & Building Improvements 28,913 6,510 7,960 5,596 28,573
Total buildings 28,913 6,510 7,960 5,596 28,573
Total property 29,658 6,510 7,960 5,596 28,573
Plant and equipment
Plant, machinery and equipment 1,250 1,100 1,100 1,100 1,100
Fixtures, fittings and furniture 86 75 150 150 150
Computers and telecommunications 312 263 425 425 312
Library books 350 200 360 375 375
Total plant and equipment 1,998 1,638 2,035 2,050 1,937
Infrastructure
Roads 9,468 5,395 17,803 10,023 11,471
Bridges 820 2,980 370 2,870
Drainage 1,108 315 330 330 330Recreational, leisure and community facilities 6,305 8,918 6,559 6,967 5,140
Other infrastructure 1,518 1,828 3,418 4,122 5,120
Total infrastructure 18,399 17,276 31,090 21,811 24,931
Total capital works expenditure 50,055 25,424 41,084 29,457 55,441
Represented by:
Asset renewal expenditure 6,641 6,146 11,412 8,722 8,705
New asset expebditure 38,475 15,648 23,001 10,617 36,232
Asset Upgrade expenditure 4,365 3,080 5,671 4,818 4,844Asset expansion expenditure 574 550 1,000 5,300 5,660
Total capital works expenditure 50,055 25,424 41,084 29,457 55,441
Strategic Resource Plan
Page 16

Melton City Council – Strategic Resource Plan 2015/16 to 2018/19
4.1 Budgeted Capital Works Statement – 2015/2016 For the year ending 30 June 2016
Budgeted Statement of Capital Works New Renewal Upgrade Expansion Total Council FundingContributions and
ReservesGrant Funding Borrowings
30th June $’000 $’000 $’000 $’000 $’000 $’000 $’000 $’000 $’000
For the year ending Budget
30th June 2015/16 2015/16
PropertyLand
Total land
Buildings & Building Improvements 6,510 3,400 350 2,360 400 6,510 4,797 400 700 613
Total buildings 6,510 3,400 350 2,360 400 6,510 4,797 400 700 613
Total property 6,510 3,400 350 2,360 400 6,510 4,797 400 700 613
Plant and equipment
Plant, machinery and equipment 1,100 1,100 1,100 1,100 Fixtures, fittings and furniture 75 75 75 75
Computers and telecommunications 263 113 150 263 263
Library books 200 200 200 200
Total plant and equipment 1,638 200 1,288 150 ‐ 1,638 ‐ 1,638 ‐ ‐
InfrastructureRoads 5,395 670 2,400 2,225 100 5,395 2,248 447 2,700 Bridges 820 800 20 820 20 800 Drainage 315 300 15 315 315
Recreational, leisure and community facilities 8,918 7,935 220 763 8,918 4,196 1,179 3,543
Other infrastructure 1,828 100 1,488 240 1,828 1,554 274 Total infrastructure 17,276 9,805 4,108 3,263 100 17,276 8,333 2,426 6,517 ‐
Total capital works expenditure 25,424 13,405 5,746 5,773 500 25,424 13,130 4,464 7,217 613
Asset Expenditure Types Funding Sources
Page 17

Melton City Council – Strategic Resource Plan 2015/16 to 2018/19
4.2 Budgeted Capital Works Statement – 2016/2017 For the year ending 30 June 2017
Budgeted Statement of Capital Works New Renewal Upgrade Expansion Total Council Contributions and Grant Funding Borrowings
30th June $’000 $’000 $’000 $’000 $’000 $’000 $’000 $’000 $’000
For the year ending Budget
30th June 2016/17 2016/17
PropertyLand - - - -
Total land - - - - ‐ ‐ ‐ ‐
Buildings & Building Improvements 7,960 7,100 860 7,960 4,260 3,700
Total buildings 7,960 7,100 860 - - 7,960 4,260 3,700 ‐ ‐ Total property 7,960 7,100 860 - - 7,960 4,260 3,700 ‐ ‐
Plant and equipmentPlant, machinery and equipment 1,100 1,100 1,100 1,100 Fixtures, fittings and furniture 150 150 150 150 Computers and telecommunications 425 113 312 425 425 Library books 360 360 360 360 Total plant and equipment 2,035 473 1,250 312 - 2,035 935 1,100 ‐ ‐
InfrastructureRoads 17,803 8,513 3,050 4,590 1,650 17,803 10,456 6,747 600 Bridges 2,980 2,900 80 2,980 780 2,200 Drainage 330 230 100 330 330 Recreational, leisure and community facilities 6,559 4,662 142 1,555 200 6,559 3,703 2,856 Other infrastructure 3,418 323 2,670 425 3,418 3,339 79 Total infrastructure 31,090 16,628 5,862 6,750 1,850 31,090 18,608 11,882 600 ‐
Total capital works expenditure 41,084 24,201 7,972 7,062 1,850 41,084 23,803 16,682 600 ‐
Asset Expenditure Types Funding Sources
Page 18

Melton City Council – Strategic Resource Plan 2015/16 to 2018/19
4.3 Budgeted Capital Works Statement – 2017/2018 For the year ending 30 June 2018
Budgeted Statement of Capital Works New Renewal Upgrade Expansion Total Council Contributions and Grant Funding Borrowings
30th June $’000 $’000 $’000 $’000 $’000 $’000 $’000 $’000 $’000
For the years ending Budget
30th June 2017/18 2017/18
PropertyLand - - - -
Total land - - - - ‐ ‐ ‐ ‐
Buildings & Building Improvements 5,596 4,736 860 - 5,596 3,651 1,945
Total buildings 5,596 4,736 860 - - 5,596 3,651 1,945 ‐ ‐ Total property 5,596 4,736 860 - - 5,596 3,651 1,945 ‐ ‐
Plant and equipmentPlant, machinery and equipment 1,100 1,100 1,100 1,100 Fixtures, fittings and furniture 150 150 150 150 Computers and telecommunications 425 113 312 425 425 Library books 375 375 375 375 Total plant and equipment 2,050 488 1,250 312 - 2,050 950 1,100 ‐ ‐
InfrastructureRoads 10,023 1,443 3,050 4,030 1,500 10,023 8,880 543 600 Bridges 370 250 120 370 370 Drainage 330 230 100 330 330 Recreational, leisure and community facilities 6,967 2,500 142 1,325 3,000 6,967 6,967 Other infrastructure 4,122 120 2,376 425 1,200 4,122 2,922 1,200 Total infrastructure 21,811 4,543 5,568 6,000 5,700 21,811 19,469 1,742 600 ‐
Total capital works expenditure 29,457 9,767 7,678 6,312 5,700 29,457 24,070 4,787 600 ‐
Asset Expenditure Types Funding Sources
Page 19
Melton City Council – Strategic Resource Plan 2015/16 to 2018/19
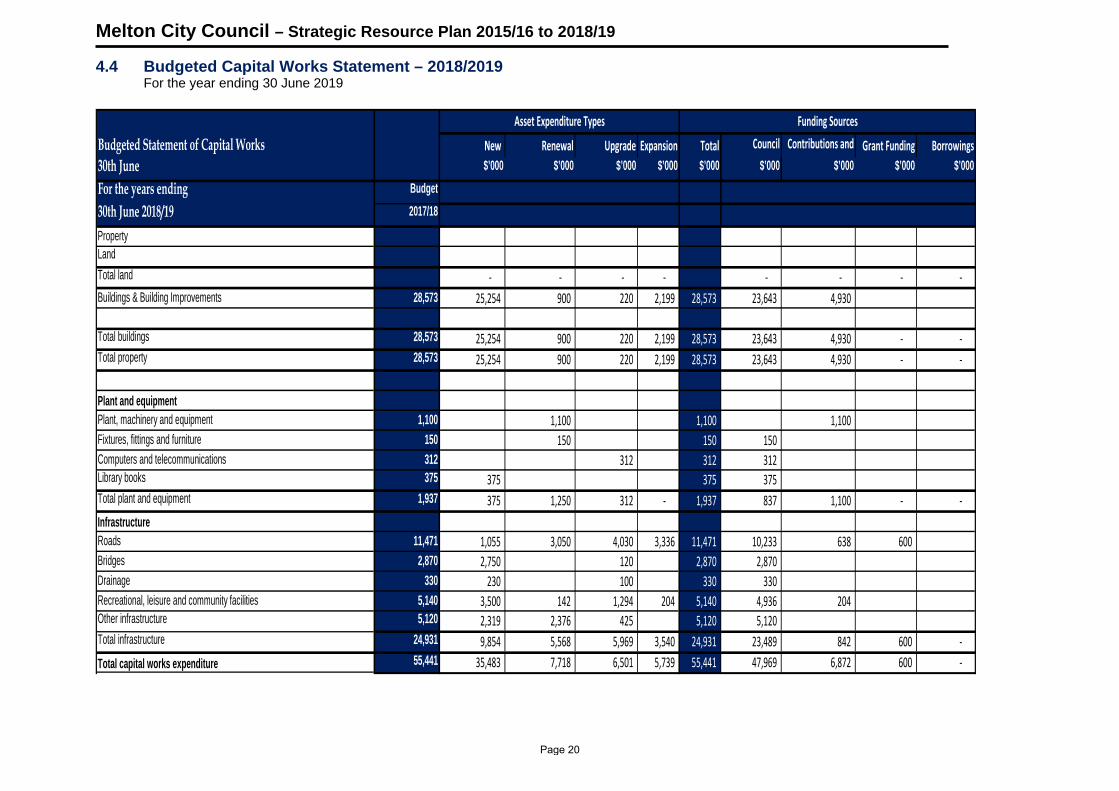
4.4 Budgeted Capital Works Statement – 2018/2019 For the year ending 30 June 2019
Budgeted Statement of Capital Works New Renewal Upgrade Expansion Total Council Contributions and Grant Funding Borrowings
30th June $’000 $’000 $’000 $’000 $’000 $’000 $’000 $’000 $’000
For the years ending Budget
30th June 2018/19 2017/18
PropertyLand
Total land ‐ ‐ ‐ ‐ ‐ ‐ ‐ ‐
Buildings & Building Improvements 28,573 25,254 900 220 2,199 28,573 23,643 4,930
Total buildings 28,573 25,254 900 220 2,199 28,573 23,643 4,930 ‐ ‐ Total property 28,573 25,254 900 220 2,199 28,573 23,643 4,930 ‐ ‐
Plant and equipmentPlant, machinery and equipment 1,100 1,100 1,100 1,100 Fixtures, fittings and furniture 150 150 150 150 Computers and telecommunications 312 312 312 312 Library books 375 375 375 375 Total plant and equipment 1,937 375 1,250 312 ‐ 1,937 837 1,100 ‐ ‐
InfrastructureRoads 11,471 1,055 3,050 4,030 3,336 11,471 10,233 638 600 Bridges 2,870 2,750 120 2,870 2,870 Drainage 330 230 100 330 330 Recreational, leisure and community facilities 5,140 3,500 142 1,294 204 5,140 4,936 204 Other infrastructure 5,120 2,319 2,376 425 5,120 5,120 Total infrastructure 24,931 9,854 5,568 5,969 3,540 24,931 23,489 842 600 ‐
Total capital works expenditure 55,441 35,483 7,718 6,501 5,739 55,441 47,969 6,872 600 ‐
Asset Expenditure Types Funding Sources
Page 20

Melton City Council – Strategic Resource Plan 2015/16 to 2018/19
5.0 Budgeted Statement of Changes in Equity
For the year ending 30 June
Budgeted Statement of Changes in Equity Accumulated Revaluation Other
For the years ending Total Surplus Reserve Reserves
30th June $’000 $’000 $’000 $’000
Year Ended 30th June 2016
Balance at begining of the financial year 1,377,687 894,229 454,711 28,747
Adjustments - Changes in accounting policy
Comprehensive result 82,857 82,857
Impairment losses on revalued assets
Other Psp related Transfers -2,302 -2,302
Transfers to reserves 10,884 10,884
Transfers from Reserves -4,276 -4,276
Balance at end of Financial Year 1,464,849 977,086 454,711 33,052
Year Ended 30th June 2016
Balance at begining of the financial year 1,464,849 977,086 454,711 33,052
Adjustments - Changes in accounting policy
Comprehensive result 85,525 85,525
Net asset revaluation Increment/(decrement)
Impairment losses on revalued assets
Other Psp related Transfers -519 -519
Transfers to reserves 13,032 13,032
Transfers from Reserves -16,682 -16,682
Balance at end of Financial Year 1,546,205 1,062,611 454,711 28,883
Year Ended 30th June 2017
Balance at begining of the financial year 1,546,205 1,062,611 454,711 28,883
Adjustments - Changes in accounting policy
Comprehensive result 81,130 81,130
Transfers to reserves 6,441 6,441
Transfers from Reserves -4,787 -4,787
Balance at end of Financial Year 1,628,990 1,143,741 454,711 30,538
Year Ended 30th June 2018
Balance at begining of the financial year 1,628,990 1,143,741 454,711 30,538
Adjustments - Changes in accounting policy
Comprehensive result 88,658 88,658
Transfers to reserves 7,442 7,442
Transfers from Reserves -9,070 -9,070
Balance at end of Financial Year 1,716,020 1,232,399 454,711 28,910
Page 21

Melton City Council – Strategic Resource Plan 2015/16 to 2018/19
6.0 Budgeted Statement of Human Resources
For the year ending 30 June
Budgeted Statement of Forecast Budget
Human Resources 2014/15 2015/16 2016/17 2017/18 2018/19
$’000 $’000 $’000 $’000 $’000
Staff Expenditure
Employee Costs - Operating 45,111 47,008 49,363 51,832 54,423
Employee Cots - Capital
Total Staff Costs 45,111 47,008 49,363 51,832 54,423
Total Staff Numbers
Employees (EFT) 476.5 484.5 494.5 506.5 521.5
Total Staff Numbers (EFT) 476.5 484.5 494.5 506.5 521.5
Strategic Resource Plan
End of Report
Page 22
Recommended