| 1| 1
Strategic Research Work-Flows using Scopus & SciVal to Maximize Research Performance.
prepared by Alexander van ServellenConsultant, Research Management, Elsevier
November 2017

| 2| 2
Introduction

| 5| 5
2004
1997
Visualize research performance
Benchmark your progress
Develop collaborative partnerships
Analyze research trends
2009

| 6| 6
From Publishing to Analytics

| 7| 7
From Publisher to Information Analytics Company
Content Technology
16% of the world’s research in +2000 journals
Books
35,000 published books
User queries
13M monthly users on ScienceDirect
Chemistry database
500M published experimental facts
Drug Database
100% of drug information from pharma
1,000 technologists employed by Elsevier
$400M invested in technology annually
Machine learningOver 1,000 predictive models
Machine reading
475M facts extracted from ScienceDirect
Collaborative filtering
1B articles analyzed daily

| 8| 8
Some Researcher use-cases…
Find the best papers in your
field
Showcase your success
Measure impactFind the right
Journal
Find Top Experts in your field
Win more Grants
Identify Hot Emerging Topics
Understand your field
See what others are doing

| 9| 9
SciVal
SciVal offers quick, easy access to the research performance of 220 nations and 8,500 research institutions worldwide, and groups of institutions
Visualize research performance
Benchmark your progress
Develop collaborative partnerships
Ready-made-at a glance snapshots of any selected entity
Flexibility to create and compare any research groups
Identify and analyze existing and potential collaboration opportunities
Analyze research trends
Analyze research trends to discover the top performers and rising stars
Scopus
Scopus is the world’s largest
abstract and citation database of
peer-reviewed scientific literature

| 10| 10
Scopus

| 11| 11
68M records and 22,794active titles from more than 5Kinternational publishers. More than 3,643 Gold Open Access journals indexed, 130K books and 8M conference proceedings
Journal & Books title list:https://www.elsevier.com/solutions/scopus/content

| 12| 12

| 13| 13
Scopus7,450 (+69%)
WoS4,408
Scopus6,822 (+91%)
WoS3,577
Scopus4,532 (+48%)
WoS3,052
Scopus8,223 (+96%)
WoS4,202
Scopus22,795(+80%)
Web of Science12,459
Scopus
• ~22K titles
• >5,000 publishers
• Updated daily
Web of Science TM
• ~12K titles
• 3,300 publishers
• Updated weekly
Assumes customer subscribes to ALL:• Science Citation Index (SCISEARCH)• Social Science Citation Index• Arts & Humanities Citation Index
Source: Web of Science Real Facts, Web of Science Core Collection title list and Scopus’ own data (May 2016)
Physical Sciences Health Sciences Life Sciences Social Sciences
Overall Content Comparison with Web of Science

| 14| 14

| 15| 15
Finding the best papers

| 16| 16
Step 1: use a smart search

| 17| 17
Step 1: view the results

| 18| 18
Step 3: use article metrics to understand impact

| 19| 19

| 20| 20
Finding the right Journal

| 21| 21
Step 1: go to: Journalmetrics.scopus.com

| 22| 22
| 23| 23
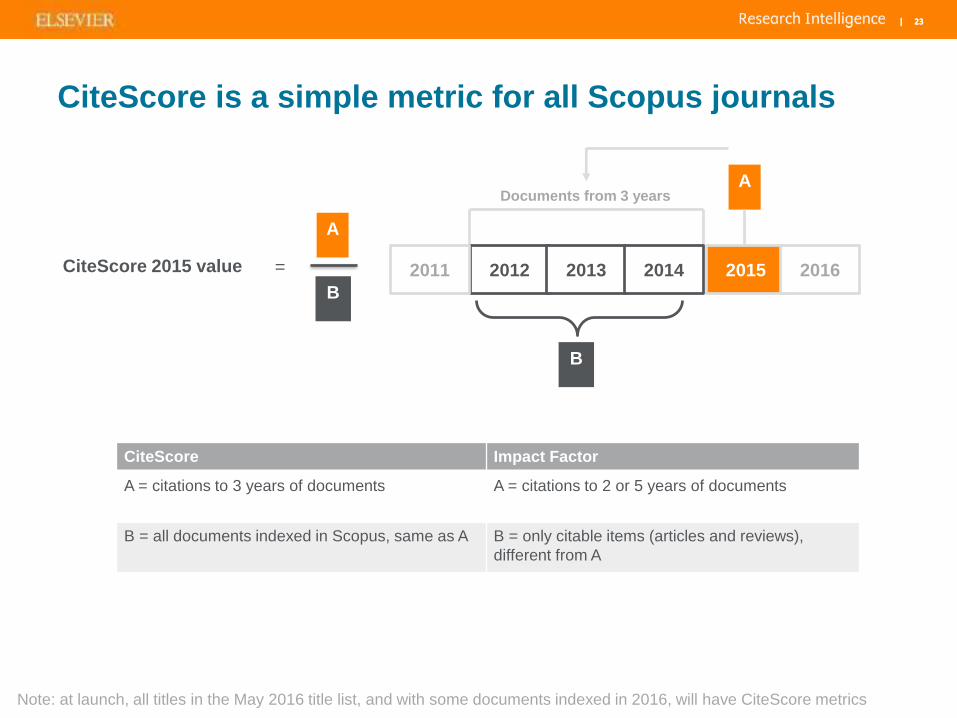
CiteScore is a simple metric for all Scopus journals
CiteScore Impact Factor
A = citations to 3 years of documents A = citations to 2 or 5 years of documents
B = all documents indexed in Scopus, same as A B = only citable items (articles and reviews), different from A
Note: at launch, all titles in the May 2016 title list, and with some documents indexed in 2016, will have CiteScore metrics
B
CiteScore 2015 value B
=
A
Documents from 3 years
2012 2013 2014 2015 2016
A
2011
| 24| 24
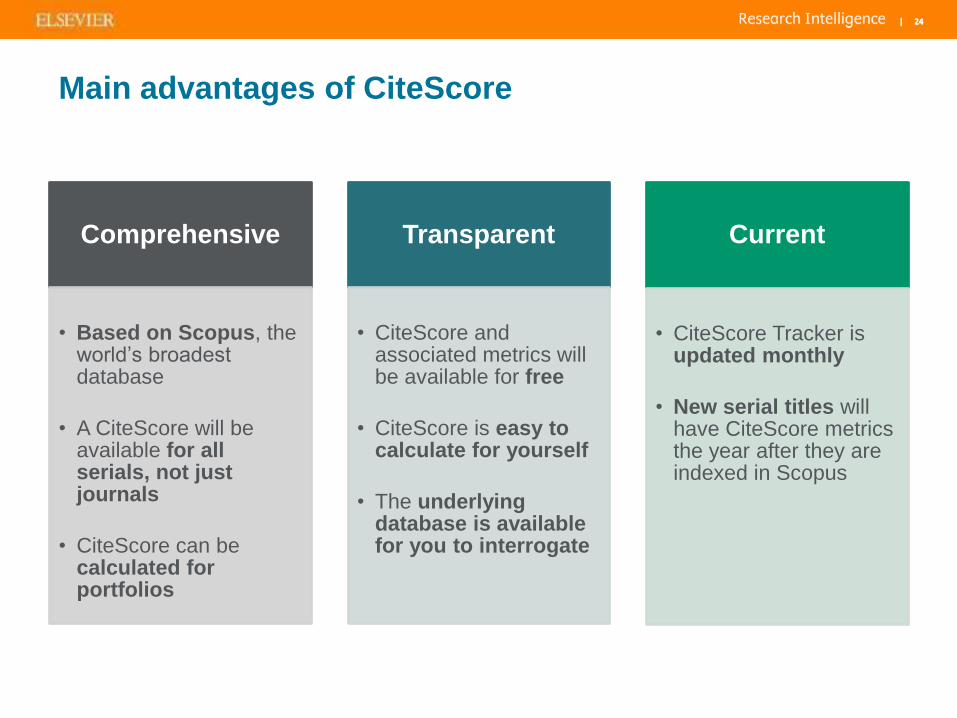
Comprehensive
• Based on Scopus, the world’s broadest database
• A CiteScore will be available for all serials, not just journals
• CiteScore can be calculated for portfolios
Transparent
• CiteScore and associated metrics will be available for free
• CiteScore is easy to calculate for yourself
• The underlying database is available for you to interrogate
Current
• CiteScore Tracker is updated monthly
• New serial titles will have CiteScore metrics the year after they are indexed in Scopus
Main advantages of CiteScore

| 25| 25
Finding an Expert in my field

| 26| 26
Finding a field expert
Needs:• I need to find an expert in right fields(s)• Someone with a good volume and impact of publications• Local who is recognized internationally

| 27| 27
Potential Editors, Authors, Reviewers

| 28| 28
Potential Editors, Authors, Reviewers

| 29| 29
Use the Scopus Author Profile
Use the Scopus author profile to understand where the author is based, their level of experience, publication output and impact, relevant to your topic.

| 30| 30
Funding Acknowledgements

| 31| 31
Funding data expansion project
What?
• Capture full text funding information• Tag funding body name, acronym and number using
Natural Language Processing (NLP)• Backfill full text funding information and tagging back
to 2008 and further• Include funding information from 3rd party curated lists:
(NIH/NSF/CrossRef/KAKEN/ResearchFish)
Why?• Provide funders with high(er) quality funding
information in Scopus• Allows for verification & identifying additional funding
sources
Scope • 2016 going forward• Backfill to 2008 (same as WoS) and further
2015 2017Q12016
Q2 Q3 Q4Q12017
Q2 Q3 Q4
Start capture funding information forward flow
Visualize funding data in Scopus.com
Project end
Start development NPL tagging toolStart defining capturing instructions
Start including 3rd party lists
Number Funding AcronymConselho Nacional de Desenvolvimento Científico e Tecnológico CNPqDeutsche Forschungsgemeinschaft DFG
291472 European Research Council ERC
Funding textWe are grateful for K. Behnia, Y.-L. Chen, L.-K. Lim, Z.-K. Liu, E. G. Mele, J. Moore, S.-Q. Shen and D. Varjas for helpful discussions. This work was financially supported by the Deutsche Forschungsgemein- schaft DFG (Project No. EB 518/1-1 of DFG-SPP 1666 Topological Insulators, and SFB 1143) and by the ERC (Advanced Grant No. 291472 Idea Heusler). R.D.d.R. acknowledges financial support from the Brazilian agency CNPq.

| 32| 32
Funding acknowledgements in Scopus records

| 33| 33
Search by Funding Sponsor

| 34| 34
Your Scopus Author Profile

| 35| 35

| 36| 36

| 37| 37
What’s hot and what’s not?

| 38| 38
Remember Nickel Cadmium batteries?

| 39| 39
Nickel-cadmium
| 40| 40
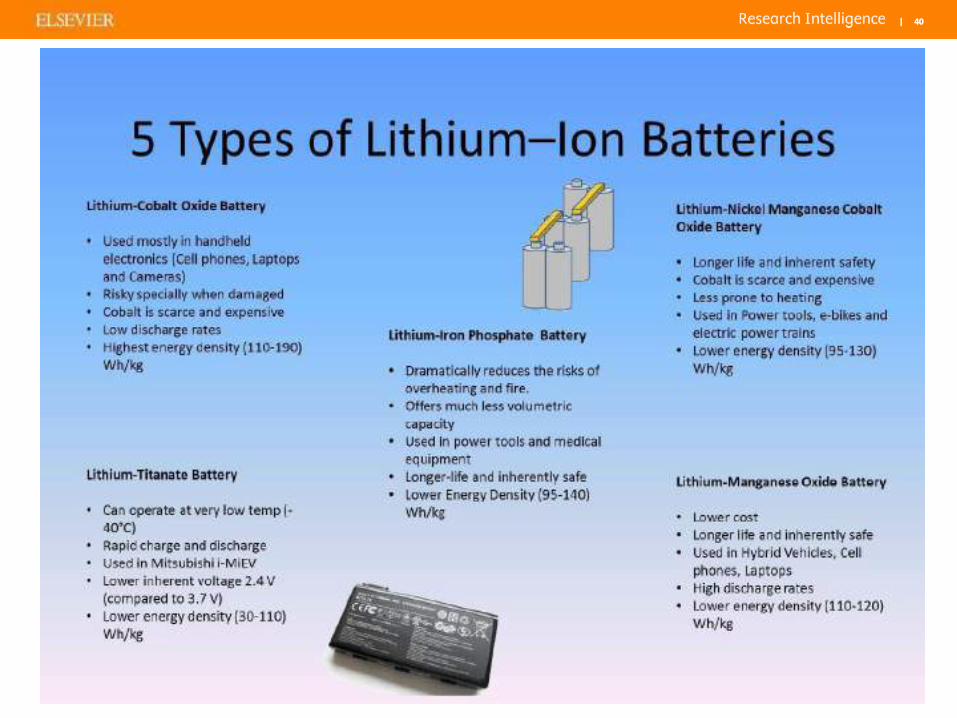
Lithium-Ion

| 41| 41
Lithium-ion

| 42| 42
What are the top Journals publishing in the topic?

| 43| 43
Explore the best journals active in that topic

| 44| 44

| 45| 45
Emerging topic Zika

| 46| 46
Indonesia active in Zika research?

| 47| 47
SciVal

| 48| 48
SciVal is Elsevier’s research intelligence tool
SciVal offers quick, easy access to the research performance of 220 countries & territories and 8,500 research institutions worldwide, and groups of institutions.
Visualize research performance
Benchmark your progress
Develop collaborative partnerships
Ready-made-at a glance snapshots of any selected entity
Flexibility to create and compare any research groups
Identify and analyze existing and potential collaboration opportunities
Analyze research trends
Analyze research trends to discover the top performers and rising stars

| 49| 49
Benefits for a broad range of users
• 360 degree Performance Overview to inform strategic planning
• Identify institution’s strengths and short-comings
Vice Rectors and other management
level
• Create management-level reports• Accelerate institutional and cross-institutional
collaboration• Support and win large grants• support and win large grants
Central administrators
• Evaluate researcher and team performance for recruitment and retention decisions
• Model-test scenarios by creating virtual teams
Faculty & Department Heads
• Raise visibility and highlight achievements• Expand networks• Locate collaborators and mentors
Researchers

| 50| 50
UI Management of uses SciVal for strategic planning

| 51| 51
Topic of Prominence in SciVal

| 52| 52
We now use researchers’ real-life citation behaviour to create a dynamic taxonomy of science
~35 million publications (1996-present) clustered into ~100,000 stable global scientific topics
A
N O
B C
D
E F G
H I
J
K L M
S T
P Q R
U V
W
Z
X Y
Cluster 1 Cluster 2 Cluster 3

| 53| 53
We developed an indicator of topic “Prominence”
which is step toward Predictive Analytics
• “Prominence” is composite indicator assigned to each topic based on
- Citation Count- Scopus Views Count- CiteScore of the journals the papers are published in
• Why call it “Prominence”
- Prominence ≠ Importance (Topics can be important but not prominent)
- Prominence ~ Visibility or Momentum
• Topic Prominence correlates with funding- Study used 255K grants from US NIH and NSF which were assigned topics using
text similarity
- Prominence on its own explains 34% of the variance in future funding per topic
- Prominence + Funding (2008-2010) together explain 66% of the variance in Funding per topic (2011-2013)

| 54| 54

| 55| 55

| 56| 56

| 57| 57

| 58| 58

| 59| 59
What can SciVal tell us about Indonesia?

| 60| 60
Indonesia’s research
papers are cited 17% less than world average
(FWCI = 0.83)

| 61| 61
Universitas Indonesia looks on track to become the most
prolific university in Indonesia.

| 62| 62
Quality: Field-Weighted Citation Impact
0.59
0.87
0.75
0.67
0.62
0.70.72
0.76
0.96
0.91
0
0.2
0.4
0.6
0.8
1
1.2
Bandung Institute ofTechnology
Gadjah Mada University Institut Pertanian Bogor Institut Teknologi SepuluhNopember
University of Indonesia
Fie
ld-W
eig
hte
d C
itat
ion
Imp
act
2007-2011 2012-2017
Universitas Indonesia and Institut TeknologiSepuluh Nopember
show significant increases in FWCI.
World average = 1

| 63| 63
Collaboration & Knowledge Transfer

| 64| 64
Collaboration Impact (2012-2017)
Entity Single Institutional National International
Indonesia (all) 0.7 0.8 1.0 5.4
Universitas Indonesia 1.1 1.1 1.0 5.9Institut Teknologi SepuluhNopember 1.1 1.1 1.3 3.3
Institut Pertanian Bogor 0.7 0.7 1.5 4.6
Gadjah Mada University 0.8 1.0 0.8 4.0
Istitute of Technology Bandung 1.2 0.9 1.0 4.8
Collaboration Impact = the average number of citations per paper (CPP) received by papers of a specific collaboration type.
Key findings:• Internationally collaborated papers are defacto the highest cited publication type.

| 65| 65
International Collaboration vs. Citation Impact 2012-2017
Key findings:• There is a significant positive correlation between level of international collaboration and Field-
Weighted Citation Impact at a national level.
Australia
BrazilChina
Hong Kong
India Indonesia
Iran
Israel
JapanMalaysia
Netherlands
Philippines
Singapore Switzerland
Thailand
United Kingdom
United States
R² = 0.716
0
0.2
0.4
0.6
0.8
1
1.2
1.4
1.6
1.8
2
0 10 20 30 40 50 60 70 80
Fie
ld-W
eig
hte
d C
itat
ion
Imp
act
International Collaboration as Percentage of output

| 66| 66
Cross Sector Collaboration (all) Universitas Indonesia
Bandung Institute of Technology
Gadjah Mada University
Institute Pertanian Bogor
Institut Teknolgi Sepuluh Nopember
Academic-Industry
Collaboration is often High
Impact.
It may also represent knowledge
transfer between sectors
And may lead to
innovation

| 67| 67
Accessing SciVal: go to www.scival.com
Who does not have access to SciVal? Please raise your hand.
If you do not have a username and password for SciVal, then please
register here.

| 68| 68
www.elsevier.com/research-intelligence
Thanks for your attentionAlexander van [email protected]
Recommended