1
STRAND DEBONDING FOR PRETENSIONED BRIDGE GIRDERS TO CONTROL
END CRACKS
Pinar Okumus and Michael G. Oliva
Biography: Pinar Okumus is an assistant teaching professor at the Department of Civil and
Environmental Engineering at Worcester Polytechnic Institute. She is a member of ACI.
Michael G. Oliva is a member of ACI. He is a professor at the Department of Civil and
Environmental Engineering at the University of Wisconsin, Madison.
ABSTRACT
Characteristic cracks occur at prestressed bridge girder ends during prestress release due
to the transfer of the prestress force to the concrete. This research investigated the quantitative
and qualitative impact of strand debonding on cracking through nonlinear finite element analysis
(FEA) and plant observations. The analysis included plastic behavior of concrete and stress
redistribution after tension induced cracking.
Prestressed bulb tee girders, 54in (1372mm), 72in (1829mm) and 82in (2083mm) deep,
were analyzed with 25%, 35% and 50% of the strands debonded at the girder end. The tensile
strains were used to judge cracking and were compared to cases with no debonding.
The results showed that 25% debonding can completely eliminate the excessive concrete
tension strains associated with cracks in critical locations. For cracks in other locations, related
strains were considerably reduced with 25-35% debonding and eliminated with 50% debonding.
The selection of the strands to be debonded significantly impacts cracking. Recommendations on
debonding strands and desirable bonded strand patterns are presented.
Keywords: debonding; nonlinear finite element analysis; pretensioned girder; end crack
2
1. INTRODUCTION
The prestress transfer from the steel strands to concrete, at the ends of prestressed precast
concrete girders, creates a region of stress concentration often resulting in formation of cracks
during detensioning. While end cracking has been observed in pretensioned bridge girders for
over fifty years1, the cracks appear to be more severe for recently developed heavily prestressed
deep wide flanged I girders or bulb tees.
The priority of this study is in determining how to control the size and extent of these
cracks in bridge girders, particularly those that might lead to long term severe durability
concerns. The durability concerns rise due to the possibility of cracks forming paths for water
and de-icing agents to seep into the concrete in the end bearing region. This problem could be
structurally hazardous for cracks in the bottom flange, if the corrosion agents reach and flow
along the prestressing strands.
Various methods for crack control have been explored. The most common method
currently used is placement of steel reinforcing bars in the region that is expected to crack. This
has been shown to be effective in controlling crack size, but not in eliminating cracking2.
Reducing the number of draped strands or changing the order in which the strands were cut have
also been considered. These traditional methods only achieved limited success. Debonding
strands is proven to be the most beneficial solution for all crack types3 and is the focus of this
paper.
2. RESEARCH SIGNIFICANCE
Some designers already utilize debonding and observe some control over the girder end
cracks. That practice, however, is based solely on experience. Due to the lack of guidance, the
pattern of the strands selected for debonding seems to be based on practicality in fabrication.
3
Information on the amount and pattern of debonding required to achieve crack control is lacking
in the literature.
This paper aims to fill some of this gap in prestressed concrete girder design by making
recommendations on the relative number of strands to be debonded and their pattern. The
effectiveness of crack control techniques is measured using FEA with inelastic modeling of the
cracking concrete. The actual methods for the FEA modeling have been described previously3, 4.
The FEA models were judged by comparison with observed and measured girder behavior. After
the FEA was verified, crack control through debonding is examined. Recommendations are
provided for improved design of the end zones for prestressed bridge girders.
3. CRACKING AND CURRENT CONTROL METHODS
3.1. Types of Cracks
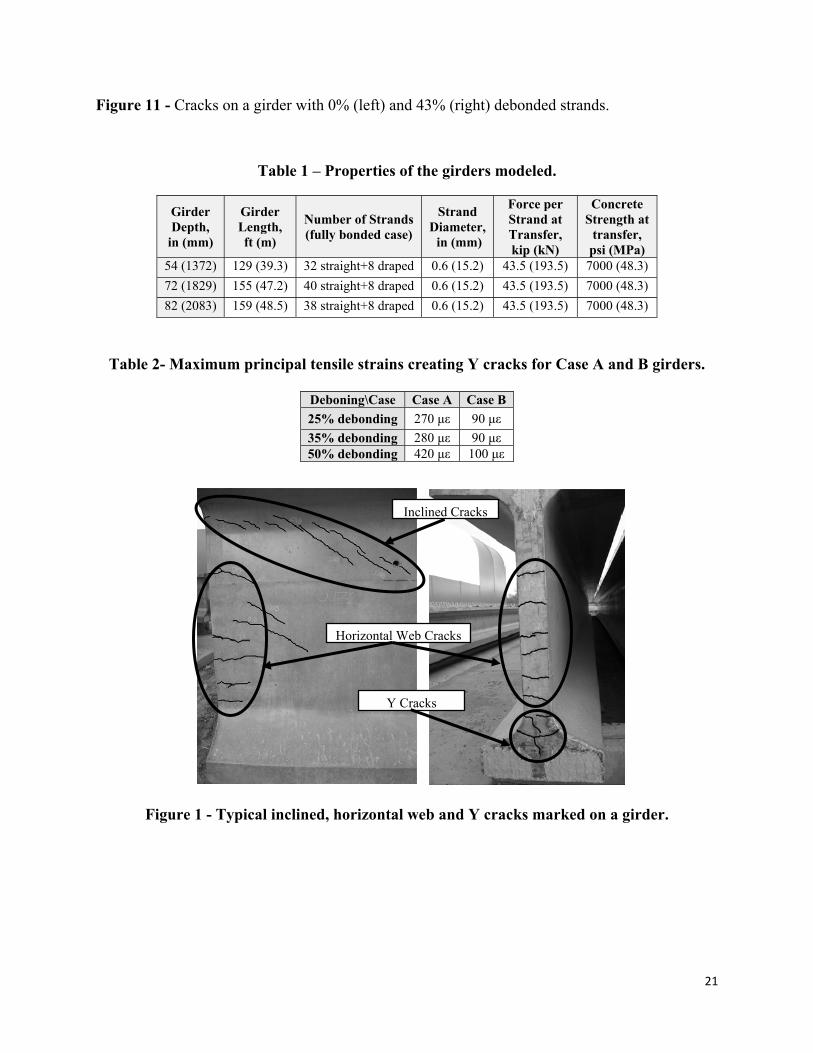
Recent bulb tee sections, with heavily prestressed bottom flanges and thin webs, exhibit
characteristic cracking patterns as seen in Figure 1. It should be noted that the girders shown and
investigated were designed per AASHTO LRFD Bridge Design Specifications5 with special
reinforcing in the end zone and still exhibited end cracking.
Based on the orientation and location of the cracks recorded from field observations, the
cracks are categorized into groups. The most important cracks addressed in this study are
inclined cracks, horizontal web cracks and bottom flange “Y” cracks. These cracks are marked
on the cross section and side of a girder end shown in Figure 1. Other cracks have also been
observed to form on girders studied by other researchers, such as vertical cracks in the bottom
flange due to restraint during detensioning6, but will not be examined here as none of the girders
investigated in this study exhibit such cracks.
4
Inclined cracks: The inclined cracks typically form close to and along draped strands.
These cracks are often the longest (>36in, 914mm) detectable end cracks in length as shown in
Figure 1. Since they run along the draped strands they may form paths for corrosive liquids to
reach the strands and affect the girder durability and end shear capacity.
Horizontal web cracks: The horizontal web cracks start at the very girder end and
propagate horizontally into the web as shown in Figure 1. They appear most often near mid-
depth of the girder. Horizontal web cracks are not close to strands and it is likely that these
cracks will close as additional dead load is applied to the girders. From a durability point of view
these cracks may be easier to tolerate.
Y cracks: Shown in Figure 1, these large cracks (>0.01in, 0.25mm) in the bottom flange
resemble a Y or T shape when viewed from the end of the girder. They form at the junction of
the bottom flange and web, but then continue with a vertical trace through the bottom flange. The
Y crack may be the most hazardous crack for bridge safety. Due to the location over the end
bearing and size, the Y crack can potentially form a path for salt water to reach the strands. If
water reaches the strand, it can move along the strand, lead to corrosion and affect structural
capacity – particularly shear capacity near the girder end.
3.2. Current Control Methods
Previous research on girder end cracking provided general insights on the girder end
behavior, and presented girder end design and crack control methods. The research, not exclusive
to the debonding solution, utilized empirical methods6-10, strut and tie methods11-13, simplified
analytical14 or linear analytical6, 15 methods. A FEA study by Kannel et al.16 investigated
debonding as a solution to vertical type cracking.
5
Article 5.10.10 of the AASHTO LRFD Bridge Design Specifications5, on designing the
end zone “splitting” reinforcement for the web cracks, seems to be based on the empirical work
of Marshall and Mattock7. AASHTO also requires reinforcement to confine the prestressing steel
at the ends. Reinforcement requirements of the AASHTO standards in some cases lead to high
reinforcing bar areas and difficulty in fitting the bars into the slender beam webs and flanges.
Visible girder end cracks still form despite this reinforcement.
The previous analytical studies have limitations mainly because they either assume that
the material behavior is either linear elastic under service loads or that it is at a condition near
failure under strength loads. The aforementioned FEA models16 attempted to solve cracking
problems when the concrete is elastic and uncracked. Therefore, they provide only an
approximation of the general behavior and do not simulate the post cracking behavior of
concrete. Other analytical studies assume the member is near the failure condition with
completely nonlinear material behavior. The strut and tie methods11, 12 provide a lower bound
estimate of the strength capacity, but have been used in a form applicable only as the material
reaches failure.
These methods, assuming elasticity or only the failure condition, are both lacking for the
case at hand since the cracked concrete is inelastic but the material is not near the failure
condition. A nonlinear analysis including the inelastic behavior of concrete and the stress
redistribution after cracking could solve some of the aforementioned analysis shortcomings and
is possible using FEA. Finite element analyses are also very suitable for parametric studies and
can provide the full strain field near the girder end.
4. THE FEA METHOD
6
Nonlinear FEA was the primary tool used here to predict the cracking behavior at the
girder end. The modeling techniques were verified by comparing FEA model results to test
results provided by O’Callaghan9. Once the modeling of the test girder was verified, the FEA
analysis method was extended to specific standard bulb tee girders with depths of 54in
(1372mm), 72in (1829mm) and 82in (2083mm). Various patterns and levels of debonding were
simulated to identify improvements that could be obtained in crack reduction. The commercial
FEA software ABAQUS/CAE was used and the analyses included specific plastic behavior of
concrete. Details of the plastic modeling are described elsewhere by Okumus4. A very brief
outline of just the capabilities of the FEA that are critical to accurate modeling is as follows.
4.1. FEA Model Features
The response of the prestress girder ends is inelastic due to concrete cracking and
therefore simulating the concrete plastic properties is critical. For analysis efficiency, nonlinear
material properties were only used for the disturbed concrete region close to the girder end
extending inward a distance equal to the depth of the girder. Concrete after this distance is
expected to behave linearly as this region was witnessed to be virtually crack free in examined
girders, is beyond the prestress transfer zone as suggested by AASHTO and St. Venant’s theory
supposes that the disturbed region would only extend a distance equal to the depth of the
member. The region away from the girder end was therefore modeled with a linear stress strain
relationship.
The “Concrete Damaged Plasticity” model of Abaqus/CAE17 is used for the concrete in
the end zone of the girder and is based on the stress-strain or stress-crack opening relationships
described in the FIB Model Code 201018. FIB Model Code provides the mathematical
constitutive stress-strain models for concrete in tension and compression. The tensile cracking
7
stress and the modulus of elasticity in compression and tension were calculated using AASHTO
LRFD Bridge Design Specifications5. The specific equations to define the properties of concrete
and the details of the material model are provided in detail elsewhere3, 4.
The tensile properties of concrete were defined in two phases: the linear elastic stress
strain relationship before cracking and a stress-crack opening relationship after cracking.
Although the cracks are not explicitly modeled, the stiffness loss of concrete elements upon
cracking was modeled through strain softening of concrete in tension. Principal concrete tensile
strains that exceed the theoretical cracking limit are used as an indication of crack development.
Actual crack widths are proportional to predicted element strain amplitudes.
The concrete was modeled with three dimensional first order tetrahedral and triangular
prism elements. First order space truss elements were used to simulate rebar. Steel rebars were
modeled as linear elastic since preliminary analyses proved that the stress in the steel rebars does
not exceed the yielding strength. The rebar elements are bonded to the concrete at the nodes so
that the strain softening of concrete (i.e. cracking) allows stress transfer from concrete to the
steel rebar elements.
At the girder end, the main region of interest, a finer element mesh was used. A finer
mesh requires significantly higher computational time but is expected to provide an accurate
solution for this inelastic region. None of the models had concrete element side lengths
exceeding 1.5in (38 mm) within the inelastic portions of the girders. The element size was
gradually increased along the girder length away from the girder end. Symmetry was utilized to
downsize the model to a quarter of the full bridge girder to reduce the computational cost.
Observed cracking occurs right after detensioning when there are no service loads on the
girder. At the time cracks form, the only applied force in the girder is prestressing transferred
8
from the strands to concrete. Therefore, the loading considered in the FEA models was
prestressing. Some manufacturers flame cut strands, which releases the strand immediately and
introduces a dynamic load in the prestress release. Dynamic effects at transfer were excluded
from the models due to a lack of modeling criteria for the load itself and because girders with
flame cut strands (dynamic) exhibited cracks that were nearly identical to girders where slow
hydraulic detensioning (static) was used. The stresses created due to changes in temperature were
also excluded since the temperature changes are small during the short time of prestress release.
The AASHTO LRFD Bridge Design Specifications5, Section C.5.11.4.2, idealizes the prestress
strand transfer length as 60 times the strand diameter. This distance is 36in (914mm) for the
0.6in (15mm) diameter strands used in this research. The same provisions state that the stresses
in prestressing steel may be assumed to vary linearly from zero at the point where bonding starts
to the effective prestress at the end of the transfer length. This implies that the bond stresses are
uniformly distributed over the transfer length.
For computational efficiency, prestressing strands were not explicitly modeled. Instead,
surfaces were created in concrete at the locations of the strands. The bond stresses were directly
applied on the concrete elements over these surfaces. The assumptions of the AASHTO
provisions were used to calculate the bond stress. The uniform bond stress for each strand was
calculated by dividing the effective prestress force on a strand by the surface area of a strand
over the transfer length. The strands were assumed to be circular in cross section.
This approach does not allow modeling of restraint provided by un-cut strands but that
limitation was assumed minor in investigating the crack types noted earlier. For models where
selected strands are debonded, the bond stresses were set to zero over the unbonded length -
9
assuming rigid debonding sleeves. Any minor stress transfer due to the flexibility of the
debonding sleeves was not considered.
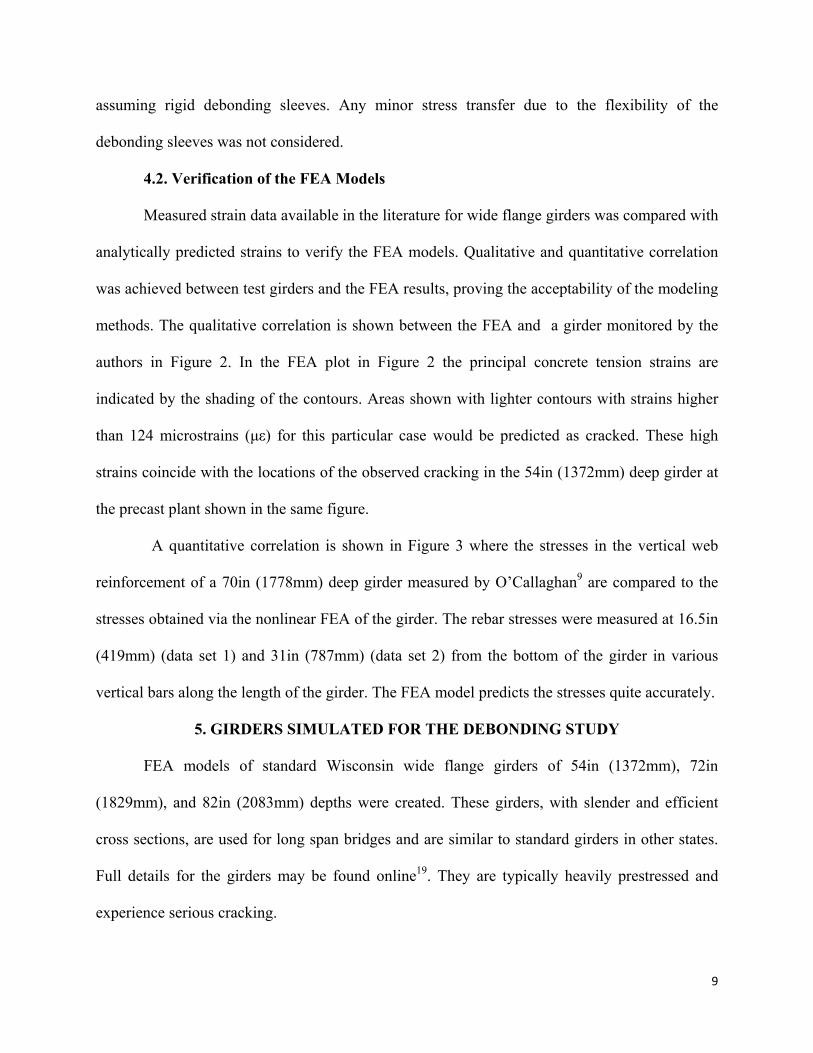
4.2. Verification of the FEA Models
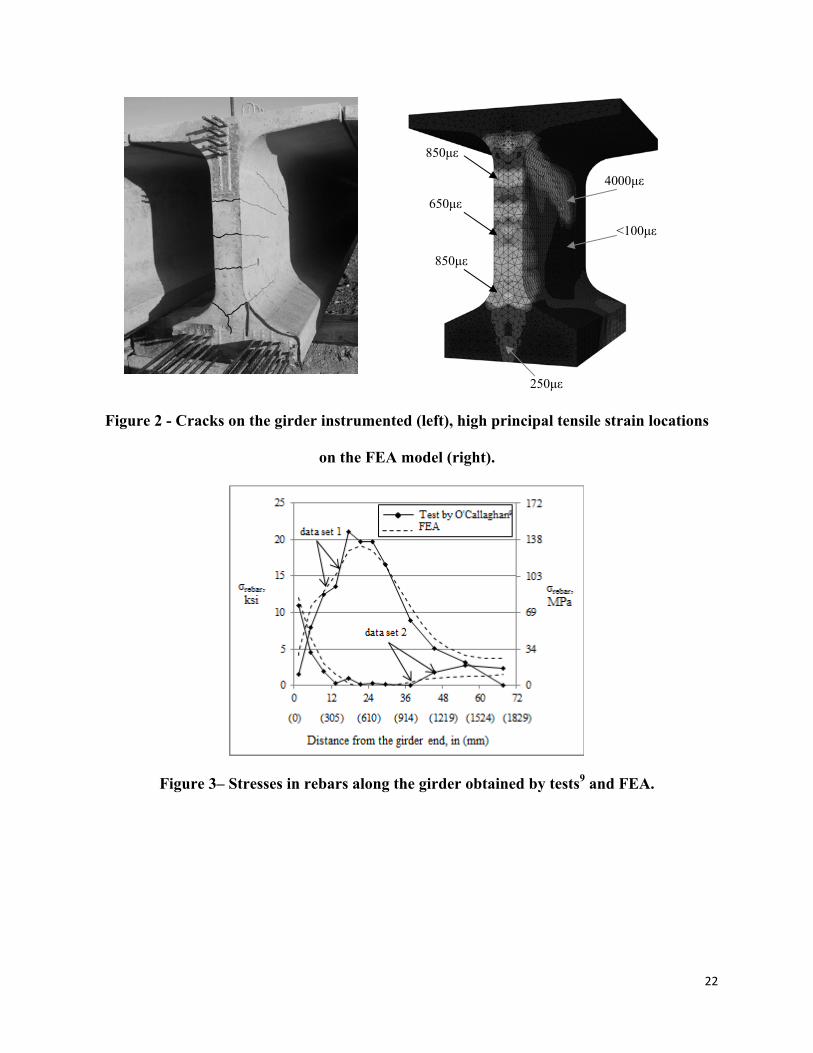
Measured strain data available in the literature for wide flange girders was compared with
analytically predicted strains to verify the FEA models. Qualitative and quantitative correlation
was achieved between test girders and the FEA results, proving the acceptability of the modeling
methods. The qualitative correlation is shown between the FEA and a girder monitored by the
authors in Figure 2. In the FEA plot in Figure 2 the principal concrete tension strains are
indicated by the shading of the contours. Areas shown with lighter contours with strains higher
than 124 microstrains (με) for this particular case would be predicted as cracked. These high
strains coincide with the locations of the observed cracking in the 54in (1372mm) deep girder at
the precast plant shown in the same figure.
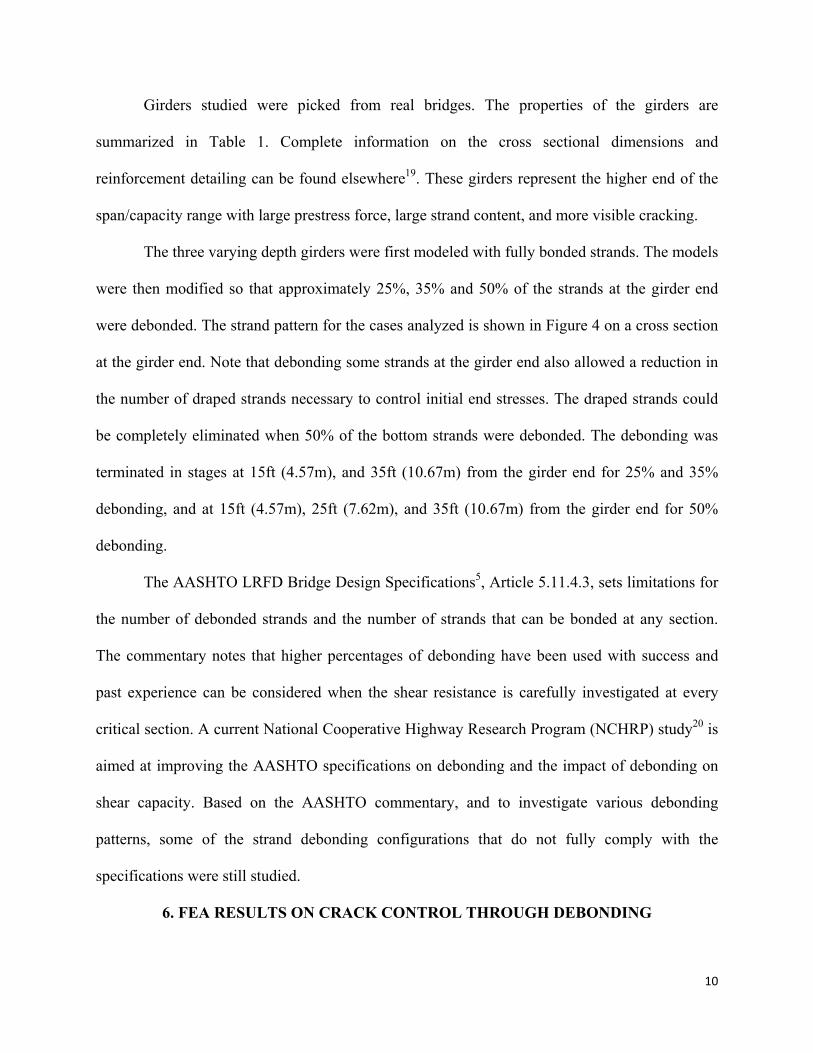
A quantitative correlation is shown in Figure 3 where the stresses in the vertical web
reinforcement of a 70in (1778mm) deep girder measured by O’Callaghan9 are compared to the
stresses obtained via the nonlinear FEA of the girder. The rebar stresses were measured at 16.5in
(419mm) (data set 1) and 31in (787mm) (data set 2) from the bottom of the girder in various
vertical bars along the length of the girder. The FEA model predicts the stresses quite accurately.
5. GIRDERS SIMULATED FOR THE DEBONDING STUDY
FEA models of standard Wisconsin wide flange girders of 54in (1372mm), 72in
(1829mm), and 82in (2083mm) depths were created. These girders, with slender and efficient
cross sections, are used for long span bridges and are similar to standard girders in other states.
Full details for the girders may be found online19. They are typically heavily prestressed and
experience serious cracking.
10
Girders studied were picked from real bridges. The properties of the girders are
summarized in Table 1. Complete information on the cross sectional dimensions and
reinforcement detailing can be found elsewhere19. These girders represent the higher end of the
span/capacity range with large prestress force, large strand content, and more visible cracking.
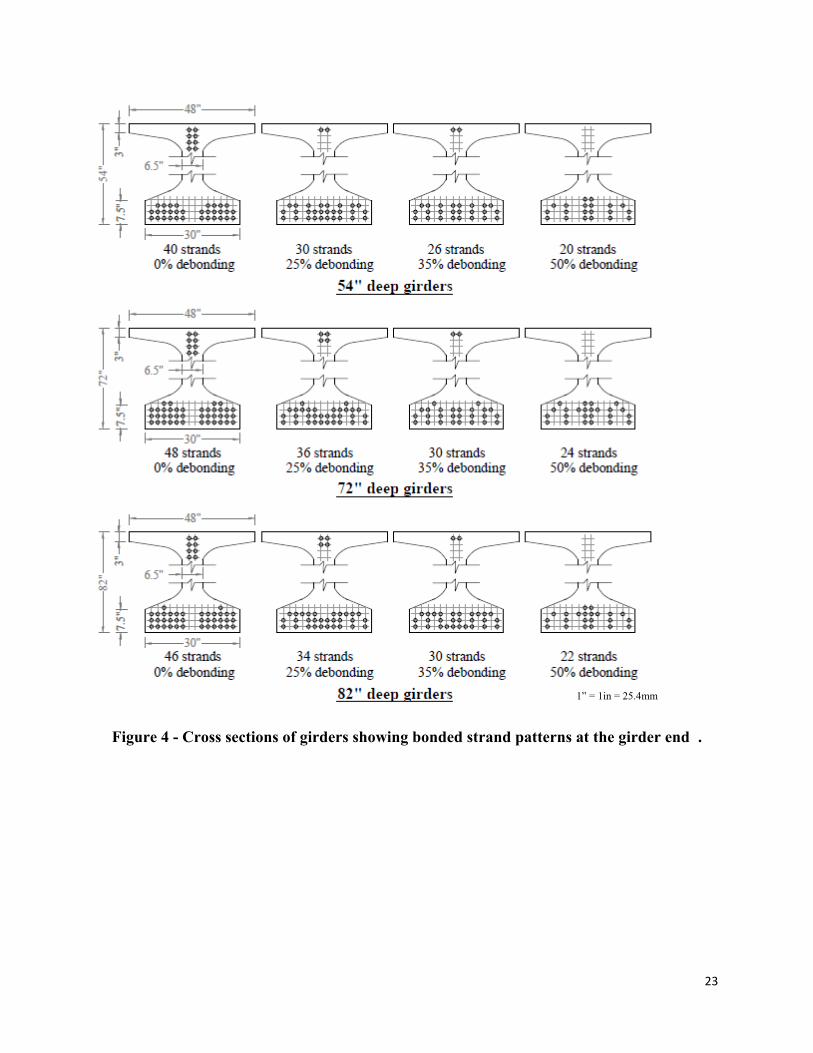
The three varying depth girders were first modeled with fully bonded strands. The models
were then modified so that approximately 25%, 35% and 50% of the strands at the girder end
were debonded. The strand pattern for the cases analyzed is shown in Figure 4 on a cross section
at the girder end. Note that debonding some strands at the girder end also allowed a reduction in
the number of draped strands necessary to control initial end stresses. The draped strands could
be completely eliminated when 50% of the bottom strands were debonded. The debonding was
terminated in stages at 15ft (4.57m), and 35ft (10.67m) from the girder end for 25% and 35%
debonding, and at 15ft (4.57m), 25ft (7.62m), and 35ft (10.67m) from the girder end for 50%
debonding.
The AASHTO LRFD Bridge Design Specifications5, Article 5.11.4.3, sets limitations for
the number of debonded strands and the number of strands that can be bonded at any section.
The commentary notes that higher percentages of debonding have been used with success and
past experience can be considered when the shear resistance is carefully investigated at every
critical section. A current National Cooperative Highway Research Program (NCHRP) study20 is
aimed at improving the AASHTO specifications on debonding and the impact of debonding on
shear capacity. Based on the AASHTO commentary, and to investigate various debonding
patterns, some of the strand debonding configurations that do not fully comply with the
specifications were still studied.
6. FEA RESULTS ON CRACK CONTROL THROUGH DEBONDING
11
The analysis results from the girders with fully bonded strands and with some debonded
strands were compared to quantify the improvement obtained from each level of debonding. The
locations along the girder where debonding is terminated were also checked for cracking.
The effects of strand debonding will be expressed here in terms of the magnitudes and the
directions of the principal tensile strains in the concrete. Since the FEA element used to model
the concrete did not explicitly crack, but rather simulated the effect of cracking through reduced
stiffness and higher strains, the strain amplitude can signal cracking. The plastic portion of the
strains in particular is the best indicator for cracking with the selected material model.
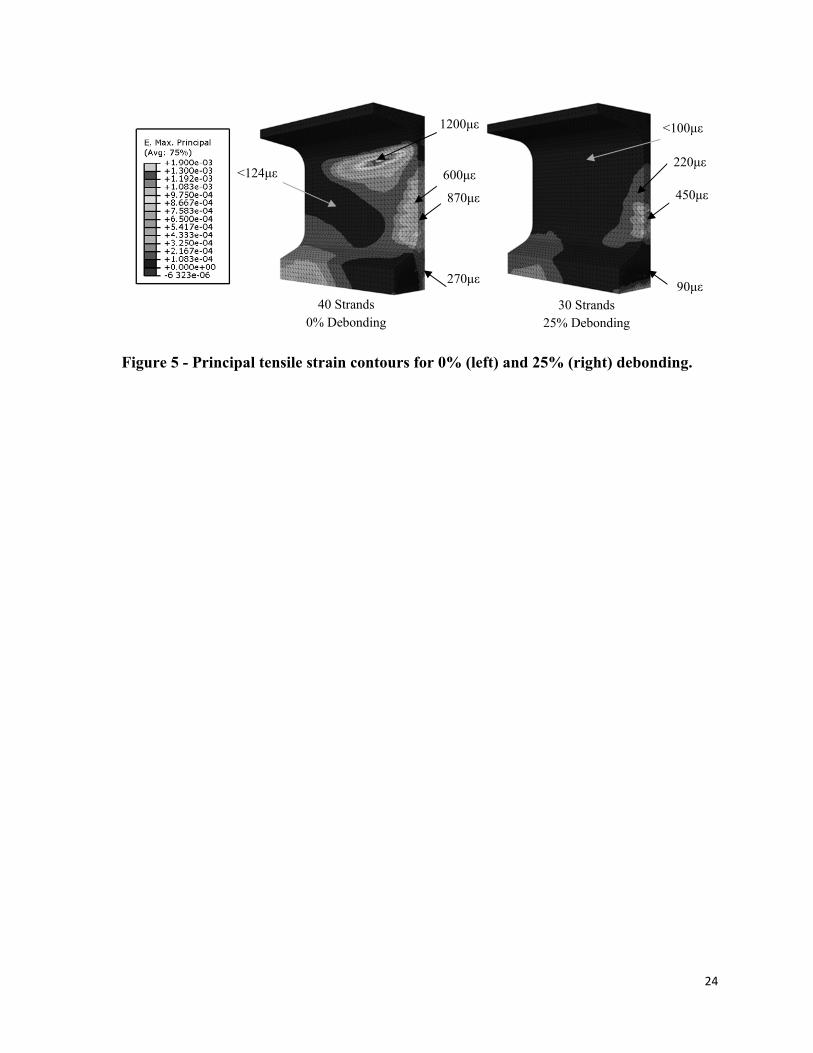
Contour plots in Figure 5 compare the principal tensile strains in the 54in (1372mm)
deep bulb tee girders for models where 0% and 25% of the strands are debonded at the girder
end. Similar results were apparent in the other girder depths examined. The contour plots for
72in (1829mm) and 82in (2083mm) deep girders can be found elsewhere3. The reduction in
principal tensile strains of these girders with debonding is qualitatively presented in the next
section.
The graphical representation in Figure 5 of the strains on the outer surface of the concrete
girder near its end suggests that the principal tensile strains in all cracking areas are already
reduced considerably when 25% of the strands are not bonded at the girder end. The theoretical
cracking strain was calculated using the AASHTO LRFD Bridge Design Specifications5 with a
concrete cracking strength provided by Section C5.4.2.7 and a constant modulus of elasticity
before cracking calculated per Section 5.2.4.2. The theoretical cracking strain for the release
strength of 7000psi (48.3 MPa), of the concrete typically used for these deep prestressed girders
is 124με.
6.1. Quantitative Comparison of the Principal Tensile Strains along the Cracks
12
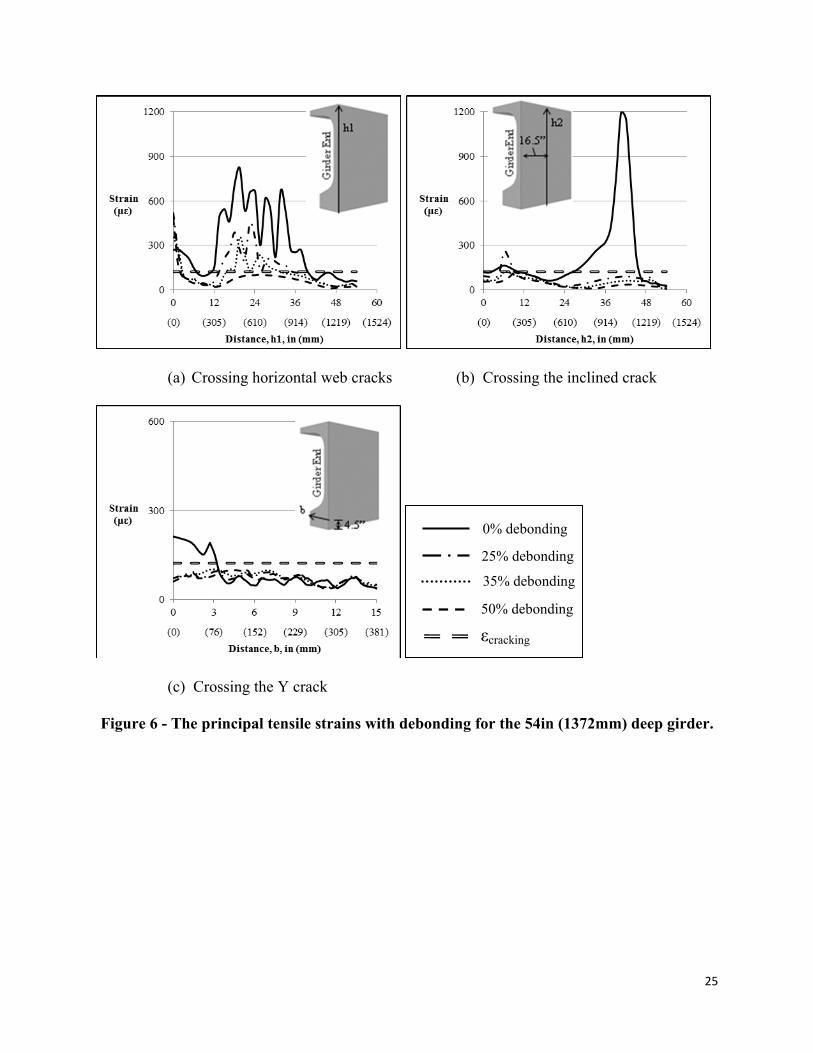
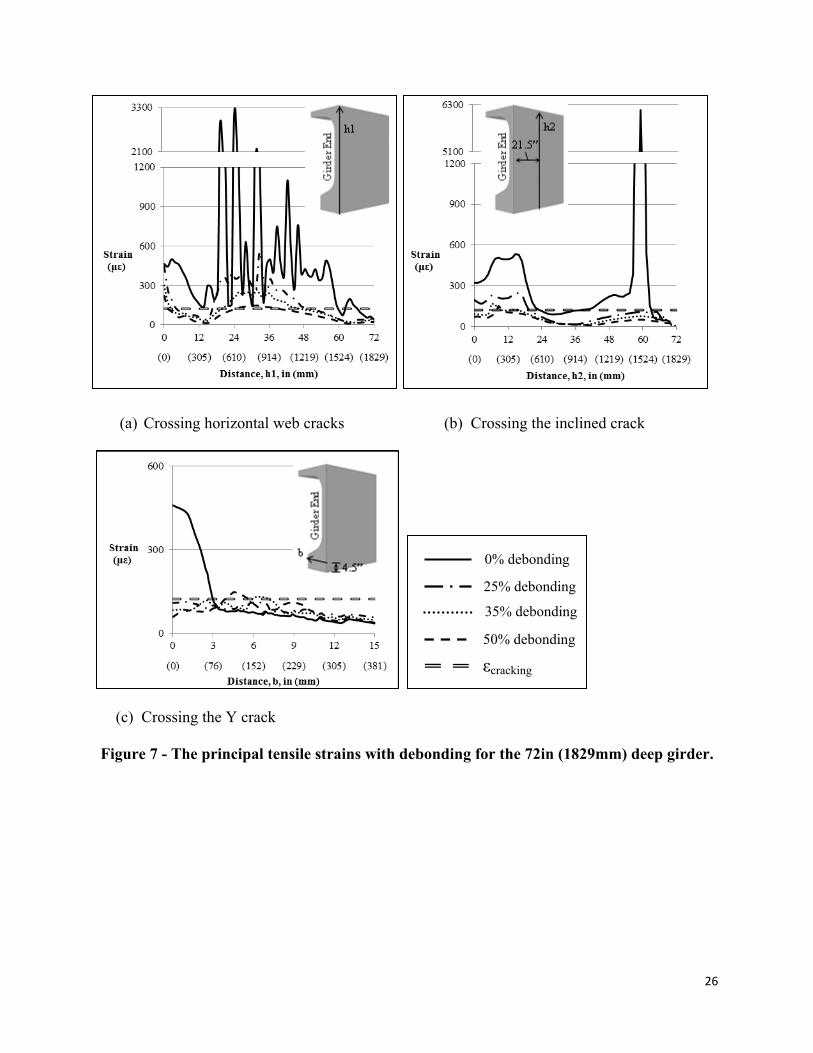
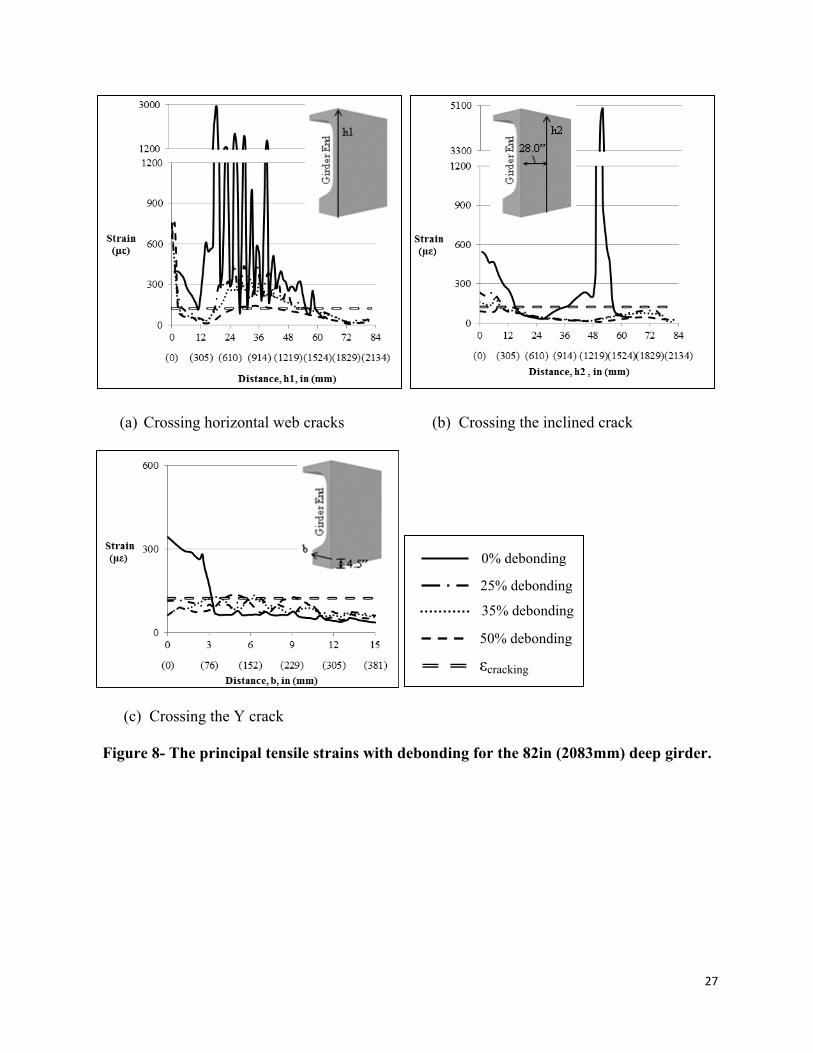
In order to evaluate the quantitative effect of debonding on cracking, the principal tensile
strains in concrete near the horizontal web, inclined, and Y cracks are plotted in Figures 6
through 8 for the various girder depths. These principal tensile strains were calculated at nodes
along the lines shown as h1, h2 and b in Figures 6 to 8. The 124με theoretical concrete cracking
strain from AASHTO LRFD Bridge Design Specifications5 is also shown. The fluctuation in the
strain values is an indication of the large increase in tensile strains when the concrete cracks and
the concrete elements lose their stiffness.
Impact on inclined cracks: The FEA results presented elsewhere3 showed that the bottom
straight strands alone created tensile strains that are perpendicular to the inclined cracks. The
inclined cracks, however, were observed to be primarily triggered as a result of added tensile
strains created by the draped strands when the resultant concrete compression strut spreads out.
Figures 6-b, 7-b and 8-b plot the principal tensile strains over a vertical line through the
depth of the girders and crossing the inclined crack. The analysis results show that the principal
tensile strains causing the inclined cracks can be reduced below the theoretical cracking limit
with as low as 25% debonding for the 54in (1372mm), 72in (1829mm) and 82in (2083mm) deep
girders. This is likely due to the reduction in the number of draped strands and reduction in
tensile strains perpendicular to the compression strut created by the draped strands.
Impact on web cracks: As the number of strands debonded at the girder end increases, the
number of expected web cracks and crack opening widths decreased consistently for all the
girders. Figures 6-a, 7-a and 8-a show that 25% and 35% debonding at the girder end will reduce
strains causing horizontal web cracking by 50% to 75% respectively. 25% to 35% debonding,
however, is not adequate to completely eliminate these cracks. If this is the goal, debonding at
least 50% of the strands at the girder end appears to be necessary.
13
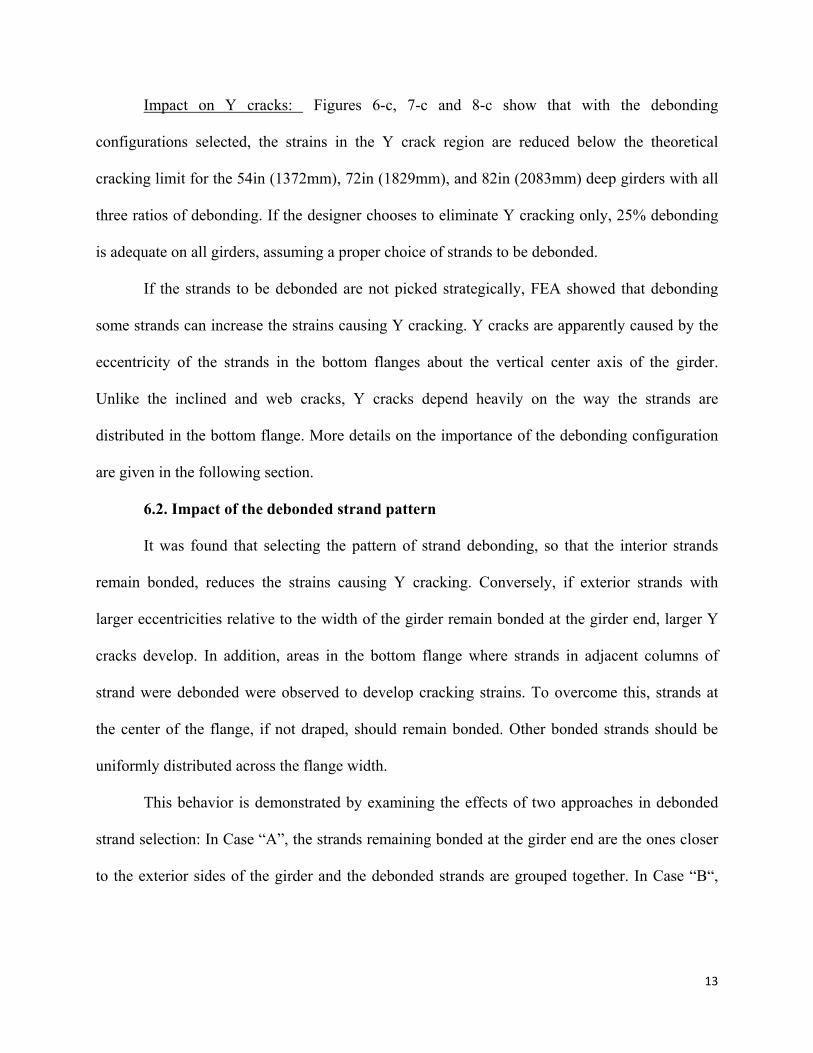
Impact on Y cracks: Figures 6-c, 7-c and 8-c show that with the debonding
configurations selected, the strains in the Y crack region are reduced below the theoretical
cracking limit for the 54in (1372mm), 72in (1829mm), and 82in (2083mm) deep girders with all
three ratios of debonding. If the designer chooses to eliminate Y cracking only, 25% debonding
is adequate on all girders, assuming a proper choice of strands to be debonded.
If the strands to be debonded are not picked strategically, FEA showed that debonding
some strands can increase the strains causing Y cracking. Y cracks are apparently caused by the
eccentricity of the strands in the bottom flanges about the vertical center axis of the girder.
Unlike the inclined and web cracks, Y cracks depend heavily on the way the strands are
distributed in the bottom flange. More details on the importance of the debonding configuration
are given in the following section.
6.2. Impact of the debonded strand pattern
It was found that selecting the pattern of strand debonding, so that the interior strands
remain bonded, reduces the strains causing Y cracking. Conversely, if exterior strands with
larger eccentricities relative to the width of the girder remain bonded at the girder end, larger Y
cracks develop. In addition, areas in the bottom flange where strands in adjacent columns of
strand were debonded were observed to develop cracking strains. To overcome this, strands at
the center of the flange, if not draped, should remain bonded. Other bonded strands should be
uniformly distributed across the flange width.
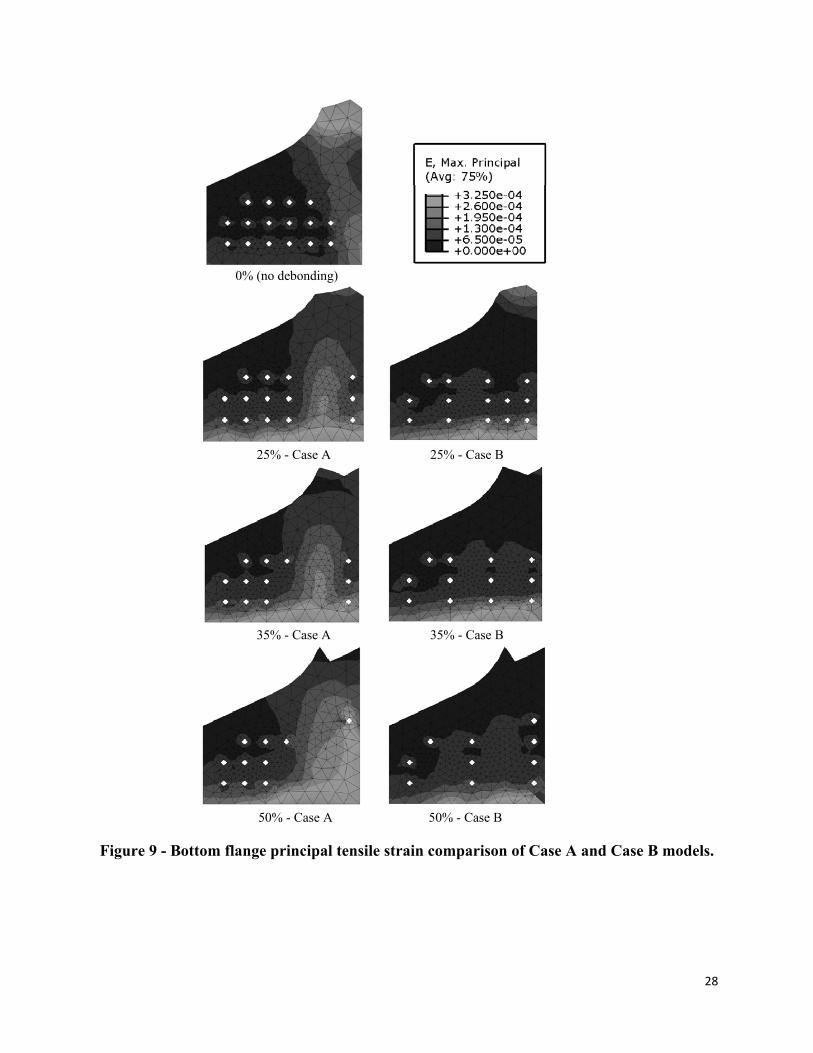
This behavior is demonstrated by examining the effects of two approaches in debonded
strand selection: In Case “A”, the strands remaining bonded at the girder end are the ones closer
to the exterior sides of the girder and the debonded strands are grouped together. In Case “B“,
14
the center strands are bonded and the debonded strands are distributed over the bottom flange.
The two cases and bonded strand patterns are shown in Figure 9.
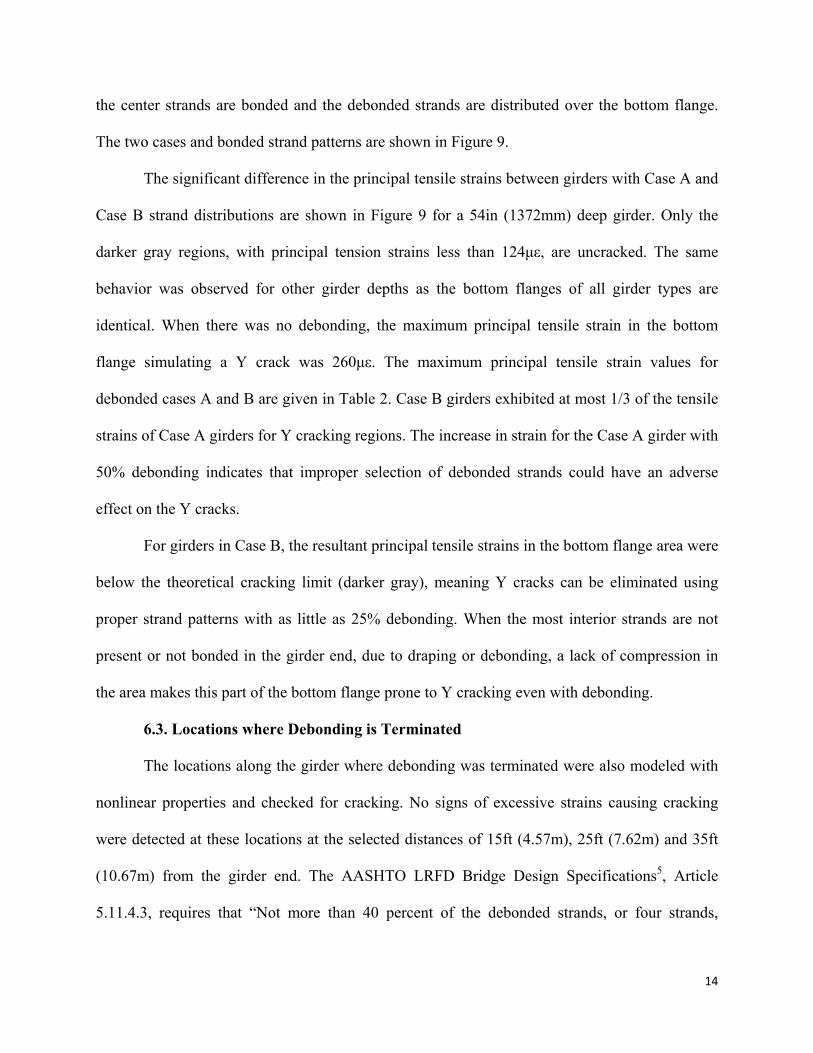
The significant difference in the principal tensile strains between girders with Case A and
Case B strand distributions are shown in Figure 9 for a 54in (1372mm) deep girder. Only the
darker gray regions, with principal tension strains less than 124με, are uncracked. The same
behavior was observed for other girder depths as the bottom flanges of all girder types are
identical. When there was no debonding, the maximum principal tensile strain in the bottom
flange simulating a Y crack was 260με. The maximum principal tensile strain values for
debonded cases A and B are given in Table 2. Case B girders exhibited at most 1/3 of the tensile
strains of Case A girders for Y cracking regions. The increase in strain for the Case A girder with
50% debonding indicates that improper selection of debonded strands could have an adverse
effect on the Y cracks.
For girders in Case B, the resultant principal tensile strains in the bottom flange area were
below the theoretical cracking limit (darker gray), meaning Y cracks can be eliminated using
proper strand patterns with as little as 25% debonding. When the most interior strands are not
present or not bonded in the girder end, due to draping or debonding, a lack of compression in
the area makes this part of the bottom flange prone to Y cracking even with debonding.
6.3. Locations where Debonding is Terminated
The locations along the girder where debonding was terminated were also modeled with
nonlinear properties and checked for cracking. No signs of excessive strains causing cracking
were detected at these locations at the selected distances of 15ft (4.57m), 25ft (7.62m) and 35ft
(10.67m) from the girder end. The AASHTO LRFD Bridge Design Specifications5, Article
5.11.4.3, requires that “Not more than 40 percent of the debonded strands, or four strands,
15
whichever is greater, shall have the debonding terminated at any section.” If this provision is
followed, the number of strands for which debonding is terminated is unlikely to be large enough
to carry the cracking problem further into the girder.
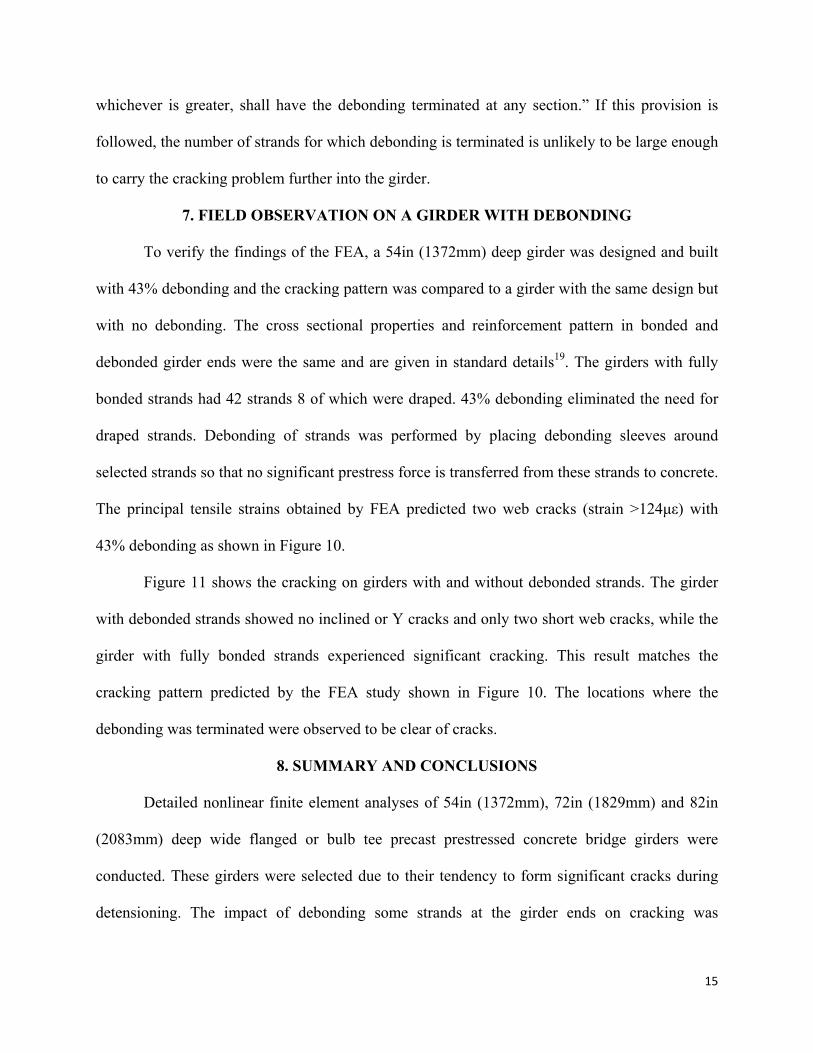
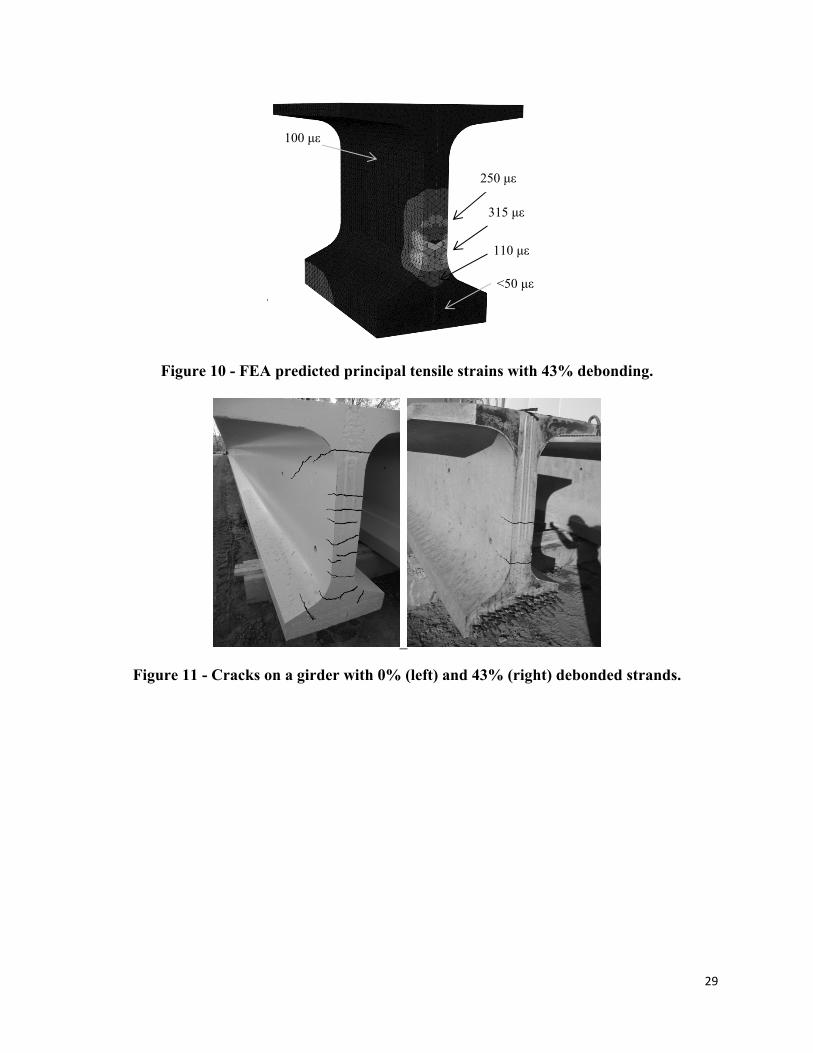
7. FIELD OBSERVATION ON A GIRDER WITH DEBONDING
To verify the findings of the FEA, a 54in (1372mm) deep girder was designed and built
with 43% debonding and the cracking pattern was compared to a girder with the same design but
with no debonding. The cross sectional properties and reinforcement pattern in bonded and
debonded girder ends were the same and are given in standard details19. The girders with fully
bonded strands had 42 strands 8 of which were draped. 43% debonding eliminated the need for
draped strands. Debonding of strands was performed by placing debonding sleeves around
selected strands so that no significant prestress force is transferred from these strands to concrete.
The principal tensile strains obtained by FEA predicted two web cracks (strain >124με) with
43% debonding as shown in Figure 10.
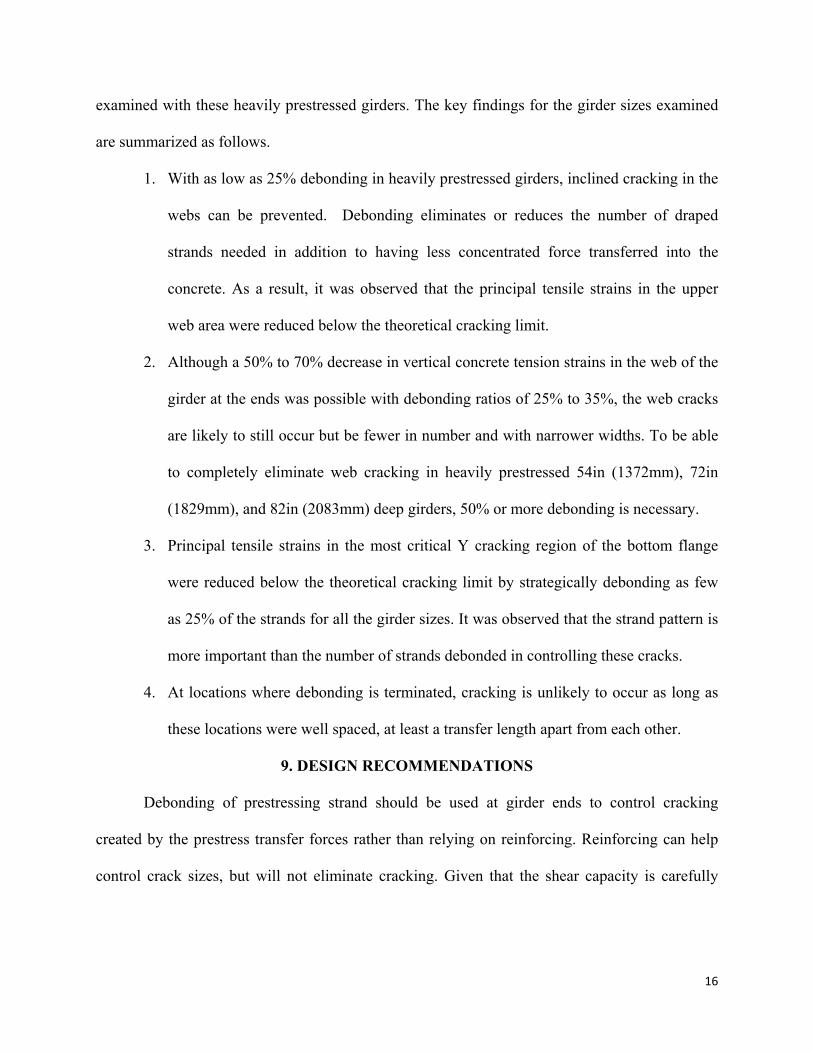
Figure 11 shows the cracking on girders with and without debonded strands. The girder
with debonded strands showed no inclined or Y cracks and only two short web cracks, while the
girder with fully bonded strands experienced significant cracking. This result matches the
cracking pattern predicted by the FEA study shown in Figure 10. The locations where the
debonding was terminated were observed to be clear of cracks.
8. SUMMARY AND CONCLUSIONS
Detailed nonlinear finite element analyses of 54in (1372mm), 72in (1829mm) and 82in
(2083mm) deep wide flanged or bulb tee precast prestressed concrete bridge girders were
conducted. These girders were selected due to their tendency to form significant cracks during
detensioning. The impact of debonding some strands at the girder ends on cracking was
16
examined with these heavily prestressed girders. The key findings for the girder sizes examined
are summarized as follows.
1. With as low as 25% debonding in heavily prestressed girders, inclined cracking in the
webs can be prevented. Debonding eliminates or reduces the number of draped
strands needed in addition to having less concentrated force transferred into the
concrete. As a result, it was observed that the principal tensile strains in the upper
web area were reduced below the theoretical cracking limit.
2. Although a 50% to 70% decrease in vertical concrete tension strains in the web of the
girder at the ends was possible with debonding ratios of 25% to 35%, the web cracks
are likely to still occur but be fewer in number and with narrower widths. To be able
to completely eliminate web cracking in heavily prestressed 54in (1372mm), 72in
(1829mm), and 82in (2083mm) deep girders, 50% or more debonding is necessary.
3. Principal tensile strains in the most critical Y cracking region of the bottom flange
were reduced below the theoretical cracking limit by strategically debonding as few
as 25% of the strands for all the girder sizes. It was observed that the strand pattern is
more important than the number of strands debonded in controlling these cracks.
4. At locations where debonding is terminated, cracking is unlikely to occur as long as
these locations were well spaced, at least a transfer length apart from each other.
9. DESIGN RECOMMENDATIONS
Debonding of prestressing strand should be used at girder ends to control cracking
created by the prestress transfer forces rather than relying on reinforcing. Reinforcing can help
control crack sizes, but will not eliminate cracking. Given that the shear capacity is carefully
17
checked with the reduced prestress at the girder ends, debonding is an appealing answer to the
cracking problem.
25% debonding and reduction in the use of draped strands is recommended as an
approach to control end cracking in heavily prestressed girders. 25% debonding will avoid the
formation of Y cracks, if the pattern of debonded strands is carefully selected. Since the Y cracks
are the most serious and most likely to lead to strand corrosion and strength loss, their control is
critical. This level of debonding also has the potential to eliminate most of the draped strand and
the inclined cracks.
The bonded and unbonded strands in the bottom flange of the girder should be uniformly
spaced across the flange rather than being grouped. The central strands should remain bonded
where possible to control bottom flange cracking. The distribution of bonded strands in the
bottom flange is very important.
A higher amount of debonding could be used to provide full control of the concrete
cracking. Debonding 50% of the strands at the end should be used when elimination of all
cracking is desired. On the other hand, web cracks are considered to be less harmful since they
are not located close to strands and are likely to close under service loads. Less debonding will
be preferred in most cases.
10. ACKNOWLEDGEMENTS
This work was funded by the Wisconsin Highway Research Program of the Wisconsin
Department of Transportation. The Wisconsin Department of Transportation and County
Materials Corp. participated in the construction of test girders. The views presented are those of
the authors and not the funding agency.
18
11. REFERENCES
1. Gamble, W.L., "Field Investigation of a Continuous Composite Prestressed I Beam Highway
Bridge Located in Jefferson County, Illinois," University of Illinois, Urbana IL, 1970 Jun. Report
no: SRS 360.
2. Okumus, P., Oliva, M. G., “Evaluation of Crack Control Methods for Deep Pretensioned
Bridge Girder Ends”, PCI Journal, Spring 2013.
3. Oliva, M.G., and Okumus, P., "Finite Element Analysis of Deep Wide-Flanged Pre-stressed
Girders," Wisconsin Highway Research Program, June 2011, Report no: WHRP 11-06.
4. Okumus, P., Oliva, M.G., and Becker, S., "Nonlinear Finite Element Modeling of Cracking at
Ends of Pretensioned Bridge Girders," Engineering Structures, V. 40, July 2012, pp.267-275.
5. AASHTO, "LRFD Bridge Design Specifications, Customary US Units, with 2008 Interim
Revisions,"American Association of State Highway and Transportation Officials, Washington,
DC., 2008
6. Mirza, J.F., and Tawfik, M.E., "End Cracking in Prestressed Members During Detensioning,"
PCI Journal, V. 23, No. 2. , Mar.-Ap. 1978, pp. 66-77.
7. Marshall, W.T., and Mattock, A.H., "Control of Horizontal Cracking in the Ends of
Pretensioned Prestressed Concrete Girders," PCI Journal, Oct. 1962, V. 7, No. 5, pp. 56-74.
8. Tuan, C.Y., Yehia, S.A., Jongpitaksseel, N., and Tadros, M.K., "End Zone Reinforcement for
Pretensioned Concrete Girders," PCI Journal, May-Jun. 2004, V. 49, No. 3, pp. 68-82.
9. O'Callaghan, M.R., "Tensile Stresses in the End Regions of Pretensioned I-Beams at Release,"
Thesis, The University of Texas at Austin, Tx, 2007, 265 pp.
19
10. Dunkman, D.A., Hovell, C.G., Moore, A.M., Avendano, A., Bayrak, O., and Jirsa, J.O.,
"Bursting and Spalling in Pretensioned Concrete Beams," Proceedings of the 3rd fib
International Congress, May 29-June 2, 2010, Washington DC..
11. Breen, J.E., Bürdet, О., Roberts, С., Sanders, D., Wollmann, G., and Falconer, В.,
"Anchorage Zone Reinforcement for Post-Tensioned Concrete Girders, " The University of
Texas at Austin, Tx, NCHRP Report, 1994, Report No: 356
12. Castrodale, R.W., Lui, A., and White, C.D., "Simplified Analysis of Web Splitting in
Pretensioned Concrete Girders," Proceedings of the PCI/FHWA/NCBC Concrete Bridge
Conference, October 6-9, 2002, Nashville, Tn.
13. Crispino, E.D., Cousins, T.E., and Roberts-Wollmann, C.L., "Anchorage Zone Design for
Pretensioned Precast Bulb-T Bridge Girders in Virginia," Virginia Transportation Research
Council, Report No: FHWA/VTRC 09-CR15.
14. Gergely, P., and Sozen, M.A., "Design of Anchorage-Zone Reinforcement in Prestressed
Concrete Beams," PCI Journal, Apr. 1967, V. 12, No. 2, pp. 63-75.
15. Myers, J.J., Gopalaratnam, V., Nanni, A., Stone, D., and Earney, T.P., "Precast I-girder
Cracking: Causes and Design Details," Center for Infrastructure Engineering Studies and
Missouri Department of Transportation Research, Development, and Technology, Report No:
00-06, V. RI97-021.
16. Kannel, J., French, C., and Stolarski, H., "Release Methodology of Strands to Reduce End
Cracking in Pretensioned Concrete Girders,"PCI Journal, Jan.-Feb. 1997, V. 42, No. 1, pp.42-54.
17. Dassault Systèmes Simulia Corporation, "Abaqus Analysis User's Manual (6.9)," In: Abaqus
Documentation , Dassault Systèmes, 2009, RI, 2009.
20
18. Fédération Internationale du Béton, "Model Code 2010 - First complete draft," fib Bulletin
no. 55, pp. 318.
19. Bureau of Structures, "Highway Structures - WisDOT LRFD, Standard Detail Drawings,"
http://on.dot.wi.gov/dtid_bos/extranet/structures/LRFD/standards.htm, 2010.
20. “Strand Debonding for Pretensioned Girders”, NCHRP 12-91 (Contract Pending),
Transportation Research Board, http://www.trb.org/Main/Search2.aspx?q=12-91.
12. TABLES AND FIGURES
List of Tables:
Table 1 – Properties of the girders modeled.
Table 2 - Maximum principal tensile strains creating Y cracks for Case A and B girders.
List of Figures:
Figure 1 - Typical inclined, horizontal web and Y cracks marked on a girder.
Figure 2 - Cracks on the girder instrumented (left), high principal tensile strain locations on the
FEA model (right).
Figure 3– Stresses in rebars along the girder obtained by tests9 and FEA.
Figure 4 – Cross sections of girders showing bonded strand patterns at the girder end�.
Figure 5 - Principal tensile strain contours for 0% (left) and 25% (right) debonding.
Figure 6 - The principal tensile strains with debonding for the 54in (1372mm) deep girder.
Figure 7 - The principal tensile strains with debonding for the 72in (1829mm) deep girder.
Figure 8 - The principal tensile strains with debonding for the 82in (2083mm) deep girder.
Figure 9 - Bottom flange principal tensile strain comparison of Case A and Case B models.
Figure 10 - FEA predicted principal tensile strains with 43% debonding.
21
Figure 11 - Cracks on a girder with 0% (left) and 43% (right) debonded strands.
Table 1 – Properties of the girders modeled.
Girder Depth,
in (mm)
Girder Length, ft (m)
Number of Strands (fully bonded case)
Strand Diameter, in (mm)
Force per Strand at Transfer, kip (kN)
Concrete Strength at
transfer, psi (MPa)
54 (1372) 129 (39.3) 32 straight+8 draped 0.6 (15.2) 43.5 (193.5) 7000 (48.3)
72 (1829) 155 (47.2) 40 straight+8 draped 0.6 (15.2) 43.5 (193.5) 7000 (48.3)
82 (2083) 159 (48.5) 38 straight+8 draped 0.6 (15.2) 43.5 (193.5) 7000 (48.3)
Table 2- Maximum principal tensile strains creating Y cracks for Case A and B girders.
Deboning\Case Case A Case B
25% debonding 270 με 90 με
35% debonding 280 με 90 με 50% debonding 420 με 100 με
Figure 1 - Typical inclined, horizontal web and Y cracks marked on a girder.
Horizontal Web Cracks
Inclined Cracks
Y Cracks
22
Figure 2 - Cracks on the girder instrumented (left), high principal tensile strain locations
on the FEA model (right).
Figure 3– Stresses in rebars along the girder obtained by tests9 and FEA.
250με
850με
650με
4000με
850με
<100με
23
Figure 4 - Cross sections of girders showing bonded strand patterns at the girder end�.
�1” = 1in = 25.4mm
24
Figure 5 - Principal tensile strain contours for 0% (left) and 25% (right) debonding.
30 Strands 25% Debonding
870με
1200με
270με
450με
<100με
90με
600με <124με 220με
40 Strands 0% Debonding
25
(a) Crossing horizontal web cracks (b) Crossing the inclined crack
(c) Crossing the Y crack
Figure 6 - The principal tensile strains with debonding for the 54in (1372mm) deep girder.
0% debonding
25% debonding
35% debonding
50% debonding
εcracking
26
(a) Crossing horizontal web cracks (b) Crossing the inclined crack
(c) Crossing the Y crack
Figure 7 - The principal tensile strains with debonding for the 72in (1829mm) deep girder.
0% debonding
25% debonding
35% debonding
50% debonding
εcracking
27
(a) Crossing horizontal web cracks (b) Crossing the inclined crack
(c) Crossing the Y crack
Figure 8- The principal tensile strains with debonding for the 82in (2083mm) deep girder.
0% debonding
25% debonding
35% debonding
50% debonding
εcracking
28
Figure 9 - Bottom flange principal tensile strain comparison of Case A and Case B models.
0% (no debonding)
25% - Case A 25% - Case B
35% - Case A 35% - Case B
50% - Case A 50% - Case B
29
Figure 10 - FEA predicted principal tensile strains with 43% debonding.
Figure 11 - Cracks on a girder with 0% (left) and 43% (right) debonded strands.
250 με
315 με
110 με
<50 με
100 με
Recommended