STRABAG SEFY 2018 RESULTS
29 APRIL 2019

This presentation is made by STRABAG SE (the "Company") solely for use at investor meetings and is furnished to you solely for your
information.
This presentation speaks as of April 2019. The facts and information contained herein might be subject to revision in the future. Neither the
delivery of this presentation nor any further discussions of the Company with any of the recipients shall, under any circumstances, create any implication that there has been no change in the affairs of the Company since such date. None of the Company or any of its parents or subsidiaries or any of such person's directors, officers, employees or advisors nor any other person (i) accepts any obligation to update any information
contained herein or to adjust it to future events or developments or (ii) makes any representation or warranty, express or implied, as to, and no reliance should be placed on, the accuracy or completeness of the information contained in this presentation. None of the Company or any of its parents or subsidiaries or any of their directors, officers, employees and advisors nor any other person shall have any liability whatsoever (in
negligence or otherwise) for any loss howsoever arising, directly or indirectly, from any use of this presentation. The same applies to information contained in other material made available at the meeting.
This document is selective in nature and is intended to provide an introduction to, and overview of, the business of the Company. Where any information and statistics are quoted from any external source, such
information or statistics should not be interpreted as having been adopted or endorsed by the Company as being accurate.
This presentation contains forward-looking statements relating to the business, financial performance and results of the Company and/or the industry in which the Company operates. These statements generally are
identified by words such as "believes“, "expects”, "predicts”, "intends”, "projects”, "plans”, "estimates”, "aims”, "foresees”, "anticipates”, "targets”, and similar expressions. The forward-looking statements, including but not limited to assumptions, opinions and views of the Company or information from third party sources, contained in this presentation are based on current plans, estimates, assumptions and projections and involve
uncertainties and risks. Various factors could cause actual future results, performance or events to differ materially from those described in these statements. The Company does not represent or guarantee that the assumptions underlying such forward-looking statements are free from errors nor do they accept any responsibility for the future accuracy of the opinions expressed in this presentation. No obligation is assumed to
update any forward-looking statements.
By accepting this presentation you acknowledge that you will be solely responsible for your own assessment of the market and of the market
position of the Company and that you will conduct your own analysis and be solely responsible for forming your own view of the potential future performance of the Company's business.
DISCLAIMER
2 FY 2018, April 2019
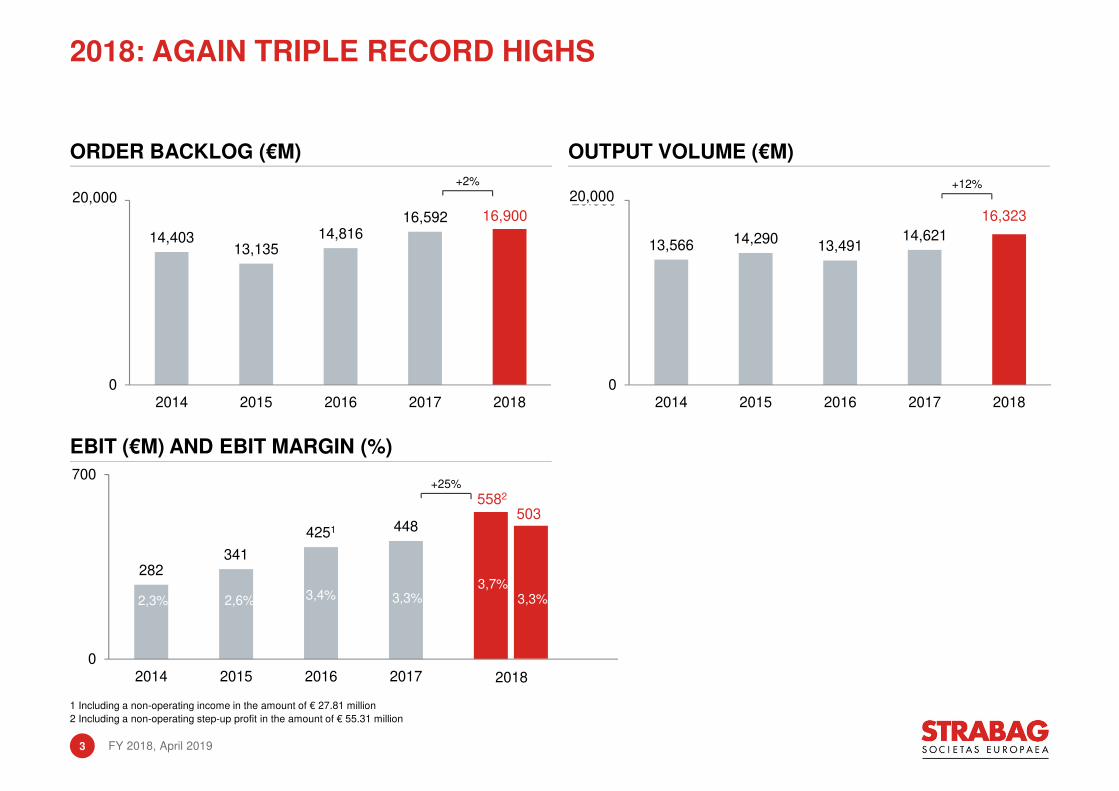
ORDER BACKLOG (€M) OUTPUT VOLUME (€M)
EBIT (€M) AND EBIT MARGIN (%)
1 Including a non-operating income in the amount of € 27.81 million
2 Including a non-operating step-up profit in the amount of € 55.31 million
FY 2018, April 20193
2018: AGAIN TRIPLE RECORD HIGHS
14,40313,135
14,81616,592
0
20.000
2014 2015 2016 2017 2018
16,900
13,566 14,29013,491
14,621
0
20.000
2014 2015 2016 2017 2018
16,323
3.7%
3.3%3.4%
2.3%2.6%
20,000 20,000+2% +12%
282341
4251 448
0
700
2014 2015 2016 2017 2018
5582+25%
503
2018
3,7%3,3%3,4%2,3% 2,6% 3,3%

Germany48%
Austria16%
CEE22%
Rest of Europe7%
Rest of world7%
OUTPUT VOLUME BY REGION 2018
16,32314,621
0
20000
2018 2017
● Growth in all of the group’s most important markets
● Unusual good construction weather 2018
● In the Americas, the output volume grew as a result of the contract extension for the Alto Maipotunneling project in Chile
● Decreases only in smaller markets like Switzerland, Denmark and Russia
OUTPUT VOLUME (€M)
OUTPUT VOLUME AT RECORD LEVEL OF 16.3 BILLION
+12%20,000
4 FY 2018, April 2019
CEE = Central and Eastern Europe

Germany43%
Austria12%
CEE23%
Rest of Europe11%
Rest of world11%
ORDER BACKLOG BY REGION 2018
16,900 16,592
0
20000
2018 2017
ORDER BACKLOG (€M)
NUMEROUS ORDERS IN THE GROUP’S LARGEST MARKETS
+2%20,000 ● Large orders above all in Germany, Austria and
Poland
● Contract extension for the Alto Maipo tunnellingproject in Chile
● With the working-off of large-scale projects, the order backlog fell back in places like Hungary, Slovakia and Russia
5 FY 2018, April 2019
CEE = Central and Eastern Europe

9531
0
1200
2018 2017
5581
448
0
1000
2018 2017
EBIT (€M) AND EBIT MARGIN (%)
● EBITDA 2018 adjusted for a non-operating step-up profit regarding the consolidation of PANSUEVIA, the BAB A8 concession company: € 897 million
(+8%)
● Property and Facility Services and Real Estate
Development continued to make very positive contributions to the earnings
● Absence of burdens from large, loss-making projects in the international area
● EBIT 2018 adjusted for non-operating step-up profit: € 503 million (+12%), EBIT margin 3.3%
● Growth attributable to International + Special Divisions
EBITDA (€M) AND EBITDA MARGIN (%)
EBIT GROWTH IN THE DOUBLE-DIGIT AREA – EVEN WHENADJUSTED
+14%
+25%
6.3%1 6.2%
3.7%1 3.3%
1,200
1,000
6
835
FY 2018, April 2019
1 Including a non-operating step-up profit in the amount of € 55.31 million

354
279
0
400
2018 2017
NET INCOME A. MINORITIES (€M) & MARGIN (%)
3.45
2.72
0
4
2018 2017
EARNINGS PER SHARE (€)
EARNINGS PER SHARE ROSE SIGNIFICANTLY
+27%+27%
2.3% 2.1%
● Net interest income comparable to that of the previous year
● Income tax rate stood slightly higher at 31.7% (2017: 30.6%)
● Earnings owed to minority shareholders fell from € 13 million to € 9 million; 2018 the first year in which no
minority shareholders had to be considered at STRABAG AG, Germany
7 FY 2018, April 2019

0.500.65
0.95
1.30 1.30
40% 43%
35%
48%
38%
0%
100%
€ 0
€ 2
2014 2015 2016 2017 2018
● Payout ratio 2018 of 38% within predetermined payout range of 30–50% of net income after minorities
● STRABAG has distributed a dividend within the predetermined payout range every year since the
IPO in 2007
(PROPOSED) DIVIDEND (€) AND PAYOUT RATIO (%)
UNCHANGED HIGH DIVIDEND OF € 1.30 PER SHARE PROPOSED
8 FY 2018, April 2019
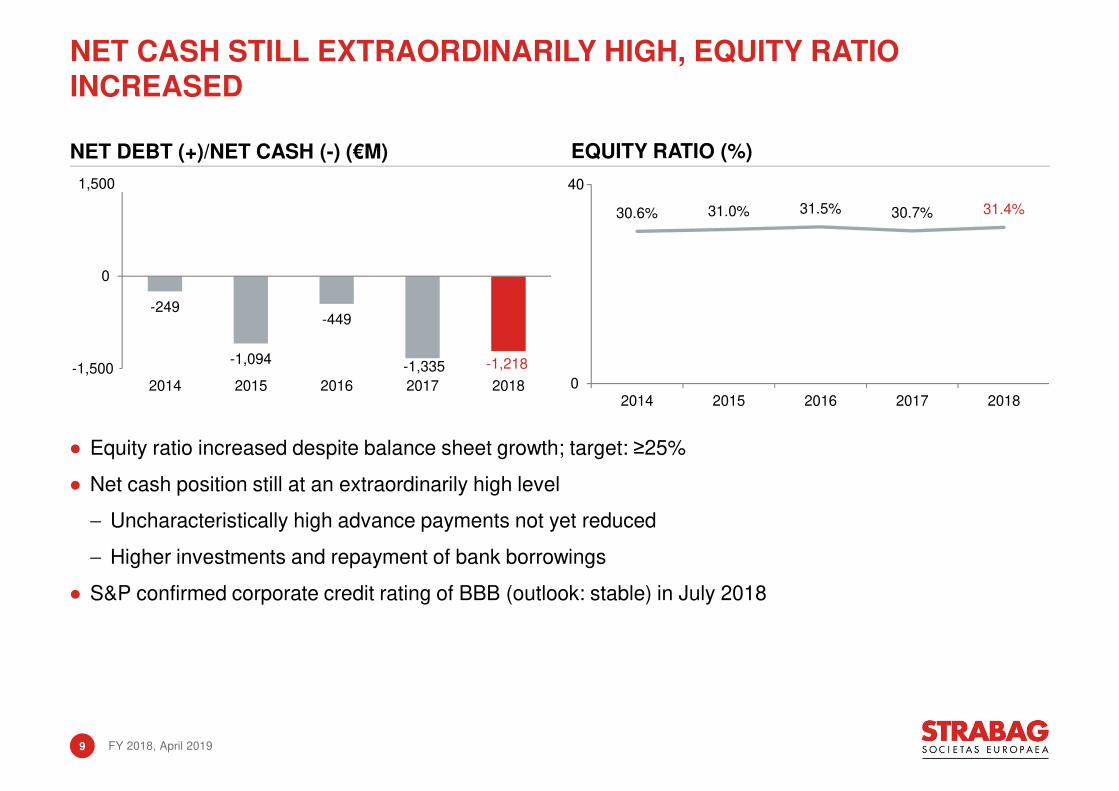
-249
-1,094
-449
-1,335 -1,218-1500
0
1500
2014 2015 2016 2017 2018
NET DEBT (+)/NET CASH (-) (€M)
30.6% 31.0% 31.5% 30.7% 31.4%
0
0
2014 2015 2016 2017 2018
● Equity ratio increased despite balance sheet growth; target: ≥25%
● Net cash position still at an extraordinarily high level
− Uncharacteristically high advance payments not yet reduced
− Higher investments and repayment of bank borrowings
● S&P confirmed corporate credit rating of BBB (outlook: stable) in July 2018
NET CASH STILL EXTRAORDINARILY HIGH, EQUITY RATIO INCREASED
40
EQUITY RATIO (%)
1,500
-1,500
9 FY 2018, April 2019

(€m) 2018 ∆% 2017
Cash – beginning of period 2,790 40 1,998
Cash flow from earnings 654 3 634
∆ Working Capital 82 -88 711
Cash flow from operating activities 736 -45 1,345
Cash flow from investing activities -588 -76 -333
Cash flow from financing activities -534 -128 -235
Net change in cash -386 n.a. 777
FX changes -19 n.a. 10
Change restricted cash -1 n.a. 5
Cash – end of period 2,384 -15 2,790
Rounding differences might occur.
CASH AND CASH EQUIVALENTS OF € 2.4 BILLION
10 FY 2018, April 2019

-107-263
-49
1,001
-418 -330-172
494
-69-209 -123
1,112
-65-230 -227
604
-1300
0
1300
Q1 Q2 Q3 Q4 Q1 Q2 Q3 Q4 Q1 Q2 Q3 Q4 Q1 Q2 Q3 Q42015 2016 2017
WORKING CAPITAL PATTERN: CASH OUTFLOWS IN Q1–3; INFLOWS IN Q4 (€M)
COMMENTS
● Working capital outflows generally occur over the first nine months of the year due to business seasonality
● Record cash-inflow in Q4/2017 – expectation of increase in working capital to familiar levels in 2018 did not materialise
AGAIN HIGH CASH INFLOW IN Q4
2018
1,300
-1,300
11 FY 2018, April 2019

-426
711
82
-800
0
800
2016 2017 2018
Δ WORKING CAPITAL (€M)
264
1,345
736
434333
588
0
1500
2016 2017 2018
CFO VS. CFI (€M)
434333
588430 386 394
0
1500
2016 2017 2018
CFI VS. DEPRECIATION (€M)
ANOTHER YEAR OF POSITIVE FREE CASH FLOW
1,500 1,500
● Another positive Free Cash Flow in 2018 despite extraordinarily high WC decrease in 2017
● Purchase of PP&E at € 645 million (2017: € 458 million), thereof ~ € 250 million maintenance CAPEX
● 2018 depreciation includes almost unchanged goodwill impairment of € 2 million (2017: € 2 million)
12 FY 2018, April 2019

48% of group output
volume
KEY INDICATORS
● Output volume +14% over the past year
● EBIT declined by 19% – Provisions for individual large-scale projects in several countries
● Order backlog (+8%) driven by Germany, Poland and Denmark
● Outlook:
− Stabilisation at high level expected
− German building construction and civil engineering: situation in the subcontractor and supplier markets remains very tense in the light
of the construction boom
− Lack of capacities remains limiting factor in German transportation infrastructure market
− Poland: Satisfactory result forecasted thanks to greater selection of projects
COMMENTS
SHARE OF GROUP OUTPUT VOLUME
NORTH + WEST CHARACTERISED BY HIGH ORDER BACKLOG AND PROVISIONS FOR LARGE-SCALE PROJECTS
(€m) 2018 Δ% 2017
Output volume 7,827 14 6,843
Revenue 7,242 14 6,378
Order backlog 8,804 8 8,138
EBIT 161 -19 199
EBIT margin (% of rev.) 2.2 3.1
Employees (FTE) 24,222 4 23,366
13 FY 2018, April 2019

28% of group output volume
(€m) 2018 Δ% 2017
Output volume 4,639 9 4,242
Revenue 4,522 11 4,073
Order backlog 4,311 -4 4,505
EBIT 142 -31 205
EBIT margin (% of rev.) 3.1 5.0
Employees (FTE) 18,729 5 17,916
KEY INDICATORS
● Output volume up by 9% due to Austria, Hungary and Czech Republic
● EBIT margin normalised from an exceptionally high level to a lower level of 3.1%
● Order backlog (-4%): Reduction in Hungary and Slovakia surpasses increase in Austria
● Outlook:
− Margins expected to stay at an attractive level
− The majority of markets is defined by high demand coupled with a shortage of skilled
labour
− Construction climate is getting tenser in the Czech Republic and Slovakia
− Hungary: Working off the high order backlog
COMMENTS
SHARE OF GROUP OUTPUT VOLUME
SOUTH + EAST: INTENSIFIED COMPETITION
14 FY 2018, April 2019

23% of group output volume
● Output volume down especially due to Italy
● EBIT hardly changed in absolute terms – number of contrary effects related to large projects
● Order backlog coined by tunnelling project for Chilean copper mine
● Outlook:
− Output volume 2017 should increase slightly
− Property and facility services business as well as real estate development contribute positively to earnings
− Very competitive market for tunnelling and concession projects
KEY INDICATORS
● Output volume rose by 10%, attributable especially to working off of the tunnelling project Alto Maipo in Chile
● EBIT more than tripled: Absence of prior-year earnings burdens as well as strong contributions to
earnings from property and facility services and real estate development
● Order backlog lower by 4%: Contract extension in Chile and new order in UK, reduction in Austria, Italy and Asia
● Outlook:
− Slightly lower output volume and earnings on
the same level as in the previous year forecasted
− Real estate development and concession
business should continue to make significant earnings contributions
COMMENTS
SHARE OF GROUP OUTPUT VOLUME
INTERNATIONAL + SPECIAL DIVISIONS: ABSENCE OF PRIOR-YEAR EARNINGS BURDENS
(€m) 2018 Δ% 2017
Output volume 3,740 10 3,404
Revenue 3,438 13 3,029
Order backlog 3,782 -4 3,944
EBIT 199 218 62
EBIT margin (% of rev.) 5.8 2.1
Employees (FTE) 26,279 3 25,618
15 FY 2018, April 2019

2019: STABLE AT A HIGH LEVEL
● Output volume 2019 of about € 16.0 billion expected to continue to stay at a high level (-2%)
● EBIT margin 2019 at least 3.3%
16 FY 2018, April 2019

APPENDIX

720816 8271 835
8972
0
1000
2014 2015 2016 2017 2018
13,566 14,290 13,491 14,62116,323
0
20000
2014 2015 2016 2017 2018
OUTPUT VOLUME (€M) ORDER BACKLOG (€M)
EBITDA (€M) AND EBITDA MARGIN (%) EBIT (€M) AND EBIT MARGIN (%)
1 Adjusted for non-operating income in the amount of € 27.81 million
2 Adjusted for a non-operating step-up profit in the amount of € 55.31 million
FLEXIBLE BUSINESS MODEL, SELECTIVE DIVERSITY: RESILIENCE IN A VOLATILE INDUSTRY
5.8% 6.2% 6.7%1
3.4%
1.6%2.1% 2.3%6.2%
2.6%5.9%2
14,40313,135
14,81616,592 16,900
0
20000
2014 2015 2016 2017 2018
282341 3971
4485032
0
1000
2014 2015 2016 2017 2018
20,000 20,000
1,0001,000
2.3% 2.6% 3.2%1 3.3% 3.3%2
18 FY 2018, April 2019

(€m) 2018 2017
Share capital 110 110
Capital reserves 2,315 2,315
Retained earnings 1,195 945
Non-controlling interests 33 27
Total equity 3,654 3,398
Provisions 1,117 1,161
Financial liabilities 1,088 883
Other liabilities 79 78
Deferred taxes 97 24
Non-current liabilities 2,380 2,145
Provisions 734 747
Financial liabilities 276 411
Contract liabilities 975 0
Trade payables 2,615 3,402
Other current liabilities 988 950
Current liabilities 5,588 5,511
Equity and liabilities 11,621 11,054
ASSETS1 EQUITY AND LIABILITIES1
1 Rounding differences might occur.
EQUITY RATIO REMAINS HIGH AT 31%
19 FY 2018, April 2019
(€m) 2018 2017
Intangible assets 493 499
Rights from concession
arrangements 601 0
PP&E & investment property 2,144 1,942
Equity-accounted investments 379 350
Other investments 185 183
Concession receivables 630 662
Other receivables 251 271
Deferred taxes 147 189
Non-current assets 4,830 4,096
Inventories 890 1,138
Concession receivables 36 34
Contract assets 1,283 0
Trade and other receivables 2,196 2,996
Cash and cash equivalents 2,386 2,790
Current assets 6,791 6,958
Total Assets 11,621 11,054

(€m) 2018 2017 Δ%
Output volume 16,322.88 14,620.89 12
Revenue 15,221.83 13,508.72 13
Changes in inventories/own work capitalised -33.07 -48.09 31
Other operating income 222.98 282.99 -21
Construction materials, consumables andservices used -10,125.77 -8,839.87 -15
Employee benefits expenses -3,618.94 -3,367.17 -7
Other operating expenses -854.89 -842.79 -1
Share of profit or loss of associates 83.18 123.99 -33
Net income from investments 57.28 16.80 241
EBITDA 952.601 834.58 14
1 Including a non-operating step-up profit in the amount of € 55.31 millionΔ% was calculated with original, not rounded figures therefore, rounding differences might occur.
GROUP INCOME STATEMENT 2018
20 FY 2018, April 2019

(€m) 2018 2017 Δ%
EBITDA 952.60 834.58 14
Margin (%) 6.3 6.2
Depreciation and amortisation -394.39 -386.22 -2
EBIT 558.211 448.36 25
Margin (%) 3.7 3.3
Net interest income -27.43 -27.15 -1
Income tax expense -168.00 -128.85 -30
Net income 362.78 292.36 24
Attributable to minority interest 9.25 13.45 -31
Attributable to equity holders of the parent company 353.53 278.91 27
Earnings per share (€) 3.45 2.72 27
1 Including a non-operating step-up profit in the amount of € 55.31 millionΔ% was calculated with original, not rounded figures therefore, rounding differences might occur.
GROUP INCOME STATEMENT 2018 (CONT.)
21 FY 2018, April 2019

STRABAG SEFY 2018 RESULTS
YOUR QUESTIONS, PLEASE
29 APRIL 2019
Recommended