A Global SuccessStory in GamingQ1 2021 Results & Outlook
May 2021
MISSION
Empower billions of peopleto play together
VISION
To transform mobile gaming into a massively social experience
OPPORTUNITY
To partner with the highest potential game creators and studios globally

This presentation (“Presentation”) has been prepared by Huuuge, Inc. (the “Company”). By reading the Presentation, you agree to be bound by the following limitations.
This Presentation is strictly confidential to the recipient. Neither this Presentation or any part hereof nor the information contained herein may be reproduced or redistributed, passed on, or the contents otherwise divulged, directly or indirectly, to any other person or published, in whole or in part.
If you gain access to this Presentation by mistake, or you are not an addressee of this Presentation or a person authorized to use this Presentation, please bear in mind the confidential nature of this Presentation and immediately contact the Company in order to return it to the Company.
The Presentation does not constitute an offer to sell or subscribe for or a solicitation of an offer to purchase or subscribe for securities. This Presentation is provided for informational purposes only. This Presentation does not constitute or form part of and should not be construed as an offer, solicitation or invitation to sell or issue, or an offer, solicitation or invitation to, subscribe for, underwrite, buy or otherwise acquire, securities of the Company or any of its subsidiaries in any jurisdiction, or an inducement/recommendation to enter into investment activity in any jurisdiction. Neither this Presentation nor any part hereof, nor the fact of its distribution or issuance, shall form the basis of, or be relied on in connection with, any contract, commitment or investment decision whatsoever.
The information contained herein is only preliminary and indicative and does not purport to contain the information that would be required to evaluate the Company, its financial position and/or any investment decision. This Presentation is not intended to provide, and should not be relied upon for, accounting, legal or tax advice nor does it constitute an investment recommendation. This Presentation is given in conjunction with an oral Presentation and should not be taken out of context.
No information included in this Presentation may be considered as investment advice or investment recommendation. The information contained in the Presentation has not been independently verified. No representation, warranty or undertaking, expressed or implied, is made as to, and no reliance should be placed on, the fairness, accuracy, completeness or correctness of the information or the opinions contained herein.
Matters discussed in this Presentation may constitute forward-looking statements. Forward-looking statements constitute statements that are other than statements of historical fact. Statements which include the words “expects”, “intends”, “plans”, “believes”, “projects”, “anticipates”, “will”, “targets”, “aims”, “may”, “would”, “could”, “continue” and similar statements of a future or forward-looking nature identify such forward-looking statements. Forward-looking statements include in particular statements regarding the financial performance, business strategy, plans and objectives of the Company for future operations (including growth potential). All forward-looking statements included in this Presentation address matters that involve known and unknown risks, uncertainties and other factors which could cause the Company’s actual results, performance or achievements to differ materially from those indicated in such forward-looking statements and from past results, performance or achievements of the Company. Such forward-looking statements are based upon various assumptions and estimates regarding future events, including numerous assumptions regarding the Company’s present and future business strategies and future operating environment. Although the Company believes that these estimates and assumptions are reasonable, they may prove to be incorrect.
The information, opinions and forward-looking statements contained in this Presentation speak only as at the date of this Presentation and are subject to change without notice. The Company, its directors, agents, employees and advisors do not intend to, and expressly disclaim any duty, undertaking or obligation to, make or disseminate any supplement, amendment, update or revision to any of the information, opinions or forward-looking statements contained in this Presentation to reflect any change in events, conditions or circumstances. To the extent permitted under the applicable provisions of law, neither the Company nor any of their affiliates, advisers or representatives shall have any liability whatsoever (in negligence or otherwise) for any loss however arising from any use of this Presentation or its contents or otherwise arising in connection with this Presentation.
This Presentation is not for distribution or use by any person or entity in any jurisdiction where such distribution or use would be contrary to local law or regulation or which would subject the Company or any of its affiliates to authorization, notification, licensing or other registration requirements under applicable laws. Any failure to comply with this restriction may constitute a violation of United States securities laws. Persons into whose possession this Presentation comes should observe all such restrictions.
Disclaimer
2

Tal ShohamCMO
Today’s presenters
3
Anton GauffinCEO
(Founder)
Grzegorz KaniaCFO
Elad KushnirCOO

Page
Q1 2021 highlights 5
Business update
Financial update
7
13
Agenda
02
03
01
4
Huuuge Fuel04 19

Traffic Puzzle acquisition proves our publishing arm is a source for low risk M&A’s
Another quarter of record high revenue and continued improvement in KPI’s, while also investing in growth
+26%YoY revenue growth
in Q1 2021
Q1 2021 Summary
5
+1.5ppCore franchises
monthly conversion
+26%ARPPU
core franchises
IPO geared us in additional cash for Build&Buy strategy and we now have USD 176m net cash as of Q1 2021

Page
2020 highlights 5
7Business update
9
Agenda
02
03
01
6
Financial update 1303
7
Huuuge Fuel04 19
● Record high revenue generated in March 21
Monthly conversionup vs 4Q20
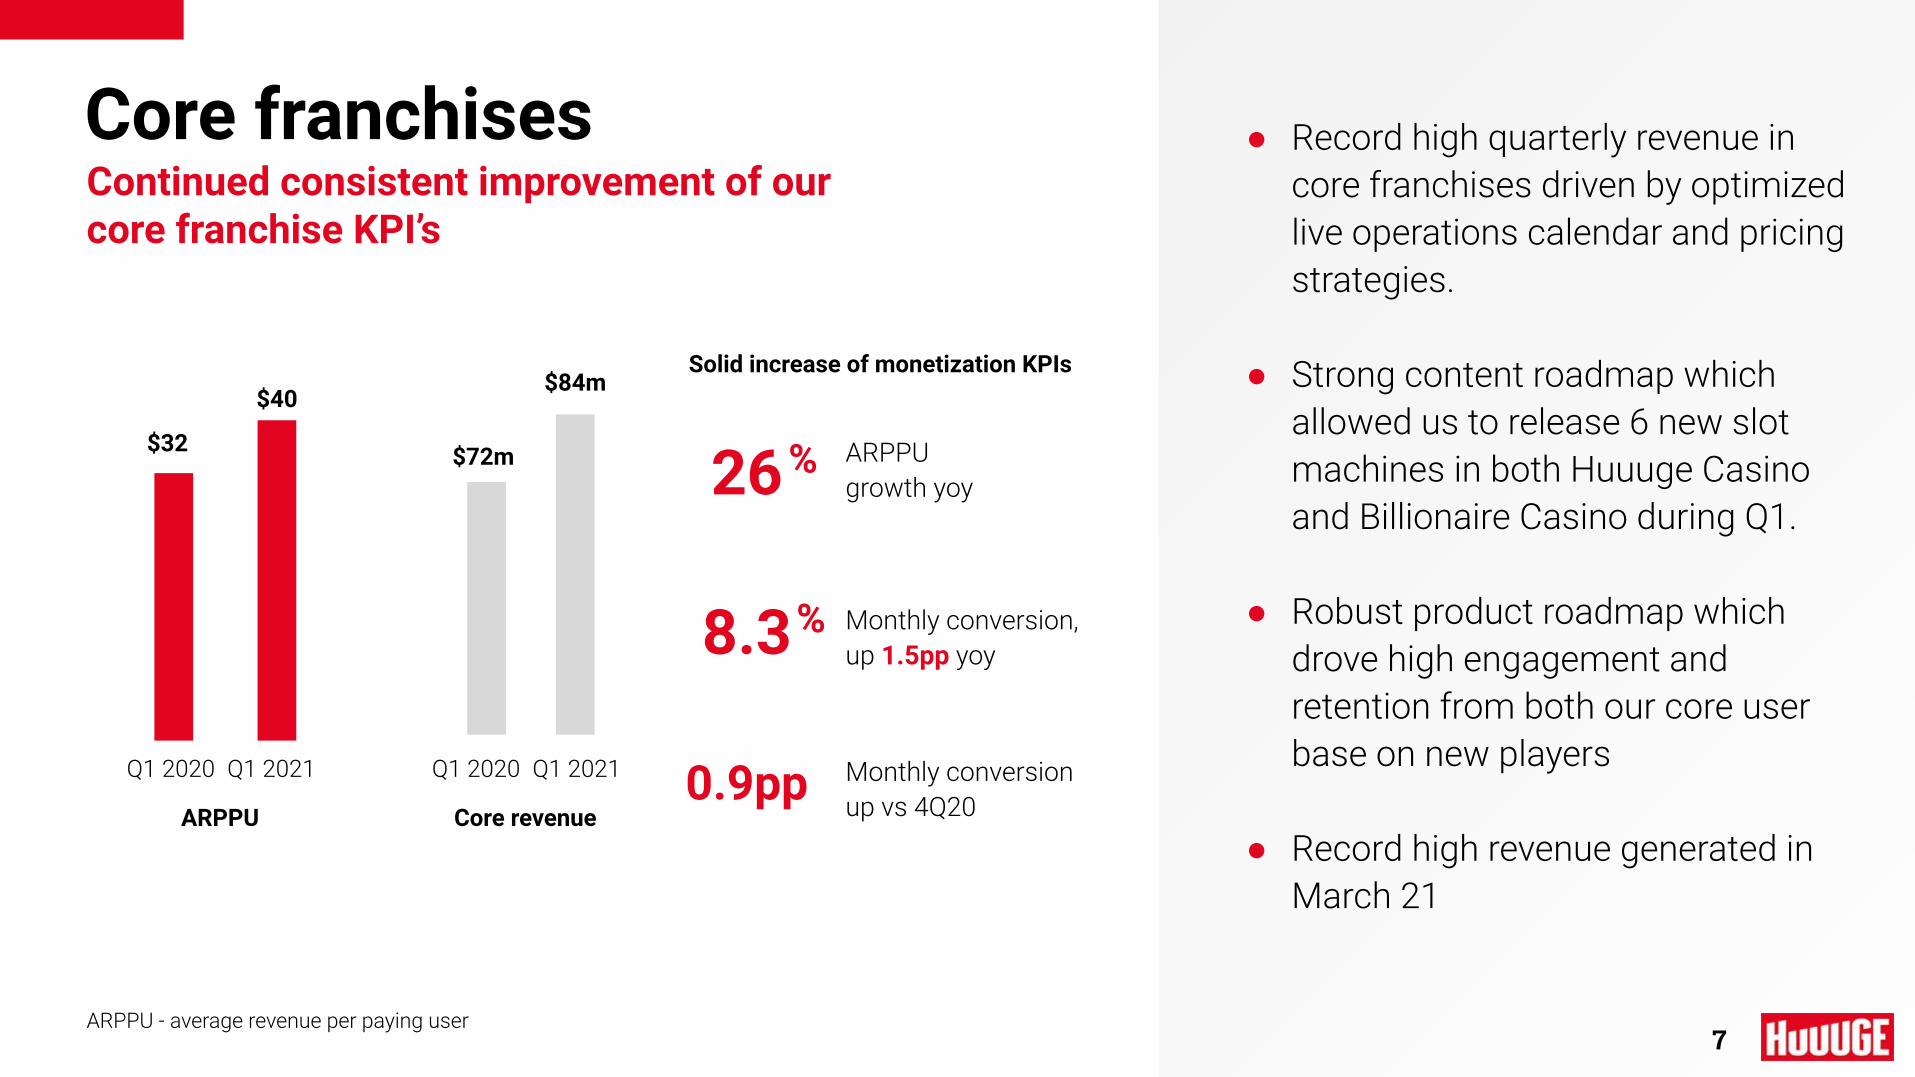
Core franchisesContinued consistent improvement of our core franchise KPI’s
7
Q1 2020 Q1 2021
ARPPU
$32
$40
ARPPU - average revenue per paying user
Solid increase of monetization KPIs
26 ARPPU growth yoy
%
Q1 2020 Q1 2021
Core revenue
8.3 Monthly conversion, up 1.5pp yoy
%
$84m
$72m
0.9pp
● Record high quarterly revenue in core franchises driven by optimized live operations calendar and pricing strategies.
● Strong content roadmap which allowed us to release 6 new slot machines in both Huuuge Casino and Billionaire Casino during Q1.
● Robust product roadmap which drove high engagement and retention from both our core user base on new players
● Record high revenue generated in March 21

The Evergreen Nature of Our Games
$184
8
Truly social - driving monetization to best in class KPI’s
44% 84% 74%
of MAU are part of a club
of playing usersinteract with other
players
of playing users are part of one or
more clubs
ARPDAU of a clubber vs a non clubber is approx.
6x higherARPPU of a clubber vs a non clubber is
approx.
40% higher
Quarterly revenue cohorted by the year of install ($m)
Huuuge Casino and Billionaire Casino
New franchises
9
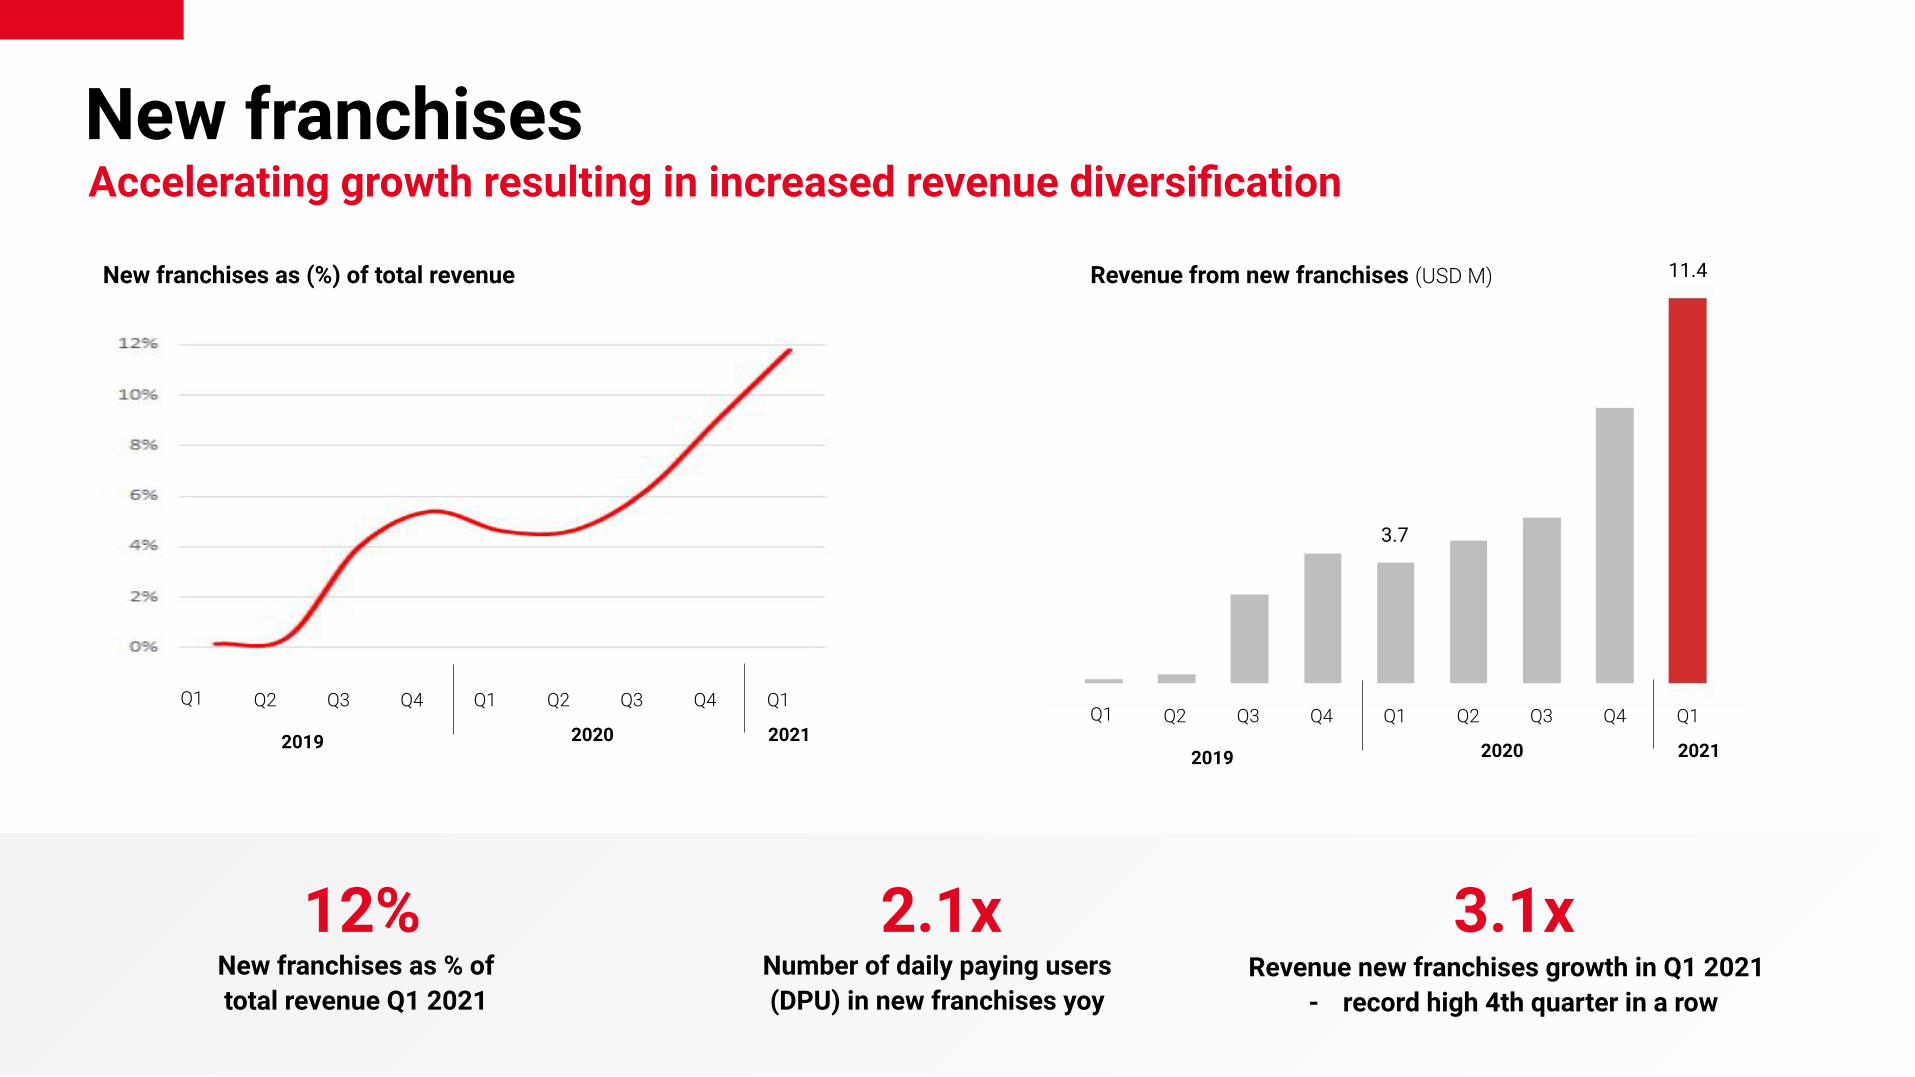
Accelerating growth resulting in increased revenue diversification
Q1 Q2 Q3 Q4 Q1 Q2 Q3 Q4
2019 2020
Q1
2021
2.1xNumber of daily paying users (DPU) in new franchises yoy
12%New franchises as % of total revenue Q1 2021
3.1xRevenue new franchises growth in Q1 2021
- record high 4th quarter in a row
Revenue from new franchises (USD M)
Q1 Q2 Q3 Q4 Q1 Q2 Q3 Q4
2019 2020
Q1
2021
11.4
3.7
New franchises as (%) of total revenue

Traffic Puzzle Acquisition A Unique, High-Growth Match-3 GamePuzzle game category is one of the largest, most established and lucrative segments of mobile gaming
worth $10.6 billions.
Since publishing the game in March 2019, the game has been the highest growth product in the Huuuge portfolio, with exceptional monetization KPIs.
After a year of discussions, management has
successfully acquired the Traffic Puzzle assets for $38.9 millions.
1 Q1 2021 vs. Q1 2020, Gross Revenue growth
~1MMAU
~$100kdaily revenue
~280%Y/Y Revenue1
~$0.64ARPDAU
Transaction Rationale
11
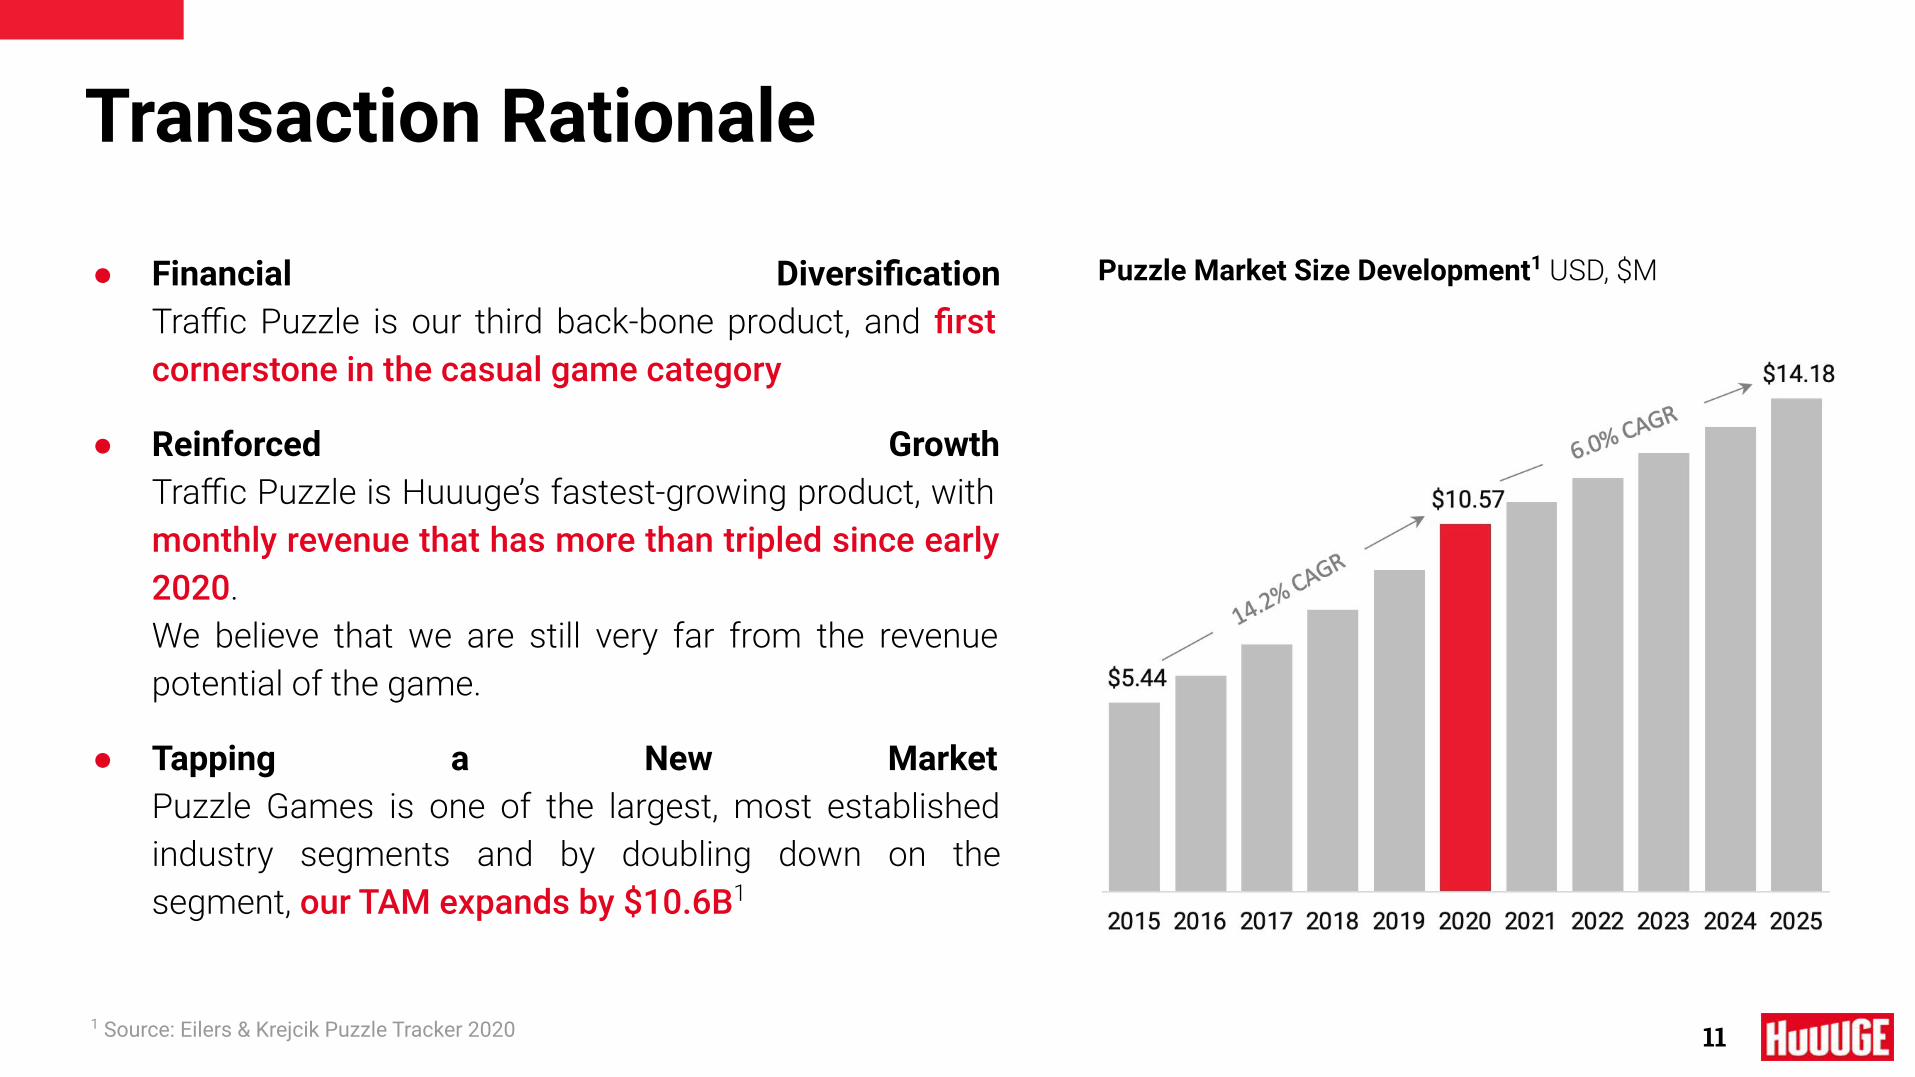
● Financial DiversificationTraffic Puzzle is our third back-bone product, and first cornerstone in the casual game category
● Reinforced GrowthTraffic Puzzle is Huuuge’s fastest-growing product, with monthly revenue that has more than tripled since early 2020. We believe that we are still very far from the revenue potential of the game.
● Tapping a New Market Puzzle Games is one of the largest, most established industry segments and by doubling down on the segment, our TAM expands by $10.6B1
1 Source: Eilers & Krejcik Puzzle Tracker 2020
Puzzle Market Size Development1 USD, $M

Page
2020 highlights 5
Business update 7
Financial update 13
Agenda
02
03
01
12
Huuuge Fuel04 19

Financial highlights
13
Adjusted EBITDARevenue
$76m
$96m
$18m
$10m
Q1’20 Q1’21 Q1’20 Q1’21
+$18MIncrease in user acquisition marketing campaign costs
-$8MDecrease in adj. EBITDA
in Q1 2021
+26%Revenue total
growth in Q1 2021
UAMC
$21m
$39m
Q1’20 Q1’21
41% of revenue
28% of revenue
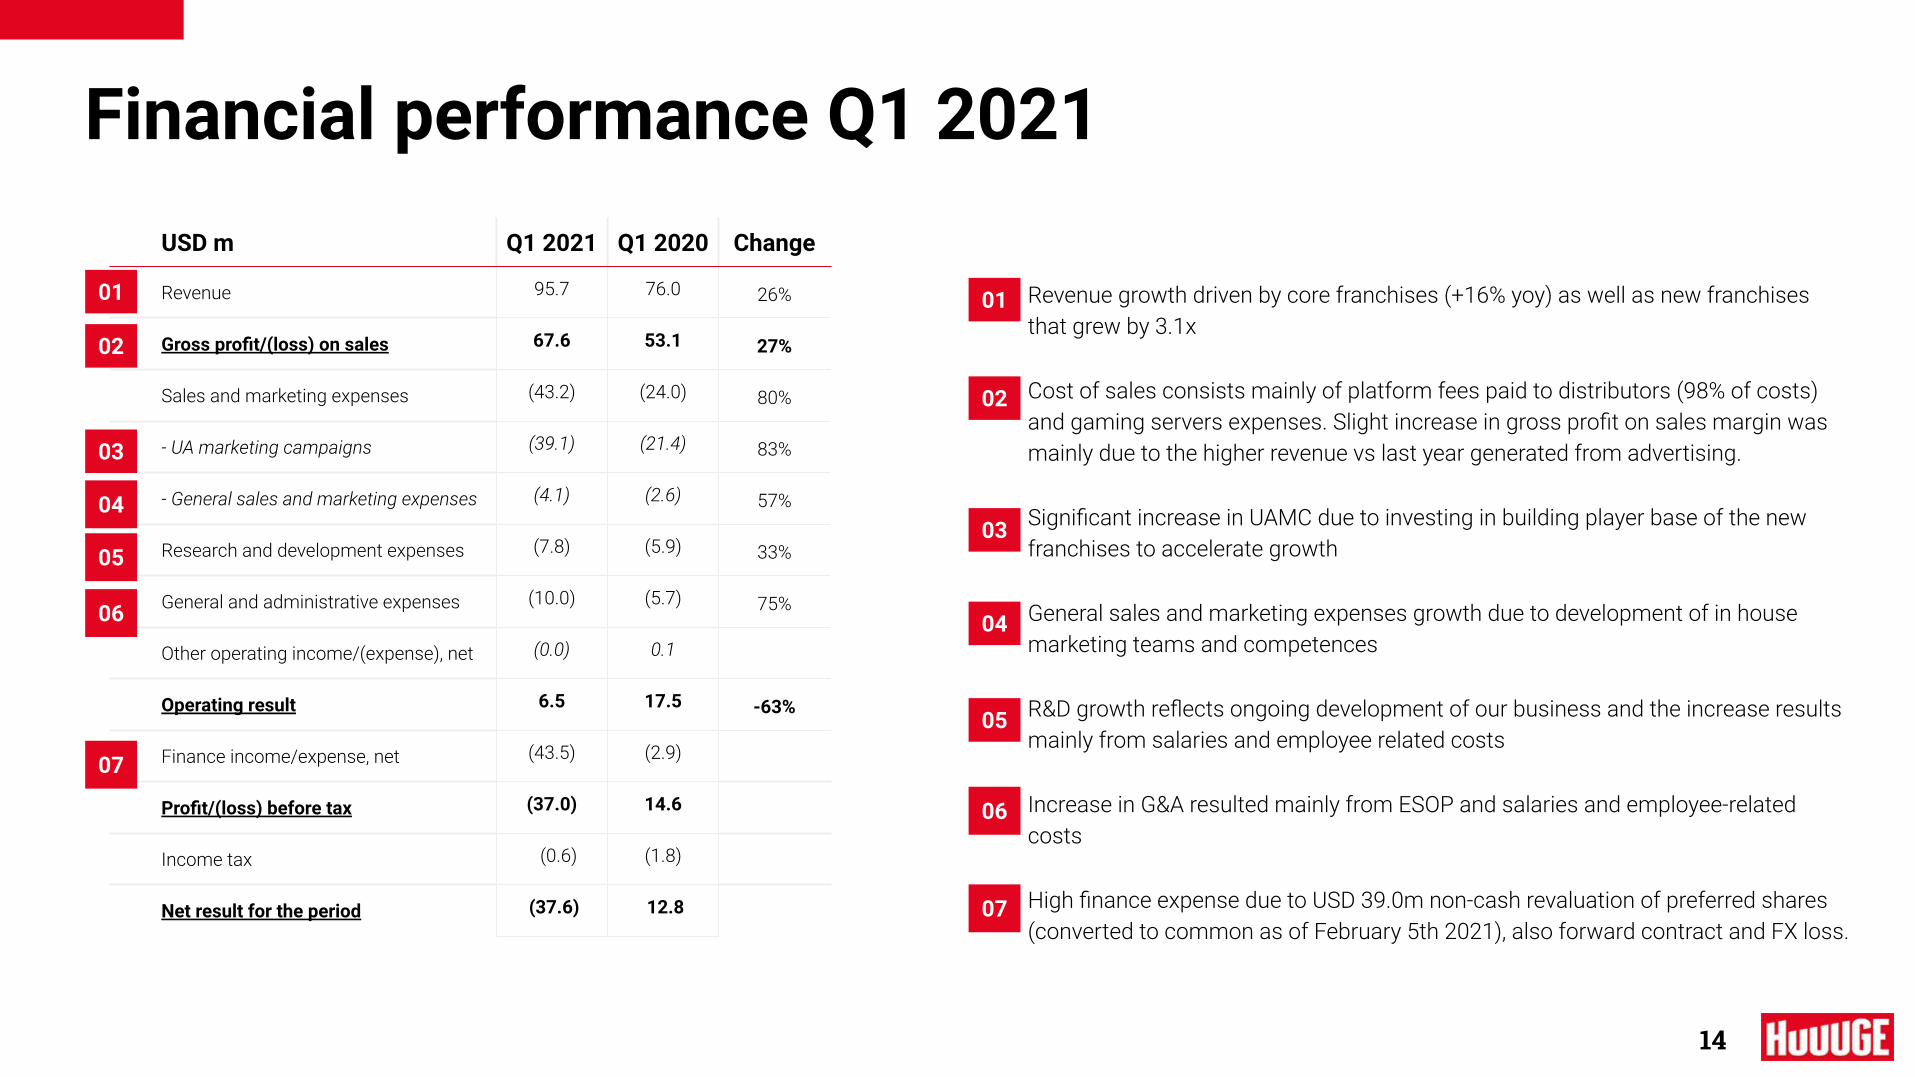
1. Revenue growth driven by core franchises (+16% yoy) as well as new franchises that grew by 3.1x
2. Cost of sales consists mainly of platform fees paid to distributors (98% of costs) and gaming servers expenses. Slight increase in gross profit on sales margin was mainly due to the higher revenue vs last year generated from advertising.
3. Significant increase in UAMC due to investing in building player base of the new franchises to accelerate growth
4. General sales and marketing expenses growth due to development of in house marketing teams and competences
5. R&D growth reflects ongoing development of our business and the increase results mainly from salaries and employee related costs
6. Increase in G&A resulted mainly from ESOP and salaries and employee-related costs
7. High finance expense due to USD 39.0m non-cash revaluation of preferred shares (converted to common as of February 5th 2021), also forward contract and FX loss.
USD m Q1 2021 Q1 2020 Change
Revenue 95.7 76.0 26%
Gross profit/(loss) on sales 67.6 53.1 27%
Sales and marketing expenses (43.2) (24.0) 80%
- UA marketing campaigns (39.1) (21.4) 83%
- General sales and marketing expenses (4.1) (2.6) 57%
Research and development expenses (7.8) (5.9) 33%
General and administrative expenses (10.0) (5.7) 75%
Other operating income/(expense), net (0.0) 0.1
Operating result 6.5 17.5 -63%
Finance income/expense, net (43.5) (2.9)
Profit/(loss) before tax (37.0) 14.6
Income tax (0.6) (1.8)
Net result for the period (37.6) 12.8
14
Financial performance Q1 2021
01
02
02
03
01
0304
04
05
05
06
06
07
07

USDm Q1 2021 Q1 2020 Change
EBITDA 7.6 18.1 -58%
ESOP 2.8 0.3
Adjusted EBITDA 10.4 18.4 -43%
Adjusted EBITDA margin (%) 10.9% 24.1%
Net result for the period (37.6) 12.8
ESOP 2.8 0.3
Preferred Series C shares revaluation
39.0 2.5
Adjusted Net Result 4.2 15.6 -73%
Adjusted Net Result (%) 4.4% 20.5%
15
Adjusted vs reported
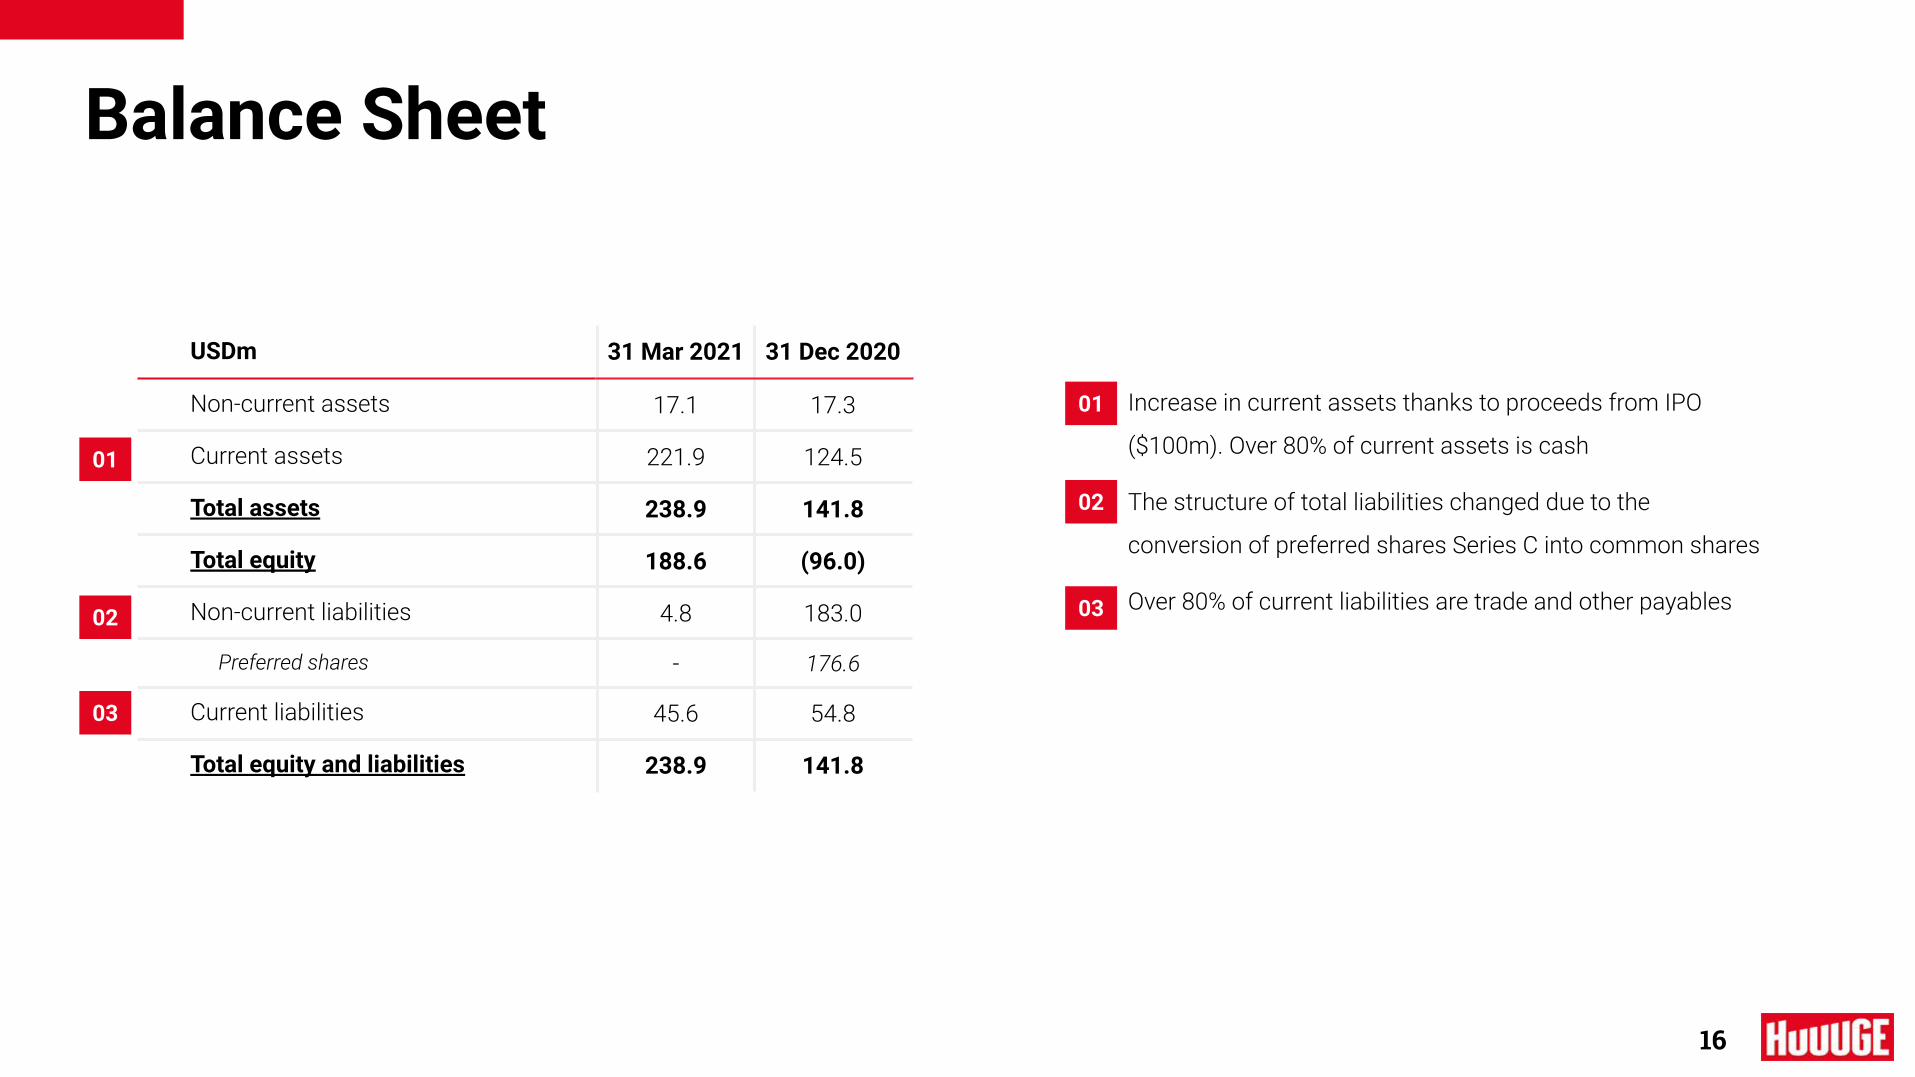
USDm 31 Mar 2021 31 Dec 2020
Non-current assets 17.1 17.3
Current assets 221.9 124.5
Total assets 238.9 141.8
Total equity 188.6 (96.0)
Non-current liabilities 4.8 183.0
Preferred shares - 176.6
Current liabilities 45.6 54.8
Total equity and liabilities 238.9 141.8
16
Balance Sheet
01
02
1. Increase in current assets thanks to proceeds from IPO
($100m). Over 80% of current assets is cash
2. The structure of total liabilities changed due to the
conversion of preferred shares Series C into common shares
3. Over 80% of current liabilities are trade and other payables
03
01
02
03

1. Changes due to lower EBITDA as well as change in
working capital: (1) increase in receivables resulting from
the cycle of payments from distributors, as well as ; (2)
the settlement of Washington court case
2. Changes are mainly attributable to: (i) proceeds from IPO
offset by (ii) costs of IPO and (iii) funds used for
execution of stabilization option.
USDm Q1 2021 Q1 2020
Pre-tax profit (37.0) 14.6
Operating CF (8.3) 16.3
Investing CF (0.6) (0.6)
Financing CF 98.6 9.2
Change in cash 89.8 24.9
Cash End of Period 183.2 51.2
17
01
02
01
02
Cash Flows Q1 2021

Page
2020 highlights 5
Business update 7
Agenda
02
01
18
Huuuge Fuel04 19
Financial update 1303

FuelRocket Fuel for Games

Drive user engagement by giving users more reasons to play, stay, and pay in our
games.
ANALYZE & ITERATE
Iterate and analyze player behavior at scale to empower data driven optimization
across the entire game lifecycle.
GROW
Drive growth through optimization of the entire acquisition funnel
Our best-in-class technology enables our game studios to easily embed our collective
knowledge and operational capabilities
into our games
ENGAGE & MONETIZE

ENGAGE & MONETIZE
CON
NEC
T &
COM
PLY
GAME A onPlatform X
GAME B onPlatform Y
GAME C on Platform Z
ANALYZE & ITERATE
GROW
Fuel

x
Fuel toENGAGE & MONETIZE
A Real Time Segmentation Engine running thousands of micro segments at any given point in timeA Zero-Code Dynamic Personalization Engine allowing real time adaptation of any game feature for every player A Game Economy Tool kit to simulate, configure, validate and visualize every aspect of the game economy. A Player and VIP management system enabling customer support teams with a 360 view of our players and an ability to attend to their needs in real time. A Behavioral Prediction Engine - providing early player classification and operational insights which enable user engagement. A Dynamic UI Builder from the artist’s drawing board directly to production
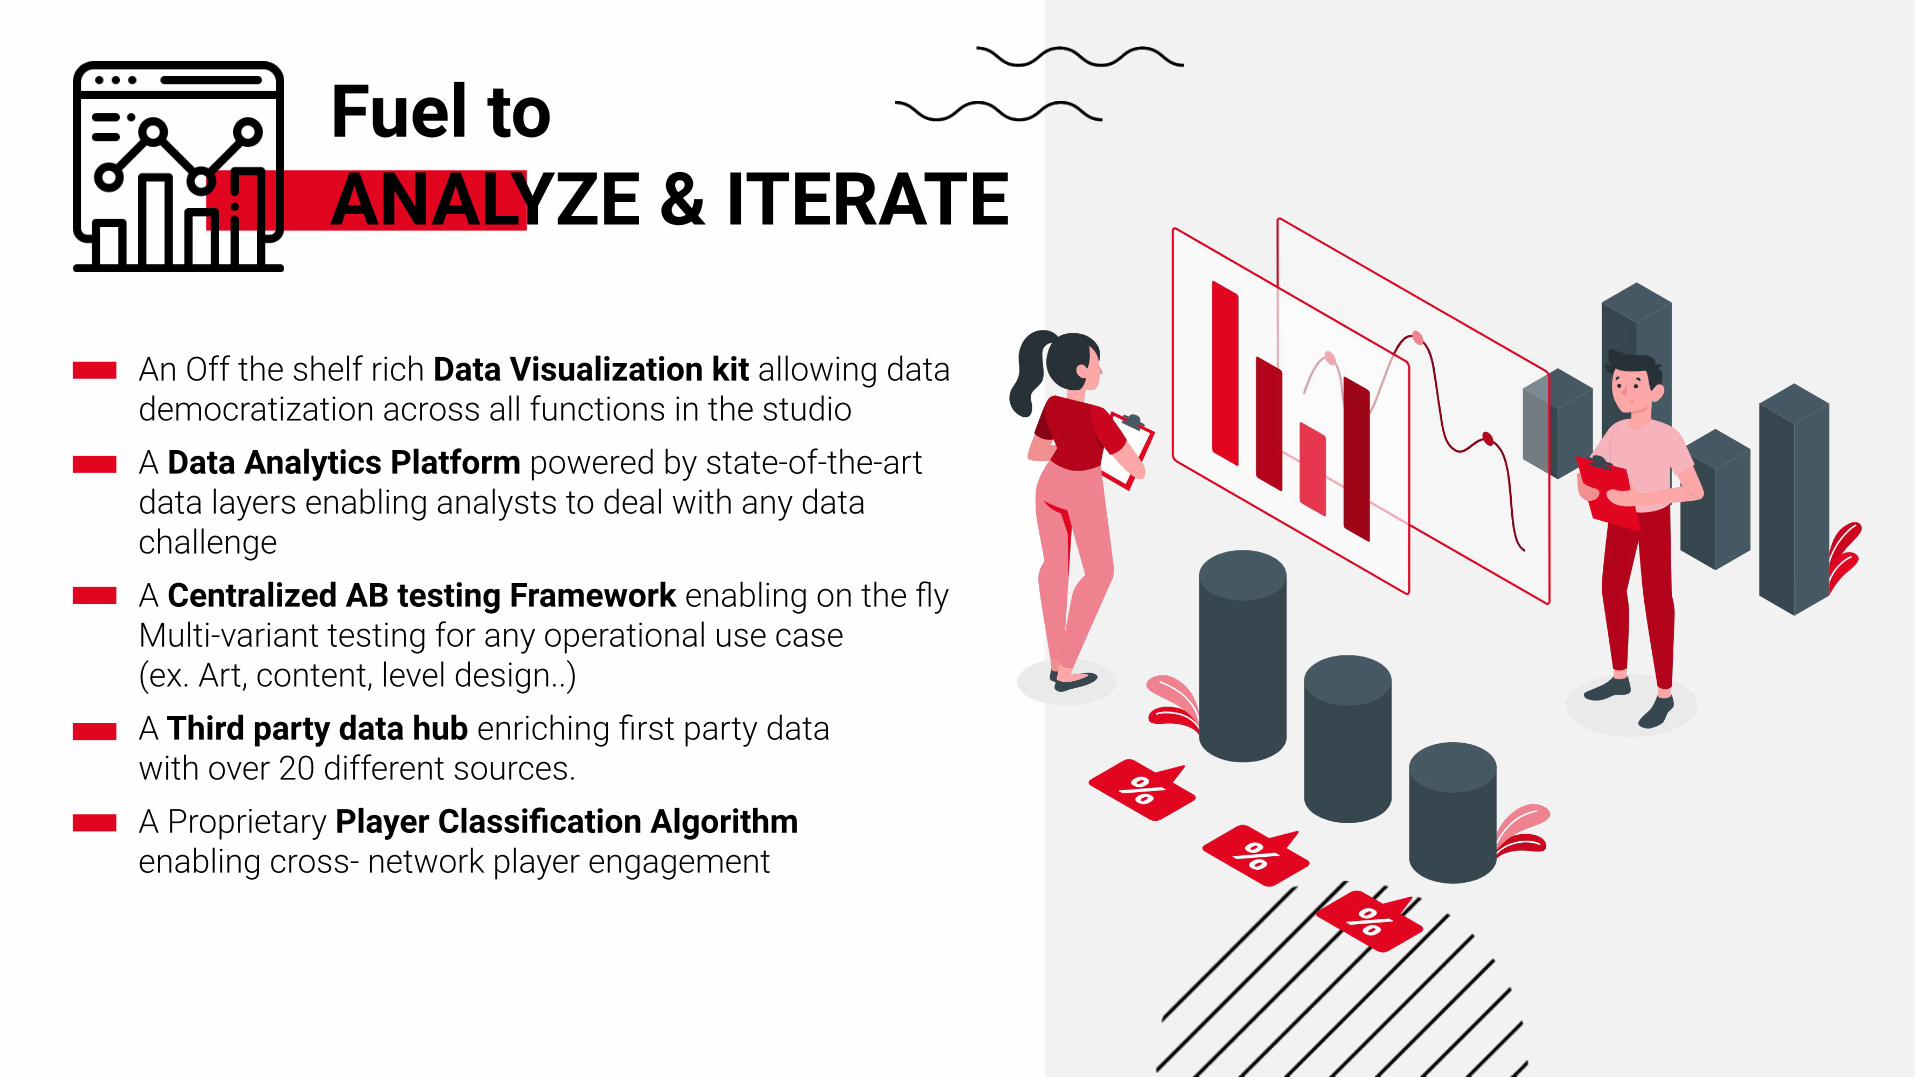
An Off the shelf rich Data Visualization kit allowing data democratization across all functions in the studioA Data Analytics Platform powered by state-of-the-art data layers enabling analysts to deal with any data challengeA Centralized AB testing Framework enabling on the flyMulti-variant testing for any operational use case (ex. Art, content, level design..)A Third party data hub enriching first party data with over 20 different sources.A Proprietary Player Classification Algorithmenabling cross- network player engagement
Fuel toANALYZE & ITERATE

Fuel toGROW
A User Acquisition Platform allowing the optimization of UA campaigns and multiple network algorithms, using adaptive network-specific AI predictive data models.
A Creative Hub which rapidly generates thousands of permutations for multiple ad creatives formats (playable, interactive, static etc) and automates their optimization across all marketing channels (AKA Playable Platform)
Retargeting Framework enabling the segmented retargeting of players across the web using personalized content, driving increased engagement of the most valuable players.
Ad Monetization & Cross promotion management enabling high quality engagement through the optimization of the ad experience alongside in app monetization

Connections Suite enabling plug and play integration into over 30 third party SDK’s as well as to ALL of Huuuge Fuel. (SDK Maintenance on us :)
Off the Shelf Compliance Package
Security compliance
Privacy compliance
Operating System compliance (iOS, GP, Amazon, Windows 10, Facebook, and more)
Inappropriate Content compliance
Fuel toCONNECT & COMPLY

ENGAGE & MONETIZE
BUILD (owned and operated
studios)
PUBLISHING PARTNERSHIPS
BUY (M&A)
ANALYZE & ITERATE
GROW
Huuuge Fuel Business Strategy
CON
NEC
T &
COM
PLY

So what does Huuuge Fuel meanfor our present and future?
It solidifies our technological advantage VS many of our competitors
It will allow us to scale our business across all three of our core business
units
It will drive growth

+ build
2021 Focus - Build & Buy strategy
Target profile:
+ Consistent revenue growth
+ EBITDA generative
+ Proven revenue stream(s)
+ Casual or Social Casino genre focus
28
87
31
3
87 opportunities | Longlisted
31 opportunities | Shortlisted
3 opportunities | Active pursuit
BUY PIPELINE of potential opportunities
M&AIPO proceeds deployed
by the end of 2022

Huuuge culture Humble & Hungry & Resilient
Talent centricFocus on hiring AAA+ talent
Huuuge is a global team of teams
Las VegasUnited States
LondonUnited Kingdom
AmsterdamNetherlands
SzczecinPoland
BydgoszczPoland
WarsawPoland
HelsinkiFinland
Hong KongHong Kong
LimassolCyprus
Tel AvivIsrael
29
Accelerate learning Grow know-how & capabilities
DublinIreland

31
Appendix
32
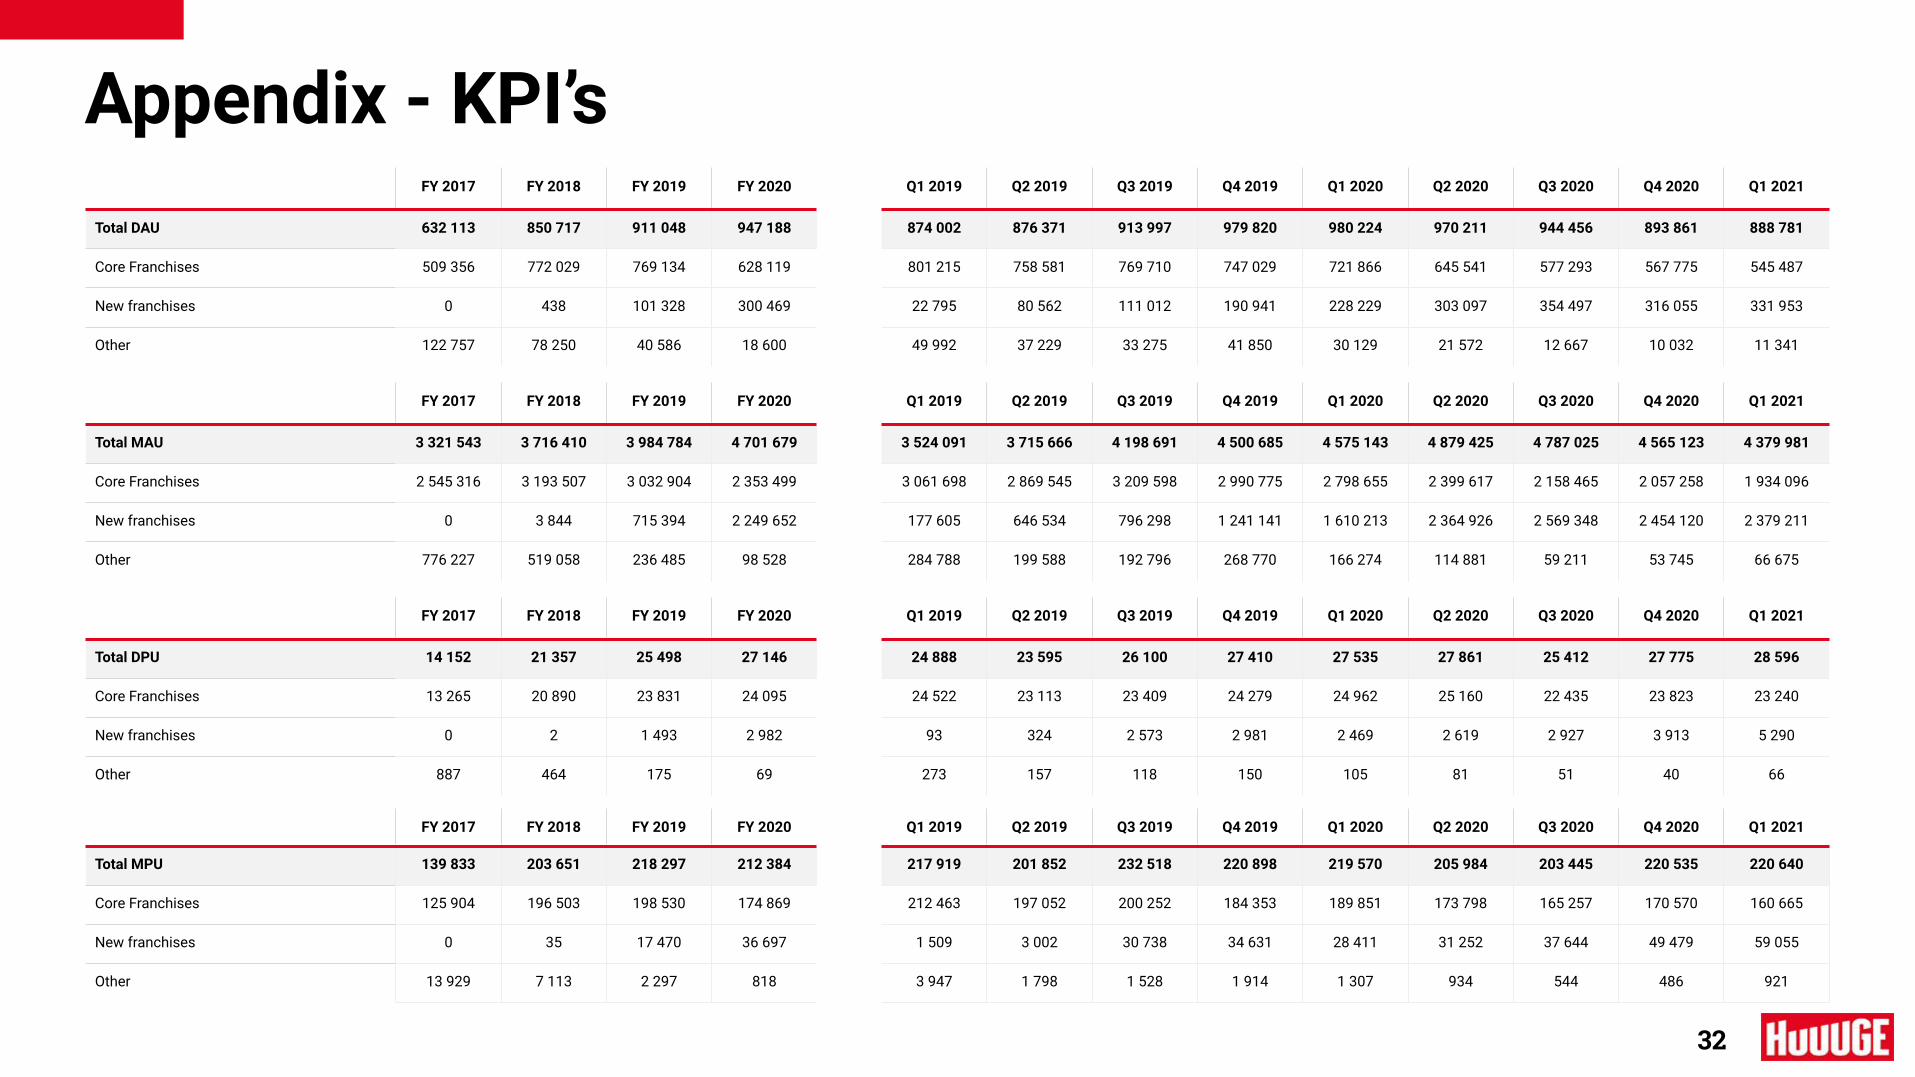
Appendix - KPI’sFY 2017 FY 2018 FY 2019 FY 2020 Q1 2019 Q2 2019 Q3 2019 Q4 2019 Q1 2020 Q2 2020 Q3 2020 Q4 2020 Q1 2021
Total DAU 632 113 850 717 911 048 947 188 874 002 876 371 913 997 979 820 980 224 970 211 944 456 893 861 888 781
Core Franchises 509 356 772 029 769 134 628 119 801 215 758 581 769 710 747 029 721 866 645 541 577 293 567 775 545 487
New franchises 0 438 101 328 300 469 22 795 80 562 111 012 190 941 228 229 303 097 354 497 316 055 331 953
Other 122 757 78 250 40 586 18 600 49 992 37 229 33 275 41 850 30 129 21 572 12 667 10 032 11 341
FY 2017 FY 2018 FY 2019 FY 2020 Q1 2019 Q2 2019 Q3 2019 Q4 2019 Q1 2020 Q2 2020 Q3 2020 Q4 2020 Q1 2021
Total MAU 3 321 543 3 716 410 3 984 784 4 701 679 3 524 091 3 715 666 4 198 691 4 500 685 4 575 143 4 879 425 4 787 025 4 565 123 4 379 981
Core Franchises 2 545 316 3 193 507 3 032 904 2 353 499 3 061 698 2 869 545 3 209 598 2 990 775 2 798 655 2 399 617 2 158 465 2 057 258 1 934 096
New franchises 0 3 844 715 394 2 249 652 177 605 646 534 796 298 1 241 141 1 610 213 2 364 926 2 569 348 2 454 120 2 379 211
Other 776 227 519 058 236 485 98 528 284 788 199 588 192 796 268 770 166 274 114 881 59 211 53 745 66 675
FY 2017 FY 2018 FY 2019 FY 2020 Q1 2019 Q2 2019 Q3 2019 Q4 2019 Q1 2020 Q2 2020 Q3 2020 Q4 2020 Q1 2021
Total DPU 14 152 21 357 25 498 27 146 24 888 23 595 26 100 27 410 27 535 27 861 25 412 27 775 28 596
Core Franchises 13 265 20 890 23 831 24 095 24 522 23 113 23 409 24 279 24 962 25 160 22 435 23 823 23 240
New franchises 0 2 1 493 2 982 93 324 2 573 2 981 2 469 2 619 2 927 3 913 5 290
Other 887 464 175 69 273 157 118 150 105 81 51 40 66
FY 2017 FY 2018 FY 2019 FY 2020 Q1 2019 Q2 2019 Q3 2019 Q4 2019 Q1 2020 Q2 2020 Q3 2020 Q4 2020 Q1 2021
Total MPU 139 833 203 651 218 297 212 384 217 919 201 852 232 518 220 898 219 570 205 984 203 445 220 535 220 640
Core Franchises 125 904 196 503 198 530 174 869 212 463 197 052 200 252 184 353 189 851 173 798 165 257 170 570 160 665
New franchises 0 35 17 470 36 697 1 509 3 002 30 738 34 631 28 411 31 252 37 644 49 479 59 055
Other 13 929 7 113 2 297 818 3 947 1 798 1 528 1 914 1 307 934 544 486 921

33
Appendix - KPI’sFY 2017 FY 2018 FY 2019 FY 2020 Q1 2019 Q2 2019 Q3 2019 Q4 2019 Q1 2020 Q2 2020 Q3 2020 Q4 2020 Q1 2021
Conversion (daily, DPU/DAU) 2,2% 2,5% 2,8% 2,9% 2,8% 2,7% 2,9% 2,8% 2,8% 2,9% 2,7% 3,1% 3,2%
Core Franchises 2,6% 2,7% 3,1% 3,8% 3,1% 3,0% 3,0% 3,3% 3,5% 3,9% 3,9% 4,2% 4,3%
New franchises n/a 0,5% 1,5% 1,0% 0,4% 0,4% 2,3% 1,6% 1,1% 0,9% 0,8% 1,2% 1,6%
Other 0,7% 0,6% 0,4% 0,4% 0,5% 0,4% 0,4% 0,4% 0,3% 0,4% 0,4% 0,4% 0,6%
FY 2017 FY 2018 FY 2019 FY 2020 Q1 2019 Q2 2019 Q3 2019 Q4 2019 Q1 2020 Q2 2020 Q3 2020 Q4 2020 Q1 2021
Conversion (monthly, MPU/MAU) 4,2% 5,5% 5,5% 4,5% 6,2% 5,4% 5,5% 4,9% 4,8% 4,2% 4,2% 4,8% 5,0%
Core Franchises 4,9% 6,2% 6,5% 7,4% 6,9% 6,9% 6,2% 6,2% 6,8% 7,2% 7,7% 8,3% 8,3%
New franchises n/a 0,9% 2,4% 1,6% 0,8% 0,5% 3,9% 2,8% 1,8% 1,3% 1,5% 2,0% 2,5%
Other 1,8% 1,4% 1,0% 0,8% 1,4% 0,9% 0,8% 0,7% 0,8% 0,8% 0,9% 0,9% 1,4%
(USD) FY 2017 FY 2018 FY 2019 FY 2020 Q1 2019 Q2 2019 Q3 2019 Q4 2019 Q1 2020 Q2 2020 Q3 2020 Q4 2020 Q1 2021
ARPDAU 0,66 0,76 0,78 0,96 0,80 0,78 0,77 0,78 0,86 1,01 0,90 1,08 1,20
Core Franchises 0,80 0,83 0,90 1,36 0,87 0,89 0,88 0,96 1,11 1,44 1,38 1,55 1,72
New franchises n/a 0,10 0,18 0,19 0,05 0,04 0,25 0,22 0,17 0,15 0,15 0,28 0,38
Other 0,07 0,09 0,07 0,08 0,08 0,05 0,07 0,05 0,06 0,09 0,10 0,09 0,08
(USD) FY 2017 FY 2018 FY 2019 FY 2020 Q1 2019 Q2 2019 Q3 2019 Q4 2019 Q1 2020 Q2 2020 Q3 2020 Q4 2020 Q1 2021
Daily ARPPU 28,7 29,9 27,8 32,8 28,0 28,7 26,9 27,7 30,1 34,7 32,6 33,7 35,7
Core Franchises 30,2 30,4 28,9 35,3 28,3 29,1 28,7 29,6 31,9 37,0 35,3 36,9 40,3

Investing in scaling
34
Core franchises ($m) New franchises ($m)Revenue UAMC
+16%Revenue core franchises
growth in 1Q’21
3.1xRevenue new franchises growth in 1Q’21
- record high 4th quarter in a row
Revenue UAMC
+26%Revenue total
growth in 1Q’21

Revenue and user acquisition
*preliminary and not audited data 35
Revenue and user acquisition marketing campaign costs ($m)
Revenue
UAMC
UAMC as % of revenue

Appendix - P&L, BS
36
in thousand USD Q1 2021 Q1 2020
Revenue 95,691 76,049
Cost of sales (28,071) (22,988)
Gross profit/(loss) on sales 67,620 53,061
Sales and marketing expenses (43,239) (24,030)
user acquisition marketing campaigns (39,098) (21,392)
general sales and marketing expenses (4,141) (2,638)
Research and development expenses (7,819) (5,901)
General and administrative expenses (10,034) (5,721)
Other operating income/(expense), net (25) 80
Operating result 6,503 17,489
Finance income 120 49
Finance expense (43,582) (2,982)
Profit/(loss) before tax (36,959) 14,556
Income tax (580) (1,754)
Net result for the period (37,539) 12,802
Exchange gains/(losses) (416) (749)
Total comprehensive income for the period (37,955) 12,053
in thousand USD Q1 2021 Structure 2020 Structure
ASSETS
Total non-current assets, including: 17,059 7.1% 17,347 12.2%
Right-of-use asset 6,697 2.8% 8,646 6.1%
Goodwill 2,715 1.1% 2,838 2.0%
Intangible assets 1,278 0.5% 1,459 1.0%
Total current assets, including: 221,879 92.9% 124,485 87.8%
Trade and other receivables 38,681 16.2% 29,226 20.6%
Cash and cash equivalents 183,198 76.7% 94,158 66.4%
Total assets 238,938 100.0% 141,832 100.0%
EQUITY
Total equity 188,588 78.9% (96,008) -67.7%
LIABILITIES
Total non-current liabilities, including: 4,766 2.0% 183,019 129.0%
Preferred stock - 0.0% 176,606 124.5%
Total current liabilities, including: 45,584 19.1% 54,821 38.7%
Trade and other payables 37,337 15.6% 37,797 26.6%
Total equity and liabilities 238,938 100.0% 141,832 100.0%

Appendix - Cash Flow Statementin thousand USD Q1 2021 Q1 2020
Cash flows from operating activities
Profit/(loss) before tax (36,959) 14,556
Adjustments for:
Sum of non-cash changes in depreciation,amortization, profits or losses on disposal 1,295 530
Non-cash employee benefits expense - share-based payments 2,752 296
Non-cash remeasurement of preference shares liability - finance expense 38,997 2,517
Finance (income)/cost - net 2,354 (1,035)
Changes in net working capital (16,071) (320)
Cash flows from operating activities (7,632) 16,544
Income tax paid (657) (248)
Net cash flows from operating activities (8,289) 16,296
Cash flows from investing activities, including:
Acquisition of property, plant and equipment and intangible assets (564) (620)
Net cash from investing activities (564) (553)
Cash flows from financing activities, including:
Proceeds from issue of common shares for public subscription 152,929 -
Execution of stabilization option (43,976) -
Profit on execution of stabilization option - -
Transaction costs in anticipation of an issuance of equity instruments (6,988) -
Proceeds from issue of shares - 9,681
Net cash from financing activities 98,620 9,174
Net increase/(decrease) in cash and cash equivalents 89,767 24,917

38
Appendix - GlossaryARPDAU Average revenue per daily active user.
ARPPU Average revenue per paying user.
DAU The number of individual users who played a game on a particular day.
DPU The number of players (active users) who made a purchase on a given day.
Live OpsActivities aimed at increasing the player engagement, among others, by adding new features to games, recurring and one-off virtual events in which players can participate, and active management of promotions within the game.
MAU The number of individual users who played a game during a particular month.
Monthly ConversionThe percentage of MAU that made at least one purchase in a month during the same period In-app purchases. Payments made by users after downloading a game, in connection with the purchase of additional game features. In-app purchases can be made through various non-cash payment instruments (e.g. payment card, transfer), various electronic channels (e.g. e-banking, mobile phone) or using payment service providers (e.g. PayPal).
MPU MPU is defined as the number of players (active users) who made a purchase at least once in a given month.
Retention The number of users who continued to use the game after a certain period of time after downloading the application.
UAMCUser acquisitionmarketing campaigns
Process of the acquisition of users through paid campaigns or promotional offers
Recommended