Stimulation of Catalytic Activity of Transitional
Metal Nitrides and Carbides
Brett John Cassidy
Submitted in fulfilment of the requirements for the Honours Degree of
Engineering
In the discipline of Chemical and Metallurgical Engineering
School of Engineering and Information Technology
Murdoch University
November 2017
© B J Cassidy 2017

i
Author’s Declaration
I declare that the work contained in this thesis, submitted for the degree of Honours in
Chemical & Metallurgical Engineering is my own account of my research except where
due reference is made. The main content work has not been previously submitted for a
degree at this or any other tertiary education institution.
Brett John Cassidy
Thesis Word Count
The total word count for this thesis project has included all major report chapters including
the abstract; with the acknowledgements, references, appendices and contents
components being omitted from the overall count. Breakdown of word count by chapter is
as follows:
• Abstract: 374
• Chapter 1: 2 304
• Chapter 2: 8 141
• Chapter 3: 2 239
• Chapter 4: 1 903
• Chapter 5: 1 564
• Chapter 6: 1 598
• Chapter 7: 1 621
• Total: 19744

ii
Abstract
Current estimations show hydrogen production to be in excess of 55 million tonnes
annually. With consumption growing globally by six percent annually, new feedstocks such
as ammonia need to be explored to meet demand. Ammonia has many attractive
characteristics as a source for hydrogen, such as its product stream when decomposed
producing no carbon oxides or sulfurs. Research currently is limited on the decomposition
of ammonia to produce hydrogen supported by transitional metal catalysts. This lack of
research has suppressed the development of this technology. This thesis project is
intended to develop on the original research conducted at the King Abdulaziz University
where the development of high surface area molybdenum nitride was researched as a
catalyst for the ammonia decomposition reaction to produce hydrogen.
The work completed in this thesis aims to capitalise on the findings in the original
experiment by accurately determining the mechanisms and kinetics associated with the
production of hydrogen. The modelling was separated into three distinct components
which investigated the ammonia decomposition on a cobalt-molybdenum catalyst. The first
component of the model was focused on optimising the surface which the mechanisms of
the decomposition reaction would be situated on. The optimisation calculations found the
(111) index to be the most stable of all the surfaces modelled. The data collected displayed
a directly proportional relationship between the increasing number of atoms in the
structure and its stability. The second component of the project modelled the ammonia
decomposition mechanisms on the surface of the optimum (111) indexed surface. Multiple
iterations were tested for different locations of the reacting molecule above the surface of
the catalyst. The results from the optimised models found the desorption mechanisms
were slightly more stable than the adsorption component of the decomposition reaction.
The concluding component of the model investigated the transient states associated with
the ammonia decomposition reaction. Six transient states where identified, however only
five could be modelled as a result of an atomic imbalance between the adsorption and
desorption phases. Multiple transient states were calculated, with the rate limiting step
determined to be the final desorption of the hydrogen molecule from the catalyst surface.
From the transient state models it was determined that the Co3Mo3N catalyst was
kinetically unsuitable for the ammonia decomposition reaction.
3
Acknowledgements
I would like to take this opportunity firstly to thank Dr Mohammednoor Altarawneh
who has been the primary supervisor for the duration of this project. The support provided
regarding training and technical issues have been vital to the success of this thesis project.
The guidance and advice provided by Dr Altarawneh has been crucial in the completion of
my penultimate year chemical and metallurgical engineering thesis. Associate Professor
Gamini Senanayake has provided a great deal of expertise in assisting in the selection of
this project and has assisted in multiple forms throughout the project, for which I am
appreciative. Special thanks are due to Ibukun Oluwoye who provided the necessary
modelling software programs required to complete this project. His assistance in the initial
stages of the project in troubleshooting technical issues associated with the modelling
software and catalyst files was vital to the timeline success of this project. Finally, to
Murdoch University, particularly the Chemical Engineering department, I am indebted to for
providing this opportunity to fulfil my honours requirements with this thesis project.

4
Contributors
Special mention has to be addressed to Mohammednoor for providing the command files
for the supercomputer component of this project. The files were applied in the processing of the
calculations which was of vital importance to the success of this project. Mohammednoor’s
contribution to this work was critical to the development of the optimised surfaces and the transient
state calculations.

5
Table Of Contents
Author’s Declaration ................................................................................................ i
Thesis Word Count ................................................................................................. i
Abstract ............................................................................................................................ ii
Acknowledgements .......................................................................................................... iii
Contributors ..................................................................................................................... iv
Table of Contents. ................................................................................................... v
List of Figures. ........................................................................................................ vii
List of Tables. .......................................................................................................... ix
List of Abbreviations .................................................................................................x
1 Introduction 1
1.1 Experimental Background ........................................................................ 2
1.2 Modelling Background .............................................................................. 4
1.3 Research Scope ....................................................................................... 5
1.4 Research Aims. ........................................................................................ 6
1.5 Research Objectives ................................................................................ 6
1.6 Structure of Thesis ................................................................................... 6
1.7 References ....................................................................................................... 7
2 Literature Review 9
2.1 Abstract ............................................................................................................. 9
2.2 Introduction ........................................................................................................ 9
2.3 Molecular Modelling of Hydrogen Production ............................................... 11
2.4 Hydrogen Production in Industry ...............................................................11
2.4.1 Future of the Hydrogen Industry ........................................................13
2.5 Ammonia Decomposition ...........................................................................17
2.6 Catalysis of Metal Nitrides & Carbides .......................................................... 29
2.6.1 Catalysis featuring Mo2N, Mo2C and W2C structures. .............................. 34
2.6.2 Catalysis featuring Co3Mo3N ............................................................. 36
2.7 Conclusions. ...................................................................................................... 39
2.9 References ................................................................................................... 41
3 Experimental Methodology 47
3.1 Software Methodology ...............................................................................47
3.1.1 Raijin Supercomputer ......................................................................47

6
3.1.2 Materials Studio v6.0.0 ....................................................................48
3.1.3 VESTA 3.4.0 ...........................................................................................48
3.2 Catalyst Surface Optimisation ...................................................................48
3.2.1 Catalyst Preparation ........................................................................48
3.2.2 Catalyst Surface Preparation ...........................................................49
3.2.3 Surface Optimisation ....................................................................... 51
3.2.4 Catalyst Surface Area Energy .........................................................52
3.3 Mechanism Optimisation ...........................................................................53
3.4 Transient State ..........................................................................................57
3.5 References. ....................................................................................................... 58
4 Surface Optimisation 59
4.1 Surface Optimisation Data .........................................................................59
4.1.1 Bond Length Data .......................................................................... 61
4.2 Interpretation of Results. ...........................................................................67
4.3 Summary ...................................................................................................69
4.4 References ........................................................................................................ 70
5 Mechanism Optimisation 71
5.1 Mechanism Optimisation Data ...................................................................72
5.2 Interpretation of Results ............................................................................83
5.3 Summary ...................................................................................................84
5.4 References ........................................................................................................ 84
6 Transient State 85
6.1 Transient State Data ..................................................................................86
6.2 Interpretation of Results ............................................................................91
6.3 Summary ...................................................................................................92
7 Conclusions & Further Work 94
7.1 Reaction Mechanism Sensitivity Investigations ............................................ 97
7.2 Expansion of Surface Models ....................................................................98
7.3 Development of Mo2N & W2C Catalyst Models ............................................. 98
7.4 References ........................................................................................................ 100
Appendix A — Original Experimental Results 101
Appendix B — Modelling Figures & Tables 103
Appendix C — Modelling Calculations 111
Appendix D — Report Definitions 114
Appendix E — Literature Review 115

List of Figures
2.1 U.S refinery demand for Hydrogen (2008-14) ..................................... 12
2.2 World consumption of Hydrogen by country in 2014 (%). .................. 13
2.3 Alternative methods of Hydrogen production from energy sources. . 15
2.4 Two dimensional model produced for the theoretical modelling of
Ammonia Decomposition..................................................................... 19
2.5 Conversion profiles of NH3 ............................................................... 20
2.6 Temperature profiles of reactors ........................................................ 20
2.7 Concentration profiles of H2 in different reactors .............................. 21
2.8 Effectiveness (reaction conversion) profiles of reactors ..................... 21
2.9 Turnover frequency of the catalyst as a function of temperature ....... 23
2.10 Comparison of the effect of KOH modification on the catalysts. ........ 28
2.11 .............................................................................................................. a Lattice structure of the Mo2C catalyst ................................................................ 30
2.11 .............................................................................................................. b Lattice structure of the Mo2N catalyst ................................................................ 30
2.12 a Formation energies compared to periodic position part A .................. 30
2.12 b Formation energies compared to periodic position part B.................. 31
2.13 Steady state activity approach for CO hydrogenation over Mo2N . . . 32
2.14 Thrust comparison between tungsten (1) and iridium (2) catalysts. . 35
3.1 Co3Mo3N Bulk model development from the initial CIF file [6],
to ball and stick bond display after bond contraction ........................... 49
3.2 Cleaved (1 0 0) surface in vacuum 1 & 2 ........................................... 50
3.3 Bond Length Measurement of Co3Mo3N Bulk Specimen Example . . 51
3.4 Ammonia Adsorption Mechanism Step models Pre-Optimisation . . . 54
3.5 Ammonia Desorption Mechanism Step models Pre-Optimisation . . 55
3.6 Ammonia Adsorption Mechanism Step models Post-Optimisation. . 55
3.7 Ammonia Desorption Mechanism Step models Post-Optimisation . . 56
4.1 000_ Optimised structure side and top profiles .................................. 63
4.2 100_1 Optimised structure side and top profiles ................................ 63
4.3 100_2 Optimised structure side and top profiles ................................ 64
4.4 110_1 Optimised structure side and top profiles ................................ 64
4.5 110_2 Optimised structure side and top profiles ................................ 65
vii

8
4.6 111_1a Optimised structure side and top profiles .............................. 65
4.7 111_1b Optimised structure side and top profiles .............................. 66
4.8 111_2 Optimised structure side and top profiles ................................ 66
4.9 The Relationship Of Optimised Catalyst Stability & Atomic Count
Due To Catalyst Thickness .................................................................. 68
4.10 Relationship Of Optimised Catalyst Stability & Cobalt Presence . . . 69
5.1 Original & Optimised Mechanism File (M1). ...................................... 73
5.2 Original & Optimised Mechanism File (M2a). .................................... 74
5.3 Original & Optimised Mechanism File (M2b.2) .................................. 74
5.4 Original & Optimised Mechanism File (M3a). .................................... 75
5.5 Original & Optimised Mechanism File (M3b.2) .................................. 75
5.6 Original & Optimised Mechanism File (M3c) ..................................... 76
5.7 Original & Optimised Mechanism File (M4a) ..................................... 76
5.8 Original & Optimised Mechanism File (M4b.2). ................................. 77
5.9 Original & Optimised Mechanism File (M4c) ..................................... 77
5.10 Original & Optimised Mechanism File (M5a1b) ................................. 78
5.11 Original & Optimised Mechanism File (M5b2) ................................... 79
5.12 Original & Optimised Mechanism File (M5b3) ................................... 79
5.13 Original & Optimised Mechanism File (M5c2a) ................................. 80
5.14 Original & Optimised Mechanism File (M5c3c) .................................. 80
5.15 Original & Optimised Mechanism File (M6a2a) ................................. 81
5.16 Original & Optimised Mechanism File (M6a3a) ................................. 81
5.17 Original & Optimised Mechanism File (M7a2a) ................................. 82
5.18 Original & Optimised Mechanism File (M7a3a) ................................. 82
6.1 Transient State One Model ................................................................ 88
6.2 Transient State Two Model ................................................................ 89
6.3 Transient State Three Model ............................................................. 89
6.4 Transient State Five Mode................................................................. 90
6.5 Transient State Six Mode .................................................................. 91
9
List of Tables
2.1 Annual global Hydrogen production sources. ..................................... 14
2.2 Conversion and formation rates for silica containing catalysts .......... 23
2.3 DFT binding energies & bond lengths of nitrogen on monolayer
bimetallic surfaces .............................................................................. 26
2.4 NH3 decomposition over supported 5wt.%-Ru catalysts data ............ 27
2.5 Free energy formation data of H2 and H2S ........................................ 31
2.6 Activities and selectivities of Mo2C(hcp), Mo2C(fcc), and Mo2N(fcc)
for CO hydrogenation ......................................................................... 32
2.7 Various catalyst data for ammonia synthesis ..................................... 37
2.8 Catalytic activities of different catalysts for NH3 decomposition ......... 38
2.9 Physical and chemical properties of Hydrogen fuel ........................... 115
3.1 Transient State Mechanism Steps ..................................................... 57
4.1 Surface Optimisation Energy & Calculation Results .......................... 60
4.2 Catalytic Energy Values By Element.................................................. 105
4.3 Physical Properties Of The Optimised Specimens ............................ 105
4.4 Summary of Bond Length Changes Resulting From Optimisation . . 61
4.5 Summary of Bond Change Calculations ............................................ 62
4.6 Bond Length Data ............................................................................. 106
5.1 Summary Of Absorption Mechanism Energy Data ............................ 72
5.2 Summary Of desorption Mechanism Energy Data ............................. 72
6.1 Transient State Mechanism Steps Average Energies ........................ 87
6.2 Filtered Transient State Mechanism Steps Average Energies ........... 87

10
List of Abbreviations
TOF Turn over frequency
TPD Temperature Programmed desorption
XRD X-ray Powder Diffraction
SEM Scanning Electron Microscope
CNT Carbon Nano Tube
BET Brunauer Emmett Teller
TEM Transmission electron microscopy
STEM Scanning Transmission electron microscopy
EDX Energy dispersive X-ray
CIF Crystallographic Information File

1
Chapter 1
Introduction
The innovation of technology has played a critical role in the development and
evolution of the energy sector we know today[1]. However, currently, the world still verges
on crisis point concerning adequacy in supply at a low cost while mitigating the adverse
environmental impacts. In the pursuit to combat climate change, cleaner methods in
production and consumption of energy sources are required. The significant challenges
prevalent require further innovation in areas such as research and development. The
global energy deficit resides majorly on the substantial variation in country industrialisation,
and as a result of this funding levels are skewed[1]. With the current situation of the energy
sector yields the demands for newer, more sustainable sources of energy.
Hydrogen possesses the desired properties and has an adequate sized supply to resolve
the current global energy demands. With hydrogen presenting itself as the future of
energy, the only issue impeding its widespread use is finding a cost-effective method of
producing it on a global scale. Hydrogen is currently produced for fuels and fertilisers on
an industrial scale and is a crucial component to oil refining processes[2]. Hydrogen has an
inability to exist in a free form; this is a result of its outer electron shell requiring another
atom to fill it[3]. This physical characteristic of hydrogen results in the need for external
intervention to remove the bound atoms to attain a combustible fuel source.
Conventional processing methods of hydrogen have been plagued with issues such as
expense, efficiency, heavily polluting or a combination. As a result of supply and
environmental concerns, fossil fuels can no longer be used in the production process of
hydrogen; which leads to questions arising concerning how hydrogen can be produced
efficiently enough to adequately quench the worlds energy needs[4]. Ammonia
decomposition presents many advantages over more conventional hydrogen-producing
techniques as the reaction does not produce COx[5]. The reaction for the ammonia
decomposition reaction is summarised as:
2NH3 → N2 + 3H2 ∆H= 11 kcal/mol. (1)

2
The primary disadvantage of the ammonia decomposition method is the reliance on
depleting catalyst supplies. The optimisation of catalyst performance through research is
critical to the development of the ammonia decomposition method for producing hydrogen.
The research conducted in the original experiment by S. Podila, S. Zaman, H. Driss, Y.
Alhamed, A. Al-Zahrani and L. Petrov, investigated the optimisation of low-cost traditional
metal nitrides for hydrogen production[6]. The research completed in this thesis aims to
expand on the experimental information, through accurately replicating the result using
modelling techniques.
Three distinct research components will take place in this project, the first being surface
optimisation of the Co3Mo3N catalyst. The optimisation will investigate different surface
cleavages of the catalyst, and use the modelling software packages; calculations were run
using the supercomputer to determine their stability. The second component of this project
investigates the mechanisms of the ammonia decomposition reaction by selecting the
optimum surface derived from the previous component of the project. The mechanisms
were optimised using the modelling software to be suitable for the transient state
calculations in the final component of the project. The penultimate component to the
project is the determination of the transient states of the mechanisms, where the results
will be compared to literature, and used to determine the rate limiting step of the ammonia
decomposition reaction from the activation energy data obtained.
1.1 Experimental Background
The research conducted in this thesis project seeks to expand on the information
attained in an experiment conducted at the King Abdulaziz University in Saudi Arabia by
[6]. The primary aim of the experiment was to develop a new method for the preparation of
high surface area molybdenum nitride. Four high surface area bulk molybdenum nitride
samples were prepared, with three samples containing 1, 3 and 5 by weight percent
cobalt. The cobalt-containing catalysts were designated as 1CoMoN, 3CoMoN and
5CoMoN, respectively.
Catalytic activity measurements were taken from the sample using a quartz fixed bed
reactor. The activity tests were conducted at atmospheric pressure with a 0.1 gram
sample. Prior to the ammonia decomposition reaction, the catalyst samples were activated
at 500˚C under pure nitrogen flow for one hour. Once the activation phase of the

3
preparation was complete, the samples were then reduced with hydrogen for five hours,
then flushed with nitrogen for an hour once again using the same conditions. Pure
ammonia gas was fed into the reactor at 300˚C, where the temperature was then
increased stepwise at 50˚C until steady state was achieved. The step changes occurred
from 300˚C to 600˚C where steady-state conditions were achieved each time before the
next step occurred. The determination of steady-state reaction conditions was achieved by
conducting a percentage difference gas analysis. When the relative percentage difference
remained less than 5 percent for two consecutive runs, the reaction was deemed at steady
state.
The results from the experiments above show by adding controlled amounts of cobalt (1,
3, and 5 weight percent) during the catalyst preparation, resulted in no significant alteration
to the surface area of the samples when compared to the untreated sample. Results from
the data also indicated that the addition of cobalt promotes the formation of both γ-Mo2N
and Co3Mo3N phases simultaneously in the product of the reaction. BET surface area and
XRD analysis on the samples showed an overall increase in the crystal sizes of the
reduced and spent catalysts. The bulk MoN structure showed no new formation of phases
in the catalyst structure, and the structure overall was maintained when comparing the
used and fresh samples. The MoN sample diffractogram results show mainly γ-Mo2N and
MoO2 formation. The MoO2 crystalline phase was observed to slightly increase in the bulk
sample. However, this increase was highly likely to be a result of the samples being
exposed to air at the conclusion of the experiment.
SEM images of the 1CoMoN, 3CoMoN and 5CoMoN samples confirm an overall increase
in the amount of γ-Mo2N phase when compared to the bulk sample. The bulk MoN sample
shows bigger MoO2 crystals formed as determined by XRD analysis from the experiment.
STEM-EDX results identified a uniform distribution of Co3Mo3N throughout the platelet; as
the concentration of cobalt increased from zero to one percent, increases were also seen
in the Co3Mo3N phase. When the concentration of cobalt increased from three to five
percent, the Co3Mo3N and Mo2N began to agglomerate. The activity at the higher
temperatures did not impact the ammonia decomposition efficiency, as MoN at 600˚C was
found to be 99% effective. However, the 1CoMoN sample at 450-500˚C saw a 10%
increase in reaction conversion. The catalytic activity and conversion of NH3 over the
catalyst samples can be observed in Figures 8.1 and 8.2 in Appendix A. The activation

4
energies of the bulk, 1CoMoN, 3CoMoN and 5CoMoN samples was found to be 131.2,
99.7, 92.8 and 102.6 kilojoules per mole respectively. A promotional effect by the smaller
dosages of cobalt was noticed in the samples. The TEM and SEM data shows the addition
of cobalt reduces Co3Mo3N and γ-Mo2N crystal formation and promotes the growth of γ-
Mo2N. These results are in agreement with the XRD results presented in Table 8.1 located
in Appendix A, suggesting that the particle sizes of Co3Mo3N and γ-Mo2N in the 5CoMoN
sample are larger.
As no change was observed in the bulk γ-Mo2N structure, this indicates a high level of
stability of the γ-Mo2N during the ammonia decomposition process. The increase in
conversion was associated with the formation of Co3Mo3N species in the cobalt-containing
samples. The 5CoMoN sample saw no changes in conversion when compared to the bulk
MoN sample which can be attributed to larger Co3Mo3N crystals and γ-Mo2N platelets. The
5CoMoN sample had a high activation energy as a result of the excess cobalt causing
elevated active site blockages on the surface of the catalyst. The positive effect of cobalt
has been associated with an increase in the Co3Mo3N and γ-Mo2N active site formation. It
was concluded that the introduction of cobalt increased the formation of both γ-Mo2N and
Co3Mo3N species. The results showed the sample with the addition of three weight percent
cobalt had the most uniform distribution of γ-Mo2N and Co3Mo3N structures in the product.
1.2 Modelling Background
Modelling and computer simulation has been utilised for scientific experimentation
as far back as 1942, where it was applied in the Manhattan project[7]. Modelling of
chemical reactions displays multiple advantages over physical experimentation processes.
Modelling is not bound to the same set of conditions as a physical experiment is, which
allows the model to include all the conditions without any simplification or scaling down[8]. A
model of the reaction allows for a more significant number of samples to be processed at a
lower cost as physical samples do not have to be prepared.
Concerning catalyst research, micro-kinetic models are an efficient and relatively
inexpensive way to investigate catalysts[9]. Micro-kinetic modelling is a set of elementary
reactions which depict an overall transformation. Screening of catalysts can be expensive
and time-consuming. Modelling shows significant advantages with the ability to screen
catalysts effectively for processes such as ammonia decomposition. Models can assist in

5
gaining significant information and insight, to help develop more suitable catalysts for
reaction processes[9]. Past micro-kinetic modelling of ammonia decomposition has been
targeted at optimisation of the NH3 conversion and how catalysis impacts this. The models
developed have provided credible information to efficiently determine different catalysts
suitability to a specific reaction. Such research has been conducted in [10] where a Pt/
Au(1 1 1) catalyst was modelled in comparison to pure platinum. Properties of catalysts
used in the decomposition process have been investigated such as the turn over
frequency and the interactions between the particles involved in the reactions[10].
Past modelling investigations have shown credibility in their results, which has opened
opportunities for projects such as this one. The model being created for this project has
the ability to confirm and elaborate on physical experimental data. The model used in this
project can be utilised to determine multiple attributes of a catalyst. Models of the
ammonia decomposition reaction are generally limited by simplicity, however, this model's
primary advantage in this instance is its ability to assess multiple variations of the same
catalyst, providing a significant level of detail to the project.
1.3 Research Scope
This thesis is intended to expand the research completed by S. Podila, S. Zaman,
H. Driss, Y. Alhamed, A. Al-Zahrani and L. Petrov. The project will be investigating catalysis
in the ammonia decomposition reaction for the purpose of hydrogen production. The
project initially focuses on carbide and nitride catalysis in the ammonia decomposition
reaction; however, the research is targeted towards the Co3Mo3N catalyst, as this catalyst
was used in the original experiment conducted.
The scope of the modelling component of this thesis project has been restricted to just the
Co3Mo3N catalysts over the (1 0 0), (1 1 0) and (1 1 1) index planes. The scope of the
literature review will cover the hydrogen production field on a large scale and then become
more targeted towards carbide and nitride catalysis in the ammonia decomposition
reaction. The review will cover all relevant information on the catalysts, and research into
their optimisation.

6
1.4 Research Aims
The primary aim of this project is to expand on the experimental results from [6] by
accurately modelling the experiment using the Dmol3 (Materials Studio) and VASP
software packages. The aim of the constructed model is to accurately determine the
mechanisms and kinetics associated with the production of hydrogen from the ammonia
decomposition reaction using the Co3Mo3N catalyst. The results from the model will be
used to determine the rate limiting step of the ammonia decomposition reaction.
1.5 Research Objectives
The primary objectives of this thesis project have been summarised into the
following:
• Assess the suitability of Co3Mo3N as a catalyst for the ammonia decomposition
reaction, comparing the efficiency of the catalyst against relevant benchmarks in
literature.
• Design an accurate and robust model which effectively provides credible results on the
catalysed production of hydrogen from ammonia decomposition.
• To establish the reaction mechanisms operating in the conversion of ammonia over 4-d
based catalysts.
• Improve the understanding of the key factors in which influence the ammonia
decomposition reaction regarding catalyst performance.
1.6 Structure of Thesis
The thesis is structured into the following chapters:
• Chapter 1: Introduction - This section provides an overview of the topic and
reasoning into the motives for the research.
• Chapter 2: Literature Review - Investigates areas of relevance to this thesis
project looking specifically at the catalysis of the ammonia decomposition reaction

7
The review summarises the most up to research data in catalytic performance in
hydrogen production.
• Chapter 3: Experimental - This section will contain technical details regarding the
reaction modelling and processes used for this project.
• Chapter 4: Surface Optimisation - Develops surfaces through cleavage to be
optimised. The energies of the surface specimens are then analysed and
interpreted, where the results are then built on in later chapters of the project.
• Chapter 5: Mechanism Optimisation - This chapter builds on the data collected
from the previous section and then provides details on the results used to optimise
the mechanisms in the ammonia decomposition reaction.
• Chapter 6: Transient State - This chapter seeks to develop transient states by
using the data from the previous Mechanism and surface optimisation sections.
The models using the mechanisms are developed and interpreted in this section.
• Chapter 7: Conclusions & Future Work - Summarises the work modelling work
which has been completed and draws conclusions from the previous chapters. The
chapter then identifies areas from this project which can be further investigated and
discusses areas of improvement on the research.
• Chapter 8: Appendices - Contains the majority of the figures and data tables from
the modelling process, calculations related to the model and results from the
original experiment.
1.7 References
1. A. Sagar and J. Holdren, "Assessing the global energy innovation system: some
key issues", Energy Policy, vol. 30, no. 6, pp. 465-469, 2002.
2. J. Lazonby, "Hydrogen", Essentialchemicalindustry.org, 2017. [Online]. Available:
http://www.essentialchemicalindustry.org/chemicals/hydrogen.html. [Accessed: 06-
Nov- 2017].
3 . Y. Bai, T. Sosnick, L. Mayne and S. Englander, "Protein folding intermediates:
native state hydrogen exchange", Science, vol. 269, no. 5221, pp. 192-197,
1995.
4. M. Momirlan and T. Veziroglu, "The properties of hydrogen as fuel tomorrow in
sustainable energy system for a cleaner planet", International Journal of Hydrogen
Energy, vol. 30, no. 7, pp. 795-802, 2005.
8
5. T. Choudhary, C. Sivadinarayana and D. Goodman, “Catalytic ammonia
decomposition: COx-free hydrogen production for fuel cell applications” Catalysis
Letters, vol. 72, no. 34, pp. 197-201, 2001.
6. S. Podila, S. Zaman, H. Driss, Y. Alhamed, A. Al-Zahrani and L. Petrov, "Hydrogen
production by ammonia decomposition using high surface area Mo2N and
Co3Mo3N catalysts", Catal. Sci. Technol., vol. 6, no. 5, pp. 1496-1506, 2016.
7. H. Goldwhite, "The Manhattan Project", Journal of Fluorine Chemistry, vol. 33, no. 1-4,
pp. 109-132, 1986.
8. L. Frostick, S. McLelland and T. Mercer, Users guide to physical modelling and
experimentation. Boca Raton: CRC Press/Balkema Book, 2011.
9. D. Hansgen, J. Chen and D. Vlachos, Modeling the Ammonia Decomposition Reaction
for Hydrogen Production. Newark: Center for Catalytic Science and Technology
(CCST), 2008.
10. K. Rasim, M. Bobeth, W. Pompe and N. Seriani, "A microkinetic model of ammonia
decomposition on a Pt overlayer on Au(111)", Journal of Molecular Catalysis A:
Chemical, vol. 325, no. 1-2, pp. 15-24, 2010.

9
Chapter 2
Literature Review
2.1 Abstract
Hydrogen poses significant potential in becoming a necessary tool in solving the
world's clean energy issues. The industry has displayed steady growth over previous years
and shows positive signs of continuing the trend into the future on the back of new
technologies and research surrounding the industry. The current processes are limiting to
the industry with pollutants being the major drawback for hydrogen being used more
extensively in everyday energy applications. The ammonia decomposition method is
relatively new to literature for hydrogen production. Ammonia decomposition methods offer
significant advantages over more conventional hydrogen synthesis methods with many
papers discussing catalysis as the main area of optimisation. Catalysis for ammonia
decomposition is still extensively researched with experimental catalyst surfaces such as
carbon nanotubes providing positive results in early stages of development. Scientific
literature shows substantial evidence that in ammonia decomposition, carbide and nitride
catalyst applications have real potential to replace the more expensive and commonly
used platinum metal group catalysts. Current research shows the effectiveness of carbide
and nitride catalysts in similar processes such as ammonia synthesis. Of the nitride and
carbides; Mo2N, Mo2C, W2C and Co3Mo3N show the most significant promise. However,
ternary nitrides such as Co3Mo3N perform at a higher level and present as a suitable
substitute for platinum metal groups.
2.2 Introduction
In the pursuit to combat climate change by finding cleaner and greener methods to
use and produce fuels for energy, hydrogen has presented itself as the future of energy.
Industrial production of hydrogen is a crucial component of many other industries such as
fertilisers and the aerospace industry. Accounting for approximately 75 percent of the mass
of the universe hydrogen is an essential part of our world as we know it. In recent years
10
the hydrogen industry has shown significant sign of expansion and grow due to the recent
push in finding cleaner sources of fuels and reducing our reliance on hydrocarbons. Due to
hydrogen's attractive combustive attributes, significant research has been undertaken to
produce it on an industrial scale better. Hydrogen processing can exist in a variety of
methods whom of which have been notoriously expensive, inefficient or heavily polluting.
With a heavy reliance on fossil fuels for production, the industry has had to look for new
methods and technologies to maintain the longevity of the industry. The majority of
production methods will not be review extensively as the scope of this review will only
focus on the ammonia decomposition methods.
Ammonia is an essential storage medium of hydrogen as it has a significantly high weight
percent of hydrogen and when decomposed only H2 and N2 gases are produced. Scientific
literature highlights the significant need for more research into decomposition methods of
ammonia for hydrogen production in pilot plant or full-scale reactor scenarios as currently
the industry is lacking credible information in this area. A vital component of the
decomposition process is the catalysis involved which currently is significantly decreasing
the growth and applications of the process. Carbides and Nitrides such as Mo2N, Mo2C
and W2C have been used extensively in many other industries to significant effect, with the
universal application catalysis in the ammonia decomposition reaction is through platinum
metals which come with a high cost making economic viability challenging to justify.
Transition metal catalysts present with a lower cost and a higher effectiveness as a result
of new research in tailor-made catalysts for the process being extensively conducted.
There are a large number of studies still being currently conducted into catalysis
optimisation using platinum group metals which will not be included in this review as metal
nitrides and carbides are the main components.
The most substantial findings from research and literary works into catalysis for ammonia
decomposition is produced from ternary metal nitride applications. Co3Mo3N has provided
increasingly positive results in investigations with the addition of cobalt providing
significant advantages over the standard two-component metal nitride and carbide
catalyst. Limitations have been found with the addition of cobalt to the catalyst compound
with an elevated sensitivity to change; however, the majority of results show the
performance of the catalyst to be far superior others.

11
2.3 Molecular Modelling of Hydrogen Production
Molecular modelling’s purpose is to model or replicate the behaviour of molecules
through theoretical and computational methods. The purpose of modelling is to study
molecular systems without having to physically interact with them. These molecular
systems can range from large biological assemblies through to small chemical systems.
Modelling and simulation tools have great value as they reduce the overall number of
physical test cases, significantly reducing the cost associated with test work[1]. The
bridging of the gap between theoretical and experimental approaches is critically important
in investigation and experimentation settings[2].
At present, theoretical studies involving ammonia, a feedstock for the production of
hydrogen, are limited[3]. Studies involving ammonia decomposition modelling have only
been focused on the removal of the toxic ammonia traces which are deemed as a
pollutant[4]. It has also been noted in literature that major gaps exist in terms of ammonia
decomposition modelling/theoretical studies involving reactors, specifically multi-stage
membrane reactors[5]. Currently, efforts are being made to develop and improve the
performance of catalysts used in ammonia reaction processes such as decomposition and
synthesis[6]. The catalyst materials being targeted for these investigations using models
have been iron, nickel and ruthenium[7][8]. Studies into catalyst optimisation however is
limited, with areas of expansion in terms of numerical simulation showing promising
results[3].
2.4 Hydrogen Production in Industry
The simplest and most abundant element on earth, hydrogen is always found as a
part of another substance for example water. To date, the largest source of which
hydrogen is produced from is fossil fuels via steam reforming which is explained later in
this literature review. Estimations show that hydrogen production exceeds 55 million
tonnes per annum with its overall consumption increasing by approximately 6 percent
annually, as illustrated in [9, Fig 2.1] a linear increase in demand and supply for hydrogen
both in domestic and international markets driven by the petroleum industry[9]. The figure
also displays incremental increases specifically in hydrogen being supplied by industry;
where hydrogen being produced internally by refineries themselves is holding steady.

12
Figure 2.1: U.S refinery demand for Hydrogen (2008-14)
Hydrogen, being used primarily as a reactant has fundamental importance industrially
today, it is used to manufacture Methanol one of the most important compounds
industrially. Its popularity is a direct result of its reactivity, which is why it has applications
as an O2 scavenger or in hydrogenation processes where the hydrogen atom can be used
to lower the molecular weight of compounds and remove unwanted atoms such as
nitrogen or sulfur[10]. This removal of undesired atoms is completed by inserting hydrogen
to cleave the atoms away from the molecule. Its physical properties, however, are also
favoured too in applications such as coolants in electrical generators and in combustion
reactions where it is used as a fuel[10]. As a fuel, hydrogen is primarily utilised in the
Aerospace industry as a hydrogen/oxygen mixture releases the highest energy to weight
ratio as a propellant[11].
The majority of hydrogen is used as a reactant in the chemical and petroleum industries
where chemical production processes such as ammonia synthesis and hydrocarbon
processing account annually for approximately 57 and 37 percent respectively; the
consumption of hydrogen are displayed in [13, Fig 2.2][12]. Due to tightening of
environmental regulations the petroleum industry is anticipated to increase exponentially,
thus increasing the demand for hydrogen. The primary source of the regulation tightening
comes as a direct result of unit emissions and product specification as demand for lighter
more concentrated hydrogen fuels is rapidly increasing.
5
3.75
2.5
1.25
0 2008 2009 2010 2011
Year
2012 2013 2014
Supplied By Industrial Plants Production by Refineries By Refineries
Hydro
gen D
em
and (
BC
F/day)

13
Processing can be conducted in a hydrotreating unit, where typically preheated
hydrocarbon and hydrogen feeds are reacted in the presence of a metal oxide catalyst,
such as CoMo which is then converted to a metal sulfide[14].
Figure 2.2: World consumption of Hydrogen by country in 2014 (%)[12]
2.4.1 Future of the hydrogen industry
Progressing into the future, as the world continues to transition towards a fossil fuel free
future, demand for hydrogen technologies will increase as renewable resources are
virtually inexhaustible[15]. In its first widespread application, hydrogen is likely to
supplement hydrocarbons in the transport industry as combustion fuels. This application is
a result of hydrogen burning three times more efficiently than gasoline and produces fewer
pollutants. The fossil fuel systems the new technology would be replacing emit pollutants
such as CO, CO2, SOx and NOx which are more damaging than those produced by
renewable hydrogen systems in automobiles[16]. Alternate industries where hydrogen could
potentially find application is in the housing market providing energy for heating and
cooling. The target for the Department of Energy in America is to substitute ten quads of
energy annually by 2030, with one quad equalling the power consumption of one million
households[17]. In industry air pollution is a severe environmental and health issue
SouthWest Asia Eastern Europe Western Europe South/Central America Southeast Asia Afica Northeast Asia Central Europe Canada Japan Oceania Mexico

14
Source Billion Cubic Metres / year Share (%)
Natural Gas 240 48
Oil 150 30
Coal 90 18
Electrolysis 20 4
Totals 500 100
throughout first world countries, but is especially acute in developing countries. For
consideration of Hydrogen to be used as a viable replacement for fossil fuels it has to not
only match the physical performance of fuels, it has to be financially feasible. Currently,
financial feasibility is the most significant barrier for substitute fuels progressing in
development and entering the marketplace[18].
Concerning performance, hydrogen releases approximately 2.75 times more energy than
hydrocarbon fuels but is far less economical[19]. The increased expense is a direct result of
hydrogen being a secondary energy source. Similarly to electricity, hydrogen it has to be
manufactured and hence comes at an increased cost[20]. With the current technologies we
have today for the production of Hydrogen, widespread use is approximately 15 years
away before people will be able to economically justify it as a viable substitution fuel for
hydrocarbon sources.
Globally the hydrogen market is worth over 40 billion US dollars with approximately 96
percent of all production coming from fossil fuel base reactants and undergoing
conversion[21]. Referring to [20, Table 2.1], there is a significant dependence on fossil fuels
and it is evident that renewable methods of production are lagging behind; accounting for
only 4 percent of the market share. The main alternative methods of hydrogen production
are listed below in figure [22, Fig 2.3] where it displays different combinations of primary
energies which are compatible with production technologies[20].
Three hydrogen synthesis processes dominate the industry globally. Currently the most
widespread method for low-cost mass hydrogen production is steam reforming with its
principal advantage over other methods being its high efficiency with low operational and
production costs[23].
Table 2.1: Annual global hydrogen production sources[20].
15
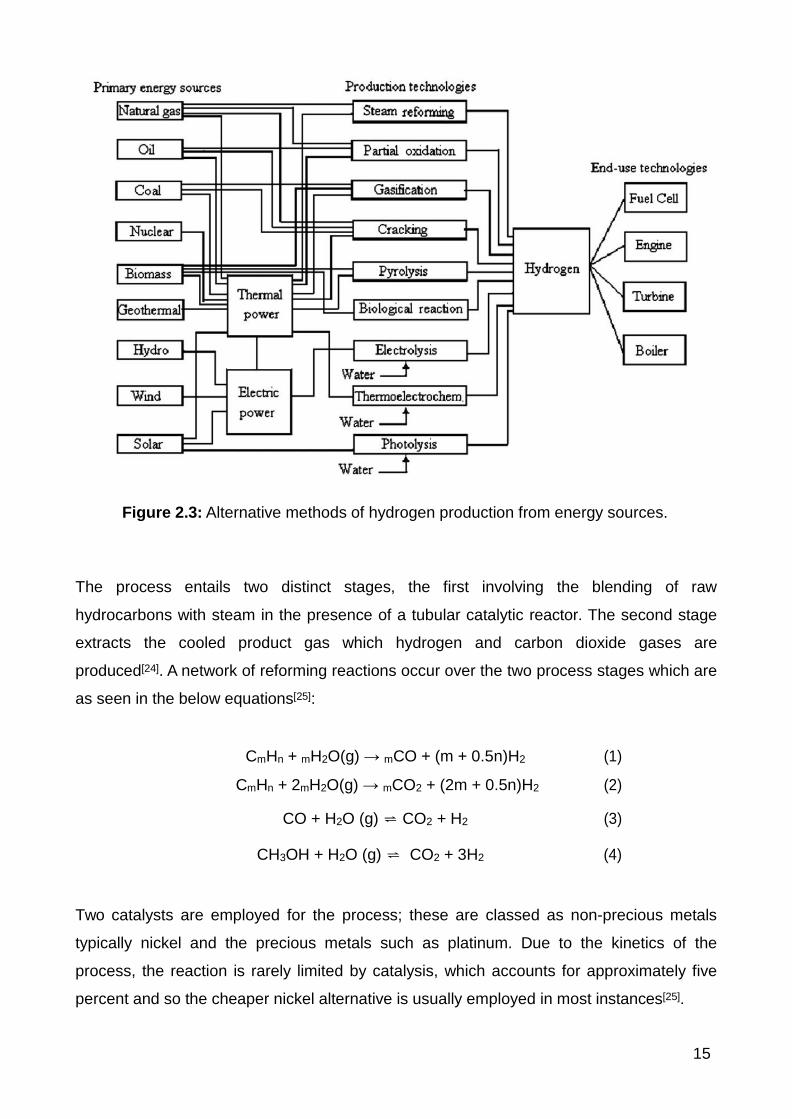
Figure 2.3: Alternative methods of hydrogen production from energy sources.
The process entails two distinct stages, the first involving the blending of raw
hydrocarbons with steam in the presence of a tubular catalytic reactor. The second stage
extracts the cooled product gas which hydrogen and carbon dioxide gases are
produced[24]. A network of reforming reactions occur over the two process stages which are
as seen in the below equations[25]:
CmHn + mH2O(g) → mCO + (m + 0.5n)H2 (1)
CmHn + 2mH2O(g) → mCO2 + (2m + 0.5n)H2 (2)
CO + H2O (g) ⇌ CO2 + H2 (3)
CH3OH + H2O (g) ⇌ CO2 + 3H2 (4)
Two catalysts are employed for the process; these are classed as non-precious metals
typically nickel and the precious metals such as platinum. Due to the kinetics of the
process, the reaction is rarely limited by catalysis, which accounts for approximately five
percent and so the cheaper nickel alternative is usually employed in most instances[25].

16
One of the less popular, however still commonly used production methods is through
Partial Oxidation known as POX. Concerning pollution, when compared and contrasted
with the more conventional steam reforming; triple the amount of COx pollutants produced
for the same volume of hydrogen gas produced. The non-catalytic POX process works by
gasifying raw material in the presence of oxygen and/or steam at high temperatures, with
the critical reaction progressions as follows[26]:
CH4 + O2 → CO + 2H2 (5)
CH4 + 2O2 → CO2 + 2H2O (6)
CH4 + H2O (g) → CO + 3H2 (7)
The POX process operations of the reactor are less expensive, however, the conversion
which occurs post production makes the technology more expensive than steam reforming
with a decreased yield. The process typically averages around a 60-75 percent conversion
rate under normal operating conditions[27]. A variation of the POX process uses the
addition of a catalyst commonly known as CPOX. The addition of a catalyst is targeted at
lowering the overall operating temperature of the process. Temperature control is required
as the nature of the reaction is exothermic and this can result in hot spot formation or
other undesired anomalies[27][28][29][30]. Typically the catalyst used in the process is based
around nickel or rhodium, however, due to rhodium's high-cost and lack of financial
viability, nickel is more commonly applied.
The final major method for hydrogen synthesis is Autothermal Reforming or ATR. This
method consists of a hybrid between the CPOX and the steam reforming methods. The
pairing of the two approaches forms a combination of endothermic and exothermic
properties[31]. This combination provides an advantage over the other methods as the
process does not require any external heat making it attractive from a cost-benefit
perspective however its conversion efficiency is only 60-70 percent[32]. One last advantage
over the other methods is its flexibility while operating as it has the ability to produce a
significantly higher volume of hydrogen than the POX method while being able to start up
and shut down very rapidly compared to the other methods[33].

17
2.5 Ammonia Decomposition
Ammonia used as an alternative to fuels such as methane and other hydrogen-
bearing compounds is preferred. The use of ammonia is attractive due to its eco-friendly
burning capabilities. This preference is due to no COx being produced from the combustion
reaction, and any unconverted NH3 from the initial reaction can be subsequently reduced
significantly with the utilisation of an absorber[34]. More conventional methods such as
partial oxidation or steam reforming result in significant amounts of COx being formed as a
by-product of the reactions. Ammonia decomposition is a method where the resulting
products from the reactions are hydrogen, nitrogen and some leftover ammonia
reactant[35].
The decomposition proceeds by dehydrogenation initially, which is then followed by a
recombination period where the nitrogen and hydrogen atoms combine to form H2 and N2
respectively. The overall binding energy of the nitrogen atom is paramount to the
processes success as it must be sufficient enough to render the dehydrogenation
successful but not overpowering. The nitrogen atom will otherwise not be able to
recombine at the conclusion of the reaction to form N2[36]. The decomposition process is a
slightly endothermic reaction, with the following equations[35];
2NH3 → N2 + 3H2 ∆H = 11 kcal/mol. (8)
NH3 → NH2 + H→ NH + H → N + H (9)
The product stream from the reaction yields no carbon oxides or sulfurs making the
Hydrogen produced free of difficult to remove impurities. The resultant products also bear
a strong odour making leak identification/location relatively straightforward[37].
The main catalysts currently being researched are transition metal carbides and nitrides
such as CO3Mo3N and W2C. Other transition metals such as nickel, iridium and ruthenium
are also being extensively investigated to determine their effectiveness. The focus of all
research in catalysts is directed at finding economical transition metal alternatives over the
more expensive platinum group metal catalysts. Multiple investigations into these new
technologies for catalysing reactions have occurred as currently, catalysts are at the

18
forefront of process improvements. The central theme coming from the literature/research
being conducted is a demand for innovative catalysts in Ammonia Decomposition.
Ammonia contains more than any other organic carrier of hydrogen with 17.5 mass
percent. It also possesses attractive characteristics such as a high energy density; and an
abundant supply with fewer shortage issues and simple storage solutions[38]. Economics
plays a vital role in the overall decision for choosing which methods to obtain hydrogen.
Ammonia production is approximately one US dollar per kilogram, compared to hydrogen
where it can be as expensive as five and a half US dollars per kilogram[39]. The general
trend of scientific research into the Ammonia Decomposition method has been directed
towards catalytic improvements and the removal of toxic ammonia traces as a pollutant
released after the reaction[40][41].
Due to such a focused trend in research, a significant gap exists in studies which
investigate using ammonia as a feedstock for hydrogen production[41][42]. The industry also
requires more studies researching full-scale reactors and pilot plants as information on
reactors is scarce. Research conducted by M. Abashar displays significant differences in
the effectiveness of reactor choice in Ammonia Decomposition. Results show that the
difference between a single fixed bed reactor (FBR) and a single fixed bed membrane
reactor (FBMR) is 39.57 percent concerning exit ammonia conversion. Schematic
representations of the FMBR reactor is shown in [43, Fig 2.4].
The Ammonia Decomposition reaction is reversible and endothermic. Chemical equilibrium
according to the Le Chateliers principle is controlled by alterations in temperature,
pressure and concentration. The research determined that when applying this principle,
the ammonia conversion increases with increased temperatures, decreased pressures and
removal of products[43]. Increases in temperature also resulted in improved kinetics, and
hence increases in the rate ammonia being decomposed (rate of reaction)[43]. These
conclusions mean that for FBR’s temperature control must be maintained as exceedingly
high temperatures can result in catalyst destruction[43].

19
Figure 2.4: Two dimensional model produced for the theoretical modelling of Ammonia decomposition.
For the FMBR, an increase in pressure will cause an equilibrium shift to the right and left
due to an increased permutation of hydrogen while simultaneously decreasing the number
of moles to form ammonia[43]. The following [43, Fig 2.5-2.8] display different configurations
of reactors for comparison.
As displayed in Figure 2.5, the performance of the FMBR and FBR comparatively
regarding exit ammonia conversion with the FMBR reactor significantly outperforming its
counterpart[43]. Figure 2.6 displays the relationship between reactor volume and
temperature which results in reduced reaction kinetics when the reactor volume
increases[43]. In Figure 2.7, the hydrogen concentration profiles are displayed showing
significant decreases in the concentration in the FBMR as the reaction proceeds through
the length of the reactor[43]. Polar to the FMBR, the FBR increases significantly due to its
inefficient removal of hydrogen from the reaction media[43].

20
Figure 2.5: Conversion profiles of NH3
Figure 2.6: Temperature profiles of reactors

21
Figure 2.7: Concentration profiles of H2 in different reactors.
Figure 2.8: Effectiveness (reaction conversion) profiles of reactors.
22
Polar to the FMBR, the FBR increases significantly due to its inefficient removal of
hydrogen from the reaction media[43]. The effectiveness factors are displayed in Figure 2.8
which show at the beginning of the reaction both reactors have low effectiveness which
indicates that the intra-particle diffusion has a significant impact on the overall reaction
rate[43]. This finding demonstrates that the reaction is diffusion limited.
In [35] the study focused on the metal catalyst used to enhance the reaction as a key
finding was the profound role in which catalysis plays in the Ammonia Decomposition
reaction. A quote from the paper describes the current state of research of catalysts in the
Ammonia Decomposition process[35];
“Unfortunately, there has been no investigation that has systematically catalogued
catalytic decomposition of ammonia on various supported metal catalysts for
hydrogen production.”
Individual supports such as Silica and Alumina were used during the experimentation for
the transition metal catalysts to be coupled together. Tests without the catalyst supports
were also conducted, this added breadth to the experiment and baseline data for
comparison purposes. For the reaction not to be mass-transfer limited at the high
temperature of the experiment, the catalysts were ground to a 5 - 250 nm size range[35].
Referring to [35, Table 2.2], it displays the overall conversion of the decomposition and the
formation rate of hydrogen with each catalyst paired with silicon oxide. The results clearly
indicate ruthenium is the superior catalyst used in the experiment. Ruthenium is seen to
have the advantage over the other sample for all temperatures tested in conversion and
production rate. Furthermore, the ruthenium catalyst is also presented graphically by [35,
Fig 2.9] displaying the ruthenium and its support iterations to determine the best support
for the catalyst regarding turn over frequency (TOF). The figure shows the Silicon Oxide
support significantly outperforms the alumina support once above 675 Kelvin. The worst
performing catalyst in the experiment was nickel with only a maximum of 70 percent
conversion in contrast to 99 percent of ruthenium.

23
10% Ni/SiO 65% Ni/SiO 10% Ir/SiO 10% Ru/SiO Temperature
(K) Conv. Rate(H Conv. Rate(H Conv. Rate(H Conv. Rate(H (%) (mmol/min g (%) (mmol/min g (%) (mmol/min g (%) (mmol/min g
673 1.4 0.44 3.5 1.1 3.9 1.2 14.3 4.5
723 4.2 1.3 9.3 2.9 8.1 2.6 36.4 11.4
773 10.5 3.3 21.7 6.8 18.2 5.7 64.0 20.0
823 21.6 6.8 48.7 15.2 30.4 9.5 - -
873 36.4 11.4 79.5 24.9 56.0 17.6 97.0 30.3
923 70.0 21.1 97.0 30.3 - - 99.0 30.9
973 - - - - 98 30.6 - -
Table 2.2: Conversion and formation rates for silica containing catalysts[35].
The paper shows credible research into its conclusions from its investigation into transition
metals being used as catalysts for hydrogen production. The main finding of the
experimentation was that ruthenium significantly outperformed the nickel and iridium
catalysts. One other significant discovery was that the catalyst supports played a crucial
role in determining the activity of the catalysts. This paper provides many areas for further
research such as; new catalyst materials, surface cleavage iterations, increased testing
parameters for temperature and incorporating the cost of the material as an influence on
its overall effectiveness.
40
30
20
10
0 550 637.5 725 812.5 900
Temperature (K)
Alumina Support Silicon Oxide Support
Figure 2.9 Catalyst turnover frequency as a function of temperature
TO
F (
mole
cule
s.si
te -
1 .
sec -
1)

24
The article provides strong baseline information into the effectiveness of transition metals
being used as catalysts in the Ammonia Decomposition process. It provides reliable depth
of research conceding the variations of catalyst support, with three for each transition
metal, being; Silicon Dioxide, Alumina and a control sample. The experiment also provides
a reliable amount of data iterations at different temperatures which provide substantial
credibility to the results and allowing clear distinctions to be made about the integrity of
each catalyst. The experiment procedure, however, lacks breadth in its temperatures
chosen to conduct the research, and catalyst variations which detract from the
effectiveness of the results. This lack of range in the temperatures tested prevents
determination of the temperature range from which the optimum amount of conversion
occurs. The shortcoming prevents the sensitivity of the catalyst to the temperature change
from being determined. Temperature determination is incredibly useful for industrial
applications as temperatures commonly fluctuate. The literature also failed to explore the
variations of the catalyst surfaces and materials, which could potentially further improve
the catalyst potential. Other catalysts such as molybdenum nitrides, carbides and tungsten
based catalysts could be extensions on for further experimentation and comparison. The
only surface explored was (1 0 0), this limits the results but allows the potential for follow-
up studies to occur relating to how the surface cleavage could be a means for further
optimisation.
Research conducted by [44] investigates the suitability of monolayer bimetallic catalysts in
the Ammonia Decomposition reaction. The research is being carried out on this specific
type of catalyst as there was a hole in literature where there was no rational method for
producing these specific kinds of catalysts. For the experiment the overall ammonia
decomposition process was deconstructed and modelled with 12 reaction steps, these
elementary steps are as follows;
NH3 + ∗ → NH3* (10)
NH3* → NH3 + ∗ (11)
NH3* + ∗ → NH2 + H* (12)
NH2 + H* → NH3* + ∗ (13)
NH2 + ∗ → NH* + H* (14)
NH* + H* → NH2 + * (15)
NH* + ∗ → N* + H* (16)

25
N* + H* → NH* + * (17)
N* + N* → N2 + ∗ (18)
N2 + ∗ → N* + N* (19)
H* + H* → H2 + ∗ (20)
H2 + ∗ → H* + H* (21)
(∗ Represents an adsorbed surface species.)
The bimetallic catalysts consist of a monolayer of an admetal on the top layers of the host
metal which makes up the bulk of the structure. The admetal has two variations where it
can be found on the surface or below the initial layer of the structure when it forms a
subsurface. The two structure variations investigated in the experiments, with findings
showing different properties from one another when attached to the same parent metal.
Results from the research show that ruthenium outperforms the other catalysts with
approximately 10% conversion of ammonia and is closely followed by the cobalt and
rhodium catalysts[45]. The peak nitrogen binding energy was found graphically to be
approximately 134 kcal mol-1 in the research, where the value is then used to identify
surfaces with desirable catalytic activities. The data was then used in a sensitivity analysis
which found the rate determining step to be the removal of the second hydrogen from
equation (14) when the nitrogen binding energy was less than 125 kcal mol-1. When the
energy was above 125 kcal mol-1, the rate determining step was also found to be equation
(14).
The paper also diverges its focus towards the configuration of the catalyst, and the effects
it incurs on the bond length and the binding energy. [44, Table 2.3] depicts the difference
between different catalyst constructions on a (1 1 1) surface and their impacts on bond
length and binding energy.

26
Configuration Metal (111) surface N2 binding energy (kcal.mol Bond Length (Å)
Pt-Ti-Pt 70.7 1.975
Pt-V-Pt 81.0 1.975 Subsurface
Pt-Cr-Pt 76.3 1.965
Pt-Mn-Pt 77.6 1.968
Pt-Co-Pt 83.4 1.964
Pt-Ni-Pt 87.5 1.941
Single Metal Pt 102.1 1.954
Ni 113.8 1.770
Ni-Pt-Pt 130.7 1.761
Co-Pt-Pt 126.5 1.780
Fe-Pt-Pt 134.1 1.864 Surface
Mn-Pt-Pt 207.2 1.854
Ti-Pt-Pt 176.1 1.918
Table 2.3: DFT binding energies and bond lengths of nitrogen atoms on monolayer bimetallic surfaces
The data displays a significant spread of energies from 70.7 kcal mol-1 from the Pt-Ti-Pt
formation to 207.2 kcal mol-1 from the Mn-Pt-Pt catalyst. The experimental results from
[44] show that the surface is still active at temperatures as low as 325 Kelvin, and
highlights the reduction in θN as the temperature decreases. The experiment's findings
were able to support the first computational framework proposed, which was that bimetallic
catalysts were able to be screened using binding energies from DFT calculations. The
calculations used were on first principles from microkinetic models. The experimental
component of the research found that the Ni-Pt-Pt catalyst was more active than the Ru-
based structure, based on a lower nitrogen disruption temperature and a lower
dehydrogenation barrier. The modelling concluded that Ammonia Decomposition could
occur at temperatures at or below 600 Kelvin. Finally, the paper was able to sufficiently
predict how active the Ni-Pt-Pt surface was using TPD and HREELS (High-Resolution
Electron Energy Loss Spectroscopy) to collect measurements for confirmation.
The article provides a comprehensive view of bimetallic catalysts and their
appropriateness for use in producing hydrogen from Ammonia. The modelling and physical

27
Catalysts Temperature (ºC) NH3 H2 rate (mmol/(min g
Ru/CNTs 450 43.7 14.6
550 100 33.5
Ru/MgO 450 30.9 10.4
550 91.8 30.7
Ru/Ac 450 28.7 9.6
550 78.9 26.4
450 24.8 8.3 Ru/ZrO
550 77.0 25.8
Ru/Al 450 23.4 7.8
550 73.7 23.5
K-Ru/CNTs 400 59.8 20.0
450 97.3 32.6
experimenting, supported by past data provided a robust and well-developed collection of
results. The article has a few areas for future research and elaboration such as; surface
development and process kinetics as the study failed to venture further into that domain.
The cleavage of the surfaces could be altered in future works looking at the effect on
bimetallic catalyst performance. A shortcoming with the experimentation was the reliance
on platinum for the surface compounds used, as 15 of the 16 surfaces contained the
metal. Other transition metals should have also been trialled to provide more breadth to
the metal surfaces used. The method given by the article was underdeveloped as it lacks
specific details critical for replication. The missing information in the method makes a
possible replication of the experiment challenging to achieve.
In early 2004 several research papers were released using Ammonia for Hydrogen
production. Article [46] attempts to address current gaps found in the literature relating to
catalyst activity in Ammonia Decomposition when the reaction temperature is under 600˚C.
The research is targeted at identifying catalysts which are stable and have a high activity
at lower than typical temperatures for hydrogen production from Ammonia. The results of
the experiments found that using the carbon nanotube (CNT) as a catalyst support
outperformed all the other metal oxide supports examined. The CNT had the highest
activity as a combined result of high dispersion of Ru and the low impurities found in the
CNT.
Table 2.4: NH3 decomposition over supported 5wt.%-Ru catalysts data

28
The high dispersion of the Ru was found to be a direct result due to the large surface area
caused by the CNT as the size of the Ru particles in the tubes are restricted. The stability
of the CNT was also proven experimentally with the performance of the Ru/CNTs and K–
Ru/CNT's remaining steady over the ten hour period. Visible structural differences can be
noted between the catalysts, especially the CNT when compared to the other metal
oxides.
Table 2.4 displays the Ammonia conversion percentages at varying temperatures from the
experiment[46]. The tables show that the K-Ru/CNT ‘hybrid’ catalyst was the best
performing with 97.3 percent conversion at 450˚C, 53.6 percent more conversion than the
next best catalyst which was another CNT support. It is evident from this results table that
the CNT supports provide a much higher conversion than that of the metal oxide supports.
Of the stand-alone Ruthenium catalysts, the CNT supported specimen was the best
performing across the board due to the large surface area caused by the support which is
demonstrated by the increased activity and hence a better conversion percentage. XRD
data from the research indicates the CNT support has no high levels of dispersion, this is a
result of the high purity of the support and the high graphitisation.
Figure 2.10: Comparison of the effect of KOH modification on the catalysts.

29
The addition of Potassium to form the K-Ru/CNT ‘hybrid’ catalyst significantly improves the
performance of the catalyst. [46, Fig 2.10] graphically supports the data found in Table 2.3
which shows the K-Ru/CNT's significantly outperforming other catalyst supports, even at
temperatures under 450˚C where typically the conversion is not high. The high level of
graphitisation results in a high efficiency of electron transfer from the promoter to
Ruthenium atom. Due to the increased efficiency, it is thought one of the slower kinetic
steps in nitrogen atom desorption is increased[47]. The graph shows the increasing trend of
Ammonia conversion which is directly proportional to the temperature of the reaction. The
literature provides information and answers on catalyst supports which did not exist in the
scientific community. The work conducted shows that catalyst supports have many
avenues to explore in the sense that CNT’s provide significant opportunities for
improvement in catalyst stability and activity. The paper fails, however, to link theoretical
information with the physical information presented. The Potassium modification made of
the Ru/CNT catalyst forming the K-Ru/CNT ‘hybrid’ lacks a theoretical explanation as to
why such a large performance improvement is recorded.
The research also requires follow-up experimentation as the data points for temperature
are very small for each catalyst support and as a result has a high uncertainty value. The
future research should look more specifically at the K-Ru/CNT and other ‘hybrids’ and
focus on ways to gain increased performance at lower temperatures. The literature also
has a shortcoming in explaining why there is an increase in stability of the CNT catalysts
and how the stability compares with the other metal oxide catalysts. In further work,
exploration of other transition metals such as molybdenum are avenues for exploration
due to the high cost of Ruthenium. The price of ruthenium in a large scale setting is not
sustainable, and substations need to be found.
2.6 Catalysis of Metal Nitrides & Carbides
Metal Nitrides & Carbides in recent years have been identified as the key research
area for replacing conventional catalysts in reactors[48]. Over the last decade, major strides
have been taken in developing technologies for the hydroprocessing industry.
Molybdenum-based solids have received the most attention by researchers however
limited experimental evidence is available to show that nitrides or carbides provide any
advantage over one another. [49, Fig 2.11a & 2.11b] displays the crystallographic structure

39
Figure 2.11a & 2.11b: Lattice structure of the Mo2C and Mo2N catalysts. (Re-drawn in Materials Studio)
Atoms: (Dark Blue: Nitrogen, Aqua: Molybdenum, Grey: Carbon)
of Mo2N & Mo2C catalysts where they share many similarities with one another. When
compared to other molybdenum-based catalysts such as Mo2S they show no resemblance
at all. In [50, Fig 2.12a & 2.12b] it indicates that the heat of formation of both metal carbides
and nitrides from group IV to VIII decreases significantly as the group increases. The
figure shows that Mo2N & Mo2C have significantly lower formation energies than the
majority of the other compounds with Mo2N being approximately double that of Mo2C. Both
catalysts provide resistance against reduction with Mo2N being the more stable catalyst of
the pair. However, both structures are susceptible to sulfidation as there is a significant
driving force present. Concerning [51, Table 2.5] the sulfidation can be minimised
significantly if hydrogen gas is present due to it being produced by reactions (3) and (4),
Figure 2.12: Formation energies compared periodic position.

31
Figure 2.12b: Formation energies compared periodic position.
hence reducing the driving force. Table 2.5 also displays the sulfidation may be reduced
due to the presence of NH3 and hydrocarbons. The table also suggests that in reaction five
the combination of NH3 and H2 could result in the Mo2C catalyst being converted into
Mo2N. For this to occur in a real-life situation, a sufficient amount of nitrogen-containing
compound would have to be present in the feed for conversion of the catalyst to be
feasible.
Table 2.5: Free energy formation data of H2 and H2S
The paper [52] investigates two main areas, the first being carbon monoxide
hydrogenation over different surfaces of Mo2C(hcp), Mo2C(fcc) and Mo2N(fcc) catalysts.
The three catalysts were characterised after three main stages of the experiment;
synthesis, pretreatment and exposure to reaction conditions. The characterisation
methods/techniques employed were as follows; XRD, elemental analysis, transmission
electron microscopy, BET surface area measurement and CO chemisorption. When

32
observing [52, Fig 2.13] it shows a relatively slow approach to the steady state value for
the MoN2 catalyst, whereas the other carbide catalysts approach the steady state activities
more aggressively and with more energy. For the Mo2N catalyst, it achieved steady state
kinetics after 16 hours, a notable difference is that the Mo2N catalysts activity does not go
through a maximum before reaching steady state like the other catalysts did.
Figure 2.13: Steady state activity approach for CO hydrogenation over Mo2N(fcc)
Referring to [52, Table 2.6] it is evident in the results that the Mo2C(hcp) structure is half as
active as the Mo2C(fcc) and MoN2(fcc) surfaces. MoN2 was the most active catalyst with a
value of 50.1 s-1 and throughout all the results had almost identical selectivity values to the
Mo2C(fcc) catalyst.
Table 2.6: Activities and selectivities of Mo2C(hcp), Mo2C(fcc), and Mo2N(fcc) for CO
hydrogenation

33
At the conclusion of the experiment, the catalysts were sampled with the Mo2N structure
showing no loss of nitrogen due to contact with the synthesis gas; the findings were
determined to utilise an elemental analysis. The results indicate however oxygen and
carbon accumulation is occurring, but the X-ray diffraction pattern suggests that the bulk of
the structure continues to remain as MoN2 with no new phases forming. The two carbide
catalysts increase substantially over time as a direct result of oxygen being removed
progressively from the lattice as the reaction progresses. Of the carbide structures, the
(hcp) surface is almost 200 fold more active than the ccc surface over the duration of the
reaction than the (fcc) surface. This difference is attributed to the principal surface present
in each of the phases through the process.
The article is one of the first major research works contributed to the scientific community
relating to nitrides and carbides being used for catalytic applications. The literature
provides well-represented data using multiple methods to gain accurate findings. The work
convincingly provides substantial evidence towards the case of the ability of carbides and
nitrides to be used as catalysts. Of the carbide surfaces from the data and arguments
provided it is straightforward to conclude that the Mo2C(fcc) catalyst for the carbides was
superior in carbon monoxide hydrogenation. In the C2H6 hydrogenolysis, the Mo2C(hcp)
was the preferred catalyst after displaying it was multiple times more active in the reaction.
The major shortcoming from the paper was the failure to include a second MoN2 catalyst
surface to compare the results to the (fcc) surface used in the experiments. With the
addition of the other surface, strong correlations could be made between the two classes
of catalysts in carbides and nitrides. The optimum catalyst class could be then determined
for the two different reactions included in the experiment, and better comparisons could be
made in catalyst performance. Another area of research-extension could be experimenting
with more than just the (fcc) and (hcp) surfaces, allowing for more variation in the catalyst
surface. Varying the transition metal in which the nitride and carbide are bonded to could
also be another domain of exploration with investigations to see if Molybdenum is the best-
suited metal in the compound.
Similarly to platinum, molybdenum nitride shares many characteristics as a catalyst with
many critical applications, including NOx reduction, hydrogenation and hydro-
desulfurisation[53]. Applications have been found in hydrogen production from ammonia
decomposition where research is finding it can outperform platinum group catalysts while
34
being more economical. Recent studies [54] have found that the most stable facet was a
nitrogen truncated surface which was along the (111) index. The research details the
optimised geometry of the y-Mo2N(111) surface which is composed of four layers of two by
two unit cells with five distinct adsorption sites being determined by the work[54]. The article
[54] presents that total hydrogen uptake from the y-Mo2N catalyst is approximately 10
percent of the total surface area and that the method of adsorption is via the homiletic
disassociation pathway. Once the y-Mo2N surface becomes covered in nitrogen atoms, the
catalytic reactivity will decrease significantly.
Due to the high bond strength which N2 posses bonds with it highly unlikely that y-Mo2N
will de-catalyse when exposed to nitrogen in the atmosphere. The catalyst can be
converted into an oxynitride in the form of Mo2NxOy when y-Mo2N is exposed to the
atmosphere, in particular, atmospheric oxygen[54]. It has been extensively reported in the
literature that the surface terminations are a vital determinate of the products and the
reaction rates[55]. Results from the article highlight y-Mo2N(111) having a high affinity for
oxygen which can bond to the vacant nitrogen site and ultimately hindering the overall
performance of the catalyst. Future developments of y-Mo2N research are extending into
experimental proof of the effects of surface termination on the activity of the catalyst[53].
2.6.1 Catalysis featuring Mo2N, Mo2C and W2C structures
It has been documented in the literature of the important role played by metal nitrides in
the decomposition of ammonia. The importance is a result of the adsorption and
desorption of nitrogen is a rate-limiting step in the decomposition reaction[56]. Theoretical
calculations were conducted in [57] which showed that nitrogen had a more significant
affinity towards the edges for the surfaces. The two rate-limiting steps in the ammonia
decomposition reaction; ‘synthesis’ (N2 dissociation) and ‘decomposition’ (nitrogen
recombination) are related to the interactions which occur between the active surface site
on the catalysts and the N atoms[58].
It has also been reported that the performance of a bimetallic surface in the decomposition
reaction can be accurately predicted from the binding energies from DFT calculations. The
calculations are supported/guided from the first principle based microkinetic models[59].
From the theoretical calculations in [57], the binding energy of N was stronger over MoN
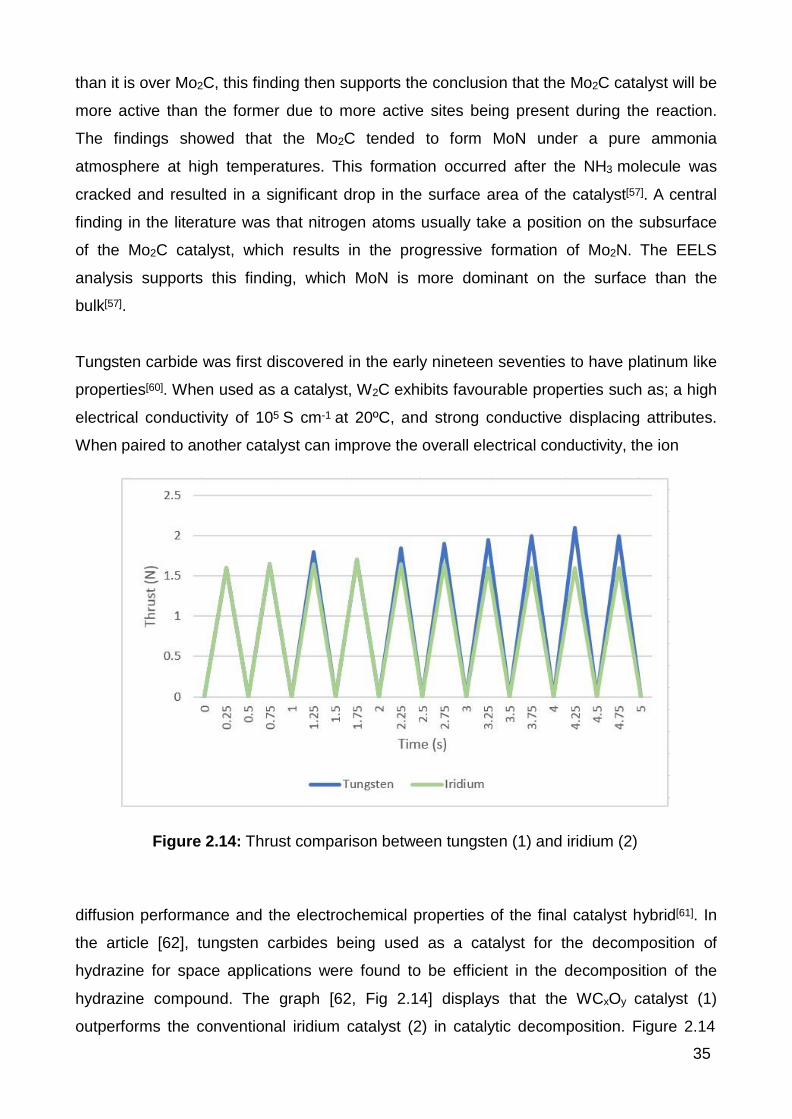
35
than it is over Mo2C, this finding then supports the conclusion that the Mo2C catalyst will be
more active than the former due to more active sites being present during the reaction.
The findings showed that the Mo2C tended to form MoN under a pure ammonia
atmosphere at high temperatures. This formation occurred after the NH3 molecule was
cracked and resulted in a significant drop in the surface area of the catalyst[57]. A central
finding in the literature was that nitrogen atoms usually take a position on the subsurface
of the Mo2C catalyst, which results in the progressive formation of Mo2N. The EELS
analysis supports this finding, which MoN is more dominant on the surface than the
bulk[57].
Tungsten carbide was first discovered in the early nineteen seventies to have platinum like
properties[60]. When used as a catalyst, W2C exhibits favourable properties such as; a high
electrical conductivity of 105 S cm-1 at 20ºC, and strong conductive displacing attributes.
When paired to another catalyst can improve the overall electrical conductivity, the ion
Figure 2.14: Thrust comparison between tungsten (1) and iridium (2)
diffusion performance and the electrochemical properties of the final catalyst hybrid[61]. In
the article [62], tungsten carbides being used as a catalyst for the decomposition of
hydrazine for space applications were found to be efficient in the decomposition of the
hydrazine compound. The graph [62, Fig 2.14] displays that the WCxOy catalyst (1)
outperforms the conventional iridium catalyst (2) in catalytic decomposition. Figure 2.14

36
also indicates that as time extends in the reaction, the discrepancy in the two catalysts
performances increases with tungsten performing better for longer. Tungsten carbide
materials since the discovery of their attractive properties for catalysing reactions have
shown great potential to act as a substitute for noble metals as catalysts in chemical
processes[63].
When acting as a catalyst support tungsten carbides low surface area assists in
significantly improving the hydrogen productions activity, which was found in [64] where
the activity of MoS2 increased abundantly. The results of the experiment also found when
W2C was incorporated as a catalytic support the activity increased due to more active sites
being present for the hydrogen evolution to occur. The activity also increased secondly
due to the promoted electron transfer rate which was directly attributed to the addition of
the tungsten[64].
2.6.2 Catalysis featuring Co3Mo3N
In recent years, it has been reported that ternary metal nitrides such as Co3Mo3N
have displayed high activity traits experimentally[65]. This high activity has attracted
significant attention from researchers, which has found that the activity from Co3Mo3N is
greater than the conventional iron-based Haber-Bosch catalyst[65]. [66, Table 2.7] presents
data from ammonia synthesis where different Co3Mo3N based catalysts are used. The
results are compared to the iron-based Haber-Bosch catalyst, which performed worst
overall concerning the rate of Ammonia Synthesised. The tables also presents evidence
to support that specific variations of the Co3Mo3N catalyst resulted in vast improvements in
the production of Ammonia such as Co3Mo3N-Cs2 with 652 µmol h-1 g-1 986 µmol h-1 g-1
rates respectively. The increase in catalyst production can be attributed to Cs+ as it has
been found to be a promoter. The promoter characteristics, however, only exist up to an
absolute limit as once reached the catalyst will begin to decompose[65].
In [66], Norskov’s work on the Co3Mo3N catalyst explains the increased activity as a result
of the binding energies of the compound. The theory suggests that the average N2 binding
energies for cobalt occur too weakly, where the molybdenum atoms in the compound are
bound too strongly. The dissociation of N2 is often referred to as the rate-limiting step, and
it is argued in the literature, that for the catalyst to be effective, the components must be

37
nearby regarding binding energy. The (1 1 1) surface plane of the catalyst exhibits a
consistent mixture of molybdenum and cobalt sites. The theory gained support from
microkinetic studies provided by the authors, where the activation energy between the
molybdenum and cobalt atoms was discovered to be intermediate[67].
Table 2.7: Various Catalyst Data For Ammonia Synthesis
Co3Mo3N is suggested in the literature as one of the most dominant active phases of Co-
Mo catalysts[68]. As described in the article [3], catalysts are commonly used in the
presence of hydrogen with such cases being desulfurisation where cobalt-molybdenum
catalysts are preferred. From thermodynamic calculations on ammonia decomposition, it is
theoretically possible to achieve 99 percent conversion with one atmosphere of pressure
at 400˚C[69]. Co3Mo3N being used as a catalyst in ammonia decomposition is a relatively
new concept as ternary nitride systems have only recently themselves attracted attention
to areas such as ammonia synthesis.
In the article [68], investigations are undertaken looking specifically at optimisations of
Co3Mo3N, MoN (Mo2N) catalysts involved in ammonia decomposition. Findings show that
the introduction of cobalt in the formation of the molybdenum catalysts promotes the
formation of both y-Mo2N and Co3Mo3N simultaneously[68]. It has also been discovered that
the cobalt introduction leads to substantial increases in the intensity of the molybdenum
catalysts[68]. XRD analysis images from [68] shows an increase in the concentration of
cobalt from one percent, through to 5 percent which has a significant impact on the
structure of the compound. The experiments conducted using Co3Mo3N and MoN showed
that the former slightly outperformed the later with 98.3 and 97.2 percent conversion of
ammonia respectively at 600ºC. The addition of cobalt to the compounds saw a significant
decrease in the activation energies and suggest promotion influences from the cobalt[68]. A

38
Catalyst Metal Loading (wt%) GHSV, h Temperature (ºC) NH3
Ru/CNT 5 30000 500 100
CoMo/Al 5 36000 600 99.0
Co7 5 36000 600 99.2
MoN/Al 12 3600 600 75.2
MoN/SBA-15 12 15800 650 100
Co3 10 7600 600 -
Co3 10 11000 600 71.5
La-CoMoN 10 11000 600 97.6
Mo Bulk 36000 600 71.0
Mo Bulk 15000 600 70.1
MoN Bulk 6000 600 97.2
3CoMoN Bulk 6000 600 98.3
threshold for the addition of the cobalt was discovered as the activation energy of the three
percent structure was 92.8kJ mol-1, and the five percents sample was 102.6kJ mol-1 [68].
The increase in activation energy was directly attributed to the increase in cobalt
concentration as the excess addition caused an increase in the crystal size.
Concerning the data in [68, Table 2.8] it collates data from a significant portion of
experiments relating to catalysts in ammonia decomposition looking at the conversion
effects each has. The Co3Mo3N catalyst features as one of the more promising
compounds as it is in the upper quartile of conversion results.The results from [68] found
that the best performing concentration was three percent cobalt regarding conversion and
H2 formation rate. All the samples apart from the five percent sample had reached
equilibrium by the one hour mark of the reaction, whereas the five percent sample
continued to react for the full thirty hours of the experiment. The increased cobalt lead to
the decrease in catalytic performance due to the resulting agglomeration which was noted
on the XRD images. The agglomeration resulted in the deactivation of the catalyst and
hence resulting in decreased conversion and production rate[68].
Table 2.8: Catalytic Activities of Different Catalysts For NH3 Decomposition

39
2.7 Conclusions
Hydrogen's properties such as molecular weight and reactivity historically have
made it an essential component for the refining of other compounds like Ammonia and
methanol. Hydrogen is not a primary energy source as no natural reservoirs exist, this is
due to its inability to exist as a stand-alone atom. As the world continues to progress in
transitioning towards a fossil fuel free society the demand for alternative fuels such as
hydrogen will continue to increase. Future progression of hydrogen technologies are
leading towards fuel replacement in machines and automobiles which are reported in the
literature to be 15 years away. Currently production of hydrogen is too expensive, and
produces large volumes of pollutants as only four percent of hydrogen used in the industry
comes from renewable sources. The literature highlights the need for research into more
efficient and cost-effective methods for producing hydrogen. The necessity of research to
fill gaps in the industry comes as environmental regulations are getting tighter and the
current production methods will struggle to continue to adhere to the pollution regulations.
Ammonia decomposition presents many advantages over other hydrogen-producing
processes as the reaction does not produce COx as seen in reactions (8) and (9).
Ammonia as a compound can hold 17.5 percent hydrogen by mass, making it a useful
hydrogen storage facilitator. Research has shown that the choice of the reactor in which
the reaction takes place has a significant impact on the effectiveness of the
decomposition. The evidence shows that under the same reaction conditions an FBR and
FMBR can differ by as much as 40 percent regarding conversion. Research into reactor
composition also highlights that reactor the volume is a significant factor, affecting the
temperature, concentration, conversion and overall effectiveness of the reaction. From the
effectiveness data collected, it has been determined that the kinetics of the reaction are
diffusion limited due to the low values at the beginning of the reaction. Efforts into
improving the ammonia decomposition technology have been focused towards catalyst
optimisation as the current platinum group catalysts not being financially viable. Early
research into catalysis in the ammonia decomposition reaction highlighted the need for
increased investigations on various metal supported catalysts are the platinum metal
groups were not sustainable heading into the future demand for hydrogen-related fuels.
Table 2.2 showed ruthenium to have the advantage in early catalysis experimentation with
conversion results above 500ºC yielding the best conversions. However, the current

40
demand is for greater than 90 percent conversion at temperatures under 400ºC which
current catalysts are failing to achieve.
Tailor-made catalysts for the hydrogen decomposition reaction is the new trend in research
with metal carbides and nitrides showing strong results in other similar processes such as
ammonia synthesis. Compounds such as W2C, Mo2N, Mo2C are beginning to be
investigated vigorously as they are showing the most promising results. Of the three
catalysts named, Mo2C theoretically possess the ability to perform the best due to it having
a more considerable amount of active sites found on the structure. Ternary Nitrides such
as Co3Mo3N in recent research has also shown strong signs as an appropriate substitute
for platinum metal catalysts with recent experimentation with cobalt improving the
performance of the catalyst regarding activity due to the binding energies of the
compound. Norskov’s theory which is supported in literature explains that N2 dissociation
is the rate-limiting step of the reaction and when the Co3Mo3N catalyst is implemented this
is significantly reduced. Another new technology which needs further researching is carbon
nanotubes (CNT’s) as early experimentation has shown capabilities of achieving higher
than 90 percent conversion at 450ºC.
When comparing all the catalysts with the research to date, the carbon nano tube support
technology presents the most promise as a catalyst in the ammonia decomposition
reaction. If the CNT's are removed from the comparison due to the relatively conceptual
nature of their development, the Co3Mo3N compound shows the most promise as it has
the greatest conversion when compared to the W2C, Mo2N, Mo2C catalysts which can be
seen in Table 2.8. The Co3Mo3N catalyst also outperforms in terms of activity and rate at
which the reaction takes place. The limited number of articles in this field highlight the
need for increased research in the area of catalysts for ammonia decomposition, with
specific mention in the field of full scale and pilot plant process development. Future work
in this area will significantly assist the development of catalyst to optimise the ammonia
decomposition process further.

41
2.8 References
1. A. Shah, H. Al-Fetlawi and F. Walsh, "Dynamic modelling of hydrogen evolution effects
in the all-vanadium redox flow battery", Electrochimica Acta, vol. 55, no. 3, pp.
1125-1139, 2009.
2. D. Hansgen, D. Vlachos and J. Chen, "Using first principles to predict bimetallic
catalysts for the ammonia decomposition reaction", Nature Chemistry, vol. 2, no. 6,
pp. 484-489, 2010.
3. R. Chein, Y. Chen, C. Chang, J. Chung, “Numerical modelling of hydrogen production
from ammonia decomposition for fuel cell applications” Int. J. Hydrogen Energy
35, 589– 597, 2010
4. E. Gobina, J. Oklany and R. Hughes, "Elimination of Ammonia from Coal Gasification
Streams by Using a Catalytic Membrane Reactor", Industrial & Engineering
Chemistry Research, vol. 34, no. 11, pp. 3777-3783, 1995.
5. M. Abashar, "Ultra-clean hydrogen production by ammonia decomposition", Journal of
King Saud University - Engineering Sciences, 2016.
6. S. Yin, B. Xu, X. Zhou, C. Au, “A mini-review on ammonia decomposition catalysts for
on-site generation of hydro- gen for fuel cell applications” Appl. Catal. A 277, 1–9,
2004.
7. M. Cooper, G. Botte, “Hydrogen production from the electrooxidation of ammonia
catalyzed by Platinum and Rhodium on Raney Nickel substrate”, J. Electrochem.
Soc. 153 (10), A1894– A1901, 2006.
8. A. Hellman, K. Honkala, I. Remediakis, A. Logadottir, A. Carlsson, S. Dahl, “Ammonia
synthesis and decomposition on a Ru-based catalyst modeled by first principles”
Surf. Sci. 603 (10– 12), 1731–1739, 2009.
9. S. Hicks, and P. Gross "Hydrogen for refineries is increasingly provided by industrial
suppliers", U.S Energy Information Administration, 2017.
10. C. Kalamaras and A. Efstathiou, "Hydrogen Production Technologies: Current State
and Future Developments", Conference Papers in Energy, vol. 2013, pp. 1-9, 2013.
11. R. Ramachandran, "An overview of industrial uses of hydrogen", International Journal
of Hydrogen Energy, vol. 23, no. 7, pp. 593-598, 1998.
12. ”Hydrogen", IHS Markit, 2017. [Online]. Available: https://www.ihs.com/products/
hydrogen-chemical-economics-handbook.html. [Accessed: 19- May- 2017].
13. J. Kroschwitz, M. Howe-Grant, R. Kirk and D. Othmer, Encyclopedia of chemical
technology, 1st ed. New York: J. Wiley & Sons, 1997, pp. 13,884.

42
14. J. Gary, G. Handwerk and M. Kaiser, Petroleum Refining Technology and Economics,
1st ed. New York: Marcel Dekker, p. 131, 1987.
15. M. Momirlan and T. Veziroglu, "The properties of hydrogen as fuel tomorrow in
sustainable energy system for a cleaner planet", International Journal of Hydrogen
Energy, vol. 30, no. 7, pp. 795-802, 2005.
16. C. Winter, "Hydrogen energy—expected engineering breakthroughs", International
Journal of Hydrogen Energy, vol. 12, no. 8, pp. 521-546, 1987.
17. National Renewable Energy Laboratory, "Survey of the Economics of Hydrogen
Technologies", National Renewable Energy Laboratory, Denver, 1999.
18. A.Campen, K. Mondal and T. Wiltowski, "Separation of hydrogen from syngas using a
regenerative system", International Journal of Hydrogen Energy, vol. 33, no. 1, pp.
332-339, 2008.
19. I. Kapdan and F. Kargi, "Bio-hydrogen production from waste materials", Enzyme and
Microbial Technology, vol. 38, no. 5, pp. 569-582, 2006.
20. M. Balat, "Potential importance of hydrogen as a future solution to environmental and
transportation problems", International Journal of Hydrogen Energy, vol. 33, no. 15,
pp. 4013-4029, 2008.
21. C. Resini, L. Arrighi, M. Concepcion Herrera Delgado, M. Angeles Larrubia Vargas, L.
Alemany, P. Riani, S. Berardinelli, R. Marazza and G. Busca, "Production of
hydrogen by steam reforming of C3 organics over Pd–Cu/γ-Al2O3 catalyst",
International Journal of Hydrogen Energy, vol. 31, no. 1, pp. 13-19, 2006.
22. A. Patel, N. Maheshwari, P. Vijayan and R. Sinha, “A study on sulfur-iodine (S-I)
thermochemical water splitting process for hydrogen production from nuclear heat”,
Proceedings of 16th annual conference of Indian nuclear Society, vol.16, pp.15-18,
2005.
23. J. Ogden, M Steinbugler, and T Kreutz, “Comparison of hydrogen, methonal and
gasoline as fuels for fuel cell vehicles: implications for vehicle design and
infrastructure development,” Journal of Power Sources, vol.79, no. 2, pp. 143-168,
1999.
24. H. Song, L. Zhang, R. Watson, D. Braden, and U. Ozkan, “Investigation of bio-ethanol
steam reforming over cobalt based catalysts,” Catalysis Today, vol. 129, no. 3-4, pp.
346–354, 2007.
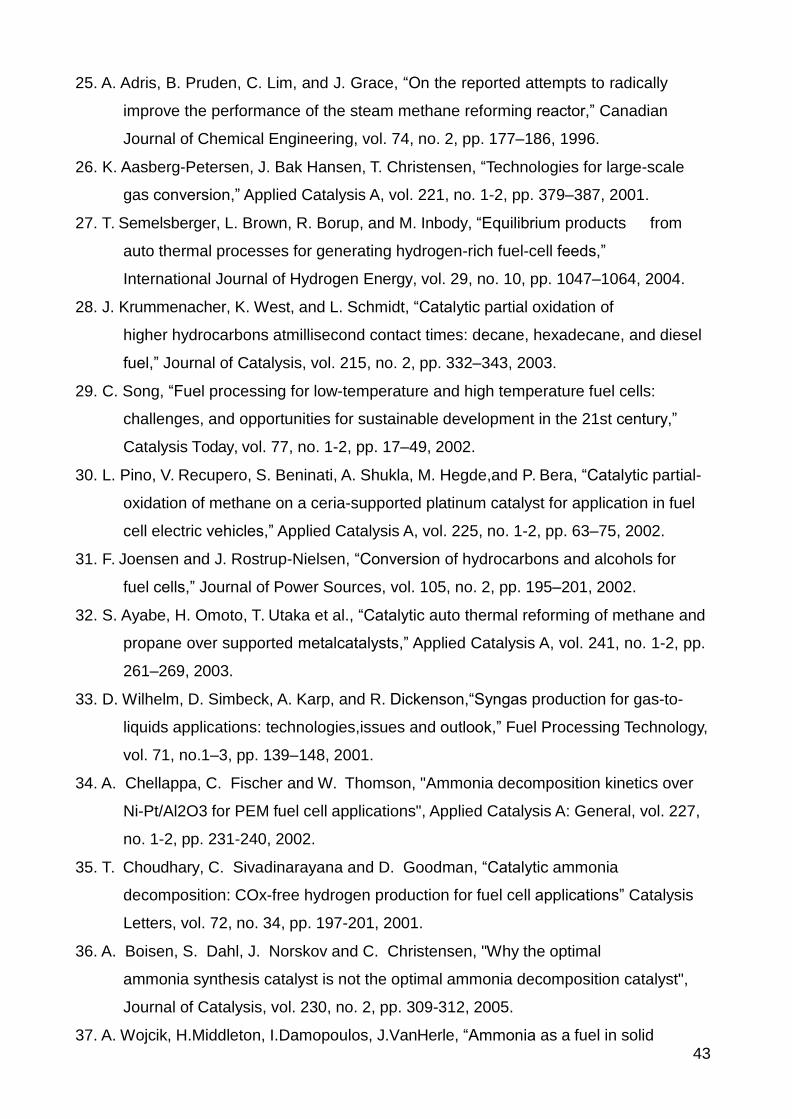
43
25. A. Adris, B. Pruden, C. Lim, and J. Grace, “On the reported attempts to radically
improve the performance of the steam methane reforming reactor,” Canadian
Journal of Chemical Engineering, vol. 74, no. 2, pp. 177–186, 1996.
26. K. Aasberg-Petersen, J. Bak Hansen, T. Christensen, “Technologies for large-scale
gas conversion,” Applied Catalysis A, vol. 221, no. 1-2, pp. 379–387, 2001.
27. T. Semelsberger, L. Brown, R. Borup, and M. Inbody, “Equilibrium products from
auto thermal processes for generating hydrogen-rich fuel-cell feeds,”
International Journal of Hydrogen Energy, vol. 29, no. 10, pp. 1047–1064, 2004.
28. J. Krummenacher, K. West, and L. Schmidt, “Catalytic partial oxidation of
higher hydrocarbons atmillisecond contact times: decane, hexadecane, and diesel
fuel,” Journal of Catalysis, vol. 215, no. 2, pp. 332–343, 2003.
29. C. Song, “Fuel processing for low-temperature and high temperature fuel cells:
challenges, and opportunities for sustainable development in the 21st century,”
Catalysis Today, vol. 77, no. 1-2, pp. 17–49, 2002.
30. L. Pino, V. Recupero, S. Beninati, A. Shukla, M. Hegde,and P. Bera, “Catalytic partial-
oxidation of methane on a ceria-supported platinum catalyst for application in fuel
cell electric vehicles,” Applied Catalysis A, vol. 225, no. 1-2, pp. 63–75, 2002.
31. F. Joensen and J. Rostrup-Nielsen, “Conversion of hydrocarbons and alcohols for
fuel cells,” Journal of Power Sources, vol. 105, no. 2, pp. 195–201, 2002.
32. S. Ayabe, H. Omoto, T. Utaka et al., “Catalytic auto thermal reforming of methane and
propane over supported metalcatalysts,” Applied Catalysis A, vol. 241, no. 1-2, pp.
261–269, 2003.
33. D. Wilhelm, D. Simbeck, A. Karp, and R. Dickenson,“Syngas production for gas-to-
liquids applications: technologies,issues and outlook,” Fuel Processing Technology,
vol. 71, no.1–3, pp. 139–148, 2001.
34. A. Chellappa, C. Fischer and W. Thomson, "Ammonia decomposition kinetics over
Ni-Pt/Al2O3 for PEM fuel cell applications", Applied Catalysis A: General, vol. 227,
no. 1-2, pp. 231-240, 2002.
35. T. Choudhary, C. Sivadinarayana and D. Goodman, “Catalytic ammonia
decomposition: COx-free hydrogen production for fuel cell applications” Catalysis
Letters, vol. 72, no. 34, pp. 197-201, 2001.
36. A. Boisen, S. Dahl, J. Norskov and C. Christensen, "Why the optimal
ammonia synthesis catalyst is not the optimal ammonia decomposition catalyst",
Journal of Catalysis, vol. 230, no. 2, pp. 309-312, 2005.
37. A. Wojcik, H.Middleton, I.Damopoulos, J.VanHerle, “Ammonia as a fuel in solid

44
oxide fuel cells”, J. Power Sources, vol.118 342–348, 2003.
38. R. Metkemeijer and P. Achard, "Comparison of ammonia and methanol applied
indirectly in a hydrogen fuel cell", International Journal of Hydrogen Energy, vol. 19,
no. 6, pp. 535-542, 1994.
39. A. Di Carlo, A. Dell’Era and Z. Del Prete, "3D simulation of hydrogen production by
ammonia decomposition in a catalytic membrane reactor", International Journal of
Hydrogen Energy, vol. 36, no. 18, pp. 11815-11824, 2011.
40. E. Gobina, J. Oklany and R. Hughes, "Elimination of Ammonia from Coal
Gasification Streams by Using a Catalytic Membrane Reactor", Industrial &
Engineering Chemistry Research, vol. 34, no. 11, pp. 3777-3783, 1995.
41. S. Yin, B. Xu, X. Zhou and C. Au, "A mini-review on ammonia decomposition
catalysts for on-site generation of hydrogen for fuel cell applications", Applied
Catalysis A: General, vol. 277, no. 1-2, pp. 1-9, 2004.
42. R. Chein, Y. Chen, C. Chang and J. Chung, "Numerical modelling of hydrogen
production from ammonia decomposition for fuel cell applications", International
Journal of Hydrogen Energy, vol. 35, no. 2, pp. 589-597, 2010.
43. M. Abashar, "Ultra-clean hydrogen production by ammonia decomposition", Journal of
King Saud University - Engineering Sciences, 2016.
44. D. Hansgen, D. Vlachos and J. Chen, "Using first principles to predict bimetallic
catalysts for the ammonia decomposition reaction", Nature Chemistry, vol. 2, no. 6,
pp. 484-489, 2010.
45. J. Ganley, F. Thomas, E. Seebauer and R. Masel, "A Priori Catalytic Activity
Correlations: The Difficult Case of Hydrogen Production from Ammonia", Catalysis
Letters, vol. 96, no. 34, pp. 117-122, 2004.
46. S. Yin, B. Xu, W. Zhu, C. Ng, X. Zhou and C. Au, "Carbon nanotubes-supported
Ru catalyst for the generation of COx-free hydrogen from ammonia", Catalysis
Today, vol. 93-95, pp. 27-38, 2004.
47. M. Bradford, P. Fanning and M. Vannice, "Kinetics of NH3Decomposition over Well
Dispersed Ru", Journal of Catalysis, vol. 172, no. 2, pp. 479-484, 1997.
48. E. Furimsky, "Metal carbides and nitrides as potential catalysts for
hydroprocessing", Applied Catalysis A: General, vol. 240, no. 1-2, pp. 1-28, 2003.

45
49. D. Sajkowski and S. Oyama, "Catalytic hydrotreating by molybdenum carbide and
nitride: unsupported Mo2N and Mo2CAl2O3", Applied Catalysis A: General, vol.
134, no. 2, pp. 339-349, 1996.
50. S. Ramanathan and S. Oyama, "New Catalysts for Hydroprocessing: Transition
Metal Carbides and Nitrides", The Journal of Physical Chemistry, vol. 99, no. 44, pp.
16365-16372, 1995.
51. J. Trawczyński, "Effect of synthesis conditions on the hydrodesulfurization and
hydronitrogenation activities of alumina supported Mo and CoMo nitrides",
Applied Catalysis A: General, vol. 197, no. 2, pp. 289-293, 2000.
52. G. Ranhotra, A. Bell and J Reimer, ”Catalysis over molybdenum carbides and
nitrides II. Studies of CO hydrogenation and C2H6 hydrogenolysis", Journal of
Catalysis, vol. 108, no. 1, pp. 40-49, 1987.
53. Z. Jaf, M. Altarawneh, H. Miran, Z. Jiang and B. Dlugogorski, "Mechanisms
governing selective hydrogenation of acetylene over γ-Mo2N surfaces", Catal. Sci.
Technol., vol. 7, no. 4, pp. 943-960, 2017.
54. I. Oluwoye, M. Altarawneh, J. Gore, H. Bockhorn and B. Dlugogorski, "Oxidation of
Polyethylene under Corrosive NOxAtmosphere", The Journal of Physical Chemistry
C, vol. 120, no. 7, pp. 3766-3775, 2016.
55. M. Zabilskiy, P. Djinović, E. Tchernychova, O. Tkachenko, L. Kustov and A. Pintar,
"Nanoshaped CuO/CeO2 Materials: Effect of the Exposed Ceria Surfaces on
Catalytic Activity in N2O Decomposition Reaction", ACS Catalysis, vol. 5, no. 9, pp.
5357-5365, 2015.
56. R. Schloegl, "Catalytic Synthesis of Ammonia — A “Never-Ending Story”?",
ChemInform, vol. 34, no. 27, pp. 2004 - 2008, 2003.
57. W. Zheng, T. Cotter, P. Kaghazchi, T. Jacob, B. Frank, K. Schlichte, W. Zhang, D.
Su, F. Schüth and R. Schlögl, "Experimental and Theoretical Investigation of
Molybdenum Carbide and Nitride as Catalysts for Ammonia Decomposition",
Journal of the American Chemical Society, vol. 135, no. 9, pp. 3458-3464, 2013.
58. R. Schlogel in G. Ertl, H. Knozinger, F. Schuth, J. Weitkamp (eds.): Handbook of
Heterogeneous Catalysis, 2nd ed., Vol. 5, Wiley-VCH, Wein- heim 2008, p. 2501.
59. D. Hansgen, D. Vlachos and J. Chen, "Using first principles to predict bimetallic
catalysts for the ammonia decomposition reaction", Nature Chemistry, vol. 2, no. 6,
pp. 484-489, 2010.

46
60. R. Levy and M. Boudart, "Platinum-Like Behavior of Tungsten Carbide in Surface
Catalysis", Science, vol. 181, no. 4099, pp. 547-549, 1973.
61. I. Kholmanov, C. Magnuson, A. Aliev, H. Li, B. Zhang, J. Suk, L. Zhang, E. Peng,
S. Mousavi, A. Khanikaev, R. Piner, G. Shvets and R. Ruoff, "Improved Electrical
Conductivity of Graphene Films Integrated with Metal Nanowires", Nano Letters,
vol. 12, no. 11, pp. 5679-5683, 2012.
62. J. Rodrigues, G. Cruz, G. Buglia, G. Boudart, M. Djega-Mariadassaou, “Nitride and
carbide of molybdenum and tungsten as substitutes of iridium for the catalysts used
for space communication”, Catalysis Letter, 45, 1-3, 1997.
63. J. Choi, J. Brenner, C. Colling, B. Demczyk, J. Dunning and L. Thompson,
"Synthesis and characterization of molybdenum nitride hydrodenitrogenation
catalysts", Catalysis Today, vol. 15, no. 2, pp. 201-222, 1992.
64. Y. Yan, B. Xia, X. Qi, H. Wang, R. Xu, J. Wang, H. Zhang and X. Wang, "Nano-
tungsten carbide decorated graphene as co-catalysts for enhanced hydrogen
evolution on molybdenum disulfide", Chemical Communications, vol. 49, no. 43, p.
4884, 2013.
65. J. Hargreaves, "Nitrides as ammonia synthesis catalysts and as potential nitrogen
transfer reagents", Applied Petrochemical Research, vol. 4, no. 1, pp. 3-10, 2014.
66. R. Kojima and K. Aika, "Cobalt molybdenum bimetallic nitride catalysts for ammonia
synthesis", Applied Catalysis A: General, vol. 219, no. 1-2, pp. 157-170, 2001.
67. S. Podila, S. Zaman, H. Driss, Y. Alhamed, A. Al-Zahrani and L. Petrov, "Hydrogen
production by ammonia decomposition using high surface area Mo2N and
Co3Mo3N catalysts", Catal. Sci. Technol., vol. 6, no. 5, pp. 1496-1506, 2016.
68. X. Duan, J. Ji, X. Yan, G. Qian, D. Chen and X. Zhou, "ChemInform Abstract:
Understanding Co-Mo Catalyzed Ammonia Decomposition: Influence of Calcination
Atmosphere and Identification of Active Phase.", ChemInform, vol. 47, no. 19, 2016.
69. "SiliaCat - Catalysis Definitions and Calculation | SiliaCat - Heterogeneous Catalysts |
Products", Silicycle.com, 2017. [Online]. Available: http://www.silicycle.com/
products/siliacat-heterogeneous-catalysts/siliacat-catalysis-definitions-and-
calculation. [Accessed: 24- Jun- 2017].

47
Chapter 3
Experimental Methodology
The modelling techniques and methods applied in this project are described in
detail throughout this chapter. The techniques used are for various aspects of the project
such as catalyst surface characterisation, transient state calculations, catalyst optimisation
and mechanism modelling for the ammonia decomposition reaction. The techniques were
applied to various software programs allowing the modelling and data collection to occur
for the different aspects of the investigation.
3.1 Software Methodology
The primary software programs used in this project were Materials studio v6.0.0
and VESTA 3.4.0 (Visualisation for Electronic Structural Analysis). The software packages
were used to manipulate an original bulk file of the catalyst for calculations to be
performed using the Raijin Supercomputer. The files were then observed before and after
the calculation requests were received by the supercomputer to determine any differences
in the original file and the calculated file.
3.1.1 Raijin Supercomputer
Installed in 2012, through funding from the Australian government, the Raijin
Supercomputer’s primary application is for processing data for earth and atmospheric
sciences. It also utilised for multiple other areas of science such as astrophysics and
chemistry[1]. The Raijin Supercomputer was used in the project to perform calculations
concerning catalyst surface optimisation, transient state calculations, reaction mechanism
energies and catalyst energy values. The super computer received files from the Materials
Studio software with pending calculations which were solved and sent back to a shared
drive.

48
3.1.2 Materials Studio v6.0.0
The Materials Studio software by BIOVIA is a simulation and materials modelling
program compatible with CIF files. The software has application in advanced research of
materials such as catalysts which was the primary application for materials studio in this
project[2][3]. Materials studio was used in this project to manipulate the original catalyst bulk
file and request calculations to be conducted on the various sample files created. The
calculation request files was delivered to the Raijin Supercomputer, with the completed
files being reconstructed back on Materials Studio, where they are viewed for alterations
done by the optimisation process.
3.1.3 VESTA 3.4.0
Visualisation for Electronic Structural Analysis, more commonly known as VESTA is
a 3D visualisation program being used the analysis of the catalyst surfaces in this
project[4]. The VESTA software provided high-quality graphic images of the catalyst
molecules for observation and allow the data files to be exported into various formats
comparable with the other programs used in the project.
3.2 Catalyst Surface Optimisation
This first component of this project was surface optimisation of the Co3Mo3N bulk
file. This section of research was concerned with the determination of the optimum catalyst
surface by comparing energies received from optimisation calculations by the Raijin Super
computer. The optimisation of the catalyst in the ammonia decomposition reaction has
been broken down into critical steps which are found in the subsequent sections of this
section.
3.2.1 Catalyst Preparation
The catalyst bulk structure chosen for the project was the first significant step in
order to expand on the information from the original physical experiment by [5]. The

49
catalyst samples used in the original experiment were variations of the CoMoN catalyst; to
expand on this, the decision was made to use a Co3Mo3N bulk structure for this
investigation. The bulk structure file was selected from [6], with the file being in CIF format,
where it could be later transferred to the Materials Studio v6.0.0 software to have the
surface cleaved. The CIF file which the original bulk structure was received in a standard
text file containing the crystallographic information, where modelling software programs
such as Materials Studio are compatible with it[7]. The CIF file for the catalyst bulk structure
was opened in Materials Studio where the catalyst was displayed as an empty cell as seen
in Figure 3.1. The figure displays the catalyst with not atoms, only the lattice outline.
(Dark Blue: Nitrogen, Aqua: Molybdenum, Red: Cobalt)
Figure 3.1: Co3Mo3N Bulk model development; initial CIF file from [6], to ball and stick
bond display after bond contraction.
For characterisation, the catalyst’s bonds were generated by utilising Material Studio's
bond generation function where information from the CIF file is used to create the bonds
for the catalyst. After creating the bonds, the image format of the bonds is changed to the
“ball and stick” setting with the resulting model displayed in Figure 3.1. The size of the ball
radius of the atoms was set to 0.4, and the sticks were set to 0.1 in the display style editor,
these settings were uniform across all the models in Materials Studio for this project.
3.2.2 Catalyst Surface Preparation
With the catalyst bulk file prepared, the final step to the characterisation of the
catalyst was to cleave the sample in systematic variations of the surface, to determine the
optimum surface. This surface was determined by using the inbuilt cleave function in

50
materials studio, where for this project the cleavage lines for the bulk structure were
chosen to be (1 0 0), (1 1 0) and (1 1 1) generating three iterations to be optimised. The
three cleaved surfaces were then modelled into two different vacuum arrangements as
depicted in Figure 3.2 below.
Vacuum 1
Vacuum 2
20Å
Figure 3.2: Cleaved (1 0 0) Surface In Vacuum 1 & 2
The first vacuum was characterised as a 1 sample and had the catalyst slab arranged in
the middle of a 20 Angstrom (Å) vacuum. The second vacuum arrangement was 10
Angstrom (Å) with the catalyst slab beginning at the edge of the vacuum and was
characterised as the 2 sample. Please refer to Appendix B for the remaining figures for
the cleaved surfaces (1 1 0) and (1 1 1). Once inside the vacuum, the thickness of the
catalyst structure was altered by adjusting the number of atoms. Adjusting the thickness
manipulated the structures making them more symmetrical. Symmetry was achieved by
increasing the thickness, so the same number of atoms of each element were present on
the surface. The thickness of the catalyst slab was restricted to be less than 15 Angstrom
(Å) to ensure the supercomputer could perform calculations promptly. The files were then
10Å

51
converted to a VASP format to allow the files to be transferred to the VESTA 3.4.0
software.
The VESTA software allowed the structures to be observed in high detail and provided
information on the physical characteristics of the different surface iterations such as bond
length. A total of four bond length points were recorded for later comparison between
original and optimised surfaces. For the bond length measurement, two atoms bonded
together were selected in the program where selected, and the length of the bond was
generated by the VESTA software as seen in Figure 3.3 below. The final formatting step of
the file was then converted it into a POSCAR format, allowing the surface to be optimised
using the Raijin Supercomputer.
Bond 4
Bond 1
Bond 2
Bond 3
Figure 3.3: Bond Length Measurement of Co3Mo3N Bulk Specimen Example
3.2.3 Surface Optimisation
The files containing cleaved surfaces in the 1 and 2 vacuums were transferred from
the VESTA software back to the Materials Studio program where they were uploaded onto
a shared drive which is accessible to the Raijin Supercomputer. The surfaces had the
geometry optimisation calculation initiated with the DMol3 calculation parameters were

52
mostly unchanged. Two alterations were made, the first was the smearing value and the
second the Max SCF Cycles. The Max SCF Cycles was increased to 100, and the
smearing was decreased to 0.05. The calculation parameters were kept constant for each
calculation. Once the optimisation calculation was initiated and saved, the file was
uploaded to the supercomputer along with four other files which were provided by
Mohammednoor Altarawneh to assist with the calculations. These files were named
INCAR, KPOINTS, P and POTCAR and were collectively known as the command files,
which are not altered during this project. The command files perform the calculations at the
supercomputer and were kept constant for each surface optimisation calculation. The
folder containing the five files was then sent to the super computer for processing.
When the supercomputer completed the calculations, multiple files were added back to the
original specimen folder. The OUTCAR and CONTCAR files where then extracted from the
folder for analysis. The OUTCAR file contained the energy information of the system. The
CONTCAR file contained the number of atoms of each element in the optimised file. The
desired data from the files was recorded for analysis. The process of initiating the
optimisation calculation and adding the file to the control files in a folder was repeated for
each cleaved surface, known as a specimen. The OUTCAR and CONTCAR files were
extracted for each specimen with the energy and element count data collected.
3.2.4 Catalyst Surface Area Energy
The information from the surface optimisation calculations was also applied to
determine the catalyst surface area energies. Bulk files for nitrogen, cobalt and
molybdenum were collected from the crystallography database to compare their unit
energies against the manipulated bulk Co3Mo3N catalyst specimens individual atom
energies. This was achieved by extracting the overall energy from the OUTCAR file of
each specimens individual elements i.e. cobalt, molybdenum and nitrogen. The bulk files
of the elements which made of the Co3Mo3N catalyst also had energy calculations
conducted by performing the same geometry optimisation calculation used in the surface
optimisation component in Chapter 3.2 of this report. The sum bulk elements energies
were compared to the energies of the same number of specimen atoms by subtracting the
bulk energy value to find the difference.

53
3.3 Mechanism Optimisation
Is the second major research area of this project is investigating the catalyst - molecule
location optimisation between Co3Mo3N and the ammonia molecule. From the literature
review in chapter 2 of this report, the 12 mechanism steps supported by [8] were able to
be modelled in this component of the project. Seven distinct mechanism steps where
identified after the removal of the non-critical steps. The seven mechanism steps are as
follows;
NH3 + ∗ → NH3* (1)
NH3* + ∗ → NH2 + H* (2)
NH2 + ∗ → NH* + H* (3)
NH* + ∗ → N* + H* (4)
N* + ∗ → H* (5)
N* + N* → N2 + ∗ (6)
H* + H* → H2 + ∗ (7)
(∗ Represents an adsorbed surface species.)
The first four steps in this project were the adsorption steps of the ammonia atom onto the
surface of the catalyst. The final three steps of the reaction were the desorption of the
hydrogen and nitrogen atoms forming H2 and N2 molecules. For this modelling to occur,
the original bulk file of the Co3Mo3N catalyst was chosen, and the first mechanism step
was replicated by locating an NH3 atom within bonding distance to the Co3Mo3N catalyst in
the Materials Studio software. Different bonding zones were trialled by locating the NH3
molecule at different areas above the catalyst surface; this was to increase the data points
collected for comparison.
The mechanism model then had the optimisation calculation initiated, with the same
parameters used in the surface optimisation calculations in section 3.2.3. The model file
was then uploaded onto the shared drive in a folder with the command files where it was
then sent to the supercomputer for the calculation to be completed. This process of placing
the molecule above the catalyst surface to replicate the reaction step was repeated for the
six remaining mechanism steps. Different locations were trialled for each mechanism step

54
to increase the scope of the research. Figures 3.4 & 3.5 display an example of the seven
mechanism steps on materials studio which were sent to the supercomputer. The figure
shows the decomposition of the ammonia molecule and the adsorption of the H2 and N2
molecules. All the remaining unoptimised mechanism steps with different molecule
locations pre-calculation figures can be found in chapter five.
Mechanism 1 Mechanism 2
(Dark Blue: Nitrogen, Aqua: Molybdenum, Red: Cobalt)
Mechanism 3 Mechanism 4
Figure 3.4: Ammonia Adsorption Mechanism Step models Pre-Optimisation

55
Mechanism 5 Mechanism 6 Mechanism 7
Figure 3.5: Ammonia Desorption Mechanism Step models Pre-Optimisation
The completed files from the supercomputer were received back in the original folder on
the shared drive. The POTCAR file was examined for the energy value of the calculation,
the energies of each mechanism step trial were tabulated for comparison. The POSCAR
file was opened in the Materials Studio software to observe if the optimised file displayed a
successful bond between the molecule and the catalyst, where the molecule above the
surface was determined by the mechanism being modelled. Figures 3.6 & 3.7 display an
example of the seven mechanism steps with a successful bond/optimisation calculation, all
the completed mechanism calculation figures can be found in chapter five.
Mechanism 1 Mechanism 2

56
Mechanism 3 Mechanism 4
Figure 3.6: Ammonia Adsorption Mechanism Step models Post-Optimisation
Mechanism 5 Mechanism 6 Mechanism 7
Figure 3.7: Ammonia Desorption Mechanism Step models Post-Optimisation
When the POSCAR file is opened in the Materials studio after being processed by the
supercomputer, the optimisation is completed by using the analysis - structure function to
update the optimised structure to what the supercomputer calculated the optimum
structure to be. Once the structure has been updated, the bonds need to be recreated by
selecting the generate bond function, similarly to section 3.2.1. The surface is then
observed with any distinct characteristics or abnormalities being recorded.

57
3.4 Transient State
The transient state calculations are the final component of this project’s
experimental method. The transient state calculations develop on the mechanism
optimisation work conducted in the previous section. The optimised mechanism specimens
from section 3.3 are utilised in this section to by pairing up subsequent mechanisms in the
following steps:
Table 3.1: Transient State Mechanism Steps
Transient State 1 Mechanism 1 & Mechanism 2
Transient State 2 Mechanism 2 & Mechanism 3
Transient State 3 Mechanism 3 & Mechanism 4
Transient State 4 Mechanism 4 & Mechanism 5
Transient State 5 Mechanism 5 & Mechanism 6
Transient State 6 Mechanism 6 & Mechanism 7
Referring to Table 3.1, six transient states have been identified from this project. In
Materials Studio six folders are created where the two optimised mechanism files are
copied into them. The reaction editor is then opened in Materials Studio, where the earlier
reaction mechanism is selected as the reactant, and the following mechanism is denoted
as the product. The atoms of each element are matched between the two mechanisms;
the file is then saved, producing one reaction file. The Transient State search calculation
or TS search, was then initiated on the reaction file, with the same parameters used in the
surface optimisation calculations in section 3.2.3. The TS search calculation file was then
uploaded to the supercomputer shared folder with the command files and was sent away
for processing.
When the calculations completed were sent back to the shared folder the OUTMOL file
was opened where the energy value was recorded for comparison against other iterations
of the same transient state using the different mechanism specimens. The same transient
state process was used for the other iterations of the mechanisms and was repeated to
attain the energy values.

58
3.5 References
1. P. Mahony, "Raijin supercomputer cooks up a storm", ECOS, 2013.
2. "Materials Studio Materials Modeling & Simulation Application | Dassault Systèmes
BIOVIA", Accelrys.com, 2017. [Online]. Available: http://accelrys.com/products/
collaborative-science/biovia-materials-studio/. [Accessed: 13- Nov- 2017].
3 . Materials Studio. BIOVIA, 2017.
4. ”VESTA", Jp-minerals.org, 2017. [Online]. Available: http://jp-minerals.org/vesta/en/.
[Accessed: 14- Nov- 2017].
5. T. Choudhary, C. Sivadinarayana and D. Goodman, “Catalytic ammonia
decomposition: COx-free hydrogen production for fuel cell applications” Catalysis
Letters, vol. 72, no. 34, pp. 197-201, 2001.
6. S. Jackson, R. Layland and H. zur Loye, "The simultaneous powder X-ray and neutron
diffraction refinement of two η-carbide type nitrides, Fe3Mo3N and Co3Mo3N,
prepared by ammonolysis and by plasma nitridation of oxide precursors", Journal of
Alloys and Compounds, vol. 291, no. 1-2, pp. 94-101, 1999.
7. S. Hall, F. Allen and I. Brown, "The crystallographic information file (CIF): a new
standard archive file for crystallography", Acta Crystallographica Section A
Foundations of Crystallography, vol. 47, no. 6, pp. 655-685, 1991.
8. D. Hansgen, D. Vlachos and J. Chen, "Using first principles to predict bimetallic
catalysts for the ammonia decomposition reaction", Nature Chemistry, vol. 2, no. 6,
pp. 484-489, 2010.

59
Chapter 4
Surface Optimisation
The first component of this project was the optimisation of the Co3Mo3N surface.
The rationale for the optimisation calculations was to find the most stable catalyst surface
to support the ammonia decomposition reaction. The specimens have been characterised
by their cleavage and vacuum iterations, for example, a specimen with the name 100
describes that its surface has been cleaved along the (1 0 0) plane of the catalyst. The 1
or 2 at the end of the specimen title represents the type of vacuum the surface has been
applied to. Specimens with ‘a’ or ‘b’ as an extension to their title denote that the same
catalyst cleavage has been used, but a different thickness has been employed to make to
catalyst more symmetrical.
A fundamental assumption applied to this component of the project is that the final energy
is independent of the parameters entered into the software. This directly relates to the
thickness and the symmetry of the catalyst which were assumed to have no impact on the
results. The thickness and symmetry of each catalyst tested were assumed to be equal
and have not been recorded in this project. The surface optimisation calculations had vital
importance to the project, as the most stable surface derived from this work was then used
moving forward in the mechanism calculations and transient state development.
4.1 Surface Optimisation Data
The energy of optimised specimens was used to determine the stability of the
catalyst surfaces sent to the supercomputer. A total of seven surfaces were cleaved and
optimised with the bulk structure being optimised for comparison. The energy results from
the optimised surfaces and energy of the constituents have been summarised in Table 4.1,
which includes calculations for the surface area from tables 4.2 and 4.3 found in Appendix
B. The table also includes the difference by surface area results for the optimised surfaces.
The optimised energy values of the specimens show the 110_2 and the 111_2 specimen to

60
be the most stable and unstable of the cleaved surfaces. Additional data can be found in
Appendix B related to the surface optimisation.
Table 4.1: Surface Optimisation Energy & Calculation Results
In general, the (111) surface iterations had the most negative optimised energy values,
making them the most stable of all the surfaces optimised. The results for the difference by
surface area was calculated from the energy of constituents and the optimised energy
values. By observation, it can be seen that the (100) samples have the most negative
results of -0.9069 and -0.9089 eV/Å2. The constituent energy values were calculated using
the unit energies from the optimised individual element bulk models. The individual
elements were sent to the supercomputer for optimisation using the same technique as for
the specimens. The number of atoms, of each element in the catalyst used was
determined by the supercomputer in the optimisation calculations. Of all the surfaces
optimised, the (111) surface planes are the most negative. Full calculations for the
energies and surface area can be found in Appendix C.
Of the specimens tested, all saw an increase in stability per Ångström squared with the
(100) specimens having the most substantial stability increase, with an average of 3.77
percent excluding the bulk structure. The bulk structure saw the most significant change in
its stability. However the bulk Co3Mo3N catalyst remained the most unstable surface.
Regarding Figure 4.1, a directly proportional relationship is recognised between the
number of atoms in the catalyst and the overall stability of the catalyst. The figure contains
data from Table 4.3 in Appendix B, which summaries the calculated surface areas of the

61
specimens and the elemental atomic totals. By observation, the results display a
connection between the surface area of the catalyst and its stability.
4.1.1 Bond Length Data
The physical change of the catalyst from the optimisation process can be examined
by measuring specific bond lengths from the modelled catalyst before and after the
optimisation calculations were conducted by the supercomputer. Details of the method can
be located in Chapter 3 section 3.2.2, where Figure 3.3 displays an example of how the
bond lengths are measured. The bond length data comes from a series of specimens
being optimised by the supercomputer were the catalyst surfaces were physically altered.
The length values taken from the modelled specimens were collected from the same
locations for the four bond data points. Table 4.4 summarises the changes made to each
specimen as a result of the optimisation calculations. The bond location with the most
significant average change for all the specimens measured was location one, with an
average of 4.317 percent. The average change was calculated by taking the absolute
value all the percentage changes and then taking their sum. The full calculations for the
average change and net change for the bonds can be located in Appendix C. The
specimen to have the largest change in a bond length was the 110_2 bond four with a 9.14
percent increase from its original length to its optimised length, this shows a significant
change in the bond length as a result of optimisation.
Table 4.4 Summary of Bond Length Changes Resulting From Optimisation
Bond 1 Bond 2 (Å) Bond 3 (Å) Bond 4 (Å)
Specimen Length
Change (Å)
%
Change
Length
Change (Å)
%
Change
Length
Change (Å)
%
Change
Length
Change (Å)
%
Change
000_a -0.062 -1.472 -0.062 -1.472 0.062 1.472 0.062 1.473
100_1 -0.219 -5.409 0.219 5.406 0.219 5.403 0.219 5.406
100_2 -0.096 -2.307 0.219 5.406 0.037 0.866 0.219 5.414
110_1 -0.206 -5.068 0.201 4.952 0.205 5.061 0.146 3.555
110_2 -0.208 -5.128 0.209 5.144 0.155 3.761 0.387 9.140
111_1a -0.193 -4.730 0.193 4.738 -0.029 -0.683 0.191 4.699
111_1b -0.254 -6.348 0.060 1.425 0.256 6.382 0.059 1.413
111_2 -0.167 -4.073 0.027 0.630 0.103 2.487 -0.065 -1.498

62
A summary of the bond length calculations conducted in this project is below in Table 4.5.
The results show the most considerable average change of 5.406 percent occurred in the
110_1 specimen. This finding expected as it also had the largest bond change out of all
the specimens optimised. The average length change in the surface was 0.395Å with an
overall net change of plus 12.917Å in the bonds measured. The 111_2 specimen was the
only surface to decrease in bond size over the measurement points with an overall net
change of -2.453Å for the surface; the surface also saw the smallest overall percentage
change of 2.172 percent.
Table 4.5 Summary of Bond Change Calculations
Specimen Average Length
Change (Å)
Average % Change Net Change
000_ 0.078 1.472 0.001
100_1 0.383 5.406 10.807
100_2 0.215 3.498 9.379
110_1 0.344 4.659 8.499
110_2 0.395 5.793 12.917
111_1a 0.296 3.712 4.024
111_1b 0.348 3.892 2.873
111_2 0.216 2.172 -2.453
Figures 4.1 - 4.8 display the top and side profiles of the optimised specimens which were
received from the supercomputer and viewed in the materials studio modelling software.
The different surface cleavages expose different elements to the reaction which has the
potential to interact differently with the reaction taking place. When observing the
optimised structures, it can be seen that the layers underneath the surface are
systematically repeated and that only the top surface layers impacted by the cleavage
iteration.

63
000_ Top View 000_ Side View
(Dark Blue: Nitrogen, Aqua: Molybdenum, Red: Cobalt)
Figure 4.1: 000_ Optimised structure side and top profiles
100_1 Top View 100_1 Side View
(Dark Blue: Nitrogen, Aqua: Molybdenum, Red: Cobalt)
Figure 4.2: 100_1 Optimised structure side and top profiles
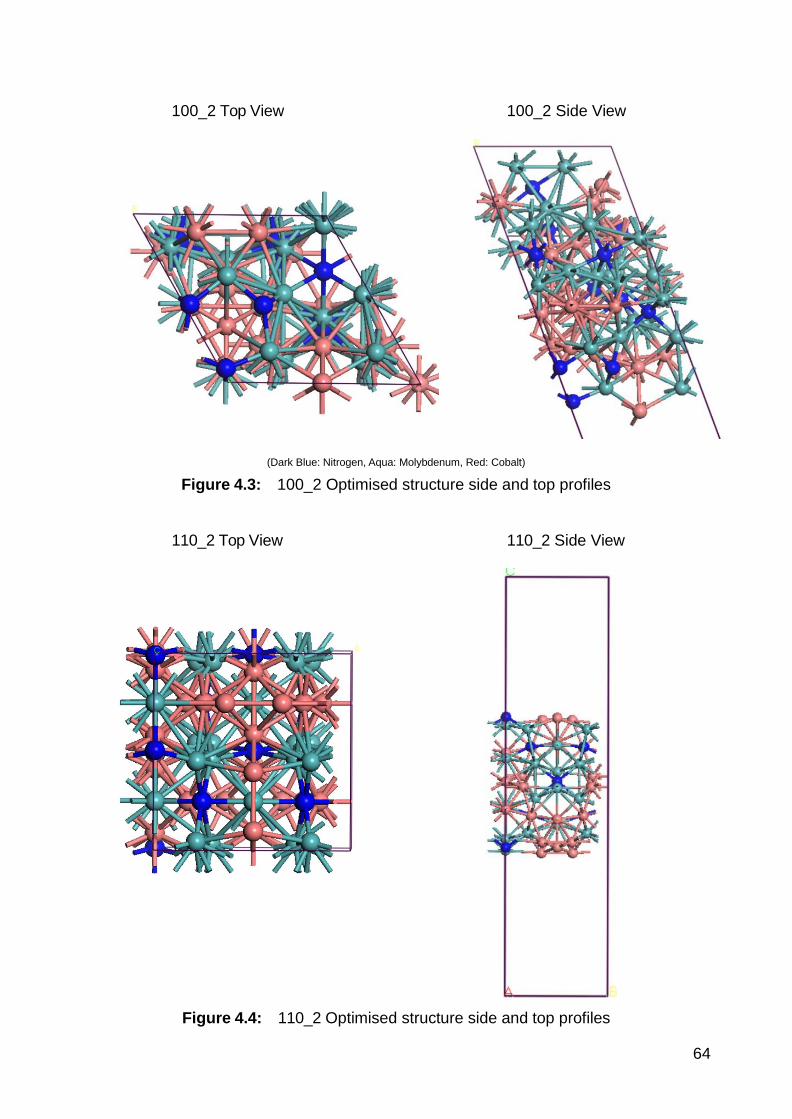
64
100_2 Top View 100_2 Side View
(Dark Blue: Nitrogen, Aqua: Molybdenum, Red: Cobalt)
Figure 4.3: 100_2 Optimised structure side and top profiles
110_2 Top View 110_2 Side View
Figure 4.4: 110_2 Optimised structure side and top profiles
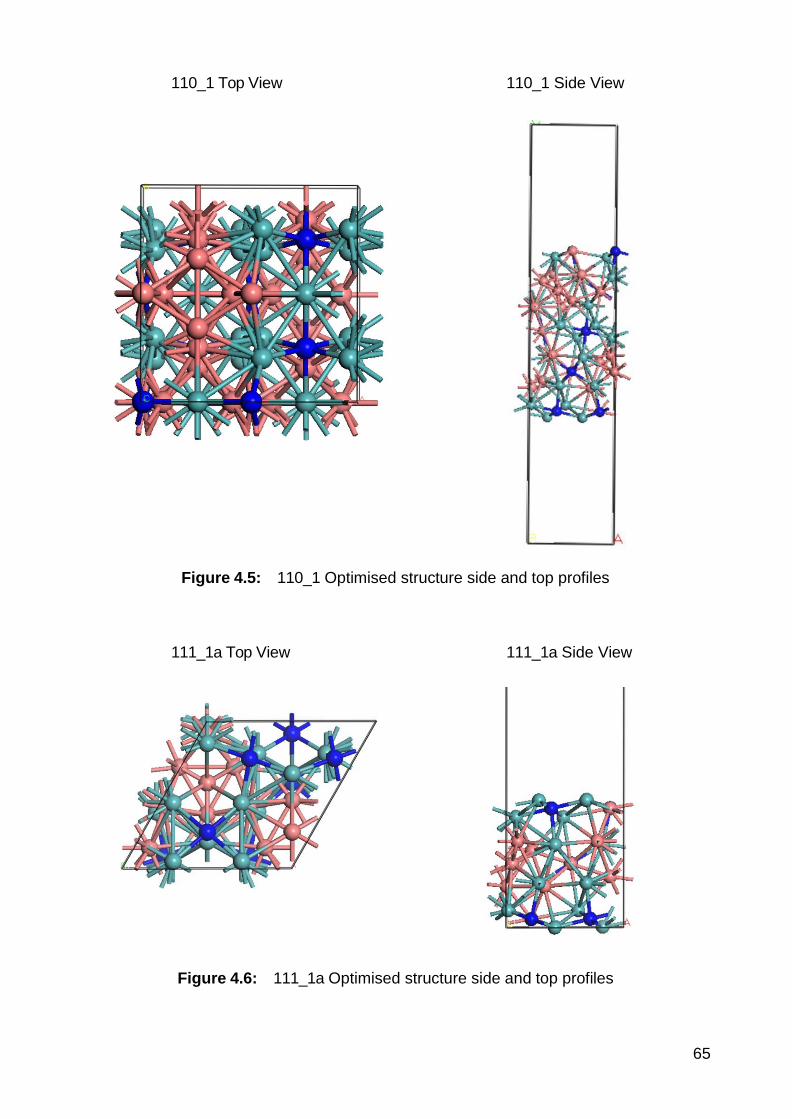
65
110_1 Top View 110_1 Side View
Figure 4.5: 110_1 Optimised structure side and top profiles
111_1a Top View 111_1a Side View
Figure 4.6: 111_1a Optimised structure side and top profiles

66
111_1b Top View 111_1b Side View
Figure 4.7: 111_1b Optimised structure side and top profiles
111_2 Top View 111_2 Side View
Figure 4.8: 111_2 Optimised structure side and top profiles

67
4.2 Interpretation of Results
The key information derived from the optimisation data was the most stable surface
being the 111_2 specimen as the specimen had the lowest optimised energy value. All the
surfaces exist as a nano-particle, which contains multiple surfaces. The most stable
surface will be more prevalent than the other surfaces planes which is desirable. This
means the most stable surface will have significantly more of one particular surface than
any other surface present. Applying this understanding to the results, the 111_2 specimens
energy value of -882.667 eV shows it to be the most stable catalyst. This result can be
explained by the (111) surfaces on the nano-particle being vastly more prevalent than the
other surfaces on there. When compared to the prevalence of the (110) surfaces on the
110_1, and 110_2 specimens, significantly less (110) surfaces would be present when
compared categorically to the 111_2 specimen.
In general, when comparing the (111) energies of both the constituent and optimised data
the surface is significantly more stable which is supported from the literature review
findings in chapter two of this report which agreed that the (111) indexed surface were
more stable on similar nitride catalysts[1]. The results of the physical changes in the bonds
are directly related to the findings from the stability data. It was discovered in the results
that the (111) surfaces experienced the smallest percentage change regarding its bond
lengths when optimised by the supercomputer. These findings are reciprocated by the
(110) specimens as the specimens displayed the highest average bond change which
shows the largest physical alterations occurred in the optimising process to the most
unstable catalyst. These results show a directly proportional relationship between the
stability of the catalyst and the changes occurring during the optimisation process.
Trends from the unit surface area energy show the more stable surface to have more
positive energy values per Angstrom squared than the less stable catalysts. This could be
a result of an increased number of atoms providing the increased stability of the catalyst.
Figure 4.9 displays a directly proportional trend between the increasing number of atoms
present in the catalyst and the increased stability. The figure contains data from Table 4.3
in Appendix B, which summaries the calculated surface areas of the specimens and the
elemental atomic totals.

68
Figure 4.9: The Relationship Of Optimised Catalyst Stability & Atomic Count Due To
Catalyst Thickness
By observation, the results display a connection between the surface area of the catalyst
and its stability. The increased number of atoms is related to the thickness of the surfaces,
which as been assumed in this project not to have an impact on the results. The data
shows the most stable optimised energy value of -882.667 eV which has the highest
number of accompanying atoms, 88. The most unstable atoms have a 25 percent
reduction in the energy value with a 30 percent reduction in the number of atoms present
in the catalyst.
The relationship between the stability of the catalyst and the number of atoms could be a
result of the increased cobalt presence. Cobalt is more prevalent in the more stable
catalysts as displayed in Figure 4.10; this supported in literature and in the original
physical experiment which these models are expanding on, as the physical experiment
concluded cobalt presence to be the driving force behind the improved catalyst stability[1]
[2]. Similarly to Figure 4.9, the cobalt presence has a directly proportional relationship to the
catalyst stability.

69
Figure 4.10: The Relationship Of Optimised Catalyst Stability & Cobalt Presence
The data in Figures 4.9 and 4.10, provide conclusive findings that these interactions
potentially could have an impact on the stability, which should be explored in further work
by determining if the stability is influenced by the thickness of the catalyst or the presence
of cobalt.
4.3 Summary
The data was assembled from the optimisation calculations completed by the
supercomputer, which found the 111_2 specimen to be the most stable comparatively with
an energy value of -882.667 eV. Optimisation process conducted on the specimens has
had a significant impact on the physical properties of the catalysts, changing the physical
structures on average by 3.83 percent. These changes can be attributed to the bond
lengths being modified as a result of the optimisation. Alterations to the physical structure
provided information on the stability of the surface which was in agreement with the
stability result. A directly proportional relationship between the stability of the surface and
the physical changes of the catalyst was determined from the data collected. A directly
proportional relationship between the catalyst thickness and the stability was identified with
70
changes in one parameter being proportional reciprocated by the other. A second
relationship similar to the first was determined between the cobalt presence and the
stability. The findings are in support to one another, with current literature supporting the
cobalt’s impacts on the stability.
The results from this components work are limited regarding breadth, as a result of the
number of surface planes selected to cleave. A broader scope of surfaces could have
provided more information of the most stable surface with different combinations of
elements being exposed to the optimisation calculations. Another limitation of the data was
to identify the driving force behind the increase in stability, with only speculative
relationships determined. Further work was highlighted to elaborate on the relationships as
the thickness of the catalyst was out of the scope of this project.
4.4 References 1. I. Oluwoye, M. Altarawneh, J. Gore, H. Bockhorn and B. Dlugogorski, "Oxidation of
Polyethylene under Corrosive NOxAtmosphere", The Journal of Physical Chemistry
C, vol. 120, no. 7, pp. 3766-3775, 2016.
2. S. Podila, S. Zaman, H. Driss, Y. Alhamed, A. Al-Zahrani and L. Petrov, "Hydrogen
production by ammonia decomposition using high surface area Mo2N and
Co3Mo3N catalysts", Catal. Sci. Technol., vol. 6, no. 5, pp. 1496-1506, 2016.
3. Materials Studio. BIOVIA, 2017.
4. “VESTA", Jp-minerals.org, 2017. [Online]. Available: http://jp-minerals.org/vesta/en/.
[Accessed: 14- Nov- 2017].

71
Chapter 5
Mechanism Optimisation
The second component of this project is mechanism optimisation. This work
investigates the different mechanisms of the ammonia decomposition reaction and
expands on the work completed in the previous surface optimisation component. The
111_2 specimen exhibited the most stability after the optimisation calculations, making it
the desired catalyst to model the mechanisms for the ammonia decomposition reaction on
moving forward into the project.
A total of 12 mechanism steps were found in the literature review component of this
report[1]. The following seven mechanisms were modelled in materials studio after
removing the reverse reactions:
NH3 (prior to adsorption) (1)
NH3* + ∗ → NH2 + H* (2)
NH2 + ∗ → NH* + H* (3)
NH* + ∗ → N* + H* (4)
N* + N* → N2 + ∗ (5)
H* + H* → H2 + ∗ (6)
N2 + H2 (desorbed) (7)
Mechanisms one and seven are the initial reactants and the final products. The initial
reactant is the ammonia above the surface of the catalyst prior to adsorption, and the final
products are the desorbed N2 and H2 molecules.
The rationale behind the modelling and optimisation the ammonia decomposition
mechanisms is to determine the most stable variations of them to provide credible
information for the transient state modelling in the next component of the model. Different
iterations of the same mechanism were optimised by changing the original location of the
ammonia atom above the catalyst surface. The atom bonding locations were manipulated
during the decomposition to increase the sample of mechanisms optimised for

72
comparison. The iterations were tested for their ability to bond, and the stability of the
mechanism after completing the optimisation calculation. It was assumed in this
component of the model that the distance the ammonia molecule was above the surface
did not change during the adsorption phase of the model. The distance above the surface
was assumed to be constant over all the different iterations optimised, and any variations
had no impact on the stabilities determined from the energy values.
5.1 Mechanism Optimisation Data
The energy of optimised mechanisms was used to determine their stability from the
results returned from the Raijin supercomputer. A total of seven mechanisms were
optimised with multiple test locations taken for comparison. The mechanisms and their
iterations optimised have been summarised in Tables 5.1 & 5.2 below; the table only
includes mechanisms which were valid and returned a stable energy value. Table 5.1
combines information on the energy values returned from the supercomputer and the
validity of the mechanisms which can be found in Appendix B in Tables 5.3, 5.4 & 5.5.
Table 5.1 Summary Of Absorption Mechanism Energy Data
Mechanism
1
Energy
(kcal/mol)
Mechanism
2
Energy
(kcal/mol)
Mechanism
3
Energy
(kcal/mol)
Mechanism
4
Energy
(kcal/mol)
M1 -143.3602 M2a -143.3602 M3a -143.3601 M4a -143.3601
M2b.2 -143.3602 M3b.2 -143.3601 M4b.2 -143.3601
M3c -143.3601 M4c -143.3601
Table 5.2 Summary Of Desorption Mechanism Energy Data
Mechanism 5 Energy
(kcal/mol)
Mechanism 6 Energy
(kcal/mol)
Mechanism 7 Energy
(kcal/mol)
M5a1b -143.4459 M6a2a -143.4458 M7a2a -143.4458
M5b2 -143.4458 M6a3a -143.4458 M7a3a -143.4458
M5b3 -143.4458
M5c2a -143.4458
M5c3c -143.4458

73
The results have above have been filtered of mechanisms which were unable to be used
in the transient state calculations due to being invalid or being unable to perform the
optimisation calculations on it. The following Figure 5.1 displays the valid optimised
mechanism for the first mechanism of the reaction.
Original M1 Model Optimised M1 Model
(Dark Blue: Nitrogen, Aqua: Molybdenum, Red: Cobalt, White: Hydrogen)
Figure 5.1: Original & Optimised Mechanism File (M1)
The second mechanism contained a variation of the surface bonding which was not
anticipated prior to the supercomputer optimisations. The two mechanism iteration were
then developed and re-run using a ‘flipped’ NH2 compound above the surface to attain the
desired result. Figures 5.2 & 5.3 display the original M2a, M2b.2 and the optimised M2a,
M2b.2 figures where the variations between the surfaces can be distinguished by the
locations of NH2 molecule and which was done as a result of the optimised file returning
which an unexpected surface bonding result. The M2b.2 image displayed in Figure 5.3 is a
variation of the M2b.1 mechanism which failed.

74
Original M2a Model Optimised M2a Model
Figure 5.2: Original & Optimised Mechanism File (M2a)
Original M2b.2 Model Optimised M2b.2 Model
Figure 5.3: Original & Optimised Mechanism File (M2b.2)

75
Mechanism three contains a, b & c iterations as a result of three different possible bonding
locations for the remaining NH2 compound, which can occur at the cobalt site (M3a) or
(M3c). The final iteration can occur at the molybdenum site (M3b.2) which has been
displayed on Figures 5.4 - 5.6. The M3b.2 was edited from the original M3b iteration as the
mechanism failed.
Original M3a Model Optimised M3a Model
Figure 5.4: Original & Optimised Mechanism File (M3a)
Original M3b.2 Model Optimised M3b.2 Model
Figure 5.5: Original & Optimised Mechanism File (M3b.2)

76
Original M3c Model Optimised M3c Model
Figure 5.6: Original & Optimised Mechanism file (M3c)
Mechanism four has three different variations as it is physically possible for the H+ atom to
be bonded to three different sites. The following iterations of the fourth mechanism are
illustrated in figures 5.7 - 5.9. When the NH2 is above the cobalt two different hydrogen
bonding locations are observed (M4a) and (M4c). Whereas for the NH2 iteration above the
molybdenum site the distance is too great for the H+ atom to travel beyond the empty site
which M3b displays.
Original M4a Model Optimised M4a Model
Figure 5.7: Original & Optimised Mechanism file (M4a)

77
Original M4b.2 Model Optimised M4b.2 Model
Figure 5.8: Original & Optimised Mechanism file (M4b.2)
Original M4c Model Optimised M4c Model
Figure 5.9: Original & Optimised Mechanism file (M4c)

78
The fifth mechanism has one of the hydrogen removed as it is spectating the desorption
reaction taking place. The Hydrogen atom removed from the NH compound physically
cannot travel the distance to bond and therefore removed the spectator Hydrogen. A
nitrogen atom is added to the model to allow for the nitrogen atoms to bond together and
leave at the catalyst surface. The nitrogen atom added to the surface was arranged above
different cobalt and molybdenum surface bonding sites hence the addition a, b & c
iterations of the mechanism.
The M5a1c iteration does not exist as it is physically impossible for the hydrogen atoms to
bond over such a long distance, hence why only M5a1a & M5a2b were constructed. As
there are three hydrogen atoms are present, one will be a spectator to the formation of
hydrogen gas. In this instance, there is a clear decision to which hydrogen atom was the
spectator. This was a similar case for M5a2 and its iterations. Only two iterations were
created as there was a definite spectating hydrogen atom on the surface of the catalyst.
The definite spectating hydrogen The optimised models in figures 5.7 - 5.9 displays the
determined spectating hydrogen atom to be removed for the fifth mechanism. With the
alterations made to the previous fourth mechanism models, the following models were
used for the fifth mechanism.
Original M5a1b Model Optimised M5a1b Model
Figure 5.10: Original & Optimised Mechanism file (M5a1b)

79
Original M5b2 Model Optimised M5b2 Model
Figure 5.11: Original & Optimised Mechanism file (M5b2)
Original M5b3 Model Optimised M5b3 Model
Figure 5.12: Original & Optimised Mechanism file (M5b3)

Figure 5.14: Original & Optimised Mechanism file (M5c3c)
80
Original M5c2a Model Optimised M5c2a Model
Figure 5.13: Original & Optimised Mechanism file (M5c2a)
Original M5c3c Model Optimised M5c3c Model

Figure 5.16: Original & Optimised Mechanism file (M6a3a)
81
The sixth mechanisms only yielded two valid optimised models as a result of most of the
iterations stemming from the previous mechanism five being of an invalid trajectory. The
sixth mechanism model displays the desorption of the nitrogen atoms forming N2 in figures
5.15 & 5.16 Similarly for the seventh and final mechanisms modelled; only two models
were produced following on from the previous models. The seventh models in Figures 5.17
& 5.18 display the two hydrogen atoms deserting from the catalyst surface, forming H2.
Original M6a2a Model Optimised M6a2a Model
Figure 5.15: Original & Optimised Mechanism file (M6a2a)
Original M6a3a Model Optimised M6a3a Model

Figure 5.18: Original & Optimised Mechanism file (M7a3a)
82
Original M7a2a Model Optimised M7a2a Model
Figure 5.17: Original & Optimised Mechanism file (M7a2a)
Original M7a3a Model Optimised M7a3a Model

83
5.2 Interpretation Of Results
Successful optimisation calculations were completed on 18 of the 54 models sent to
the supercomputer. The majority of the models provided stability data from the optimisation
calculations, however, could not be applied further in this project as the trajectories were
not valid for the transient state calculations in the next chapter. The data summarised in
Table 5.1 shows little variation between the stabilities of the mechanisms and their
intermediates. Of the adsorption steps, the average energy for the optimised mechanisms
was -143.3601 kcal/mol. The desorption mechanisms were slightly more stable than the
adsorption steps with an average optimised energy value of -143.4458 kcal/mol.
During the optimisation of the mechanisms, limited alterations were recognised between
the surfaces of the optimised and original specimens. This is related to the previous
optimisation completed on the surfaces before the mechanisms were added. The slight
changes noticed on the surface of the adsorption surfaces is a result of the new bonds
being formed by the decomposing ammonia molecule. The changes on the desorption
surfaces of the catalyst can be attributed to the hydrogen and nitrogen molecules being
formed. The high amount of unsuccessful mechanisms model can be attributed to the
initial locations of the atoms replicating the mechanisms being incorrectly placed above the
surface. Multiple locations were tested to increase the number of successful mechanisms
optimised due to the uncertain nature of this component of the model.
The figures of the original and optimised mechanisms show in the final desorption step of
the nitrogen molecule; it remains bonded to the surface instead of completely dissociating
from the surface. This can be for two possible reasons, the first being the model prevents
the nitrogen existing as a free molecule above the surface of the catalyst. The second
explanation is the model is showing the nitrogen to have an affinity for the surface of the
catalyst and will not dissociate without added stimulation. This would result in the catalyst
being covered in nitrogen atoms during the decomposition reaction and result in the
catalytic effect being suppressed in a physical experiment.

84
5.3 Summary
The work completed in this component of the model was targeted at developing
models for each of the mechanisms discovered in the literature. The models of the
mechanisms were then optimised using the Raijin supercomputer and reconstructed in the
materials studio software. Each mechanism model shows a successful step being
adsorption or desorption, in the ammonia decomposition process. Multiple iterations of the
same mechanisms were tested to provide sufficient breadth for the transient state
calculations in the next chapter. A total of 18 optimised models were developed, with the
results finding the desorption mechanisms were slightly more stable than the adsorption
component of the decomposition reaction. The only calculations conducted in this
component of the work was done by the supercomputer, which determined the stabilities of
the individual mechanisms.
The models developed in this component of the project have limiting factors such as a vast
majority of the stable mechanisms that were modelled and optimised could not be
reconstructed in the materials studio software. This restricted the availability of models to
be used for comparison purposes and decreased the overall sample size. Future work on
this information collected in this component of the project could be expanding on the areas
of which the atoms bond to the surface of the catalyst. Finally, areas such as the influence
of other species present on the behaviour of the system could also be explored further.
5.4 References
1. D. Hansgen, D. Vlachos and J. Chen, "Using first principles to predict bimetallic
catalysts for the ammonia decomposition reaction", Nature Chemistry, vol. 2, no. 6,
pp. 484-489, 2010.

85
Chapter 6
Transient State
The final component of this project was the transient state development, which
builds on the results collected from chapters four and five. The previous chapter developed
optimised models from seven mechanisms found in literature. From the seven
mechanisms, 18 different models were developed and successfully optimised to develop
the transient states on in this chapter. As a result of multiple mechanisms being optimised,
multiple transient states were developed to increase the breadth of the data.
The transient state calculations were achieved by pairing up subsequent mechanisms,
identifying the common atoms and then performing calculations using the supercomputer.
Six transient states where identified for the ammonia decomposition reaction from the
optimised mechanisms. The breakdown of the transient states and their mechanisms are
detailed in Table 3.1 chapter three. The calculations completed by the supercomputer are
aimed at determining the rate limiting step of the ammonia decomposition reaction through
the activation energy results collected.
The rational behind calculating the activation energies and the overall rate limiting step is
the main modelling aim of this project, which is to determine the kinetics of the ammonia
decomposition reaction on the surface of the Co3Mo3N catalyst. The work completed
developing the transient states had a fundamental assumption applied, which was that the
energies calculated were independent of the parameters entered into the software for the
mechanisms. This had a carry on effect that the transient states were not impacted by the
physical parameters of the mechanisms such as size. It was also assumed that if a
calculation was unsuccessful or the mechanisms could not be matched in the atomic
matching that the transient state for that iteration did not exist.

86
6.1 Transient State Data
The paired transient state files containing two optimised mechanism models
(reactant & product) produced results for the activation energies and the reaction energies.
From the successful transient states developed, the results returned were average over
each transient state. The transient states were developed to determine the rate-limiting
step for the ammonia decomposition reaction. The results found average highest activation
energy to be for transient state six with a value of 96.056 kcal/mol, which contained
mechanisms six and seven as the reactant and product. The highest average reaction
energy was observed in both the second and third transient states with energies of 20.523
and 20.527 kcal/mol respectively.
The transient state data for the adsorption and desorption steps are tabulated in Appendix
B. The activation energies could not be found by the supercomputer in each iteration when
the transient was being determined. The reaction energies could be found for each of the
iteration for the adsorption step with the averages summarised in Table 6.1. The average
result for the activation energies for the successful calculations have been summarised.
The average values were derived from the raw information from the supercomputer
calculations in Table 6.3 and 6.4 for the energies from the adsorption and desorption
components for the decomposition reaction.
The results from Table 6.1 show transient state four not have a transient state. During the
modelling phase for the transient states, there was an atomic imbalance, where the
number of atoms did not match. This issue resulted in the transient state not being found
for any of the iterations. Table 6.2 contains the optimum transient state results which
contain the best performing transient state iterations for each mechanism step. Transient
state three exhibited the lowest activation energy, whereas the best performing transient
state for the final mechanisms step was still contained the rate-limiting step for the
reaction. The results have been filtered to determine the optimum energy path to show a
full successful model for the whole ammonia decomposition reaction which has been
displayed in Figures 6.1 - 6.7.
The data in Table 6.2 has been applied to the following figures which display the optimum
activation energy results from the successful transient state calculations completed at the

87
supercomputer. The figures show the two mechanisms or product and reactant for each
transient state and a transition image of the transient stage between the mechanisms.
Table 6.1: Transient State Mechanism Steps Average Energies
State Iteration
Mechanism Step Average Activation
Energy (kcal/mol)
Average Reaction
Energy (kcal/mol)
Transient State 1
Mechanism 1 & Mechanism 2
67.645
0.848
Transient State 2
Mechanism 2 & Mechanism 3
63.073
20.523
Transient State 3
Mechanism 3 & Mechanism 4
24.430
20.527
Transient State 4
Mechanism 4 & Mechanism 5 No Transient State
Found
No Transient State
Found
Transient State 5
Mechanism 5 & Mechanism 6
63.543
3.680
Transient State 6
Mechanism 6 & Mechanism 7
96.056
7.537
Table 6.2: Filtered Transient State Mechanism Steps Average Energies
State Iteration
Mechanism Step Average Activation
Energy (kcal/mol)
Average Reaction
Energy (kcal/mol)
Transient State 1
Mechanism 1 & Mechanism 2
63.945
0.843
Transient State 2
Mechanism 2 & Mechanism 3
63.703
7.335
Transient State 3
Mechanism 3 & Mechanism 4
23.071
23.085
Transient State 4
Mechanism 4 & Mechanism 5 No Transient State
Found
No Transient State
Found
Transient State 5
Mechanism 5 & Mechanism 6
42.082
5.929
Transient State 6
Mechanism 6 & Mechanism 7
76.614
3.996

88
(Dark Blue: Nitrogen, Aqua: Molybdenum, Red: Cobalt, White: Hydrogen)
Figure 6.1: Transient State One Model
Figure 6.1 shows the first mechanism step of the ammonia decomposition reaction. The
ammonia molecule can be observed losing one of its hydrogen atoms, as it is being
adsorbed onto the catalyst surface at the beginning the ammonia decomposition reaction.
The optimum activation energy for this mechanism step was 63.945 kcal/mol. It can be
seen from the transient model that the hydrogen bonds to the surface on the nitrogen site
and there remaining NH2 molecule bonds the cobalt & molybdenum site instead of the
molybdenum site where it initially bonds too.
Figure 6.2 illustrates the NH2 bonded to the cobalt site have a hydrogen atom adsorbed
onto another nitrogen site and then become bonded to the open molybdenum and cobalt
site as NH. The optimum activation energy of the reaction calculated from the
supercomputer is 63.073 kcal/mol, which is almost equal to transient state one.
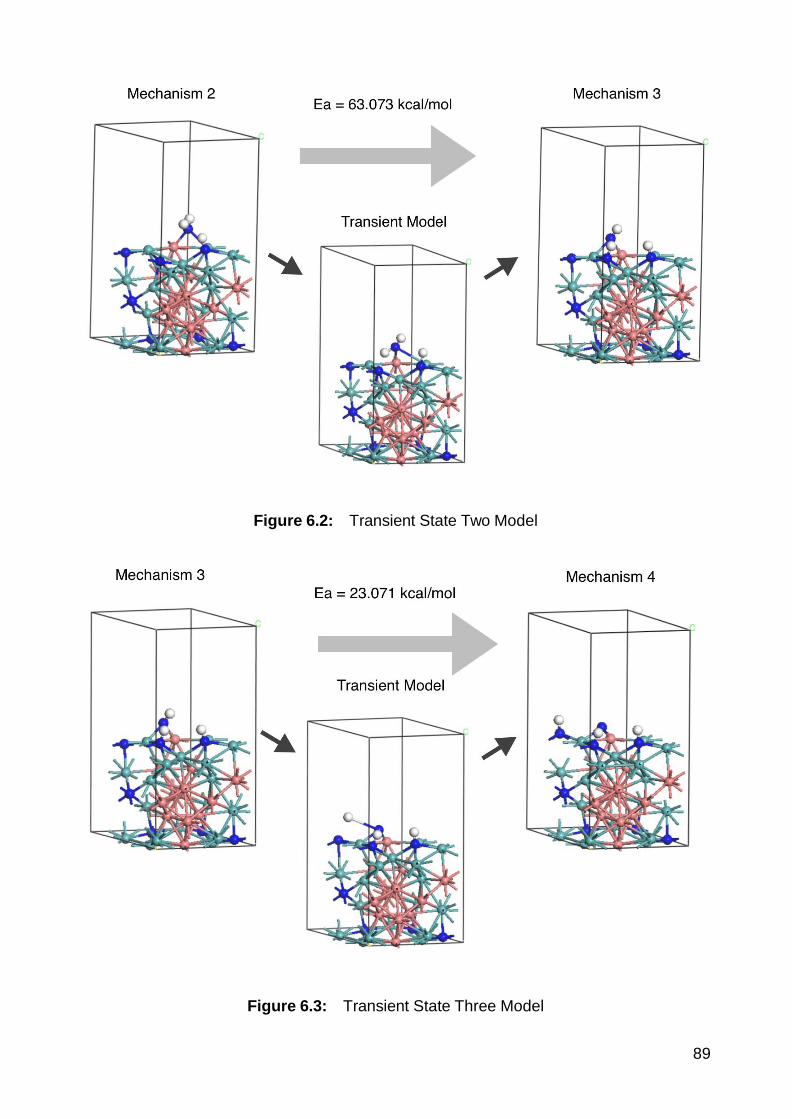
89
Figure 6.2: Transient State Two Model
Figure 6.3: Transient State Three Model

90
Figure 6.3 shows the final hydrogen being bonded to the surface of the catalyst on the final
nitrogen site available. The lone nitrogen atom remained bonded to the cobalt and
molybdenum site. The activation energy for the mechanism was 23.071 kcal/mol which is
significantly lower than the previous transient states and was the lowest of all the transient
states calculated.
The transient state five model displayed in Figure four shows the initial desorption step of
the ammonia decomposition reaction. One of the spectating hydrogen atoms was removed
from the surface, leaving two hydrogen and nitrogen atoms bonded to the surface of the
catalyst. The nitrogen can be seen successfully bonding together above the surface of the
catalyst. The hydrogen bond can also be seen breaking, to from H2 in the next mechanism
step. The optimum activation calculated by the supercomputer was 42.082 kcal/mol.
Figure 6.4: Transient State Five Model
The transient state six model displayed in Figure 6.5 shows the final desorption step of the
ammonia decomposition reaction. The activation energy of the reaction is the highest of all
the transient states calculated with a value of 76.614 kcal/mol. The final desorption step

91
displays the hydrogen atoms bond above the surface of the catalyst, and the previously
bonded N2 molecule attaching to the surface of the catalyst again.
Figure 6.5: Transient State Six Model
6.2 Interpretation of Results
The results collected from the calculations completed by the supercomputer, the
rate-limiting step for the ammonia decomposition reaction modelled in this project was
determined to be transient state six. This finding was based on the activation energy
information which shows the average energy of the final transient state to be the highest
with a value of 96.056 kcal/mol. Referring to the adsorption transient state models, the
hydrogen atoms which adsorb onto the surface of the catalyst always bonded to the
surface on a nitrogen site. This could be attributed to nitrogen and hydrogen having a
higher affinity to one another with the nitrogen on the surface having an open spot in its
electron shell, so it is much more readily bonded to than the other elements on the
surface. This trend should potentially be an area of exploration in future work.

92
The activation energy value is related to temperature when the value is very high the
reaction will not occur at low temperatures. It has been found that the activation energies
discovered in this model would not find the Co3Mo3N catalyst suitable for the ammonia
decomposition reaction as the values are generally much higher than 40 kcal/mol which
was the upper limit determined during the modelling of this reaction. The aim of using bi-
metallic catalysts is to be able to achieve a high level of ammonia decomposition
conversion as decreased temperatures. The result for the activation energies in this
experiment exceed the pre-determined upper limit.
Surfaces which returned a negative reaction energy result from the supercomputer were
determined not to have a transient state, or similarly, a transient state was unable to be
found due to the negative result received. As a result of this, some of the transient states
were not determined and were not included in the average values determined.
6.3 Summary
The penultimate component to the modelling in this project developed six transient
state models, which were identified for the ammonia decomposition reaction. However, the
model could only replicate five of them due to an imbalance on the surface between the
adsorption and desorption stages of the reaction. The transient state models develop the
mechanism optimisation work conducted in the previous section.
One of the main limitations of the transient data is that when the supercomputer cannot
calculate an activation energy for every specimen even if a transient state is determined
for two mechanisms. Secondly, this work is dependent on the work completed in the
previous two sections which results in the breadth of transient states being limited by this
stage of the model due to various reasons as some mechanisms do not work or are not
comparable with each other.
Calculations were conducted by the supercomputer to determine the activation energies of
each transient state. The results from the model found five of the transient states to be
possible, with the rate-limiting step for the ammonia decomposition reaction determined to
be the final mechanism step during the reaction, with an average activation energy of

93
96.056 kcal/mol. The results from the transient state calculated from the supercomputer
exceed the upper limit of the activation energies, which means the Co3Mo3N catalyst
regarding this modelling project is unsuitable when compared to literature values for the
ammonia decomposition reaction. The reaction for the mechanisms to be able to progress
would have to be a higher temperature than desirable according to the the models results.
94
Chapter 7
Conclusions & Further Work
The primary aim of this thesis project is to expand on the experimental results from
[1] conducted at the King Abdulaziz University, by accurately modelling the experiment
using modelling software packages. The model was targeted at accurately determining
the mechanisms and kinetics associated with the production of hydrogen from the
ammonia decomposition reaction using the Co3Mo3N catalyst. Three distinct research
components were developed, the first being the optimisation of the Co3Mo3N catalyst and
the second being the investigation of the ammonia decomposition reaction mechanisms
and finally developing transient state models of the mechanisms. The overriding objective
of this thesis was to develop a successful and robust model to address these research
components.
The literature report covered the hydrogen production field on a large scale and then
became more targeted towards carbide and nitride catalysis in the ammonia
decomposition reaction. The review sought explicitly after information related to catalysis
of carbides and nitrides and current research into their optimisation. The main findings
from the report detailed that there have been limited investigations into the decomposition
of ammonia on variously supported metal catalysts for hydrogen production[2]. The report
also found that there were significant gaps in theoretical studies for the ammonia
decomposition reaction[3]. The literature also showed that currently, tailor-made bimetallic
catalysts such as Co3Mo3N and transitional metal nitrides & carbides had been gaining
momentum regarding research. The literature review found the Co3Mo3N catalyst to be
suitable for the ammonia decomposition reaction.
The opening surface optimisation component of the modelling work was to manipulate and
determine the most stable surface to develop the mechanism models on. The surface
development was achieved by cleaving the original bulk surface of the Co3Mo3N catalyst
over the (100), (110) and (111) indexes and optimising them using the Raijin

95
supercomputer. The primary assumption which was applied throughout the project was;
the final energy is independent of the parameters entered into the software.
The most stable catalyst surface optimised was the (1 1 1) surface, confirming similar
physical experimental information from the literature review[4]. The optimum surface
denoted 111_2 was the overall most stable comparatively with an energy value of -882.667
eV. This result was confirmed by the bond length analysis which showed the 111_2
specimen to undergo the smallest amount of change during optimisation. The relationships
derived from the surface optimisation results show two plausible relationships with the first
being between the catalyst thickness and the stability; the second being the cobalt
presence and the stability. The findings are in support to one another. However, current
literature supports the relationship of cobalt’s impacts on the stability.
Stable mechanisms were developed for the ammonia decomposition reaction. The
mechanisms were biased over the catalyst surface where they were optimised using the
supercomputer. The results from the energy values showed that the desorption
mechanisms were slightly more stable than the adsorption steps. Different location
placements of the ammonia molecule were tested above the surface of the catalyst to
determine the most stable iteration comparatively. The most stable mechanisms where
then used in the final transient state modelling of the reaction.
The findings from the transient state modelling of the optimised mechanisms determined
the rate-limiting step of the ammonia decomposition reaction to be the final transient state,
TS6. As there were multiple mechanisms due to the various placements of the ammonia
molecule, multiple transient states were formed for each mechanism step. The activation
energies from each transient state were calculated using the supercomputer and
averaged. The final transient state was composed of mechanisms six and seven, had the
highest average activation energy of 76.614 kcal/mol. It was determined by having the
highest activation energy that the hydrogen desorption from the catalyst surface (TS6),
was the rate-limiting step of the model. This finding was contrary from the literature which
found the nitrogen desorption to be the rate-limiting step on similar nitride catalysts. The
activation energy found has seldom reliability due to the theoretical nature of the
modelling. The majority of the transient states where determined to be unsuitable for lower
temperature due to their high energies. This finding deems the Co3Mo3N catalyst from the

96
model to be unsuitable at low temperature for the ammonia decomposition reaction. From
the literature, the catalyst is required to perform at lower temperatures, which from this
model the Co3Mo3N catalyst does not display the kinetic properties it is required to do so.
7.1 Reaction Mechanism Sensitivity Investigations
The modelling of the reactions mechanisms governing ammonia decomposition were at the
centre of this project. Two areas have been identified in the project which was assumed to have no
impact on the results in this project but could be investigated further to assist in the development
more robust and accurate model in the future.
During the modelling and the optimisation calculations in the project, the relationship between the
distance of the molecule above the surface of the catalyst and successfulness of the mechanism
step was not explored. From reaction mechanism data collected in chapter five, the primary
assumption was the ammonia molecule above the catalyst surface was the same for each iteration
and the distance had no impact on the energy values collected. Observations were made during
the modelling of the mechanisms and the transient states, that the distance between the reacting
molecule and the catalyst surface had an impact on the energy values produced. Further work on
from this project could investigate the sensitivity to the distance between the mechanisms of the
ammonia decomposition reaction and the distance the molecules are from the surface of the
catalyst. The impact of the distance on the mechanisms developed in this model is unknown; this
presents many further avenues for investigation. Research into the distance relationship could
assist in providing more accurate models of the ammonia decomposition reaction.
The physical properties of the surfaces used such as the thickness, and the symmetry of the
catalysts used in the calculations was assumed to have no impact on the results. Referring the
Figure 4.9 in Chapter four, a correlation between the number of atoms in the catalyst and the
optimised energy of the catalyst was identified. The figure shows an inversely proportional trend
which suggests as the thickness increases the energy value decreases, i.e. the stability of the
catalyst increases. When constructing the catalysts, the thickness alteration was aimed at making
the catalyst as symmetrical as possible. The impact of symmetry is not known regarding the
integrity of the modelling, and the impact symmetry has on the stability of the catalyst. Future work
investigating the physical properties of the Co3Mo3N catalyst and its impact on the model would be
beneficial in addressing these gaps in this project. An expansion of the physical property
investigation could look at the relationship between the cobalt molecules and can confirm the data
trend in Figure 4.10 that the number of cobalt atoms in the catalyst impacts the stability. The further
97
work could then confirm if the energy is related to the cobalt atoms or the number of atoms as a
result of the catalyst thickness.
7.2 Expansion of Surface Models
The model for this project explored the (1 0 0), (1 1 0) and (1 1 1) indexes, for the
surface optimisation component for the mechanisms to be modelled on. In chapter four of
this report, it was deemed a limitation of the results that only three different surface planes
were investigated for the optimisation calculations. The cleaving of the surface allows
different elements of the catalyst to be exposed to the reaction, resulting in different
properties to be exhibited.
With an expansion of the surface models to be optimised, an evaluation can be made on
the (1 1 1) surface iteration. An increased number of surfaces optimised will test the
relationships identified between the stability of the catalyst and the thickness and the
cobalt presence outlined in the above further work component. It is critical however, that
more modelling work is conducted on the Co3Mo3N catalyst by expanding the surfaces
optimised. The exploration of varying properties caused by the different surfaces will
provide significant information for comparison and confirmation for the results in this work.
7.3 Development of Mo2N & W2C Catalyst Models
Carbide and nitride catalysts in the ammonia decomposition reaction recently have
gained momentum in their research. This expanded research is to replace convention
catalysts in reactor due to the advantages transitional metal nitrides and carbides present
to have[5]. When comparing the two most promising non bi-metallic catalysts in literature,
molybdenum nitride has been researched more extensively than tungsten carbide.
Similarly to platinum, W2C exhibits favourable catalytic properties such as high electrical
conductivity and strong conductive displacing attributes[6]. Mo2N has available information
in terms of modelling in literature however direct comparisons are difficult to initiate[7].
Future work investigating catalysis in the ammonia decomposition reactions should look at
building models for the Mo2N and W2C catalysts. Development of this models will provide
points of comparison between the carbide and nitride surfaces and will allow assessment
of the most suitable catalyst for the reaction.

98
One of the findings in the literature review for this project was that there is limited
theoretical studies involving ammonia as a feedstock for hydrogen[8]. To bridge the gap in
literature it is recommended future work look at replicating this project using a different
catalyst such as Mo2N and W2C. It is paramount that the same surface parameters be
used for the models with cleavage iterations used on the Mo2N and the W2C surfaces to
be over the (1 0 0), (1 1 0) and (1 1 1) lines. The surfaces should be optimised to
determine the most stable catalyst surface which can be then directly compared to the
research results in tables 4.1 and 4.4. Trends can be then derived to see if this expanded
research confirms that the (1 1 1) surface is the most stable across other nitride and
carbide catalysts.
99
7.4 References
1. S. Podila, S. Zaman, H. Driss, Y. Alhamed, A. Al-Zahrani and L. Petrov, "Hydrogen
production by ammonia decomposition using high surface area Mo2N and
Co3Mo3N catalysts", Catal. Sci. Technol., vol. 6, no. 5, pp. 1496-1506, 2016.
2. T. Choudhary, C. Sivadinarayana and D. Goodman, “Catalytic ammonia
decomposition: COx-free hydrogen production for fuel cell applications” Catalysis
Letters, vol. 72, no. 34, pp. 197-201, 2001.
3. M. Abashar, "Ultra-clean hydrogen production by ammonia decomposition", Journal of
King Saud University - Engineering Sciences, 2016.
4. I. Oluwoye, M. Altarawneh, J. Gore, H. Bockhorn and B. Dlugogorski, "Oxidation of
Polyethylene under Corrosive NOxAtmosphere", The Journal of Physical Chemistry
C, vol. 120, no. 7, pp. 3766-3775, 2016.
5. E. Furimsky, "Metal carbides and nitrides as potential catalysts for
hydroprocessing", Applied Catalysis A: General, vol. 240, no. 1-2, pp. 1-28, 2003.
6. I. Kholmanov, C. Magnuson, A. Aliev, H. Li, B. Zhang, J. Suk, L. Zhang, E. Peng,
S. Mousavi, A. Khanikaev, R. Piner, G. Shvets and R. Ruoff, "Improved Electrical
Conductivity of Graphene Films Integrated with Metal Nanowires", Nano Letters,
vol. 12, no. 11, pp. 5679-5683, 2012.
7. I. Oluwoye, M. Altarawneh, J. Gore, H. Bockhorn and B. Dlugogorski, "Oxidation of
Polyethylene under Corrosive NOxAtmosphere", The Journal of Physical Chemistry
C, vol. 120, no. 7, pp. 3766-3775, 2016.
8. R. Chein, Y. Chen, C. Chang, J. Chung, “Numerical modelling of hydrogen production
from ammonia decomposition for fuel cell applications” Int. J. Hydrogen Energy
35, 589– 597, 2010

100
Chapter 8
Appendices
Appendix A — Original Experimental Results 8.1 Experimental Figures
Figure 8.1: Catalyst activity for ammonia decomposition using MoN, 1CoMoN, 3CoMoN,
and 5CoMoN at 300-600˚C[1]
Figure 8.2: NH3 decomposition Arrhenius plots over MoN, 1CoMoN, 3CoMoN, and
5CoMoN catalysts[1].

101
8.2 Experimental Tables
Table 8.1: BET data; surface area and catalyst average size of particle crystallite
Table 8.2: Experimental Catalytic Activation Energies
Catalyst Ea (KJ/mol)
MoN 131.2
1CoMoN 99.7
3CoMoN 92.8
5CoMoN 102.6

102
Appendix B — Modelling Figures & Tables
8.3 Chapter 4
8.3.1 Original Catalyst Surfaces
Figure 8.1: Original (100) Unoptimised Co3Mo3N Surface
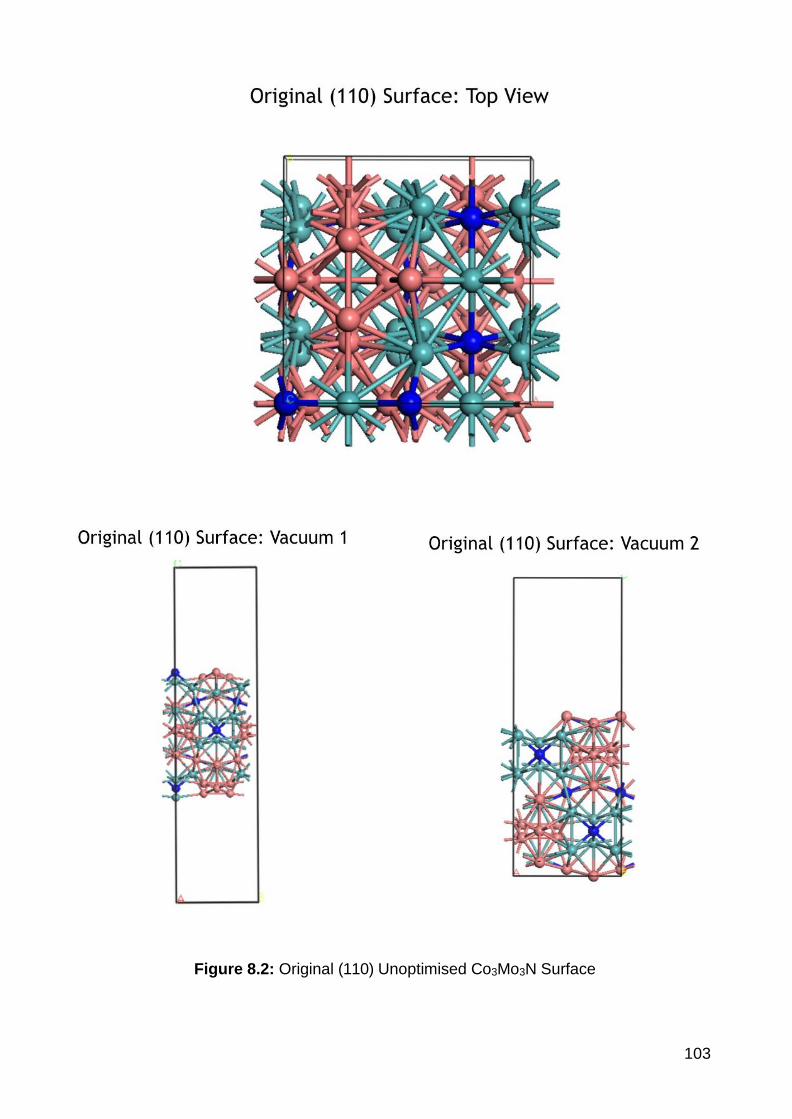
103
Figure 8.2: Original (110) Unoptimised Co3Mo3N Surface

104
Figure 8.3: Original (111) Unoptimised Co3Mo3N Surface

105
8.3.2 Modelling Tables
Table 4.2: Catalytic Energy Values By Element
Specimen Code Molybdenum Energy
(eV)
Cobalt Energy
(eV)
Nitrogen
Energy (eV)
Total Energy
(eV)
000_ -150.996 -105.201 -19.44 -275.637
100_1 -339.741 -219.169 -53.460 -612.370
100_2 -339.741 -219.169 -53.460 -612.370
110_1 -314.575 -245.469 -48.600 -608.644
110_2 -301.992 -245.469 -48.600 -596.061
111_1a -452.988 -289.303 -53.460 -795.751
111_1b -452.988 -350.670 -63.180 -866.838
111_2 -452.988 -350.670 -63.180 -866.838
Table 4.3 Physical Properties Of The Optimised Specimens
Elemental Atom Totals
Specimen
Code
Surface Area
(Å)
Cobalt Molybdenum Nitrogen Atom Totals
000_ 49.4317 12 12 4 28
100_1 52.8715 27 25 11 63
100_2 52.8715 27 25 11 63
110_1 61.0508 25 28 10 63
110_2 61.0508 24 28 10 62
111_1a 52.8715 36 33 11 80
111_1b 52.8715 36 40 13 89
111_2 52.8715 36 40 13 89

106
Table 4.6 Bond Length Raw Data
Bond 1 (Å) Bond 2 (Å) Bond 3 (Å) Bond 4 (Å)
Specimen Initial Optimised Initial Optimised Initial Optimised Initial Optimised
000_ 2.1405 2.0784 2.0784 2.1405 2.1405 2.0784 2.14054 2.0784
100_1 2.1311 1.9124 2.1311 1.9125 2.1311 1.9126 2.1310 1.9124
100_2 2.1309 2.0348 2.1311 1.9125 2.1312 2.0946 2.1311 1.9122
110_1 2.1312 1.9256 2.1311 1.9300 2.1311 1.9258 2.1311 1.9848
110_2 2.1310 1.9231 2.1309 1.9224 2.1310 1.9765 2.3100 1.9231
111_1a 2.1311 1.9386 2.1312 1.9384 2.1310 2.1603 2.1312 1.9399
111_1b 2.1311 1.8767 2.1312 2.0713 2.1310 1.8753 2.1312 2.0718
111_2 2.1311 1.9643 2.1311 2.1044 2.1308 2.0274 2.1311 2.1959

107
8.4 Chapter 5
8.4.1 Modelling Tables
Table 5.3 Adsorption Mechanisms Energy Data
Mechanism
1
Energy
(eV)
Mechanism
2
Energy
(eV)
Mechanism
3
Energy
(eV)
Mechanism
4
Energy
(eV)
M1 -143.3602 M2a -143.3602 M3a -143.3601 M4a -143.3601
M2b.1 N/A M3b.1 N/A M4b.1 N/A
M2b.2 -143.3602 M3b.2 -143.3601 M4b.2 -143.3601
M3c -143.3601 M4c -143.3601
Table 5.4 Desorption Mechanisms Energy Data
Mechanism
5
Energy (eV) Mechanism
6
Energy (eV) Mechanism
7
Energy (eV)
M5a1a -143.4459 M6a1a -143.4459 M7a3a -143.4459
M5a1b -143.4459 M6a1b -143.4459 M7a2a -143.4459
M5a2a -143.4459 M6a2a -143.4459
M5a2b N/A M6a2b N/A
M5a2c -143.4459 M6a2c -143.4459
M5a3a -143.4459 M6a3a -143.4459
M5a3b N/A M6a3b N/A
M5a3c -143.4459 M6a3c -143.4459
M5b1 -143.4458 M6b1 -143.4459
M5b2 -143.4459 M6b2 -143.4459
M5b3 -143.4459 M6b3 -143.4459
M5c1a -143.4459 M6c1a -143.4459
M5c1b N/A M6c1b N/A
M5c1c -143.4459 M6c1c -143.4459
M5c2a -143.4459 M6c2a -143.4459
M5c2b N/A M6c2b N/A
M5c2c -143.4459 M6c2c -143.4459
M5c3a -143.4459 M6c3a -143.4459
M5c3b N/A M6c3b N/A
M5c3c -143.4459 M6c3c -143.4459
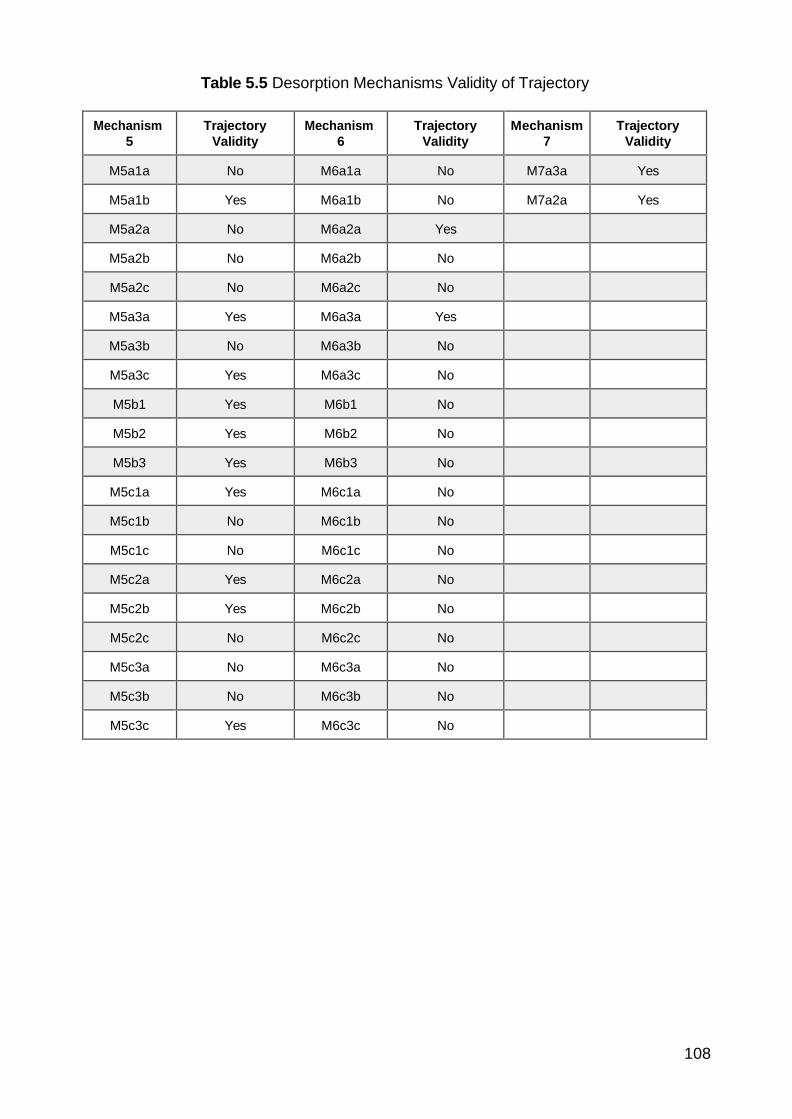
108
Table 5.5 Desorption Mechanisms Validity of Trajectory
Mechanism
5
Trajectory
Validity
Mechanism
6
Trajectory
Validity
Mechanism
7
Trajectory
Validity
M5a1a No M6a1a No M7a3a Yes
M5a1b Yes M6a1b No M7a2a Yes
M5a2a No M6a2a Yes
M5a2b No M6a2b No
M5a2c No M6a2c No
M5a3a Yes M6a3a Yes
M5a3b No M6a3b No
M5a3c Yes M6a3c No
M5b1 Yes M6b1 No
M5b2 Yes M6b2 No
M5b3 Yes M6b3 No
M5c1a Yes M6c1a No
M5c1b No M6c1b No
M5c1c No M6c1c No
M5c2a Yes M6c2a No
M5c2b Yes M6c2b No
M5c2c No M6c2c No
M5c3a No M6c3a No
M5c3b No M6c3b No
M5c3c Yes M6c3c No

109
8.5 Chapter Six
8.5.1 Modelling Tables
Table 6.3 Adsorption Transient State Energy Data
Transient State 1
Specimen Reactant
Mechanism
Product
Mechanism
Activation Energy
(kcal/mol)
Reaction Energy
(kcal/mol)
TS1.1 M1 M2a 71.345 0.852
TS1.2 M1 M2b2.2 63.945 0.843
Transient State 2
TS2.1 M2a M3a N/A 7.326
TS2.2 M2a M3b.2 N/A 36.429
TS2.3 M2a M3c N/A 17.799
TS2.4 M2b.2 M3a 63.703 7.335
TS2.5 M2b.2 M3b.2 N/A 36.438
TS2.6 M2b.2 M3c N/A 17.808
Transient State 3
TS3.1 M3a M4a 25.092 25.106
TS3.2 M3a M4b.2 23.071 23.085
TS3.3 M3a M4c 25.126 25.141
TS3.4 M3b.2 M4a N/A -3.996
TS3.5 M3b.2 M4b.2 NTS NTS
TS3.6 M3b.2 M4c N/A -3.962
TS3.7 M3c M4a N/A 14.633
TS3.8 M3c M4b.2 NTS NTS
TS3.9 M3c M4c N/A 14.668

110
Table 6.4 Desorption Transient State Energy Data
Transient State 4
Specimen Reactant
Mechanism
Product
Mechanism
Activation Energy
(kcal/mol)
Reaction Energy
(kcal/mol)
TS4.1 M4a M5a1b NTS NTS
TS4.2 M4b.2 M5b3 NTS NTS
TS4.3 M4c M5c3c NTS NTS
TS4.4 M4a M5a1b NTS NTS
TS4.5 M4b.2 M5b3 NTS NTS
TS4.6 M4c M5c3c NTS NTS
TS4.7 M4a M5a1b NTS NTS
TS4.8 M4b.2 M5b3 NTS NTS
TS4.9 M4c M5c3c NTS NTS
Transient State 5
TS5.1 M5a1b M6a2a N/A 1.360
TS5.2 M5b2 M6a2a N/A -0.903
TS5.3 M5b3 M6a2a N/A 1.409
TS5.4 M5c2a M6a2a 45.592 -0.920
TS5.5 M5c3c M6a2a 68.174 1.439
TS5.6 M5a1b M6a3a 42.082 5.929
TS5.7 M5b2 M6a3a 98.325 3.666
TS5.8 M5b3 M6a3a N/A 5.977
TS5.9 M5c2a M6a3a N/A 3.649
TS5.10 M5c3c M6a3a N/A 6.007
Transient State 6
TS6.1 M6a3a M7a3a 76.614 3.996
TS6.2 M6a3a M7a2a 134.126 6.508
TS6.3 M6a2a M7a3a N/A 8.565
TS6.4 M6a2a M7a2a 77.427 11.077

111
Appendix C - Modelling Calculations
8.6 Chapter Four
The following calculations are for the summarised data in chapter five of this report. The
supercomputer provided the atomic composition of each element in the surfaces
optimised. This data was used in conjunction with the optimised energy values calculated
by the supercomputer.
8.6.1 Energy of Constituents Calculations
Optimised Element Energies;
Molybdenum: -50.332 eV ÷ 4 atoms = -12.583 eV
Cobalt: -35.067 eV ÷ 4 atoms = -8.7667 eV
Nitrogen: -4.860 eV
Bulk Surface;
Molybdenum Energy: -12.583 eV * 12 atoms = -150.996 eV
Cobalt Energy: -8.7667 eV * 12 atoms = -105.201 eV
Nitrogen Energy: -4.860 eV * 4 atoms = -19.44 eV
Total Energy of Constituents: (-150.996) + (-105.201) + (-19.44) = -275.637 eV
100_1 Surface;
Molybdenum Energy: -12.583 eV * 27 atoms = -339.741 eV
Cobalt Energy: -8.7667 eV * 25 atoms = -219.169 eV
Nitrogen Energy: -4.860 eV * 11 atoms = -53.460 eV
Total Energy of Constituents: (-339.741) + (-219.169) + (-53.460) = -612.370 eV
100_2 Surface;

112
Molybdenum Energy: -12.583 eV * 27 atoms = -339.741 eV
Cobalt Energy: -8.7667 eV * 25 atoms = -219.169 eV
Nitrogen Energy: -4.860 eV * 11 atoms = -53.460 eV
Total Energy of Constituents: (-339.741) + (-219.169) + (-53.460) = -612.370 eV
110_1 Surface;
Molybdenum Energy: -12.583 eV * 25 atoms = -314.575 eV
Cobalt Energy: -8.7667 eV * 28 atoms = -245.469 eV
Nitrogen Energy: -4.860 eV * 10 atoms = -48.600 eV
Total Energy of Constituents: (-314.575) + (-245.469) + (-48.600) = -608.664 eV
110_2 Surface;
Molybdenum Energy: -12.583 eV * 24 atoms = -301.992 eV
Cobalt Energy: -8.7667 eV * 28 atoms = -245.469 eV
Nitrogen Energy: -4.860 eV * 10 atoms = -48.600 eV
Total Energy of Constituents: (-301.992) + (-245.469) + (-48.600) = -596.061 eV
111_1a Surface;
Molybdenum Energy: -12.583 eV * 36 atoms = -452.988 eV
Cobalt Energy: -8.7667 eV * 33 atoms = -289.303 eV
Nitrogen Energy: -4.860 eV * 11 atoms = -53.460 eV
Total Energy of Constituents: (-452.988) + (-289.303) + (-53.46) = -795.751 eV
111_1b Surface;
Molybdenum Energy: -12.583 eV * 36 atoms = -452.988 eV
Cobalt Energy: -8.7667 eV * 40 atoms = -350.670 eV
Nitrogen Energy: -4.860 eV * 13 atoms = -63.180 eV
Total Energy of Constituents: (-452.988) + (-350.670) + (-63.180) = -866.838 eV

113
111_2 Surface;
Molybdenum Energy: -12.583 eV * 36 atoms = -452.988 eV
Cobalt Energy: -8.7667 eV * 40 atoms = -350.670 eV
Nitrogen Energy: -4.860 eV * 13 atoms = -63.180 eV
Total Energy of Constituents: (-452.988) + (-350.670) + (-63.180) = -866.838 eV
8.6.2 Unit Surface Area Energy Calculations
General Equation:
(Optimised Energy (eV) - Constituent Energy (eV)) ÷ Surface Area of Specimen (Å2)
Bulk Surface;
(-303.258 - (-275.637)) ÷ 49.4317 = -0.55877 eV/Å2
100_1 Surface;
(-660.319 - (-612.37)) ÷ 52.8715 = -0.9069 eV/Å2
100_2 Surface;
(-660.425 - (-612.37)) ÷ 52.8715 = -0.9089 eV/Å2
110_1 Surface;
(-643.472 - (-608.664)) ÷ 61.0508 = -0.57048 eV/Å2
110_2 Surface;
(-629.652 - (-596.061)) ÷ 61.0508 = -0.55021 eV/Å2
110_2 Surface;
(-629.652 - (-596.061)) ÷ 61.0508 = -0.55021 eV/Å2
111_1a Surface;
(-839.212 - (-795.751)) ÷ 52.8715 = -0.82202 eV/Å2
111_1b Surface;
(-881.938 - (-866.838)) ÷ 52.8715 = -0.2856 eV/Å2
111_2 Surface;
(-882.667 - (-866.838)) ÷ 52.8715 = -0.9958 eV/Å2

114
Appendix D - Report Definitions Brunauer Emmett Teller - is an analysis technique to measure the surface area of
materials[2].
Carbon Nano Tube - is a tube shaped material made of carbon which has a diameter
measured on the nanometer scale[3].
Energy dispersive X-ray - spectroscopy within the scanning transmission electron
microscope (STEM) provides accurate elemental analysis with high spatial
resolution[4].
Reaction Rate - Is defined as how quickly a reaction occurs. i.e The speed of a reaction
for a reactant or product.
Scanning Electron Microscope - is a electron microscope which uses a technique where
surfaces are scanned with a focused beam of electrons to attain an image[5].
Scanning Transmission electron microscopy - is the same as TEM however allows for
three dimensional images to be produced[6].
Temperature Programmed desorption - is a method to observe molecules which have
been desorbed from a particular surface. This occurs when the surface is heated
allowing the analysis to occur[7].
Transient State - Is when a system (reaction) is between two mechanisms and has not
yet reached steady state.
Turn over frequency - Measures the overall level of activity of the catalyst. It is the total
number of moles transformed into the desired product by one mole of active site per
unit time[8].
Transmission electron microscopy - is a microscopy technique where an imaged is
formed via a beam of electrons being transmitted through a sample[6].
X-ray Powder Diffraction - is a technique used to primarily identify phases of a crystalline
material. The method also has the ability to determine the unit cell dimensions of a
sample[9].

115
Appendices E - Literature Review
8.8 Hydrogen Physical & Chemical Properties[20]
Table 2.9: Physical and chemical properties of Hydrogen fuel
8.9 References
1. S. Podila, S. Zaman, H. Driss, Y. Alhamed, A. Al-Zahrani and L. Petrov, "Hydrogen
production by ammonia decomposition using high surface area Mo2N and
Co3Mo3N catalysts", Catal. Sci. Technol., vol. 6, no. 5, pp. 1496-1506, 2016.
2. A. Dogan, M. Dogan, M. Onal, Y. Sarikaya, A. Aburub and D. Wurster, "Baseline
studies of the Clay Minerals Society source clays: specific surface area by
the Brunauer Emmett Teller (BET) method", Clays and Clay Minerals, vol. 54, no. 1,
pp. 62-66, 2006.
3. S. Yin, B. Xu, W. Zhu, C. Ng, X. Zhou and C. Au, "Carbon nanotubes-supported
Ru catalyst for the generation of COx-free hydrogen from ammonia", Catalysis
Today, vol. 93-95, pp. 27-38, 2004.
4. T. Slater, E. Lewis and S. Haigh, "Energy Dispersive X-ray Tomography for 3D
Elemental Mapping of Individual Nanoparticles", Journal of Visualized Experiments,
no. 113, 2016.
5. ”Scanning Electron Microscope | Definition of scanning electron microscope in English
by Oxford Dictionaries", Oxford Dictionaries | English, 2017. [Online]. Available:
https://en.oxforddictionaries.com/definition/scanning_electron_microscope.

116
[Accessed: 07- Nov- 2017].
6. A. Crewe, "Scanning transmission electron microscopy*", Journal of Microscopy, vol.
100, no. 3, pp. 247-259, 1974.
7. H. ASAHINA and K. YAGUCHI, "Application of TPD-MS (Temperature Programmed
Desorption or Decomposition Mass-Spectrometry) Technique in the Material
Research.", Journal of the Mass Spectrometry Society of Japan, vol. 46, no. 4, pp.
357-360, 1998.
8. C. Costentin, S. Drouet, M. Robert and J. Savéant, "Correction to Turnover Numbers,
Turnover Frequencies, and Overpotential in Molecular Catalysis of Electrochemical
Reactions. Cyclic Voltammetry and Preparative-Scale Electrolysis", Journal of the
American Chemical Society, vol. 134, no. 48, pp. 19949-19950, 2012.
9. H. Stanjek and W. Häusler, "Basics of X-ray Diffraction", Hyperfine Interactions, vol.
154, no. 1-4, pp. 107-119, 2004.
Recommended