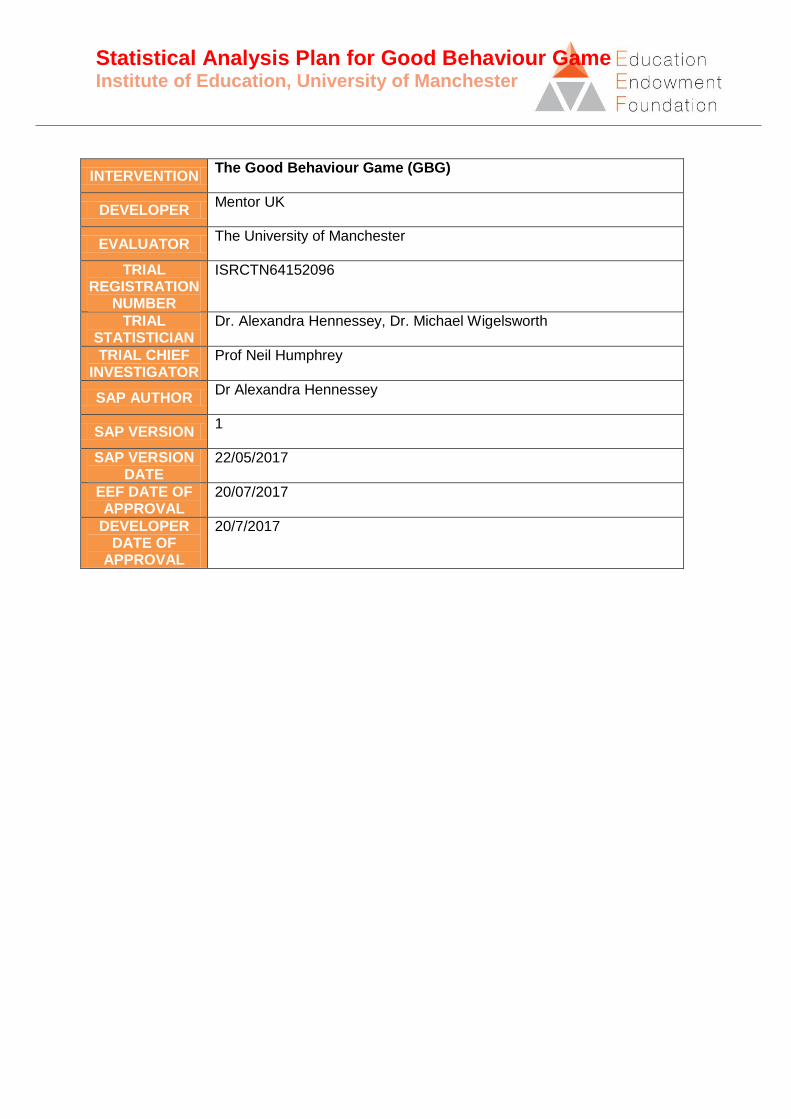
Statistical Analysis Plan for Good Behaviour Game Institute of Education, University of Manchester
INTERVENTION The Good Behaviour Game (GBG)
DEVELOPER Mentor UK
EVALUATOR The University of Manchester
TRIAL REGISTRATION
NUMBER
ISRCTN64152096
TRIAL STATISTICIAN
Dr. Alexandra Hennessey, Dr. Michael Wigelsworth
TRIAL CHIEF INVESTIGATOR
Prof Neil Humphrey
SAP AUTHOR Dr Alexandra Hennessey
SAP VERSION 1
SAP VERSION DATE
22/05/2017
EEF DATE OF APPROVAL
20/07/2017
DEVELOPER DATE OF
APPROVAL
20/7/2017

2
Table of Contents
Background ........................................................................................................................... 3
Introduction ........................................................................................................................... 3
Study design ......................................................................................................................... 5
Population and sample size (including eligibility criteria) .................................................... 5
Trial design ........................................................................................................................ 5
Protocol changes .................................................................................................................. 6
Randomisation ...................................................................................................................... 6
Calculation of sample size .................................................................................................... 6
Follow-up .............................................................................................................................. 6
Outcome measures ............................................................................................................... 6
Primary outcome ............................................................................................................... 7
Secondary outcomes ......................................................................................................... 8
Assessment of implementation .......................................................................................... 9
Analysis .............................................................................................................................. 10
Primary intention-to-treat (ITT) analysis ........................................................................... 10
Imbalance at baseline ...................................................................................................... 11
Missing data .................................................................................................................... 11
Secondary outcome analyses .......................................................................................... 11
Subgroup analyses .......................................................................................................... 12
On-treatment analysis ..................................................................................................... 12
Effect size calculation.......................................................................................................... 12
Report tables ...................................................................................................................... 12
References ......................................................................................................................... 15

3
Background The Good Behaviour Game (hereafter referred to as GBG) is one of the most popular
behaviour management systems for primary-aged children. It has an extensive evidence
base supporting its use. Since its initial development over 40 years ago (Barrish, Saunders,
& Wolf, 1969) multiple trials across the United States, the Netherlands and Belgium have
attested to its effectiveness in promoting a range of positive outcomes (e.g. increased pro-
social behaviour, reduced substance abuse, aggression and criminality) (Kellam et al.,
2011). This has led to a number of endorsements from agencies such as the Substance
Abuse and Mental Health Services Administration (who have included it on their National
Registry of Evidence-Based Programmes and Practices) and the University of Colorado
Blueprints For Healthy Youth Development (who have classified it as a ‘promising
programme’ in their database).
The GBG itself can be described as an “interdependent group-oriented contingency
management procedure” (Tingstrom, Sterling-Turner, & Wilczynski, 2006, p. 225). Pupils in a
given class are divided into mixed teams with up to 7 members, incorporating a range of
factors such as behaviour, academic ability, and gender. The teams then attempt to win the
game as a means to access particular privileges/rewards. During the game period, the class
teacher records the number of infractions to the following four rules among the teams: (1)
We will work quietly, (2) We will be polite to others, (3) We will get out of seats with
permission, and (4) We will follow directions. The game is ‘won’ by the team with the lowest
number of infractions when it ends, although any team with fewer than four infractions also
accesses the agreed reward (Chan, Foxcroft, Smurthwaite, Coombes, & Allen, 2012; Kellam
et al., 2011).
Over the course of implementation of the GBG, there is a natural evolution in terms of the
types of rewards used (from tangible rewards such as stickers to more abstract rewards
such as free time), how long the game is played for (from 10 minutes to a whole lesson), at
what frequency (from three times a week to every day), and when rewards are given (at the
end of the game, end of the day, and at end of the week) (Elswick & Casey, 2011; Tingstrom
et al., 2006). At face value, the GBG draws upon the principles of behaviour management –
children receive reinforcement when they engage in appropriate behaviours. However, the
group-orientation means that the intervention also uses principles of social learning theory –
pupils at-risk of developing behaviour problems are able to learn from the appropriate
behaviour being modelled by other team members. Finally, the GBG is informed by social
field theory, which posits that successful adaptation at different life stages is contingent upon
an individual’s ability to meet particular social task demands. In school, these task demands
include being able to pay attention, work well with others, and obey rules. Success in social
adaptation is rated both formally and informally by other members of the social field (e.g.
teachers, peers). Social field theory predicts that improving the way in which teachers
socialise children will improve their social adaptation. It is also predicted that early
improvements in social adaptation will lead to better adaptation to other social fields later in
life (Kellam et al., 2011).
Introduction Our team is conducting a major efficacy trial of the GBG in England that focuses on (i) the
intervention’s effects on children’s educational (e.g. reading, behaviour) outcomes; and in
particular (ii) its impact on boys who are showing the early signs of behaviour problems; and
(iii) children eligible for FSM; (iv) examining whether the way in which the GBG is

4
implemented influences outcomes; and (v) whether the GBG improves outcomes for
teachers (specifically, self-efficacy in classroom management, classroom stress, and
retention).
A cluster-randomised trial (RCT) design is being utilised - this is the gold standard method
for testing if a prescribed intervention has a measurable impact on a pre-specified set of
outcomes. Schools were the unit of randomisation, and were randomised to one of two
conditions, i) implementation of the GBG for 2 years (2015/16 and 2016/17) or ii)
continuation of usual practice. 77 schools met the criteria for randomisation (completion of
baseline measures, signing of memorandum of agreement to adhere to trial protocol), which
took place in summer 2015. 38 schools were randomised to deliver the GBG and 39 schools
to continue their usual practice. Children who started Year 3 in September 2015 were the
target population (aged 7-8, N=3,085).
The 38 schools that are delivering the GBG have been trained and supported by coaches
from Mentor UK. In September 2015 all Year 3 teachers at the GBG schools attended a two-
day training event lead by the GBG coaching team. They also attended a one-day booster
training event in January 2016. In the second year of the trial, as the Year 3 pupils moved
into Year 4, the new cohort of Year 4 teachers were trained. In most cases these teachers
had not delivered the GBG the year previously. However, in 9 cases, the Year 3 teachers
moved up with their class and continued to teach them in Year 4. In September 2016 all
‘new’ Year 4 teachers, attended a two-day training event (and, subsequently, a one-day
booster training event in January 2017) lead by the coaching team. Alongside the training
events, schools were also allocated a GBG coach who paid monthly visits to support the
schools and teachers throughout both years of the trial. These visits typically included the
coach observing the GBG in practice and completing a fidelity checklist, followed by a
meeting with the teacher for further discussion and to provide the opportunity for the coach
to address any teacher concerns.
A range of measures are being taken at regular intervals to assess if the GBG is effective.
The analyses will help us to answer five key hypotheses:
H1: Children in primary schools implementing the GBG over a two-year period will
demonstrate significant improvements in reading (1a) and behaviour (1b) when
compared to those children attending control schools.
H2: The effects outlined in H1 above will be amplified for boys exhibiting
borderline/abnormal levels of conduct problems at baseline.
H3: The effects outlined in H1 above will be amplified for children eligible for free
school meals.
H4: Variation in implementation fidelity (4a), quality (4b), dosage (4c), reach (4d), and
participant responsiveness (4e), will be significantly associated with reading and
behavioural outcomes among pupils in schools implementing the GBG.
H5: Teachers implementing the GBG will demonstrate measurable improvements in
self-efficacy in classroom management (5a), classroom stress (5b), and retention
(5c), when compared to teachers in control schools.

5
Study design
Population and sample size (including eligibility criteria)
Schools:
77 primary schools were recruited from Local Authorities across the North West, South
Yorkshire and East Midlands regions. This figure represents the number of schools required
to power the trial plus additional schools to allow for attrition (see sample size calculations
below). Schools were required to be state-maintained and not already implementing the
GBG in order to be eligible to participate.
Pupils:
Pupils in Year 3 (aged 7-8) at the beginning of the 2015/16 school year are the target cohort
(N=3,085).
Baseline assessment using the Strengths and Difficulties (SDQ, Goodman, 1997) conduct
problems subscale allowed us to identify a subsample of boys at-risk of or already
experiencing conduct problems (N=337, 11%). At-risk status was defined as scoring in the
borderline or abnormal range on this measure at baseline. For these pupils, we predict an
amplified effect of the GBG relative to the sample as a whole (following Kellam, Rebok,
Ialongo, & Mayer, 1994; see H2 above).
A second subsample – children eligible for FSM (N=764, 25.2%) – will also be analysed in
view of EEF’s primary remit of narrowing the attainment gap for such students and in line
with differential gains established for children from poorer socio-economic backgrounds for
related universal programmes (e.g. Holsen, Iversen, & Smith, 2009; see H3 above).
Teachers:
A total of N=249 teachers (N=123 teaching Year 3 classes in the first year of the trial, and
N=126 teaching Year 4 classes in the second year of the trial) are the sample for H5.
Trial design
A 2-year cluster-randomised trial is being utilised to examine the efficacy of the GBG.
Schools were randomly allocated to deliver the GBG or carry on as usual during the 2-year
trial (2015/16 and 2016/17). Schools allocated to the intervention arm of the trial have been
trained and supported to implement the GBG over a two-year period. Schools allocated to
the control arm of the trial are continuing their usual practice during the same period. After
the two-year trial period, schools are free to decide whether to continue with the GBG, in the
case of the intervention schools, or to start implementing the GBG, in the case of the usual
practice schools.
An incentive of £1500 was offered to control schools (single form entry; pro-rata for larger
schools) - £1000 at the beginning of the trial, post-randomisation, and £500 following the
completion of post-test measures. Schools in both arms of the trial signed a memorandum
of agreement prior to randomisation committing them to comply with the evaluation protocol
(defined as at least 85% completion rate of implementation and outcome measures).

6
Protocol changes The school-level survey, exploring usual/existing behaviour management and related
practices, was replaced with a teacher-level survey (completed by participating teachers);
this reflects the implementation of the GBG at classroom rather than school level.
Reference to programme differentiation and adaptations have been removed from H4. The
former will be used for descriptive purposes only – e.g. to provide an indication of teachers’
existing behaviour management strategies prior to implementation. Data on the latter was
only available via teachers’ self-report implementation surveys, which have proven to be
unreliable (see ‘assessment of implementation’ below).
Randomisation Participating schools were the unit of randomisation,in order to minimize the risk of
contamination that would have been associated with within-school (e.g. class)
randomisation, and for practical reasons, given that the intervention model includes a GBG
coach being assigned to each participating school in the intervention arm.
77 schools met the criteria for randomisation (defined as at least 85% completion rate of
implementation and outcome measures) and were randomly allocated to either implement
the GBG or continue usual practice in summer 2015 following the completion of the baseline
outcomes measures. The allocation procedure was conducted independently by the
Manchester Academic Health Science Centre Clinical Trials Unit. A minimisation algorithm
was applied to the randomisation to ensure balance across the arms of the trial in terms of
the proportion of children eligible for free school meals (FSM) and school size (data was
provided from the school performance tables on the DfE website, https://www.compare-
school-performance.service.gov.uk/). 38 schools were allocated to implement GBG and 39
schools were allocated to continue with their usual practice (see Table 4 for a comparison of
school and pupil demographics for schools allocate to each arm of the trial).
Calculation of sample size Our baseline sample (77 schools, N=3,085 children, average of 40 per cluster) provides a
minimum detectable effect size (MDES) of 0.13 in an intention to treat (ITT) analysis for our
primary outcome, based on an ICC of 0.06 (ICC at study baseline – KS1 Reading), an
assumed pre-post correlation of 0.7 (based on EEF estimates, EEF, 2013), and Power and
Alpha set to 0.8 and 0.05 respectively. If, as projected, we lose 6 schools due to attrition, the
MDES is 0.14. However, sample size calculations will be conducted to check the exact
MDES at post-test. Sample size calculations were carried out using Optimal Design
Software (http://sitemaker.umich.edu/groupbased/optimal_design_software as per EEF
recommendations (Torgerson & Torgerson, 2008).
Follow-up At the time of submission of the SAP, follow-up (T3) has not yet been completed.
Outcome measures The primary outcome measure for this study is children’s attainment in reading (described in
more detail below). Secondary outcome measures are children’s behaviour (teacher rated),
teacher self-efficacy in classroom management, classroom stress, and retention. The

7
primary outcome is being assessed at pre-test (T1) and post-test (T3) only. The secondary
outcome measures are being assessed at pre-test (T1), after 12 months (T2 – used only for
interim analyses), and at post-test (T3).
The primary outcome measure at T1 is drawn from the National Pupil Database (see below).
At T3 it will be administered via on-site whole-class testing. All other outcome measures are
being administered online using World App Key Survey.
Pupil outcome measures will be completed with all participating 77 schools with all 3,085
participating children (unless they are lost to follow-up because of absence at the time of
testing, moving schools, et cetera). All teachers teaching Year 3 (n=123) were invited to
complete the teacher outcome measures in 2016, and teachers teaching Year 4 (n=126) will
be invited to complete the teacher outcome measures in 2017.
Please see Table 1 below for outcome measures and timings.
Table 1. Good Behaviour Game – measures timetable
Teacher Teacher - Pupil Pupil
Time 1: May-July 2015 (Year 2 pupils)
Teacher self-report survey on usual practice and well-being
o Teacher efficacy in classroom management
o Teacher classroom stress
o Teacher retention
Behaviour o TOCA-C o SDQ (CP
only)
Reading o KS 1
Time 2: May-July 2016 (Year 3 pupils)
Teacher self-report survey on usual practice and well-being
o Teacher efficacy in classroom management
o Teacher classroom stress
o Teacher retention
Behaviour o TOCA-C
Time 3: May-July 2017 (Year 4 pupils)
Teacher self-report survey on usual practice and well-being (TBM)
o Teacher efficacy in classroom management
o Teacher classroom stress
o Teacher retention
Behaviour o TOCA-C
Reading o Hodder
Group reading test
Primary outcome
The primary outcome measure for this study is children’s attainment in reading. The primary
outcome is being assessed at pre-test (T1) and post-test (T3) only. The primary outcome
measure at T1 is drawn from the National Pupil Database (see below). At T3 it will be
administered via on-site whole-class testing.

8
The baseline period for the trial coincided with the end of Key Stage 1 teacher assessments
for the study cohort and so children’s KS1 National Curriculum reading point score
(KS1_REAPOINTS variable) are being used as the pre-test covariate. Post-test assessment
of reading will utilise the Hodder Group Reading Test (www.hoddertests.co.uk), test sheet 2
which is suitable for pupils aged 7-12 years. This paper-based measure produces raw
scores, which will be used for analyses purposes, but can be transformed into National
Curriculum levels, reading ages and standardised scores. It will be administered in a whole-
class/group context by members of the research team and takes 30 minutes or less to
complete, minimising the data burden for participating schools.
Secondary outcomes
Secondary outcome measures are children’s behaviour (teacher rated), teacher self-efficacy
in classroom management, classroom stress, and retention. The secondary outcome
measures are being assessed at pre-test (T1), after 12 months (T2 – used for interim
analyses only), and at post-test (T3) for the pupil level outcomes. For teacher level
outcomes, assessment is at T1 and T2 only for Year 3 teachers, and T2 and T3 only for
Year 4 teachers given the implementation plan. All the secondary outcome measures are
completed by teachers and online using World App Key Survey. Teachers will be sent step-
by-step instructions on how to complete these online surveys, and will be given a window in
which to complete them in at their convenience.
Behaviour:
Children’s behaviour is being assessed using the Teacher Observation of Children’s
Adaptation checklist (TOCA-C; Koth, Bradshaw, & Leaf, 2009). This 21-item scale provides
indices of children’s concentration problems, disruptive behaviour and pro-social behaviour.
Raters read statements about a child (e.g. “Pays attention”) and endorse them on a 6-point
scale (Never/Rarely/Sometimes/Often/Very Often/Almost Always).
Behaviour screening:
At T1 only we also employed the teacher-rated conduct problems subscale of the Strengths
and Difficulties Questionnaire (SDQ; Goodman, 1997) in order to identify our at-risk sample.
This 5-item scale requires raters to read statements about a child’s behaviour (e.g. “Often
has temper tantrums or hot tempers”) and endorse them on a 3-point scale (Not
True/Somewhat True/Certainly True). The subscale produces a score of 0-10, with 0-2, 3
and 4-10 representing the normal, borderline and abnormal ranges respectively. At-risk
status is defined as scoring in the borderline or abnormal range on this measure at T1.
Teacher efficacy in classroom management:
Teacher efficacy in classroom management is being assessed using the 4-item subscale of
the short-form Teachers’ Sense of Efficacy Scale (TES; Tschannen-Moran & Hoy, 2001).
Teachers read questions (e.g. “How much can you control disruptive behaviour in the
classroom?”) and respond on a 9-point scale (from Not At All to A Great Deal).
Teacher classroom stress:
Teacher stress is captured using the 5-item classroom stress subscale of the Teacher Stress
Inventory (TSI; Boyle, Borg, Falzon, & Baglioni, 1995). Respondents read questions (e.g.
“How great a source of stress is maintaining class discipline?”) and respond on a 5-point
scale (from No Stress to Extreme Stress).

9
Teacher retention:
Teacher retention is assessed through the use of a single item measure, as follows: “How
likely are you to leave the teaching profession in the next 5 years?” Participating teachers
will respond on a 6-item scale (Definitely/Highly Likely/Likely/Unlikely/Highly
Unlikely/Definitely Not).
Assessment of implementation
In relation to H4, we seek to determine the association between variability in the following
implementation dimensions and pupils’ reading and behavioural outcomes:
Fidelity – to what extent do teachers adhere to the GBG guidance when playing the
game?
Dosage – how frequently is the GBG played and for how long?
Quality – how well do teachers deliver the components of the GBG?
Participant responsiveness – to what extent do children engage with the GBG?
Reach – what is the rate and scope of participation in the GBG across the class?
Data on the above is available from three primary sources: (i) independent structured
observations conducted by the evaluation team (all dimensions noted above except dosage),
(ii) teacher self-report implementation surveys (all dimensions noted above), and (iii)
routinely collected GBG implementation data (fidelity and dosage only). For the analysis
pertaining to H4 we will make use of the independent structured observational data, and to
supplement this with routinely collected GBG implementation data on dosage. The rationale
here is that observational data is widely considered to be the most rigorous source of
implementation data (Humphrey et al., 2016); by contrast, implementer self-report data can
be positively biased, being subject to demand characteristics and impression management.
Indeed, preliminary analysis of the association between our observational data and
corresponding teacher self-report data bore this claim out, with the latter scoring themselves
on average 17% higher on fidelity, and 8% higher on quality than our observers.
The GBG lesson observation schedule was designed to provide quantitative data on
procedural fidelity, quality and participant responsiveness, which will be scored as a
percentage of the total possible score (i.e. 100% will be a perfect score). For example, in
relation to procedural fidelity, during the pre-, during, and post-game components of a GBG
session, there are a number of pre-specified actions that can be coded for
presence/absence (e.g. in the pre-game component, are GBG rules verbally
reviewed/discussed with class?) (see Humphrey et al, 2016, for a copy of the lesson
observation schedule).
The development of the structured observational schedule was informed by those used in
previous GBG studies (e.g. Leflot et al., 2013), the GBG implementation manual and fidelity
checklist published by AIR (Ford, Keegan, Poduska, Kellam, & Littman, 2014), our own work
in other trials (e.g. PATHS trial, Humphrey et al., 2015), and the extant literature on
implementation and process evaluation (e.g. Hansen, 2014). A draft of the schedule an
accompanying explanatory rubric were developed by the evaluation team ahead of piloting
and refinement using video footage of the GBG being implemented in English schools in the
UK pilot (Chan et al., 2012; Coombes, Chan, Allen, & Foxcroft, 2016). In this initial formative
stage, which lasted several days, the emphasis was on aligning our understanding of the
various implementation indicators and their application in the context of the GBG. Additional
video footage of GBG implementation was then used in order to generate inter-rater

10
reliability data for each indicator. These analyses demonstrated exceptionally good inter-
rater reliability, e.g. Cohen’s Kappa for our nominal procedural fidelity items is 0.95,
indicative of near perfect agreement.
Each class in the GBG arm of the trial is observed twice – once in 2015/16, and once in
2016/17. In line with the evidence that the mean ratings from two time-points will be more
strongly associated with outcomes than a single time-point (Domitrovich et al., 2010;
Resnicow et al., 1998), we will aggregate this data prior to analysis.
The routinely collected GBG implementation data on dosage is drawn from an online
monitoring tool used by teachers each time they play the game. The primary purpose of this
tool is to allow them to record infractions among team members; however, it also
automatically generates useful dosage data. Thus, we have a record of how many times
each teacher has played the game throughout the year, and for how long each time. We will
use this data to develop a ‘cumulative intervention intensity’ metric (dose x dose frequency x
total intervention duration - following Warren, Fey & Yoder, 2007) that represents the sum of
each class’ exposure to the GBG.
Given that there are no universally agreed thresholds of implementation ratings for GBG, we
will use the observational data to classify each class/teacher as either ‘low’, ‘moderate’ or
‘high’ for each aspect of implementation (i.e. dosage, reach and variables identified using the
EFA) using a distributional cut-point method (low, < -1 SD; moderate, -1 to +1 SD; and high,
> +1 SD; in subsequent dummy coding, low implementation will be the designated reference
group). This approach has been adopted in other school-based implementation evaluations,
i.e. PATHS (Humphrey, Hennessey, & Lendrum, in press).
In addition to the above, we will also provide descriptive data on programme differentiation
and monitoring of control conditions (e.g. to what extent can the GBG be distinguished from
other, existingbehaviour management practices in both intervention and control schools?).
This will be drawn from teacher usual practice surveys administered at T1, T2 and T3
following the pattern noted above for secondary outcomes. The survey itself is derived from
an existing measure of teachers’ behaviour management practices (Reupert & Woodcock,
2010). This data will form part of the analyses for the IPE section of the report, and will not
be used in the main impact analysis.
Analysis
Primary intention-to-treat (ITT) analysis
An intention-to-treat analysis will be conducted for the primary outcome (reading). Multi-level
modelling (MLM) with fixed effects and random intercepts, using MLWin Version 2.36, will be
used. 2-level (school, pupil) hierarchical models (controlling for T1 at the pupil level) will be
fitted to account for nested nature of dataset, with T3 reading score as the response
variable.. The primary outcome, reading, will be measured using Key Stage 1 reading point
scores (KS1_READPOINTS) from the NPD (T1) and the Hodder Reading test raw score
(T3).
Initially, empty (‘unconditional’) models will be fitted, entering only the school identifiers and
no explanatory variables. This will allow approximations of the proportion of unexplained
variance attributable to each level of the model. A full (‘conditional’) model will be fitted,
entering trial group (GBG vs. control) at the school level, and T1 score at the pupil level.
Subsequently a sensitivity analysis will be conducted, to include the above plus the

11
minimisation variables (% of pupils at school eligible for FSM and school size) at the school
level, and at a pupil level, gender, individual pupil FSM eligibility (given their associations
with the response variable). An intervention effect will be noted if the co-efficient associated
with the trial group variable is statistically significant. This will subsequently be converted to
Hedge’s g accounting for varying cluster sizes, as per EEF reporting guidelines (Hedges,
2007).
Imbalance at baseline
Analysis of imbalance at T1 on key observables (e.g. KS1 reading – KS1_READPOINTS)
will be included in the report, expressed as effect size difference between trial arms. A MLM
(controlling for school level minimisation variables, % of pupils at school eligible for FSM and
school size) will be used to determine any differences in KS1_READPOINTS, conduct
problems and TOCA behaviour scores at baseline, by trial group (GBG vs. control).
Missing data
As T1 data is drawn from the NPD, there is minimal missing data at baseline (N=71, 2.3% -
8 cases of pupil disapplied, and 63 cases of no match to KS1 database). At T3, the extent of
missing data will first be established, and differences between complete and missing cases
will be examined to establish any pattern to the missingness. Logistic regression will be used
to predict missingness, whereby each child will be coded as providing complete (0) or
incomplete (1) outcome data at T3, with other study data as explanatory variables (e.g.
KS1_READPOINTS, SDQ conduct problems and TOCA scores at baseline, gender, and
FSM) (Pampaka, Hutcheson, & Williams, 2017).
We will also perform an analysis using complete cases and a sensitivity analysis using
multiple imputation (via the REALCOM-Impute extension to MLWin) unless missing data is
less than 5%. Accordingly, multiple imputation procedures will be carried out in REALCOM-
Impute, using the missing at random assumption (Carpenter, Goldstein, & Kenward, 2011).
This will enable us to include both partially and completely observed cases of all 77 schools
and 3,085 pupils in the analysis, thereby reducing the bias associated with attrition.
Demographic variables (e.g. gender, FSM eligibility, ethnicity, EAL, SEND provision),
explanatory outcome variables (e.g. KS1 reading points – KS1_READPOINTS and TOCA
scores), and the constant will be entered as auxiliary variables and used to impute missing
values. REALCOM-Impute default settings of 1000 iterations and a burn-in of 100, refresh of
10, will be used, following guidance for multi-level imputation with mixed response types
(Carpenter et al., 2011).
Secondary outcome analyses
Pupil outcomes:
For the concentration problems, disruptive behaviour and pro-social behaviour subscales of
the TOCA-C, ITT analyses will be conducted following the procedures outlined above.
Teacher outcomes:
For each teacher outcome (self-efficacy in classroom management classroom stress, and
retention), we will fit single level linear regression models in SPSS version 22 as follows:
follow-up score (T2 for Year 3 teachers, T3 for Year 4 teachers) as the response variable,
with baseline score (T1 for Year 3 teachers, T2 for Year 4 teachers) and trial arm (GBG vs.
control) as explanatory variables.

12
Subgroup analyses
Fulfilment of our study objectives necessitates planned subgroup analyses, as follows: boys
exhibiting borderline/abnormal levels of conduct problems at baseline (H2), and children
eligible for FSM (H3). The MLMs outlined in the primary and secondary outcome intention-
to-treat analyses will be extended to include cross-level interaction terms as follows: trial
group*risk status*gender (e.g. if GBG, if at-risk, if male) (H2), and trial group*FSM (e.g. if
GBG, if FSM eligible). An intervention effect at the subgroup level will be noted if the co-
efficients associated with the interaction terms noted above are statistically significant.
These will subsequently be converted to Hedge’s g as per EEF reporting standards.
On-treatment analysis
First, in order to streamline analyses and thus reduce the likelihood of ‘model overfitting’,
avoid collinearity, and establish clear differentiation between implementation constructs, the
observer-rated implementation data pertaining to procedural fidelity, quality and
responsiveness will subjected to exploratory factor analysis in SPSS using the Principal Axis
Factoring extraction method (common factor analysis) with Varimax rotation (oblique rotation
method), to determine the number of discrete factors, and how much variance they explain
in the observational data, The resultant factors will then be modeled alongside the dosage
(cumulative intervention intensity) and reach (proportion of class present) data as
explanatory variables in a two-level (class, child) MLM. As per the aforementioned outcome
analyses, sex and FSM will be fitted at the child level alongside T1 score, with T3 score as
the response variable. Such an approach allows us to assess the association between a
wider range of implementation dimensions and outcomes than other available techniques
(e.g. complier average causal effects), while also avoiding the need to adopt arbitrary binary
distinctions between ‘compliers’ and ‘non-compliers’.
Effect size calculation In all cases, effect sizes will be reported using Hedge’s g (Cohen’s d bias corrected) and
accompanied by 95% confidence intervals as per EEF specifications.
Report tables
Table 1: Summary of impact on primary outcome
Group Effect size
(95% confidence interval)
Estimated months’ progress
EEF security rating
EEF cost rating
GBG vs. control
GBG FSM vs. control
GBG at risk vs. control
Table 2: Timeline

13
Date Activity
Table 3: Minimum detectable effect size at different stages
Stage
N [schools/pupils] (n=intervention;
n=control)
Correlation between pre-test (+other
covariates) & post-test
ICC
Blocking/ stratification
or pair matching
Power Alpha MDES
Protocol 72 (36; 36) - 0.06 80% 0.05 0.20
Randomisation 77 (38; 39) 0.7 0.06 80% 0.05 0.13
Analysis (i.e. available pre- and post-test)
Table 4: Baseline comparison
Variable Intervention group
(N=1560) Control group
(N=1525)
School-level (continuous) n (missing) Mean (SD) n (missing) Mean (SD)
Size – number of full-time
equivalent (FTE) students on roll
0 298.21 (134.33) 0 315.41 (186.65)
Attendance – overall
absence (% half days) 0 4.26 (0.90) 0 4.17 (0.96)
FSM – proportion of
students eligible for free school meals
0 27.56 (13.37) 0 24.46 (13.30)
EAL – proportion of
students speaking English as an additional language
0 22.01 (26.05) 0 23.19 (27.91)
SEND – proportion of
students with SEND 0 20.85 (9.30) 0 18.17 (5.94)
Attainment – proportion
of pupil achieving level 4+ in English and maths
0 76.21 (12.05) 0 74.87 (10.96)
Pupil-level (categorical) n (missing) Percentage n (missing) Percentage
Sex – proportion of male students
0 50.4% 0 54.9%
FSM – proportion eligible for free school meals
16 27.4% 32 22.8%

14
EAL - proportion speaking English as an additional language
16 26.1% 32 29.5%
Of those with SEND provision
16 23.1% 32 18%
SDQ Conduct Problems – at risk
61 13.2% 54 17.9%
Pupil-level (continuous) n (missing) Mean (SD) n (missing) Mean (SD)
Prior attainment – KS1 READPOINTS
27 15.61 (3.99) 44 16.06 (4.00)
Table 5: Primary analysis
Raw means Effect size
Intervention group Control group
Outcome n
(missing) Mean
(95% CI) n
(missing) Mean
(95% CI)
n in model (intervention;
control)
Hedges g (95% CI)
p
Pupil Reading
Concentration problems
Disruptive problems
Pro-social
Teacher Classroom management
Stress
Retention
Table 6: MLM School and pupil level variance associated pupil outcomes
Reading
Concentration problems
Disruptive problems
Pro-social
Co-efficient
β
SE Co-efficient β
SE Co-efficient β
SE Co-efficient
β
SE
School FSM School size Trial group (if GBG) Pupil Gender (if male) FSM (if eligible) Risk status (if at risk) Concentration
problems baseline
Interactions Trial group*FSM Trial group*Gender Trial group*Risk
status
FSM*Gender FSM*Risk status
15
Gender*risk status Trial group*
FSM*Gender
Trial group* Gender*Risk status
Trial group*FSM* Gender*Risk status
-2*Loglikelihood = X
2 (df, n) = , p = X
2 (df, n) = , p = X
2 (df, n) = , p = X
2 (df, n) = , p =
Table 7: Hierarchical linear models of the impact of lesson observation
implementation variability on pupil outcomes in the GBG programme
NB: Implementation dimensions at class level to be confirmed following factor
analysis of observational data
Reading
Concentration problems
Disruptive problems
Pro-social
Co-efficient β
SE Co-efficient β
SE Co-efficient β
SE Co-efficient β
SE
Class Procedural fidelity Participant
responsiveness
General quality Reach Dosage Pupil If male If FSM Baseline score -2*Loglikelihood = X
2 (df, n) = , p = X
2 (df, n) = , p = X
2 (df, n) = , p = X
2 (df, n) = , p =
References
Barrish, H. H., Saunders, M., & Wolf, M. M. (1969). Good behavior game: effects of individual contingencies for group consequences on disruptive behavior in a classroom. Journal of Applied Behavior Analysis, 2, 119–24.
Boyle, G. J., Borg, M. G., Falzon, J. M., & Baglioni, A. J. (1995). A structural model of the dimensions of teacher stress. The British Journal of Educational Psychology, 65, 49–67.
Carpenter, J. R., Goldstein, H., & Kenward, M. G. (2011). REALCOM-IMOUTE Software for
multilevel multiple imputation with mixed response types. Journal of statistical
Software, 45, 1-14.

16
Chan, G., Foxcroft, D., Smurthwaite, B., Coombes, L., & Allen, D. (2012). Improving child behaviour management: An evaluation of the Good Behaviour Game in UK primary schools. Oxford: Oxford Brookes University.
Coombes, L., Chan, G., Allen, D., & Foxcroft, D. R. (2016) Mixed-methods Evaluation of the
Good Behaviour Game in English Primary Schools. Journal of Community Appl. Soc.
Psychol. 26, 369-387.
Domitrovich, C. E., Gest, S. D., Jones, D., Gill, S., & DeRousie, R. M. S. (2010).
Implementation quality: Lessons learned in the context of the Head Start REDI trial.
Early Childhood Research Quarterly, 25, 284–298.
Elswick, S., & Casey, L. (2011). The good behavior game is no longer just an effective intervention for students: An examination of the reciprocal effects on teacher behaviors. Beyond Behavior, 21, 36–46.
EEF. (2013). Pre-testing in EEF evaluations (31.10.2013).
Ford, C., Keegan, N., Poduska, J., Kellam, S., & Littman, J. (2014). Implementation Manual. Washington, DC: American Institutes for Research.
Goodman, R. (1997). The Strengths and Difficulties Questionnaire: A research note. Journal of Child Psychology and Psychiatry, 38, 581–586.
Hansen, W. (2014). Measuring fidelity. In Z. Sloboda & H. Petras (Eds.), Defining prevention science (pp. 335–359). New York, NY: Springer.
Holsen, I., Iversen, A. C., & Smith, B. H. (2009). Universal social competence promotion programme in school: Does it work for children with low socio-economic background? Advances in School Mental Health Promotion, 2, 51–60.
Humphrey, N., Hennessey, A., & Lendrum, A. (in press). Quality matters: implementation moderates student outcomes in the PATHS curriculum. Prevention Science.
Humphrey, N., et al (2015). Promoting Alternative Thinking Strategies (PATHS): Evaluation
report. London: Education Endowment Foundation. Humphrey, N., Lendrum, A., Ashworth, E., Frearson, K., Buck, R., & Kerr, K. (2016).
Implementation and process evaluation (IPE) for interventions in educational settings: a synthesis of the literature. London: Education Endowment Foundation.
Kellam, S. G., Rebok, G. W., Ialongo, N., & Mayer, L. S. (1994). The course and malleability of aggressive behavior from early first grade into middle school: results of a developmental epidemiologically-based preventive trial. Journal of Child Psychology and Psychiatry, and Allied Disciplines, 35, 259–81.
Kellam, S. G., Mackenzie, A. C. L., Brown, C. H., Poduska, J. M., Wang, W., Petras, H., & Wilcox, H. C. (2011). The good behavior game and the future of prevention and treatment. Addiction Science & Clinical Practice, 6, 73–84.
Koth, C. W., Bradshaw, C. P., & Leaf, P. J. (2009). Teacher Observation of Classroom Adaptation--Checklist: Development and factor structure. Measurement and Evaluation in Counseling and Development, 42, 15–30.

17
Leflot, G., van Lier, P. A. C., Onghena, P., & Colpin, H. (2013). The role of children's on-task
behavior in the prevention of aggressive behavior development and peer rejection: A
randomized controlled study of the Good Behavior Game in Belgian elementary
classrooms. Journal of School Psychology, 51, 187-199.
Resnicow, K., Davis, M., Smith, M., Lazarus-Yaroch, A., Baranowski, T., Baranowski, J.
Doyle, C., & Wang, D. T. (1998). How best to measure implementation of school health
curricula: a comparison of three measures. Health Education Research, 13, 239-250.
Reupert, A., & Woodcock, S. (2010). Success and near misses: Pre-service teachers’ use,
confidence and success in various classroom management strategies. Teaching and
Teacher Education, 26, 1261-1268.
Tingstrom, D. H., Sterling-Turner, H. E., & Wilczynski, S. M. (2006). The good behavior game: 1969-2002. Behavior Modification, 30, 225–53.
Torgerson, D. J., & Torgerson, C. J. (2008). Designing Randomised Trials in Health, Education and the Social Sciences: An Introduction. London: Palgrave Macmillan.
Tschannen-Moran, M., & Hoy, A. (2001). Teacher efficacy: Capturing an elusive construct.
Teaching and Teacher Education, 17, 783–805.
Warren, S. F., Fey, M. E., & Yoder, P. J. (2007). Differential treatment intensity research: A
missing link to creating optimally effective communication interventions. Developmental
Disabilities Research Reviews, 13, 70-77.
Recommended