Static and dynamic evanescent wave light scattering studies of diblock copolymers adsorbed at the air/water interface
Binhua Lin and Stuart A. Rice Department of Chemistry and The James Franck Institute, The University of Chicago, Chicago, Illinois 6063 7
D. A. Weitz Exxon Research and Engineering Company, Annandale, New Jersey 08801
(Received 15 June 1993; accepted 10 August 1993)
We report the results of static and dynamic evanescent wave light scattering studies of a monolayer of a diblock copolymer, polystyrene-b-polymethyhnethacrylate ( PS-b-PMMA) with weight averaged molecular weights (M,) of 880 000:290 000 supported at the air/water inter- face. Our studies probe the interfacial structural and dynamic properties of the monolayer on a length scale which is a fraction of the wavelength of light. The static light scattering studies were carried out as a function of polymer surface coverage and temperature; we also report some preliminary data for the dependence of the static structure function on the relative molecular weights of the PS and PMMA blocks. The complementary dynamic light scattering studies were carried out only as a function of surface coverage. Our data suggest that, upon spreading in the air/water interface, PS-b-PMMA (880:290 K) copolymers form thin disklike aggregates con- taining about 240 molecules. These data are consistent with a model in which each such aggre- gate is a “furry disk” with a dense core consisting of a layer of collapsed PS blocks atop a thin layer of extended PMMA blocks on the water surface and a brushlike boundary of extended PMMA blocks. The data show that the furry disks diffuse freely when the surface coverage is small, but when the surface coverage is large, they are immobile. Our data also suggest that the furry disks can aggregate to form even larger “islands” of disks with an extension greater than 20 ,um. The static structure function of the assembly of furry disks is well described, over a wide range of surface coverage, by the structure factor of a two-dimensional hard disk fluid modu- lated by a two-dimensional hard disk form factor.
I. INTRODUCTION
The properties of polymers adsorbed at the liquid- vapor interface have been studied for many years, prima- rily with classical methods such as surface pressure-area- temperature measurements to define the equation of state of the monolayer,’ elhpsometric measurements to deter- mine the monolayer thickness,2 and quasielastic light scat- tering measurements to determine the viscoelastic charac- teristics of the monolayer.3 These methods give valuable information about the gross properties of the monolayer, but no information about the polymer molecule configura- tion or about the transverse (in the plane of the interface) and longitudinal (perpendicular to the plane of the inter- face) distributions of the polymer molecules in the mono- layer. Some information about the longitudinal density dis- tribution in a polymer monolayer has become available very recently from studies of x-ray4 and neutron reflectiv- ity5p6 as a function of angle of incidence, and from studies of fluorescence excited by evanescent wave x rays.’ There is also some information available about short range trans- verse order in a polymer monolayer obtained from grazing incidence x-ray diEraction.8 However, neither x-ray reflec- tivity nor grazing incidence x-ray diffraction are suitable for the determination of the configuration of the adsorbed polymer, e.g., its radii of gyration parallel to and perpen- dicular to the interface. A method which is suitable for the latter purpose has been proposed by Gao and Rice.9p’o
Their method is based on measuring the in-plane and out- of-plane angular distributions of evanescent wave light scattered by the monolayer; the evanescent waves are gen- erated by the total reflection of light from the interface between the substrate and the monolayer. Because the wavelength of light and the polymer dimensions are com- mensurate, measurement of the angular distribution of the scattered evanescent waves allows the determination of a structure function that can be interpreted in terms of the characteristic size and shape of the adsorbed polymer.
This paper reports an application of the Gao-Rice method to the study of block copolymers of styrene and methyl methacrylate adsorbed at the air/water interface. Specifically, we report the results of static light scattering studies of the m-plane configuration of the diblock co- polymer polystyrene-b-polymethylmethacrylate (PS-b- PMMA) with weight averaged molecular weights (44,) of 880 000:290 000. We complement these static light scatter- ing measurements with a study of the dynamic light scat- tering from this copolymer adsorbed on the surface of wa- ter; the results of the latter study confirm and extend the results obtained from the static structure functions deter- mined by evanescent wave scattering. Finally, we also re- port, briefly, the results of preliminary measurements of the static structure function of monolayers of PS-b-PMMA as a function of the relative molecular weights of the PS and PMMA blocks.
8308 J. Chem. Phys. 99 (lo), 15 November 1993 0021-9808/93/99(10)/8308/17/$6.00 @ 1993 American Institute of Physics
Downloaded 03 Jul 2001 to 140.247.57.188. Redistribution subject to AIP license or copyright, see http://ojps.aip.org/jcpo/jcpcr.jsp
The results of our experiments are striking. Contrary to common belief, we find, for the copolymer adsorbate studied, that there is no region of the surface pressure-area isotherm studied which corresponds to isolated molecules. Rather, the polymers self assemble into aggregates com- posed of many molecules, each with a diameter that is nearly independent of the surface concentration. Our data are consistent with a model in which each such aggregate is a “furry disk” with a dense core and a brush-like bound- ary; the former is determined by the PS portions of the molecules, and the latter by the PMMA portions of the molecules. This model envisages the dense core to consist of PS-b-PMMA molecules oriented so that the collapsed PS blocks are in the air, while the PMMA blocks are at the air/water interface. Those PMMA blocks attached to mol- ecules in the center of the disk, rather than its perimeter, spread in the water/air interface, but the geometry of the disk requires that these blocks lie almost entirely beneath the disk. In contrast, the PMMA blocks attached to mol- ecules on the perimeter of the disk are considerably ex- tended at the water/air interface, as in a polymer brush.
Air
Water I
A preliminary version of the results of a small fraction of the work discussed in this paper has been reported pre- viously.” This paper reports the results of an extended series of studies of monolayers of PS-b-PMMA (880:290 K) supported on water; it also provides a detailed descrip- tion of the experimental apparatus and methods used, along with an improved interpretation of the results of the experiments.
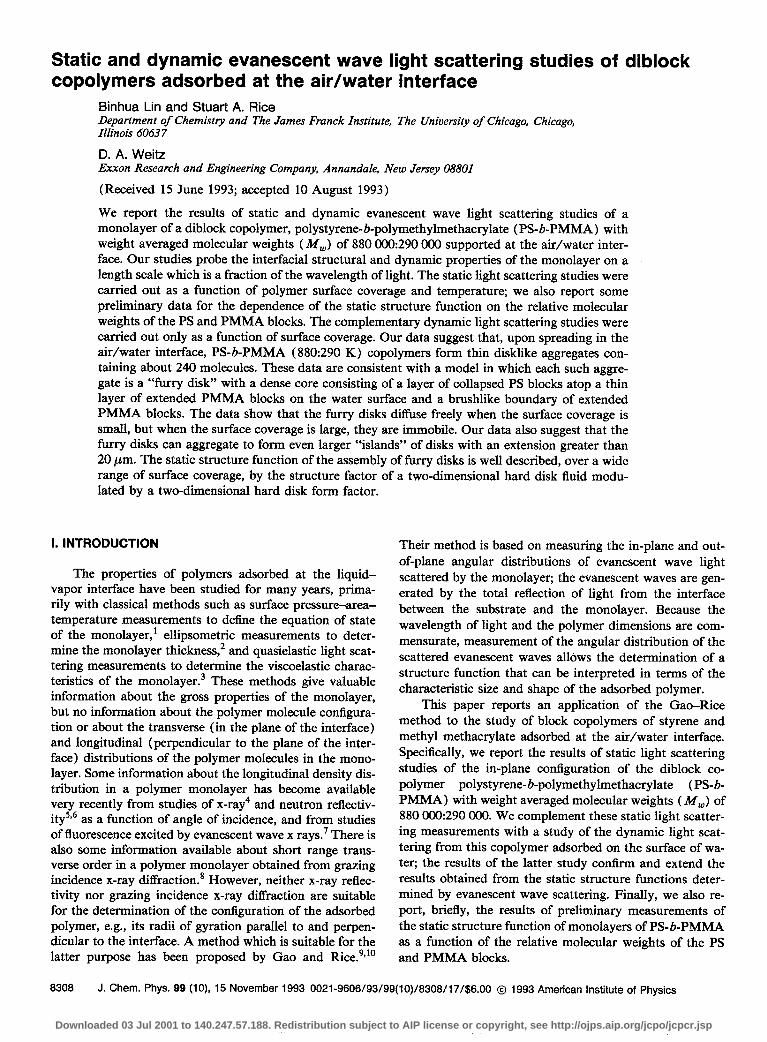
FIG. 1. The geometric relationships between an incident electromagnetic plane wave with wave vector ki , an evanescent wave with wave vector k, and a scattered wave with wave vector k, at the air/water interface.
light, then the component amplitudes of the electric field of the evanescent wave are
lPAl=~$=J 2 cos 8i Jsin’ ei- n2 it4 C0S2 Bi+Sin2 ei- 2 ’ (1)
II. EXPERIMENTAL DETAILS (2)
A. Principles of evanescent wave light scattering
Since this paper reports the first application of the Gao-Rice method to a real system, we briefly review the principles of evanescent wave scattering.
,+& 2coseis~ei n4 cos2 Bi+ sin2 Bi - n’ ’ (3)
The geometric relation between an incident electro- magnetic plane wave, with wave vector ki, and an evanes- cent wave, with wave vector k,, at an interface between two nonabsorbing dielectric media is illustrated in Fig. 1. The xy plane is the interface between two semi-infinite nonabsorbing dielectric media, while the xz plane is the plane of incidence. Light is incident on the interface through the lower medium. The refractive index of the upper medium is n, and that of the lower medium is n2, where n, > n2. A straightforward application of electro- magnetic theory I2 shows that if the incident angle of the plane wave, 8, is greater than the critical angle 8,, [sin 8, = n = ( n2/nl)], the incident wave is totally reflected, and an evanescent wave is generated at the interface in the upper medium. The evanescent wave propagates along the interface in the incident plane, along the x axis; the ampli- tude of its electric field decays exponentially along the z axis.
while the spatial dependence of the evanescent waves has the form
exp(-ik,x-ddpz),
where k, is given by
27rnl sin ei km= A
(4)
(5)
and d, is the penetration depth
A d=
’ 2rrnt (sin2Bi-n2) * (6)
Note that an evanescent wave does not have purely trans- verse character since the field component in the direction of propagation, 1 E, I, does not vanish. However, since lon- gitudinal oscillations of the electric field do not give rise to radiation, the longitudinal component can be omitted in our discussion of light scattered from an incident evanes- cent wave.
The derivation of the field associated with an evanes- Since we have chosen to study polymers adsorbed at cent wave can be found in standard textbooks.12 In brief, if the water/air interface, medium 1 is water and medium 2 is All and A, are the amplitudes of the incident electric field air, leading to n=0.752 and 19~=sin-‘, n =48.9”; the wave- parallel and perpendicular to the plane of incidence, re- length of the light in vacuum is 5145 A, while the polar- spectively, and il is the vacuum wavelength of the incident ization of the electric field is maintained parallel to the
Lin, Rice, and Weitz: Evanescent wave light scattering
J. Chem. Phys., Vol. 99, No. 10, 15 November 1993
8309
Downloaded 03 Jul 2001 to 140.247.57.188. Redistribution subject to AIP license or copyright, see http://ojps.aip.org/jcpo/jcpcr.jsp
8310 Lin, Rice, and Weitz: Evanescent wave light scattering
2.0 - 2.0 -
1.5
27 27 1.0 - 1.0 -
0.5 0.5
0.0 : : : : : : 1 : 0.0 : : : : : : 1 :
5000 5000
f&=48.90 f&=48.90 j : -z4000 -z4000 s s
y y
3000 3000
0 0 10 20 30 40 50 60 70 80 10 20 30 40 50 60 70 80 6 Angle of Incident (degrees)
0
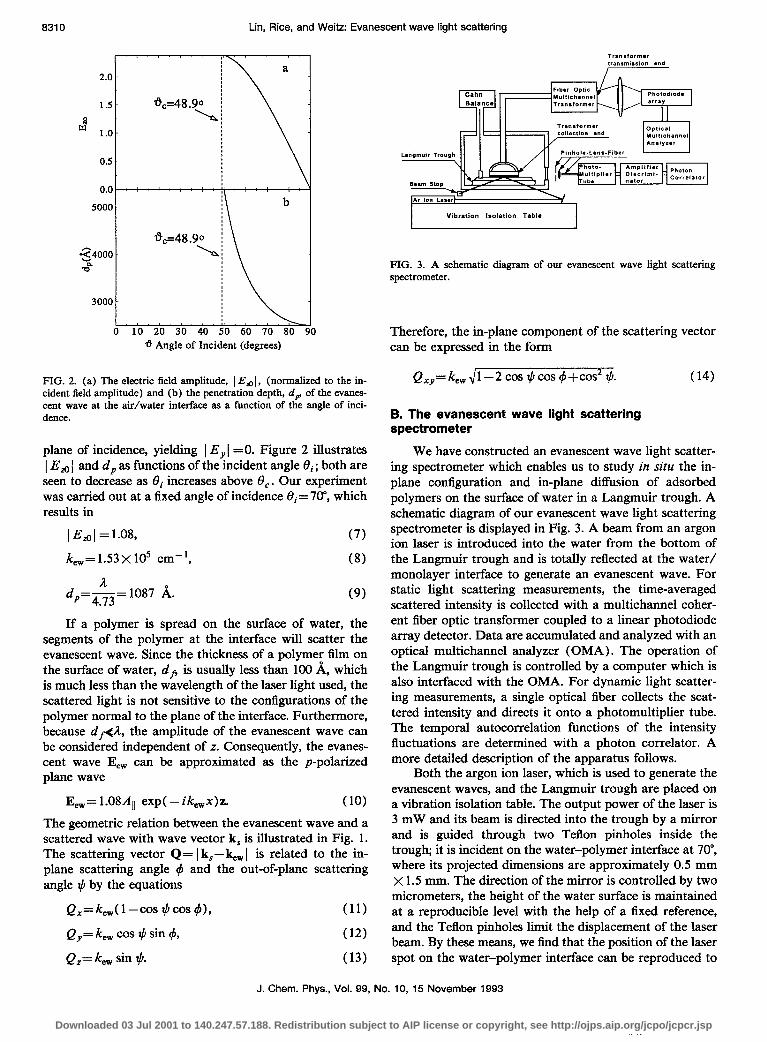
FIG. 3. A schematic diagram of our evanescent wave light scattering spectrometer.
Therefore, the in-plane component of the scattering vector can be expressed in the form
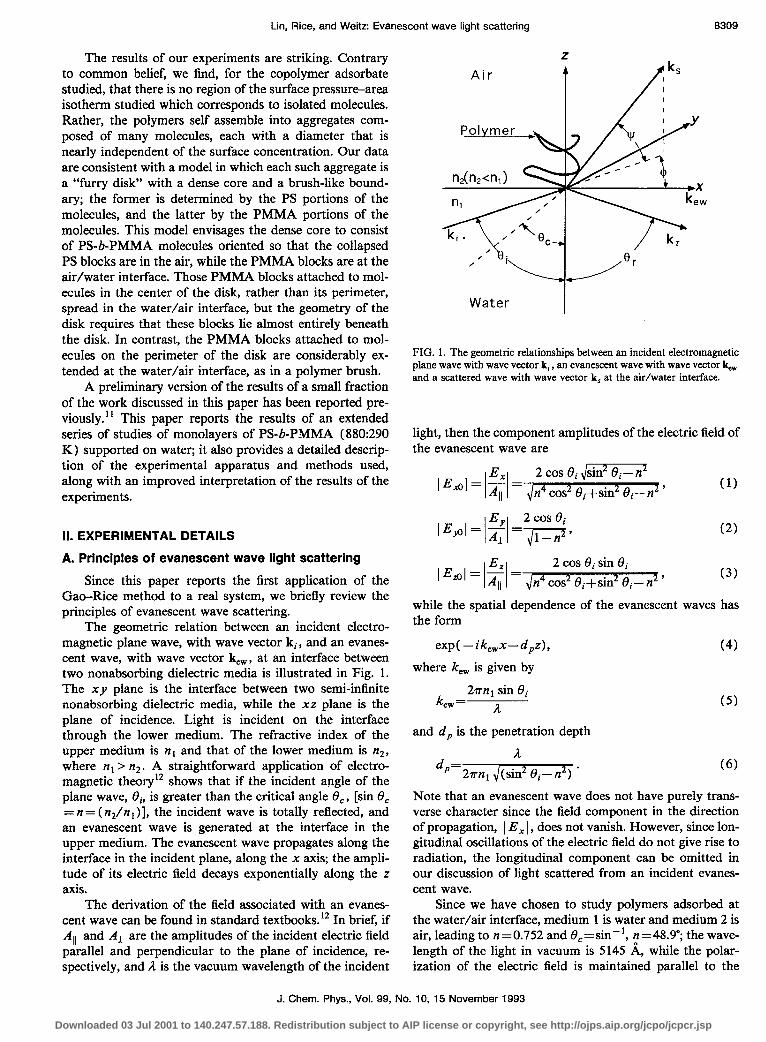
FIG. 2. (a) The electric field amplitude, 1 E,I, (normalized to the in- cident field amplitude) and (b) the penetration depth, d, of the evanes- cent wave at the air/water interface as a function of the angle of inci- dence.
plane of incidence, yielding 1 E, 1 =O. Figure 2 illustrates 1 Ed 1 and d, as functions of the incident angle ei ; both are seen to decrease as 8i increases above 8,. Our experiment was carried out at a fixed angle of incidence 6i= 70”, which results in
1 EzO 1 = 1.08, (7)
kew= 1.53X lo5 cm-‘, (8)
d,,-&= 1087 A. (9)
If a polymer is spread on the surface of water, the segments of the polymer at the interface will scatter the evanescent wave. Since the thickness of a polymer film on the surface of water, d, is usually less than 100 A, which is much less than the wavelength of the laser light used, the scattered light is not sensitive to the contigurations of the polymer normal to the plane of the interface. Furthermore, because dfiil, the amplitude of the evanescent wave can be considered independent of z. Consequently, the evanes- cent wave Eew can be approximated as the p-polarized plane wave
E,= 1.08A11 exp( -iik,,x)z. (10) The geometric relation between the evanescent wave and a scattered wave with wave vector k, is illustrated in Fig. 1. The scattering vector Q= I k,--k, I is related to the in- plane scattering angle 0 and the out-of-plane scattering angle $ by the equations
Q,=k,,(l-cos $cos#), (11)
Q,= k, cos tF, sin r$, (12)
Qz= k,, sin $. (13)
Q,,=k,,,/l-2cosqhos~+cos2~. (14)
B. The evanescent wave light scattering spectrometer
We have constructed an evanescent wave light scatter- ing spectrometer which enables us to study in situ the in- plane configuration and in-plane diffusion of adsorbed polymers on the surface of water in a Langmuir trough. A schematic diagram of our evanescent wave light scattering spectrometer is displayed in Fig. 3. A beam from an argon ion laser is introduced into the water from the bottom of the Langmuir trough and is totally reflected at the water/ monolayer interface to generate an evanescent wave. For static light scattering measurements, the time-averaged scattered intensity is collected with a multichannel coher- ent fiber optic transformer coupled to a linear photodiode array detector. Data are accumulated and analyzed with an optical multichannel analyzer (OMA). The operation of the Langmuir trough is controlled by a computer which is also interfaced with the OMA. For dynamic light scatter- ing measurements, a single optical fiber collects the scat- tered intensity and directs it onto a photomultiplier tube. The temporal autocorrelation functions of the intensity fluctuations are determined with a photon correlator. A more detailed description of the apparatus follows.
Both the argon ion laser, which is used to generate the evanescent waves, and the Langmuir trough are placed on a vibration isolation table. The output power of the laser is 3 mW and its beam is directed into the trough by a mirror and is guided through two Teflon pinholes inside the trough; it is incident on the water-polymer interface at 70”, where its projected dimensions are approximately 0.5 mm x 1.5 mm. The direction of the mirror is controlled by two micrometers, the height of the water surface is maintained at a reproducible level with the help of a fixed reference, and the Teflon pinholes limit the displacement of the laser beam. By these means, we find that the position of the laser spot on the water-polymer interface can be reproduced to
J. Chem. Phys., Vol. 99, No. 10, 15 November 1993
Downloaded 03 Jul 2001 to 140.247.57.188. Redistribution subject to AIP license or copyright, see http://ojps.aip.org/jcpo/jcpcr.jsp
within* 1 mm. The intensity of the incident laser beam is monitored continuously and is used to normalize the mea- sured scattered light intensity.
To collect the scattered light efficiently we designed a multichannel coherent fiber optic transformer (see Fig. 3) which was fabricated by Fiber Guide Industry. The trans- former consists of 71 optical fibers, each fiber with a core diameter of d = 100 pm and a collection angle of 28= 12”. These fibers collect the in-plane scattered light simulta- neously at 71 angles ranging from 0” to 180”, and transmit the light coherently to an intensified linear photodiode ar- ray. At the collection end of the transformer the fibers are arranged on a semicircle around the laser spot on the sur- face and roughly 2.5 cm from the center of the spot; they are spaced as follows: 2” per fiber from 0” to 30” and from 150” to 180”, and 3” per fiber from 30” to 150”. At the transmission end of the transformer the fibers are arranged in a linear array which is imaged onto the 7 10 pixels of the detector by a convex lens with a diameter of 10 cm and a focal length of 75 cm. This lens is large enough to collect all the photons that exit from the fiber transformer. The images of the fibers are quite sharp (the resolution limit of the detector is 3 pixels). Since there is very little crosstalk between the fibers, the corrections for the responses of the individual fibers are independent and the true angular dis- tribution of the scattered light intensity can be obtained by dividing the raw data by the response function of the indi- vidual fibers and normalizing by the incident intensity.
The collection angle of each fiber in the transformer ensures that the scattered light from the whole illuminated surface is collected. Thus the angular resolution of a fiber is determined by the size of the illuminated spot and the distance to the fiber, resulting in an angular width of A4 ~3.4”. The resolution of the scattering vector depends on the angle of the detecting fiber and is given by (AQ)/Q = [A#/2]cot (#/2). Thus the resolution of the fiber at 0“ is ill defined and the data from this channel were not used. The angular acceptance also defines the coherence length of the detecting fibers for the surface scattering; with A=5145 A, the coherence length is 1,,~8.5 ym. Each fiber is inclined about 5” to the plane of the surface; thus the number of coherence areas detected by each fiber is given by d/lmh=: 12. As a consequence, good statistical accuracy depends on the motion of the scatterers to aver- age over a sufficient number of independent coherence ar- eas. If the scatterers are static over the measurement time, substantial statistical fluctuations can be introduced in the data; these can be as large as 30%.
In the dynamic light scattering experiments, the opti- cal fiber, which has a core diameter of d =200 ,um, is placed about 25 cm away from the scattering center, out- side the observation window on the enclosure of the Lang- muir trough. The scattering area is imaged onto the fiber using a convex lens, with a focal length of 5 cm, placed about 7.5 cm in front of the fiber. A 0.5 mm diameter pinhole serves to aperture the lens and defines the coher- ence length at the detector to be about 75 pm. Again, for the scattering from the surface, the spatial coherence fac- tori3 is defined as /3= l,,/d ~0.4. The angular range over
which the scattered light can be detected is limited by the geometry of the observation windows; it can cover the an- gular ranges - 50’=-120” and - 150”-170”. Due to the ge- ometry of the Langmuir trough, the fiber is placed approx- imately 25” above the plane of the interface. The scattering vector parallel to the interface then becomes, according to Es. (141,
Qxy= k,, l-2 cos 25” cos ~+COS’ 25”. (15)
C. The Langmuir trough
The Langmuir trough was machined from solid black Teflon and has inner dimensions of 30 cmX 14 cmX0.6 cm; it is contained in an aluminum box which rests on a vibration isolation table. There are two glass observation windows, each 8 cmX 15 cm, on the side walls of the box. The temperature of the monolayer is controlled to *to.05 by running water through channels machined in the top and bottom plates of the box; the top plate is maintained a few degrees warmer than the bottom plate to eliminate water condensation on its inner face. A stepping motor drives a solid Teflon barrier to change the surface coverage; the compression ratio of the trough is 3:l. The surface pressure of the monolayer is monitored throughout the scattering measurements by the Wilhelmy plate method.
D. Minimization of background scattering
The background noise in our light scattering experi- ment is dominated by Rayleigh scattering from the water. The Rayleigh ratio of water is approximately 10m6/cm, which is not negligible relative to the scattering from the polymer monolayer. To reduce the dust level in our system we used water from a Nanopure system ( 18 Ma, with a 0.2 pm filter), and we constantly flushed gaseous NS, ex- tracted from the vapor in a liquid N2 dewar, into the trough box, while rinsing the trough thoroughly with pure water. The laser was kept on during this process so that the progress of the cleansing could be monitored. We found that the “blinking” along the laser beam in the substrate water decreased continuously and virtually disappeared af- ter eight to ten rinses. Since the Langmuir trough enclo- sure is essentially O-ring tight, the box could then be filled with pure Nz and remained dust free. In a properly cleaned system, the intensity of scattering from the water, mea- sured for 5 min every 20 min for two hours, showed a scan-to-scan variability of less than 5%. Thus the scatter- ing from the residual dust was significantly less than that from the water. The latter is, for all practical purposes, a constant background, which was subtracted from the data to obtain the scattering due to the surface monolayer.
E. Preparation of samples
Our sample of PS-b-PMMA was obtained from Poly- sciences, Inc.; it has a relatively narrow molecular weight distribution ( MJJM,= 1.1). The characteristics of this polymer, and of the pure PS and PMMA we have studied, are displayed in Table I. Chloroform, a good solvent for both PS and PMMA, was used to make very dilute solu-
Lin, Rice, and Weitz Evanescent wave light scattering 8311
J. Chem. Phys., Vol. 99, No. 10, 15 November 1993
Downloaded 03 Jul 2001 to 140.247.57.188. Redistribution subject to AIP license or copyright, see http://ojps.aip.org/jcpo/jcpcr.jsp
8312 Lin, Rice, and Weitz: Evanescent wave light scattering
TABLE I. Polymer samples, ~16,
(A) Homopolymers Polymer JfW
PMMA 277 000 PMMA 1500000
MW/"N
1.27 1.1
SOUPX
Du Porn American Polymer
Standards PS 145ocOO 1.06 Polymer Laboratories
Ltd.
(B) PS-b-PMMA diblock copolymers ‘+fwW) M,(PMMA) Mw/MN source
880 ooo 290000 1.1 Polysciences, Inc. 46ocQo 220 ooo 1.1 Polysciences, Inc. 450 ooo 450 coo 1.1 Professor Matthew Tirrell
tions ( -0.03 mg/mL), which were left for three days be- fore being used to spread a monolayer. We observed that use of a polymer solution with a higher concentration, or use of a shorter delay before spreading, produced erratic results. The polymer monolayer is prepared by spreading, dropwise from a syringe, l-l.5 mL of the polymer solution onto the surface of pure water. The surface coverage was varied in steps, each step typically being 0.1 or 0.2 A* per monomer. After each step 10 min was allowed to elapse to permit relaxation of the monolayer. The surface pressure was monitored continuously throughout the experiment. When the desired surface coverage was achieved 20 min was allowed to elapse before measurement of the scattered light intensity was started. Then five scans of the angular distribution of the scattered light were taken successively, each lasting 5 min, and with an interval of 15 min between scans.
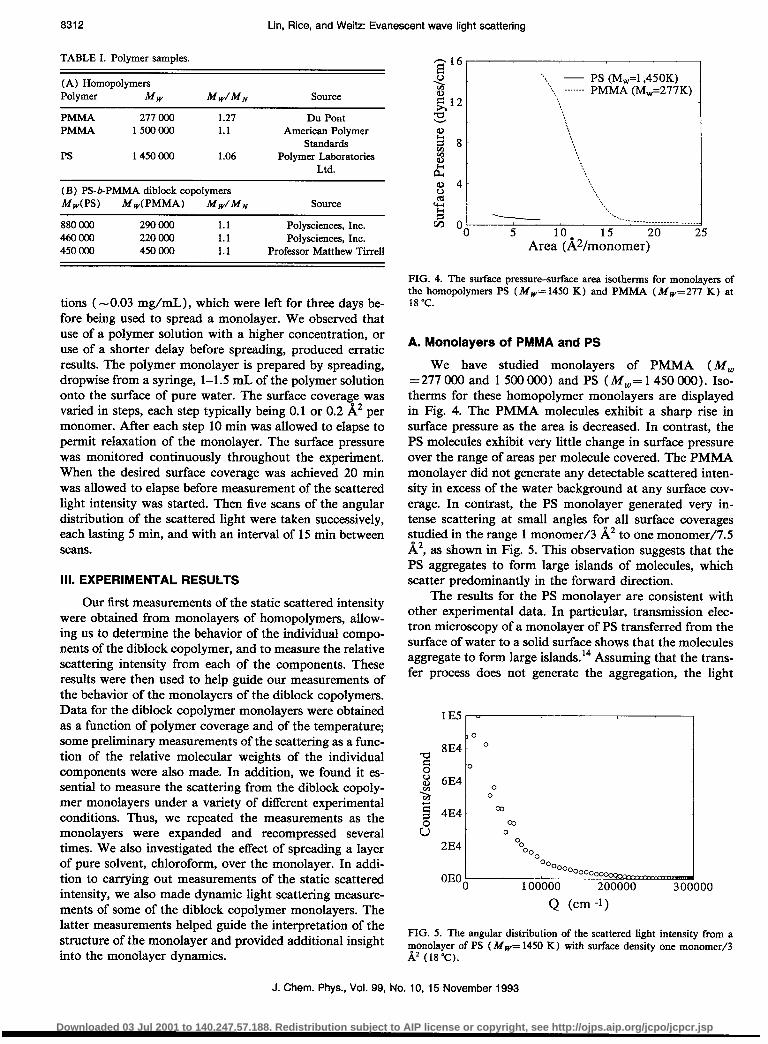
PIG. 4. The surface pressure-sutface area isotherms for monolayers of the homopolymers PS (M,= 1450 K) and PMMA (M,=277 K) at 18°C.
A. Monolayers of PMMA and PS
III. EXPERIMENTAL RESULTS
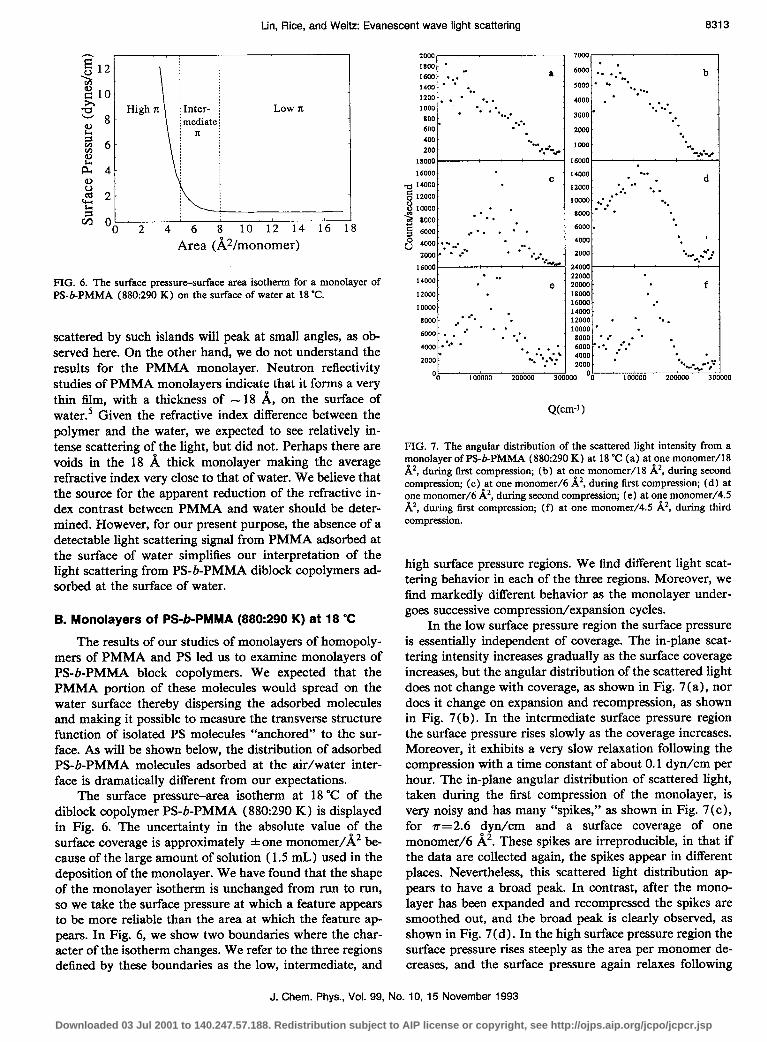
We have studied monolayers of PMMA (M, =277 000 and 1 500 000) and PS (M,= 1450 000). Iso- therms for these homopolymer monolayers are displayed in Fig. 4. The PMMA molecules exhibit a sharp rise in surface pressure as the area is decreased. In contrast, the PS molecules exhibit very little change in surface pressure over the range of areas per molecule covered. The PMMA monolayer did not generate any detectable scattered inten- sity in excess of the water background at any surface cov- erage. In contrast, the PS monolayer generated very in- tense scattering at small angles for all surface coverages studied in the range 1 monomer/3 A2 to one monomer/7.5 A*, as shown in Fig. 5. This observation suggests that the PS aggregates to form large islands of molecules, which scatter predominantly in the forward direction.
Our first measurements of the static scattered intensity were obtained from monolayers of homopolymers, allow- ing us to determine the behavior of the individual compo- nents of the diblock copolymer, and to measure the relative scattering intensity from each of the components. These results were then used to help guide our measurements of the behavior of the monolayers of the diblock copolymers. Data for the diblock copolymer monolayers were obtained as a function of polymer coverage and of the temperature; some preliminary measurements of the scattering as a func- tion of the relative molecular weights of the individual components were also made. In addition, we found it es- sential to measure the scattering from the diblock copoly- mer monolayers under a variety of different experimental conditions. Thus, we repeated the measurements as the monolayers were expanded and recompressed several times. We also investigated the effect of spreading a layer of pure solvent, chloroform, over the monolayer. In addi- tion to carrying out measurements of the static scattered intensity, we also made dynamic light scattering measure- ments of some of the diblock copolymer monolayers. The latter measurements helped guide the interpretation of the structure of the monolayer and provided additional insight into the monolayer dynamics.
The results for the PS monolayer are consistent with other experimental data. In particular, transmission elec- tron microscopy of a monolayer of PS transferred from the surface of water to a solid surface shows that the molecules aggregate to form large islands.14 Assuming that the trans- fer process does not generate the aggregation, the light
PIG. 5. The angular distribution of the scattered light intensity from a monolayer of PS ( Mw= 1450 K) with surface density one monomer/3 AZ (18’C).
‘l* , - PS (M,=l,450K) ’ ------- PMMA (M,=277K) ‘l,
Q (cm -l> loo0
J. Chem. Phys., Vol. 99, No. 10, 15 November 1993
Downloaded 03 Jul 2001 to 140.247.57.188. Redistribution subject to AIP license or copyright, see http://ojps.aip.org/jcpo/jcpcr.jsp
Lin, Rice, and Weitz: Evanescent wave light scattering 8313
23 2 IO-
-ah Z8
High IL !Inter- 1 Low n
s 3 6- 2
a 4 z
(=f 2 !3
m 0 0 2 4 6 8 10 12 14 16
Area (AZ/monomer) 18
PIG. 6. The surface pressure-surface area isotherm for a monolayer of PS-b-PMMA (880:290 K) on the surface of water at 18 “C.
scattered by such islands will peak at small angles, as ob- served here. On the other hand, we do not understand the results for the PMMA monolayer. Neutron reflectivity studies of PMMA monolayers indicate that it forms a very thin film, with a thickness of - 18 A, on the surface of water.’ Given the refractive index difference between the polymer and the water, we expected to see relatively in- tense scattering of the light, but did not. Perhaps there are voids in the 18 A thick monolayer making the average refractive index very close to that of water. We believe that the source for the apparent reduction of the refractive in- dex contrast between PMMA and water should be deter- mined. However, for our present purpose, the absence of a detectable light scattering signal from PMMA adsorbed at the surface of water simplifies our interpretation of the light scattering from PS-b-PMMA diblock copolymers ad- sorbed at the surface of water.
B. Monolayers of PS-bPMMA (880:290 K) at 18 “C
The results of our studies of monolayers of homopoly- mers of PMMA and PS led us to examine monolayers of PS-b-PMMA block copolymers. We expected that the PMMA portion of these molecules would spread on the water surface thereby dispersing the adsorbed molecules and making it possible to measure the transverse structure function of isolated PS molecules “anchored” to the sur- face. As will be shown below, the distribution of adsorbed PS-b-PMMA molecules adsorbed at the air/water inter- face is dramatically different from our expectations.
The surface pressurearea isotherm at 18 “C of the diblock copolymer PS-b-PMMA (880:290 K) is displayed in Fig. 6. The uncertainty in the absolute value of the surface coverage is approximately f one monomer/A’ be- cause of the large amount of solution ( 1.5 mL) used in the deposition of the monolayer. We have found that the shape of the monolayer isotherm is unchanged from run to run, so we take the surface pressure at which a feature appears to be more reliable than the area at which the feature ap- pears. In Fig. 6, we show two boundaries where the char- acter of the isotherm changes. We refer to the three regions defined by these boundaries as the low, intermediate, and
a
16000t * c-
8 6ooc- ..*. . * .
" 4ooa ..s-s. . a* .
2m- . ..- . * a***.
16000 : : 2-r., :
14000 - . . . e :
*2000- .
*oow- . . 8000 . . - --* .
6OCW . . -' * . .
400+:.* - . -*- .
.
2000 -- .* . .
..*-.*.%y
OO 100000 2oooc4 3OOoc
14000 . . . * . d
12000- *. -- *.-. -. .
lOoa- ;;
woo.' * -
22ow
t
. ZOO00 . f lw3oo . 16030 *- Mod 12000- . - 10000 .- . loo0 * I . * 6000 '.-. :': 4000. - ZOOO- .
** .
. . . . -. .y
‘-...A -- 8 lo Ob
I 100000 2OOOm 3ooc 100
Q(cm-l )
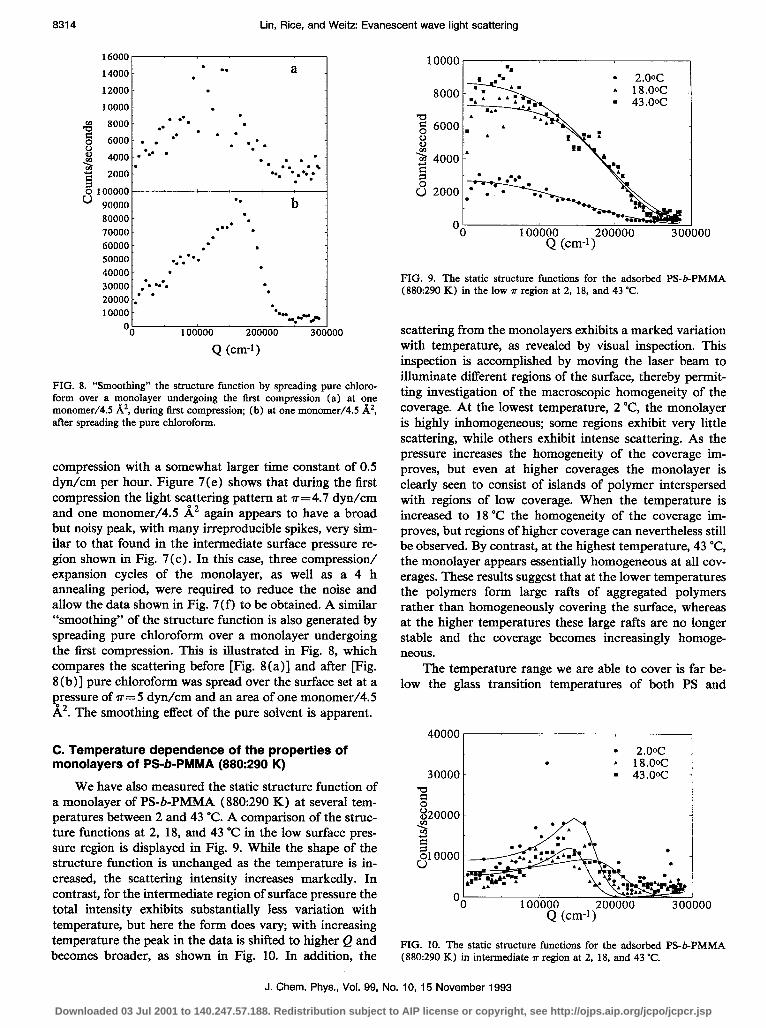
FIG. 7. The angular distribution of the scattered light intensity from a monolayer of PS-b-PMMA (880~290 K) at 18 “C (a) at one monomer/l8 A*, during frrst compression; (b) at one monomer/l8 A’, during second compression; (c) at one monomer/6 A*, during first compression; (d) at one monomer/6 A*, during second compression; (e) at one monomerY4.5 A’, during ftrst compression; (f) at one monomer/4.5 A*, during third compression.
high surface pressure regions. We find different light scat- tering behavior in each of the three regions. Moreover, we find markedly different behavior as the monolayer under- goes successive compression/expansion cycles.
In the low surface pressure region the surface pressure is essentially independent of coverage. The in-plane scat- tering intensity increases gradually as the surface coverage increases, but the angular distribution of the scattered light does not change with coverage, as shown in Fig. 7(a), nor does it change on expansion and recompression, as shown in Fig. 7 (b) . In the intermediate surface pressure region the surface pressure rises slowly as the coverage increases. Moreover, it exhibits a very slow relaxation following the compression with a time constant of about 0.1 dyn/cm per hour. The in-plane angular distribution of scattered light, taken during the first compression of the monolayer, is very noisy and has many “spikes,” as shown in Fig. 7 (c), for rr=2.6 dyn/cm and a surface coverage of one monomer/6 A2. These spikes are irreproducible, in that if the data are collected again, the spikes appear in different places. Nevertheless, this scattered light distribution ap- pears to have a broad peak. In contrast, after the mono- layer has been expanded and recompressed the spikes are smoothed out, and the broad peak is clearly observed, as shown in Fig. 7 (d). In the high surface pressure region the surface pressure rises steeply as the area per monomer de- creases, and the surface pressure again relaxes following
J. Chem. Phys., Vol. 99, No. 10, 15 November 1993
Downloaded 03 Jul 2001 to 140.247.57.188. Redistribution subject to AIP license or copyright, see http://ojps.aip.org/jcpo/jcpcr.jsp
8314 tin, Rice, and Weitz Evanescent wave light scattering
12000- .
10000 . . 4 l 8000. .- l ** l .
g 6000. . . l ’ . .
$ . 0.. . 2
-**** l
4000 2000 -*
. _
l l : . l
0% l .s. -
. l ,
g . 100000
v 90000~ l . b 80000-
. . 70000- .*** .
. 60000- . . . 50000- . l . l 0. .
40000~ l
.
30000 :* l *-- . 20000 -: l
. .
10000- *="
OO -.-"P
100000 200000 300000
Q (cm-l)
FIG. 8. “Smoothing” the structure function by spreading pure chloro- form over a monolayer undergoing the first compression (a) at one monometY4.5 A*, during first compression; (b) at one monomerY4.5 A’, after spreading the pure chloroform.
compression with a somewhat larger time constant of 0.5 dyn/cm per hour. Figure 7(e) shows that during the first compression the light scattering pattern at n=4.7 dyn/cm and one monomer/45 A2 again appears to have a broad but noisy peak, with many h-reproducible spikes, very sim- ilar to that found in the intermediate surface pressure re- gion shown in Fig. 7 (c) . In this case, three compression/ expansion cycles of the monolayer, as well as a 4 h annealing period, were required to reduce the noise and allow the data shown in Fig. 7(f) to be obtained. A similar “smoothing” of the structure function is also generated by spreading pure chloroform over a monolayer undergoing the first compression. This is illustrated in Fig. 8, which compares the scattering before [Fig. 8(a)] and after [Fig. 8(b)] pure chloroform was spread over the surface set at a pressure of V= 5 dyn/cm and an area of one monomerY4.5 A2. The smoothing effect of the pure solvent is apparent.
C. Temperature dependence of the properties of monolayers of PS-b-PMMA (880:290 K)
We have also measured the static structure function of a monolayer of PS-b-PMMA (880:290 K) at several tem- peratures between 2 and 43 “C. A comparison of the struc- ture functions at 2, 18, and 43 “C! in the low surface pres- sure region is displayed in Fig. 9. While the shape of the structure function is unchanged aa the temperature is in- creased, the scattering intensity increases markedly. In contrast, for the intermediate region of surface pressure the total intensity exhibits substantially less variation with temperature, but here the form does vary; with increasing temperature the peak in the data is shifted to higher Q and becomes broader, as shown in Fig. 10. In addition, the
FIG. 9. The static structure functions for the adsorbed PS-b-PMMA (880:290 K) in the low T region at 2, 18, and 43 “C.
scattering from the monolayers exhibits a marked variation with temperature, as revealed by visual inspection. This inspection is accomplished by moving the laser beam to illuminate different regions of the surface, thereby permit- ting investigation of the macroscopic homogeneity of the coverage. At the lowest temperature, 2 “C!, the monolayer is highly inhomogeneous; some regions exhibit very little scattering, while others exhibit intense scattering. As the pressure increases the homogeneity of the coverage im- proves, but even at higher coverages the monolayer is clearly seen to consist of islands of polymer interspersed with regions of low coverage. When the temperature is increased to 18 “C the homogeneity of the coverage im- proves, but regions of higher coverage can nevertheless still be observed. By contrast, at the highest temperature, 43 “C!, the monolayer appears essentially homogeneous at all cov- erages. These results suggest that at the lower temperatures the polymers form large rafts of aggregated polymers rather than homogeneously covering the surface, whereas at the higher temperatures these large rafts are no longer stable and the coverage becomes increasingly homoge- neous.
The temperature range we are able to cover is far be- low the glass transition temperatures of both PS and
~~~~~~~:
0 100000 200000 300000 Q (cm-l)
FIG. 10. The static structure functions for the adsorbed PS-b-PMMA (880:290 K) in intermediate T region at 2, 18, and 43 “C.
J. Chem. Phys., Vol. 99, No. 10, 15 November 1993
Downloaded 03 Jul 2001 to 140.247.57.188. Redistribution subject to AIP license or copyright, see http://ojps.aip.org/jcpo/jcpcr.jsp
Lin, Rice, and Weitz: Evanescent wave light scattering 8315
PMMA. Thus our results may be consistent with the monolayer being in a long lived metastable state, rather than a true equilibrium state.
D. Dynamic light scattering from monolayers of PS- bPMMA (880:290 K) at 18 “C
Dynamic light scattering (DLS) measurements were carried out on monolayers of PS-b-PMMA at surface cov- erages of one monomerYl3.0 A2, one monomerY9.0 A2, one monomer/6.0 A’, and one monomer/4.5 A2 during both the first and second compressions. In the low surface pres- sure range the measurements were made at scattering an- gles, 4, of 50”, 90”, and 120” (for one monomerYl3.0 A2) or 170” (for one monomer/9 A2). The corresponding scatter- ing vectors, Q,, are 1.2~10~,2.1~10~,2.5~10~, and 2.9 X lo’, cm-‘, respectively. At a coverage of one monomer/ 4.5 A2 measurements were also made after pure solvent was spread over the film. Both the autocorrelation function of the temporal fluctuations of the scattered intensity, gt2’( r), as well as the time averaged scattered intensity, were recorded simultaneously during these measurements.
The measured intensity autocorrelation function is re- lated to the square of the field correlation function through the Siegert relationship13
g@)(7) +?I g(l)(7) 12+ 1 , (16)
where fi is an experimentally determined constant reflect- ing the number of coherence areas subtended by the detec- tor. It is more convenient to consider the field correlation function, which can be obtained from the measured inten- sity autocorrelation function by inverting Eq. ( 16):
g(l)(r) = ljgi2)o-L. (17)
For an ensemble of identical diffusing particles the field autocorrelation function assumes the particularly simple form
g(‘)(r)=exp( -OQ2r) , (18)
where D is the diffusion coefficient of the particles. To display our DLS data we plot the normalized field
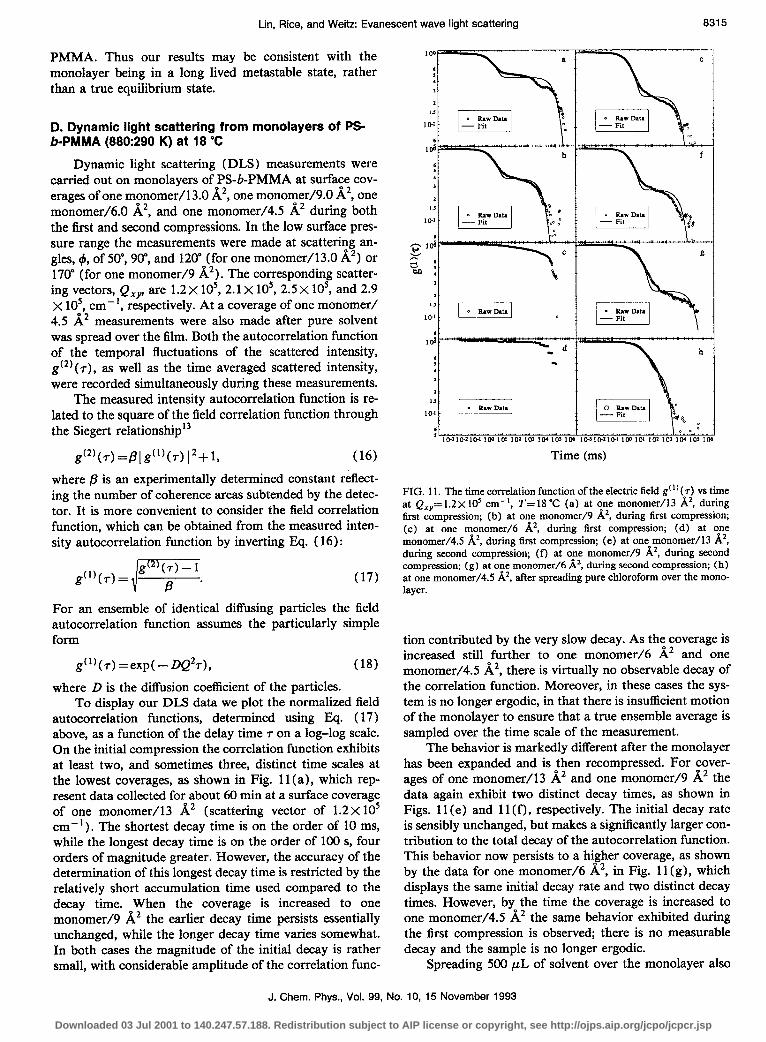
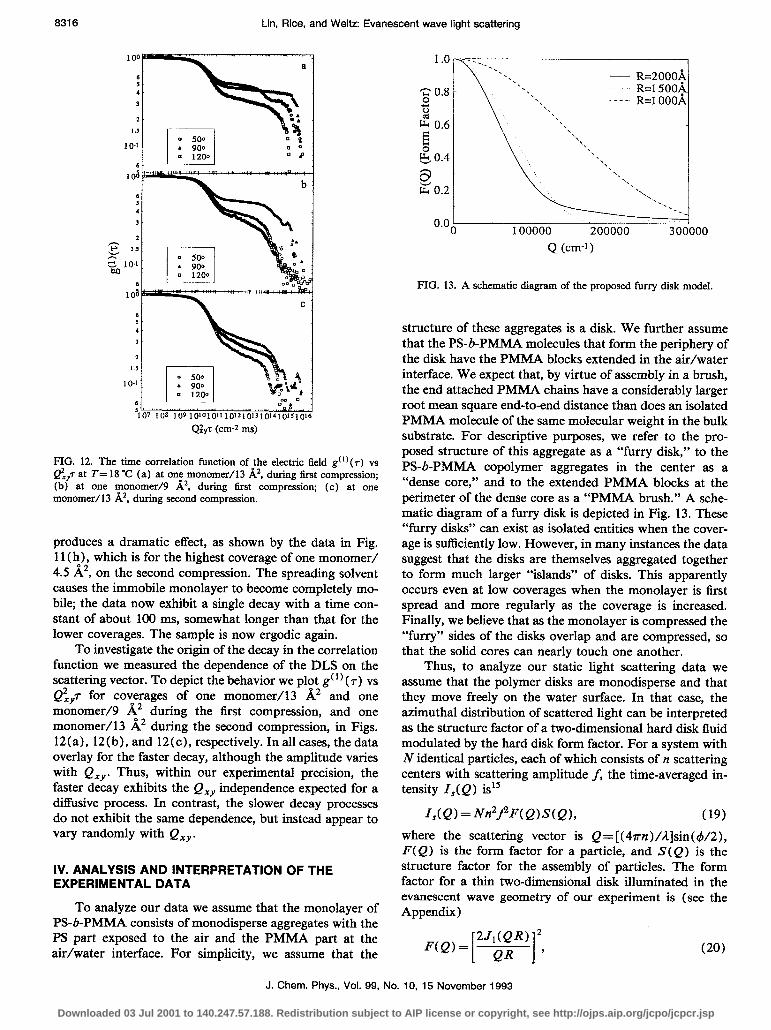
autocorrelation functions, determined using Eq. ( 17) above, as a function of the delay time r on a log-log scale. On the initial compression the correlation function exhibits at least two, and sometimes three, distinct time scales at the lowest coverages, as shown in Fig. 11 (a), which rep- resent data collected for about 60 min at a surface coverage of one monomer/l3 A2 (scattering vector of 1.2 X 10’ cm-‘). The shortest decay time is on the order of 10 ms, while the longest decay time is on the order of 100 s, four orders of magnitude greater. However, the accuracy of the determination of this longest decay time is restricted by the relatively short accumulation time used compared to the decay time. When the coverage is increased to one monomer/9 A2 the earlier decay time persists essentially unchanged, while the longer decay time varies somewhat. In both cases the magnitude of the initial decay is rather small, with considerable amplitude of the correlation func-
Time (ms)
FIG. 11. The time correlation function of the electric field g( ‘) (7) vs time at Qry= 1.2~ lo5 cm-‘, T=18 ‘C (a) at one monomer/l3 A’, during first compression; (b) at one monomer/9 A*, during first compression; (c) at one monomer/6 AZ, during first compression; (d) at one monomerY4.5 A*, during tirst compression; (e) at one monomer/l3 A*, during second compression; (f) at one monomer/9 A’, during second compression; (g) at one monomer/6 A2, during second compression; (h) at one monomer/4.5 b;*, after spreading pure chloroform over the mono- layer.
tion contributed by the very slow decay. As the coverage is increased still further to one monomer/6 A2 and one monomerY4.5 A2, there is virtually no observable decay of the correlation function. Moreover, in these cases the sys- tem is no longer ergodic, in that there is insufficient motion of the monolayer to ensure that a true ensemble average is sampled over the time scale of the measurement.
The behavior is markedly different after the monolayer has been expanded and is then recompressed. For cover- ages of one monomer/l3 A2 and one monomer/9 A2 the data again exhibit two distinct decay times, as shown in Figs. 11 (e) and 11 (f), respectively. The initial decay rate is sensibly unchanged, but makes a significantly larger con- tribution to the total decay of the autocorrelation function. This behavior now persists to a higher coverage, as shown by the data for one monomer/6 A’, in Fig. 11 (g), which displays the same initial decay rate and two distinct decay times. However, by the time the coverage is increased to one monomerY4.5 A2 the same behavior exhibited during the first compression is observed; there is no measurable decay and the sample is no longer ergodic.
Spreading 500 PL of solvent over the monolayer also
J. Chem. Phys., Vol. 99, No. 10, 15 November 1993
Downloaded 03 Jul 2001 to 140.247.57.188. Redistribution subject to AIP license or copyright, see http://ojps.aip.org/jcpo/jcpcr.jsp
8318
Q&z (cm* ms)
FIG. 12. The time correlation function of the electric field g(‘)(T) vs Q$ at T= 18 ‘C (a) at one monomer/l3 A’, during tirst compression; (b) at one monomer/9 AZ, during first compression; (c) at one monomer/ 13 A’, during second compression.
produces a dramatic effect, as shown by the data in Fig. 11 (h), which is for the highest coverage of one monomer/ 4.5 A’, on the second compression. The spreading solvent causes the immobile monolayer to become completely mo- bile; the data now exhibit a single decay with a time con- stant of about 100 ms, somewhat longer than that for the lower coverages. The sample is now ergodic again.
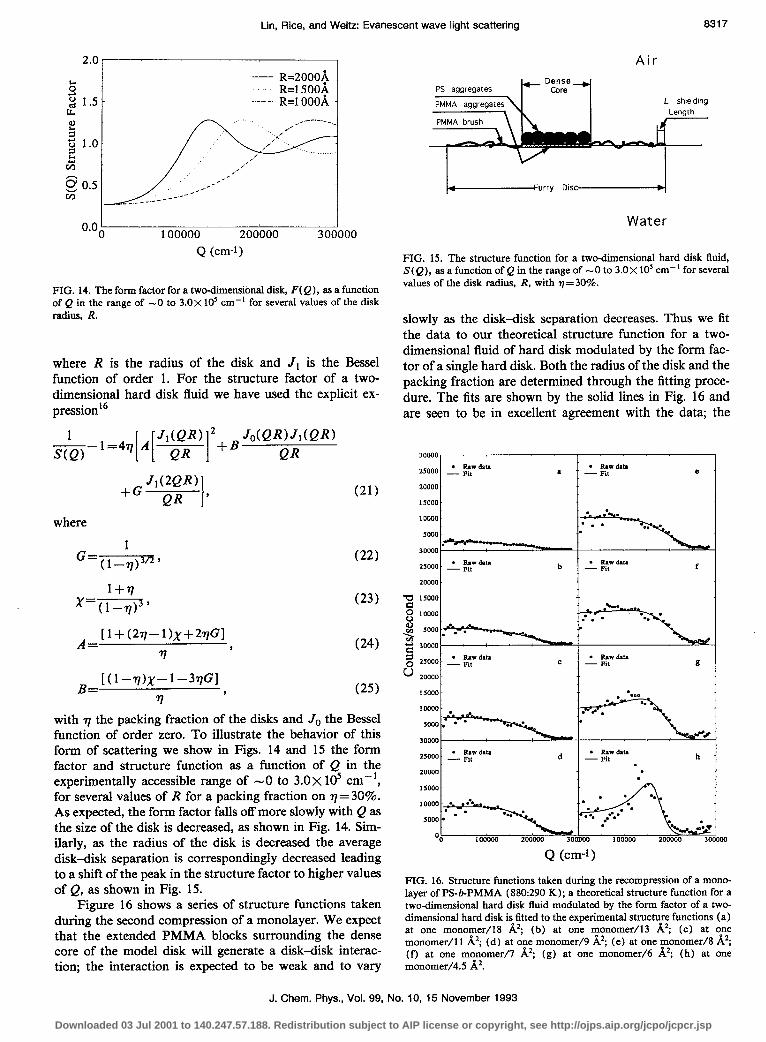
To investigate the origin of the decay in the correlation function we measured the dependence of the DLS on the scattering vector. To depict the behavior we plot g(l) (T) vs Q”,,,r for coverages of one monomer/l3 A2 and one monomer/9 A2 during the first compression, and one monomer/l3 A2 during the second compression, in Figs. 12(a), 12(b), and 12(c), respectively. In all cases, the data overlay for the faster decay, although the amplitude varies with QXY. Thus, within our experimental precision, the faster decay exhibits the QXY independence expected for a diffusive process. In contrast, the slower decay processes do not exhibit the same dependence, but instead appear to vary randomly with QXy .
IV. ANALYSIS AND INTERPRETATION OF THE EXPERIMENTAL DATA
To analyze our data we assume that the monolayer of PS-b-PMMA consists of monodisperse aggregates with the PS part exposed to the air and the PMMA part at the air/water interface. For simplicity, we assume that the
Lin, Rice, and We&: Evanescent wave light scattering
- R=2000A R=l5OO,k
.___ R=l OOOA
Q (cm-l>
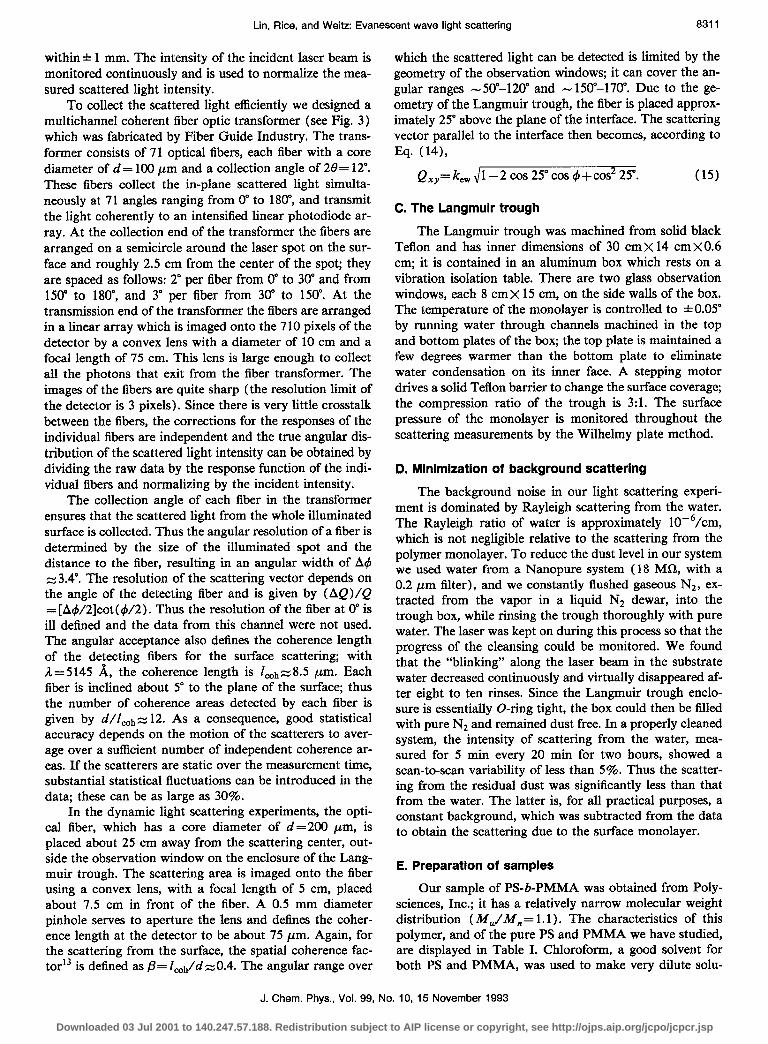
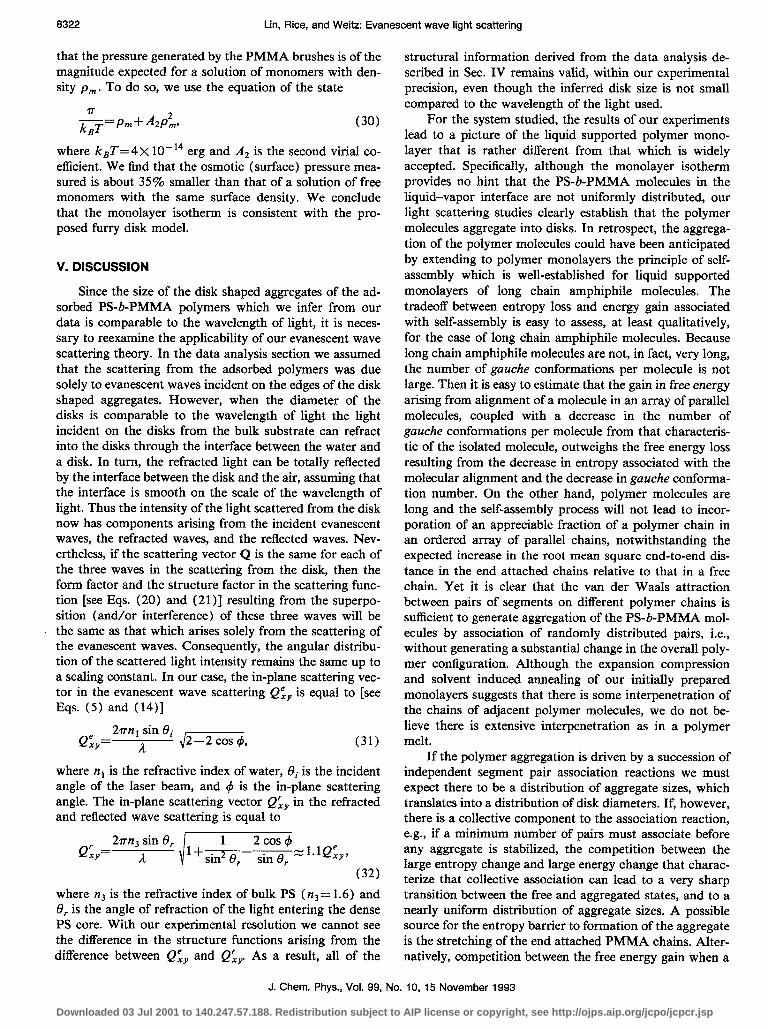
FIG. 13. A schematic diagram of the proposed furry disk model.
structure of these aggregates is a disk. We further assume that the PS-b-PMMA molecules that form the periphery of the disk have the PMMA blocks extended in the air/water interface. We expect that, by virtue of assembly in a brush, the end attached PMMA chains have a considerably larger root mean square end-to-end distance than does an isolated PMMA molecule of the same molecular weight in the bulk substrate. For descriptive purposes, we refer to the pro- posed structure of this aggregate as a “furry disk,” to the PS-b-PMMA copolymer aggregates in the center as a “dense core,” and to the extended PMMA blocks at the perimeter of the dense core as a “PMMA brush.” A sche- matic diagram of a furry disk is depicted in Fig. 13. These “furry disks” can exist as isolated entities when the cover- age is sufficiently low. However, in many instances the data suggest that the disks are themselves aggregated together to form much larger “islands” of disks. This apparently occurs even at low coverages when the monolayer is first spread and more regularly as the coverage is increased. Finally, we believe that as the monolayer is compressed the “furry” sides of the disks overlap and are compressed, so that the solid cores can nearly touch one another.
Thus, to analyze our static light scattering data we assume that the polymer disks are monodisperse and that they move freely on the water surface. In that case, the azimuthal distribution of scattered light can be interpreted as the structure factor of a two-dimensional hard disk fluid modulated by the hard disk form factor. For a system with N identical particles, each of which consists of n scattering centers with scattering amplitude f, the time-averaged in- tensity I,(Q) is”
4(e) = N~YF(Q)s(Q), (19) where the scattering vector is Q = [ ( 4m ) /Alsin (#/2), F(Q) is the form factor for a particle, and S(Q) is the structure factor for the assembly of particles. The form factor for a thin two-dimensional disk illuminated in the evanescent wave geometry of our experiment is (see the Appendix)
2J1(QR) 2 F(Q)= QR , 1 1 (20)
J. Chem. Phys., Vol. 99, No. IO, 15 November 1993
Downloaded 03 Jul 2001 to 140.247.57.188. Redistribution subject to AIP license or copyright, see http://ojps.aip.org/jcpo/jcpcr.jsp
Lin, Rice, and Weitz: Evanescent wave light scattering 8317
2.0, I Air - R=2000A
~=150oA .___. R=l oooA
0.0; 100000 200000 300000
Q (cm-1>
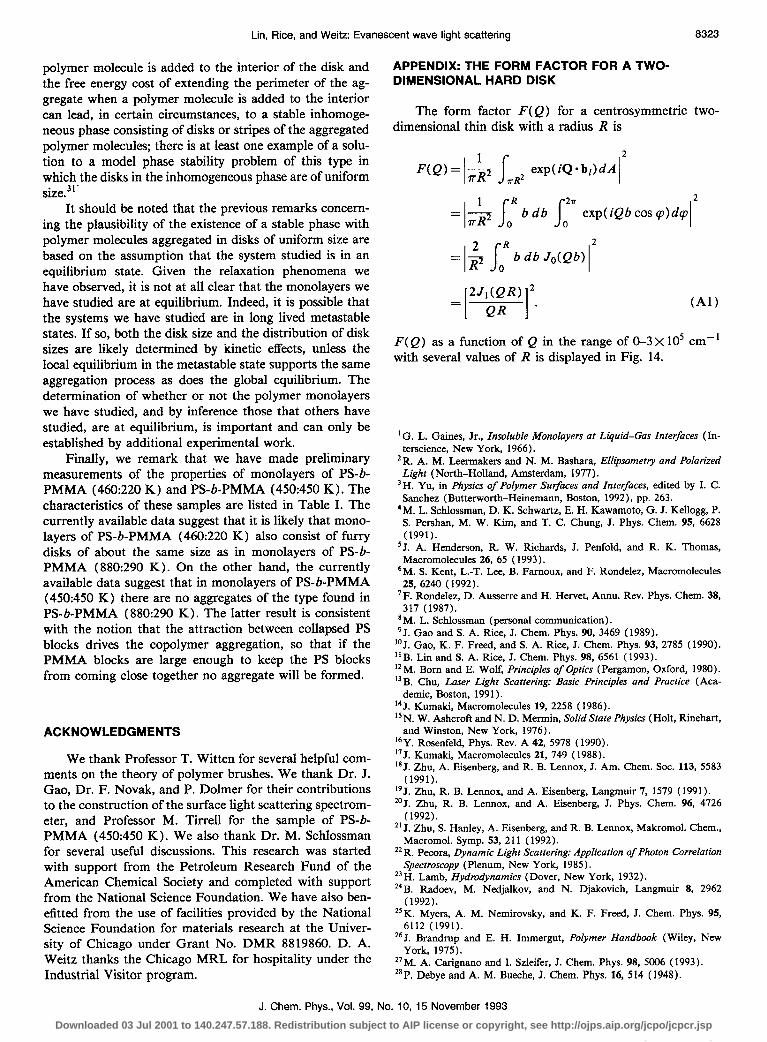
FIG. 14. The form factor for a two-dimensional disk, F(Q), as a function of Q in the range of -0 to 3.0~ lo5 cm-* for several values of the disk radius, R.
where R is the radius of the disk and J1 is the Bessel function of order 1. For the structure factor of a two- dimensional hard disk fluid we have used the explicit ex- pressiont6
JIUQR) +G QR ’ (21)
where
1 G=(l-Tp (22)
1+rl X=(1-#
A=[1+(277--1)x+Wl , (24)
71
BJU-77W-331Gl , (25)
rl with 77 the packing fraction of the disks and Jo the Bessel function of order zero. To illustrate the behavior of this form of scattering we show in Figs. 14 and 15 the form factor and structure function as a function of Q in the experimentally accessible range of -0 to 3.0~ lo5 cm-‘, for several values of R for a packing fraction on 7 = 30%. As expected, the form factor falls off more slowly with Q as the size of the disk is decreased, as shown in Fig. 14. Sim- ilarly, as the radius of the disk is decreased the average disk-disk separation is correspondingly decreased leading to a shift of the peak in the structure factor to higher values of Q, as shown in Fig. 15.
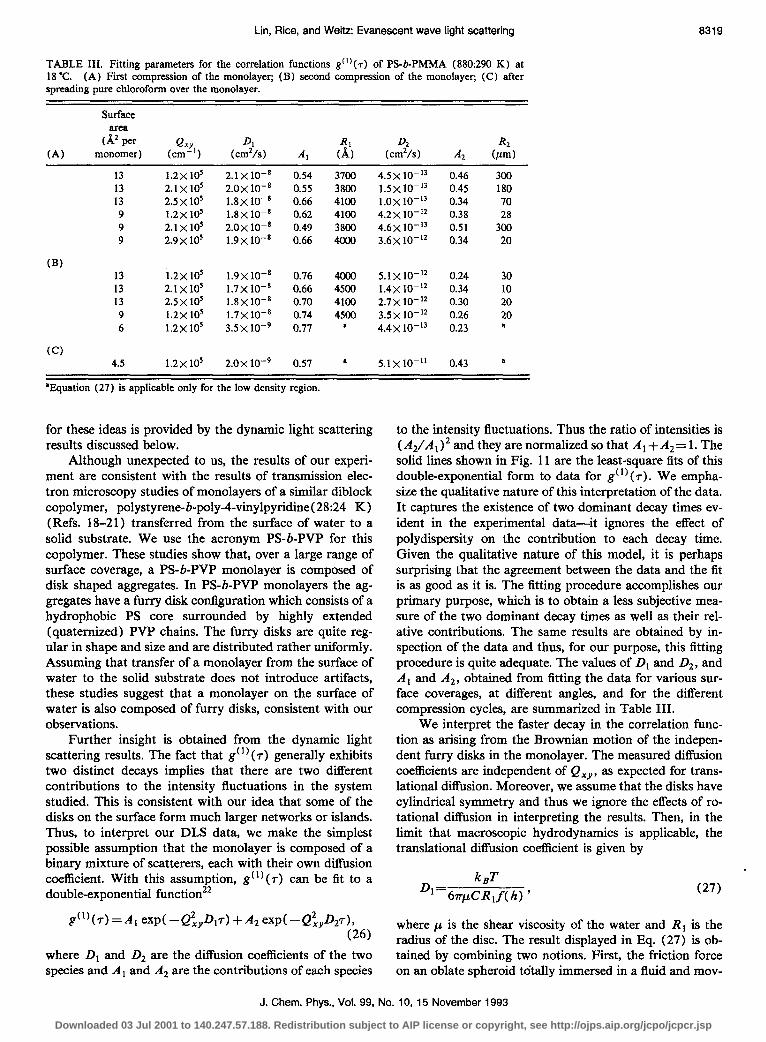
Figure 16 shows a series of structure functions taken during the second compression of a monolayer. We expect that the extended PMMA blocks surrounding the dense core of the model disk will generate a disk-disk interac- tion; the interaction is expected to be weak and to vary
L shieldmg
Water
FIG. 15. The structure function for a two-dimensional hard disk fluid, S(Q), as a function of Q in the range of -0 to 3.0x lo5 cm-’ for several values of the disk radius, R, with 7=30%.
slowly as the disk-disk separation decreases. Thus we fit the data to our theoretical structure function for a two- dimensional fluid of hard disk modulated by the form fac- tor of a single hard disk. Both the radius of the disk and the packing fraction are determined through the fitting proce- dure. The fits are shown by the solid lines in Fig. 16 and are seen to be in excellent agreement with the data; the
. aawdau 25cm~ - Fit 2oM)o
d . Rawdata - Fit h
. .
K)
Q (cm-i> FIG. 16. Structure functions taken during the recompression of a mono- layer of PS-b-PMMA (880:290 K); a theoretical structure function for a two-dimensional hard disk fluid modulated by the form factor of a two- dimensional hard disk is fitted to the experimental structure functions (a) at one monomer/l8 A2; (b) at one monomer/l3 A*; (c) at one monomer/l 1 A*; (d) at one monomer/9 A*; (e) at one monomer/8 A’; (f) at one monomer/7 A2; (g) at one monomer/6 A*; (h) at one monomer/4.5 6;‘.
J. Chem. Phys., Vol. 99, No. 10, 15 November 1993
Downloaded 03 Jul 2001 to 140.247.57.188. Redistribution subject to AIP license or copyright, see http://ojps.aip.org/jcpo/jcpcr.jsp
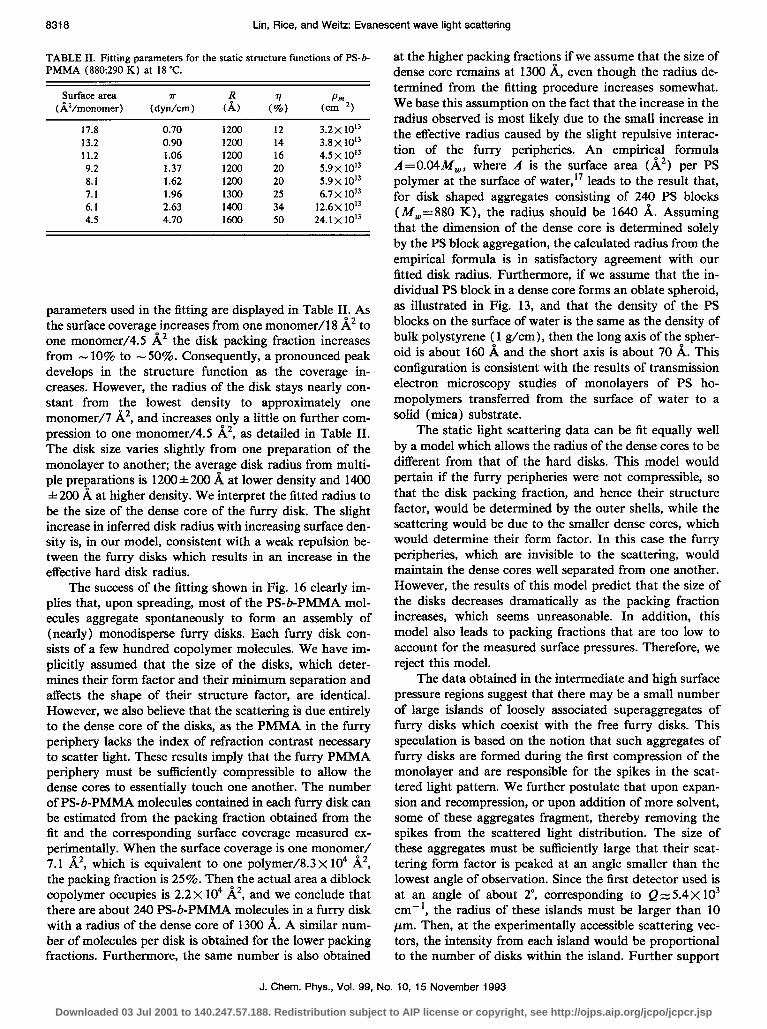
TABLE II. Fitting parameters for the static structure functions of PS-b- PMMA (880~290 K) at 18 “C.
Surface area (AZ/monomer) (dyn?m)
Pm (Clc2)
17.8 0.70 12cu 12 3.2~ lOI 13.2 0.90 1200 14 3.8 x lOI3 11.2 1.06 1200 16 4.5 x 10’3 9.2 1.37 1200 20 5.9x 10’3 8.1 1.62 1200 20 5.9x 10’3 7.1 1.96 1300 25 6.7~ 10” 6.1 2.63 1400 34 12.6x 10” 4.5 4.70 1600 50 24.1 x lOI
parameters used in the fitting are displayed in Table II. As the surface coverage increases from one monomer/l 8 A2 to one monomeiY4.5 A2 the disk packing fraction increases from - 10% to - 50%. Consequently, a pronounced peak develops in the structure function as the coverage in- creases. However, the radius of the disk stays nearly con- stant from the lowest density to approximately one monomer/7 AZ, and increases only a little on further com- pression to one monomerY4.5 A’, as detailed in Table II. The disk size varies slightly from one preparation of the monolayer to another; the averfge disk radius from multi- ple preparations is 1200*200 A at lower density and 1400 f 200 A at higher density. We interpret the fitted radius to be the size of the dense core of the furry disk. The slight increase in inferred disk radius with increasing surface den- sity is, in our model, consistent with a weak repulsion be- tween the furry disks which results in an increase in the effective hard disk radius.
The success of the fitting shown in Fig. 16 clearly im- plies that, upon spreading, most of the PS-b-PMMA mol- ecules aggregate spontaneously to form an assembly of (nearly) monodisperse furry disks. Each furry disk con- sists of a few hundred copolymer molecules. We have im- plicitly assumed that the size of the disks, which deter- mines their form factor and their minimum separation and affects the shape of their structure factor, are identical. However, we also believe that the scattering is due entirely to the dense core of the disks, as the PMMA in the furry periphery lacks the index of refraction contrast necessary to scatter light. These results imply that the furry PMMA periphery must be sufficiently compressible to allow the dense cores to essentially touch one another. The number of PS-b-PMMA molecules contained in each furry disk can be estimated from the packing fraction obtained from the fit and the corresponding surface coverage measured ex- perimentally. When the surface coverage is one monomer/ 7.1 A’, which is equivalent to one polymerY8.3 X lo4 A2, the packing fraction is 25%. Then the actual area a diblock copolymer occupies is 2.2X IO4 A’, and we conclude that there are about 240 PS-b-PMMA molecules in a furry disk with a radius of the dense core of 1300 A. A similar num- ber of molecules per disk is obtained for the lower packing fractions. Furthermore, the same number is also obtained
8318 Lin, Rice, and Weitz: Evanescent wave light scattering
at the higher packing fractions if we assume that the size of dense core remains at 1300 A, even though the radius de- termined from the fitting procedure increases somewhat. We base this assumption on the fact that the increase in the radius observed is most likely due to the small increase in the effective radius caused by the slight repulsive interac- tion of the furry peripheries. An empirical formula A =0.04&f,, where A is the surface area (A’) per PS polymer at the surface of water,” leads to the result that, for disk shaped aggregates consisting of 240 PS blocks (M,=880 K), the radius should be 1640 A. Assuming that the dimension of the dense core is determined solely by the PS block aggregation, the calculated radius from the empirical formula is in satisfactory agreement with our fitted disk radius. Furthermore, if we assume that the in- dividual PS block in a dense core forms an oblate spheroid, as illustrated in Fig. 13, and that the density of the PS blocks on the surface of water is the same as the density of bulk polystyrene ( 1 g/cm), then the long axis of the spher- oid is about 160 A and the short axis is about 70 A. This configuration is consistent with the results of transmission electron microscopy studies of monolayers of PS ho- mopolymers transferred from the surface of water to a solid (mica) substrate.
The static light scattering data can be fit equally well by a model which allows the radius of the dense cores to be different from that of the hard disks. This model would pertain if the furry peripheries were not compressible, so that the disk packing fraction, and hence their structure factor, would be determined by the outer shells, while the scattering would be due to the smaller dense cores, which would determine their form factor. In this case the furry peripheries, which are invisible to the scattering, would maintain the dense cores well separated from one another. However, the results of this model predict that the size of the disks decreases dramatically as the packing fraction increases, which seems unreasonable. In addition, this model also leads to packing fractions that are too low to account for the measured surface pressures. Therefore, we reject this model.
The data obtained in the intermediate and high surface pressure regions suggest that there may be a small number of large islands of loosely associated superaggregates of furry disks which coexist with the free furry disks. This speculation is baaed on the notion that such aggregates of furry disks are formed during the first compression of the monolayer and are responsible for the spikes in the scat- tered light pattern. We further postulate that upon expan- sion and recompression, or upon addition of more solvent, some of these aggregates fragment, thereby removing the spikes from the scattered light distribution. The size of these aggregates must be sufficiently large that their scat- tering form factor is peaked at an angle smaller than the lowest angle of observation. Since the first detector used is at an angle of about 2”, corresponding to QZ 5.4~ lo3 cm-‘, the radius of these islands must be larger than 10 pm. Then, at the experimentally accessible scattering vec- tors, the intensity from each island would be proportional to the number of disks within the island. Further support
J. Chem. Phys., Vol. 99, No. 10, 15 November 1993
Downloaded 03 Jul 2001 to 140.247.57.188. Redistribution subject to AIP license or copyright, see http://ojps.aip.org/jcpo/jcpcr.jsp
Lin, Rice, and Weitz: Evanescent wave light scattering 8319
TABLE III. Fitting parameters for the correlation functions g(i)(r) of PS-b-PMMA (880:290 K) at 18 ‘C. (A) First compression of the monolayer; (B) second compression of the monolayer; (C) after spreading pure chloroform over the monolayer.
(A)
Surface
(Gapr monomer)
Q (cmx-y’)
D, 9 ( cm2/s) Al (cm2/s) A2
13 1.2x 10s 2.1 x 10-s 0.54 3700 4.5x 10-I’ 0.46 300 13 2.1x10’ 2.0x 10⁻⁸ 0.55 3800 1.5x 10⁻¹³ 0.45 180 13 2.5 x IO5 1.8x lo-* 0.66 4100 1.0x lo-l3 0.34 70 9 1.2x lo5 1.8~ lo-” 0.62 4100 4.2~ lo-l2 0.38 28 9 2.1 x 10s 2.0x 10-S 0.49 3800 4.6~ 10-l’ 0.51 300 9 2.9 x 10’ 1.9x 10-S 0.66 4ml 3.6x lo-l2 0.34 20
(B) 13 i.2x 105 1.9x 10-S 0.76 4000 5*1x10-‘2 0.24 30 13 2.1x 10⁵ 1.7x 10-S 0.66 4500 1.4x IO-l2 0.34 10 13 2.5 x 10’ 1.8x lo-* 0.70 4100 2.7~ lo-l2 0.30 20 9 1.2x lo5 1.7x 10-S 0.74 4500 3.5 x lo-‘2 0.26 20 6 1.2x 10s 3.5 x 10-s 0.77 a 4.4x 10⁻¹³ 0.23 ’
(Cl 4.5 1.2x 10⁵ 2.0x 10-s 0.57 a 5.1x10-” 0.43 a
‘Equation (27) is applicable only for the low density repion.
for these ideas is provided by the dynamic light scattering results discussed below.
Although unexpected to us, the results of our experi- ment are consistent with the results of transmission elec- tron microscopy studies of monolayers of a similar diblock copolymer, polystyrene-b-poly+vinylpyridine( 28:24 K) (Refs. 18-21) transferred from the surface of water to a solid substrate. We use the acronym PS-b-PVP for this copolymer. These studies show that, over a large range of surface coverage, a PS-b-PVP monolayer is composed of disk shaped aggregates. In PS-b-PVP monolayers the ag- gregates have a furry disk configuration which consists of a hydrophobic PS core surrounded by highly extended (quatemized) PVP chains. The furry disks are quite reg- ular in shape and size and are distributed rather uniformly. Assuming that transfer of a monolayer from the surface of water to the solid substrate does not introduce artifacts, these studies suggest that a monolayer on the surface of water is also composed of furry disks, consistent with our observations.
Further insight is obtained from the dynamic light scattering results. The fact that g(l)(r) generally exhibits two distinct decays implies that there are two different contributions to the intensity fluctuations in the system studied. This is consistent with our idea that some of the disks on the surface form much larger networks or islands. Thus, to interpret our DLS data, we make the simplest possible assumption that the monolayer is composed of a binary mixture of scatterers, each with their own diffusion coefficient. With this assumption, g(l)(r) can be fit to a double-exponential function”
p(‘)(~) =A1 exp( -Q&,D17) +A, exp( -Q&&T), (26)
where D, and D2 are the diffusion coefficients of the two species and A, and A2 are the contributions of each species
to the intensity fluctuations. Thus the ratio of intensities is (AZ/Al)’ and they are normalized so that A,+ A,= 1. The solid lines shown in Fig. 11 are the least-square fits of this double-exponential form to data for g(l)(r). We empha- size the qualitative nature of this interpretation of the data. It captures the existence of two dominant decay times ev- ident in the experimental data-it ignores the effect of polydispersity on the contribution to each decay time. Given the qualitative nature of this model, it is perhaps surprising that the agreement between the data and the fit is as good as it is. The fitting procedure accomplishes our primary purpose, which is to obtain a less subjective mea- sure of the two dominant decay times as well as their rel- ative contributions. The same results are obtained by in- spection of the data and thus, for our purpose, this fitting procedure is quite adequate. The values of D1 and D2, and A, and A,, obtained from fitting the data for various sur- face coverages, at different angles, and for the different compression cycles, are summarized in Table III.
We interpret the faster decay in the correlation func- tion as arising from the Brownian motion of the indepen- dent furry disks in the monolayer. The measured diffusion coefficients are independent of QXy, as expected for trans- lational diffusion. Moreover, we assume that the disks have cylindrical symmetry and thus we ignore the effects of ro- tational diffusion in interpreting the results. Then, in the limit that macroscopic hydrodynamics is applicable, the translational diffusion coefficient is given by
(27)
where p is the shear viscosity of the water and RI is the radius of the disc. The result displayed in Eq. (27) is ob- tained by combining two notions. First, the friction force on an oblate spheroid totally immersed in a fluid and mov-
J. Chem. Phys., Vol. 99, No. 10, 15 November 1993
Downloaded 03 Jul 2001 to 140.247.57.188. Redistribution subject to AIP license or copyright, see http://ojps.aip.org/jcpo/jcpcr.jsp
8320 Lin, Rice, and Weitz: Evanescent wave light scattering
ing edgewise is reduced compared to a solid sphere of the same radius as a result of the modification in the flow patternz3 Thus the frictional force can be denoted by 6qCR I , where C is the amount of the reduction. For a thin disk C=O.57, which is the value we use here. Second, since the disk is confined to a surface, the frictional force is further reduced,24 again because of the modification of the flow fields. The fractional amount of this reduction, f(h), depends in a complex way both on the shape of the disk and on the fraction of the disk that is above the surface, h. While the value of f(h) is difficult to calculate exactly in the general case, symmetry arguments simplify the calcu- lation when the object has a plane of symmetry along the interface and is exactly half immersed in the fluid. In this case f(h) ~0.5, which is the value assumed here. Both effects serve to decrease the friction coefficient of the disk and thereby increase its effective hydrodynamic radius. However, these effects will be counterbalanced by the hy- drodynamic interactions between the disks as the packing fraction increases, which serve to decrease the apparent diffusion coefficient. To our knowledge, the effects of hy- drodynamic interactions between particles on a surface have not been determined and therefore we make no cor- rections for them. Then, the effective hydrodynamic radius R, of the furry disks is found to be roughly 4100 A, as summarized in Table III. This large value for the radius of a disk appears to be inconsistent with the inferred packing fraction of the disks. If a disk truly has this large radius, the effective packing fraction would be much greater than that determined by the results of the static light scattering. Presumably this discrepancy reflects the inherent uncer- tainties in the assumptions used to determine the radius of the disk from the diffusion coefficient. In addition, this discrepancy suggests that the furry peripheries of the disks play a relatively little role in their packing, as they must be highly compressible.
Ri= [ ( Na2)/4] in two dimensions, where N is the degree of polymerization and a is the monomer length}. In three dimensions, an isolated PMMA chain attached at one end to a noninteracting surface will have a root mean square end-to-end separation two times larger than does an iso- lated free chain.25 For our sample, an isolated ideal PMMA chain in three dimensions and with one end at- tached would have a root mean square end-to-end separa- tion of 670 A ( N= 2900 and a = 6.2 A) .26 This is consid- erably larger than the distance between attached chain ends (160 A), so we expect the chain stretching in the brush to be much greater than for an isolated molecule with one end attached. We can use the calculations of Cari- gnano and Szleifer” to estimate the expected stretching of the PMMA brush. Figures 4(A), 4(B), and 4(D) of their paper show that the full width at half-height of the teth- ered chain density distribution is in the range 0.6-1.0 [z/( Nu”~)], where z is measured in units of monomer size, N is the degree of polymerization, and (T is the density of tethered ends. For our case ( N= 2900, (T= 0.01, and 0 a=6.2 A), this result leads to za-2250-3750 A. Given the uncertainty in our determination of the effective hydro- dynamic radius, the agreement of this prediction with our data must be considered quite satisfactory.
Even though the true value of the effective hydrody- namic radius of the disk is uncertain, it is clearly larger than the radius of the dense core. We can interpret this increase in terms of the extent to which the PMMA brush is stretched by virtue of being end grafted in a polymer brush. If we take the full value of the inferred effective hydrodynamic radius obtained above, it would imply that the PMMA brush at the perimeter of the disk has an ef- fective extension of 2700 A. From the radius of the disk determined from the single disk structure factor we find that there are about 50 molecules in the perimeter layer, and that the PMMA ends are separated by about 160 A. We assume the PMMA is contained in a film with the thickness measured for a pure monolayer of PMMA on water, which is 18 A. The density of attached ends is then about one per 3000 A’, or about one percent of the esti- mated close packing density. Care must be taken in inter- preting this density because of the restriction of the PMMA chain to a film 18 A thick, which will likely in- crease the chain stretching. For example, the radius of gyration, R,, of an ideal chain constrained to two dimen- sions is 22% greater than is that of the same ideal chain in three dimensions { Ri= [ ( Na2)/6] in three dimensions and
To complete our argument, we show that the hydro- dynamic shielding length in the region outside the dense core of the disk is smaller than the length of the PMMA brush (see Fig. 13). We calculate the hydrodynamic shielding length” from Lm2=$/p, where Y is the mono- mer density of the PMMA brush in the peripheral region ( Y=~X 10zo monomers/cm3 when the packing fraction is 12%), and 5‘ is the friction coefficient of a PMMA mono- mer (c~6rpa/2, where a=6.2 A). For simplicity, we assume the monomers of the PMMA brush are uniformly distributed in the peripheral region of the furry disk. We then fmd that L-10 A; hence the outer edge of the PMMA brush will act as a boundary which detines the fluid flow. Even allowing for the nonuniform distribution of the PMMA monomers in the periphery of the furry disk will not grossly alter the hydrodynamic shielding. Thus, we conclude that the proposed furry disk model is consistent with both the static and the dynamic light scattering data.
In the intermediate and high surface pressure regions D, is at least an order of magnitude smaller than in the low surface pressure region. In fact, at the highest compres- sions the initial decay rate is not well defined. This suggests that the furry disks are so tightly packed that they are essentially completely immobile at the highest surface cov- erages; at somewhat lower coverages there may be strong interactions between the furry disks which greatly reduces their diffusion coefficient.
The second decay time is consistent with our picture of the existence of very large networks, or islands, of disks attached together. The appearance of a large contribution to the correlation function due to this slower decay corre- lates well with the appearance of the large and irreproduc- ible spikes in the data. All the data are consistent with the
J. Chem. Phys., Vol. 99, No. 10, 15 November 1993
Downloaded 03 Jul 2001 to 140.247.57.188. Redistribution subject to AIP license or copyright, see http://ojps.aip.org/jcpo/jcpcr.jsp
Lin, Rice, and Weitz: Evanescent wave light scattering 8321
existence of very large, and hence very slowly diffusing, objects on the surface. This would make it considerably more difficult to obtain a true ensemble average in the static light scattering and, because of the relatively small number of coherence areas viewed by each fiber, would result in spikes that would be of the order of 30%, as are observed. The decay rate measured by the dynamic light scattering would then reflect the diffusion coefficient of these very large islands. However, because of their large size and concommittant small diffusion rate, there would likely be relatively few islands in the beam in any single measurement, resulting in large variations of the measured decay time, consistent with our observations.
Nevertheless, we can still obtain an estimate from the data of the approximate size of these islands and the rela- tive number of disks contained within them. To estimate their effective hydrodynamic radius from their diffusion coefficient we must include the effects of rotational ditfu- sion, since the island size is much larger than l/Q,,; to do so we exploit what is known about the contribution of rotational diffusion in the case of other large inhomoge- neous objects, such as fractal colloidal aggregates.29’30 For large, inhomogeneous objects, the autocorrelation function will decay when the object has moved far enough that each constituent particle has been displaced by l/Q. This mo- tion can result from either rotational or translational dif- fusion. For the islands of furry disks, this requires motion of the island over lengths of order of the diameter of a single disk. The time scale for this to occur will be roughly the same whether the motion results from translational or from rotational diffusion. We emphasize that it is not nec- essary to wait a full rotational diffusion time, or the time required for the whole island to diffuse over an angle of 7~ radians. This time scale increases with the cube of the radius of the island and becomes excessively long as the effective radius of the island increases. However, since the island is composed of random arrangements of the disks, it is sufficient for it to move a distance of only l/Q,, for rotational diffusion to contribute to the decay of the auto- correlation function. As a result, we expect both rotational and translational diffusion to contribute nearly equally to the diffusion coefficient. Moreover, we also expect a Q”,, dependence for the decay time, if the data were of sufficient quality to accurately determine this. The data exhibit con- siderable fluctuations with QXy, precluding any attempt to determine a precise dependence. However, we can estimate the effective radius of the islands R2 by assuming equal contributions from translational and rotational diffusion. We find typical values of roughly 20 pm as shown in Table III, which is entirely consistent with the lower bound set by the absence of any observable form factor from the islands in the static light scattering.
We can also estimate the fraction of the disks that are contained within the islands from the values of the ampli- tudes A, and A2. Since the size of the islands is so large, the scattering intensity from each island at the experimen- tally accessible values of QXY will be proportional to the number of disks in the island. Similarly, the intensity of the scattering from the isolated disks will also be proportional
.
-I OEO lE14 2E14 3E14
Density (PMMA brush monomer/cm*)
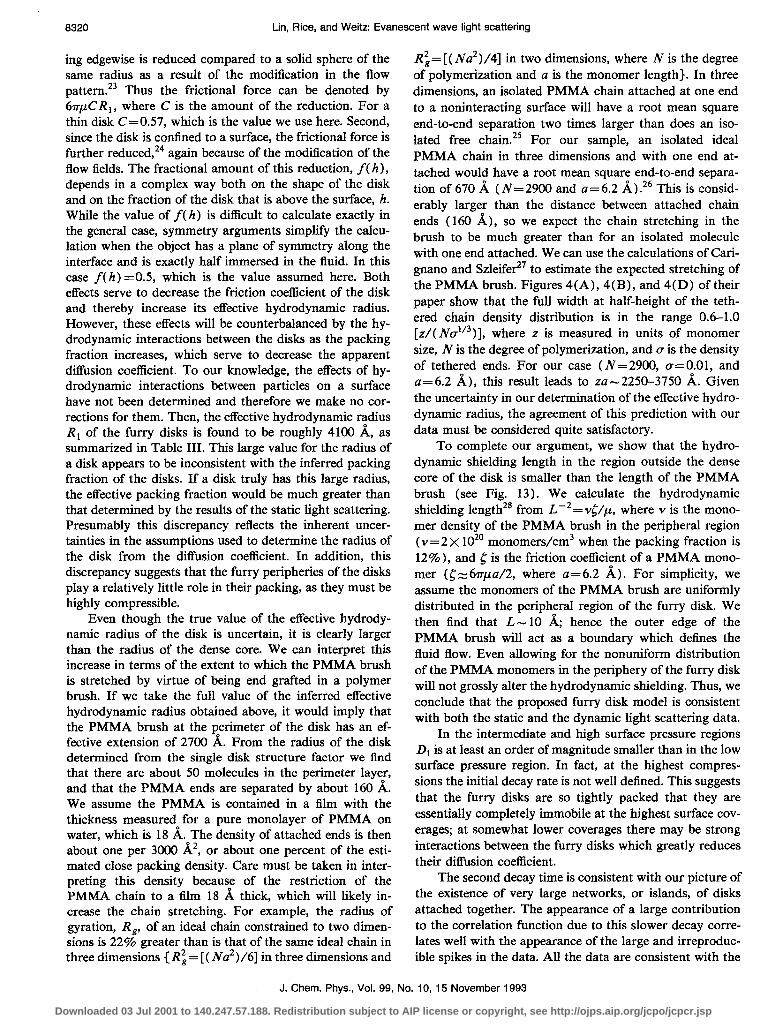
I- i
FIG. 17. The isotherm of a monolayer of PS-b-PMMA (880:290 K) on the surface of water at 18 “C; the surface pressure is plotted as a function of the monomer density of the PMh4A brush in the area not occupied by dense cores.
to their number. Thus when At z A, the disks are roughly evenly divided between the islands and being free. As the islands shrink on further compression cycles, the ratio of numbers of isolated disks to those contained in the islands increases.
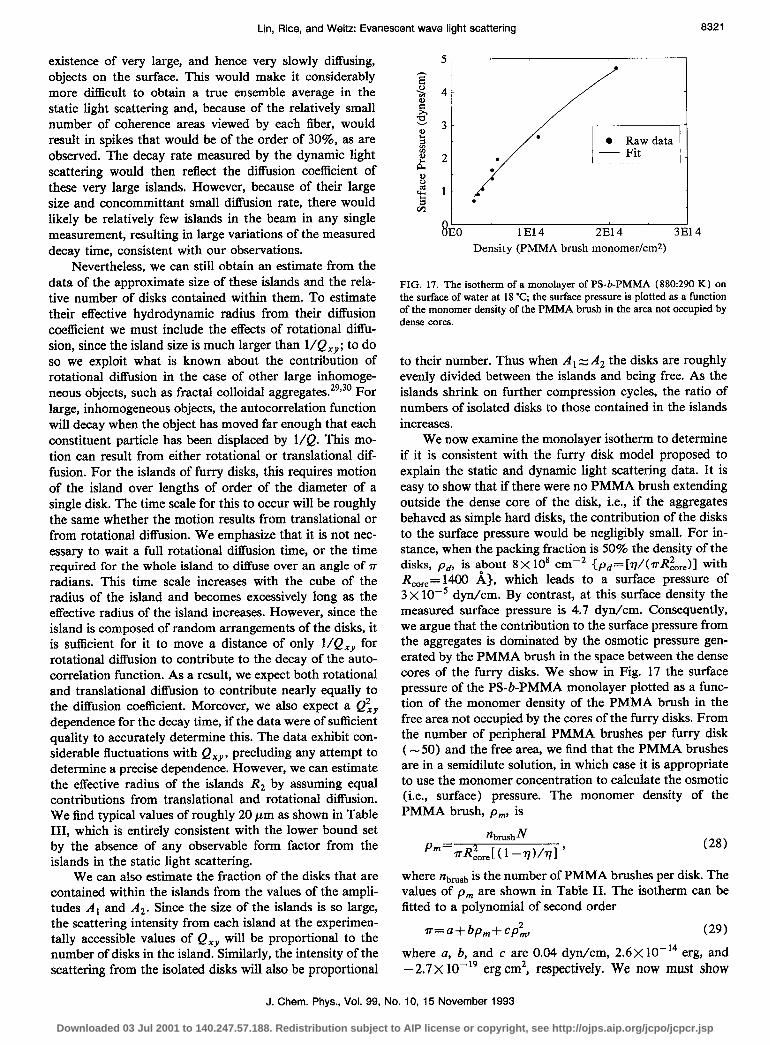
We now examine the monolayer isotherm to determine if it is consistent with the furry disk model proposed to explain the static and dynamic light scattering data. It is easy to show that if there were no PMMA brush extending outside the dense core of the disk, i.e., if the aggregates behaved as simple hard disks, the contribution of the disks to the surface pressure would be negligibly small. For in- stance, when the packing fraction is 50% the density of the disks, pd, is about 8X 10’ cmw2 {pd= [~/(rr&,,,)] with R,,,= 1400 A], which leads to a surface pressure of 3x lo-’ dyn/cm. By contrast, at this surface density the measured surface pressure is 4.7 dyn/cm. Consequently, we argue that the contribution to the surface pressure from the aggregates is dominated by the osmotic pressure gen- erated by the PMMA brush in the space between the dense cores of the furry disks. We show in Fig. 17 the surface pressure of the PS-bPMMA monolayer plotted as a func- tion of the monomer density of the PMMA brush in the free area not occupied by the cores of the furry disks. From the number of peripheral PMMA brushes per furry disk ( -50) and the free area, we find that the PMMA brushes are in a semidilute solution, in which case it is appropriate to use the monomer concentration to calculate the osmotic (i.e., surface) pressure. The monomer density of the PMMA brush, pm, is
*brush N Pm= &xe[ (l--77)&l ’ (28)
where *brush is the number of PMMA brushes per disk. The values of pm are shown in Table II. The isotherm can be fitted to a polynomial of second order
m=a+bp,+cp2,, (29)
where a, b, and c are 0.04 dyn/cm, 2.6~ lo-l4 erg, and -2.7X lo-t9 erg cm2, respectively. We now must show
J. Chem. Phys., Vol. 99, No. 10, 15 November 1993
Downloaded 03 Jul 2001 to 140.247.57.188. Redistribution subject to AIP license or copyright, see http://ojps.aip.org/jcpo/jcpcr.jsp
that the pressure generated by the PMMA brushes is of the magnitude expected for a solution of monomers with den- sity pm. To do so, we use the equation of the state
$T= pm+ ALP’,,
where kBT=4X lo- l4 erg and A2 is the second virial co- efficient. We find that the osmotic (surface) pressure mea- sured is about 35% smaller than that of a solution of free monomers with the same surface density. We conclude that the monolayer isotherm is consistent with the pro- posed furry disk model.
V. DISCUSSION
Since the size of the disk shaped aggregates of the ad- sorbed PS-b-PMMA polymers which we infer from our data is comparable to the wavelength of light, it is neces- sary to reexamine the applicability of our evanescent wave scattering theory. In the data analysis section we assumed that the scattering from the adsorbed polymers was due solely to evanescent waves incident on the edges of the disk shaped aggregates. However, when the diameter of the disks is comparable to the wavelength of light the light incident on the disks from the bulk substrate can refract into the disks through the interface between the water and a disk. In turn, the refracted light can be totally reflected by the interface between the disk and the air, assuming that the interface is smooth on the scale of the wavelength of light. Thus the intensity of the light scattered from the disk now has components arising from the incident evanescent waves, the refracted waves, and the reflected waves. Nev- ertheless, if the scattering vector Q is the same for each of the three waves in the scattering from the disk, then the form factor and the structure factor in the scattering func- tion [see Eqs. (20) and (21)] resulting from the superpo- sition (and/or interference) of these three waves will be the same as that which arises solely from the scattering of the evanescent waves. Consequently, the angular distribu- tion of the scattered light intensity remains the same up to a scaling constant. In our case, the in-plane scattering vec- tor in the evanescent wave scattering Q:, is equal to [see Eqs. (5) and (14)]
QZ,= 2r*F6i JM, (31)
where n, is the refractive index of water, Bi is the incident angle of the laser beam, and 4 is the in-plane scattering angle. The in-plane scattering vector Q:, in the refracted and reflected wave scattering is equal to
8322 Lin, Rice, and Weitz: Evanescent wave light scattering
structural information derived from the data analysis de- scribed in Sec. IV remains valid, within our experimental precision, even though the inferred disk size is not small compared to the wavelength of the light used.
For the system studied, the results of our experiments lead to a picture of the liquid supported polymer mono- layer that is rather different from that which is widely accepted. Specifically, although the monolayer isotherm provides no hint that the PS-b-PMMA molecules in the liquid-vapor interface are not uniformly distributed, our light scattering studies clearly establish that the polymer molecules aggregate into disks. In retrospect, the aggrega- tion of the polymer molecules could have been anticipated by extending to polymer monolayers the principle of self- assembly which is well-established for liquid supported monolayers of long chain amphiphile molecules. The tradeoff between entropy loss and energy gain associated with self-assembly is easy to assess, at least qualitatively, for the case of long chain amphiphile molecules. Because long chain amphiphile molecules are not, in fact, very long, the number of gauche conformations per molecule is not large. Then it is easy to estimate that the gain in free energy arising from alignment of a molecule in an array of parallel molecules, coupled with a decrease in the number of gauche conformations per molecule from that characteris- tic of the isolated molecule, outweighs the free energy loss resulting from the decrease in entropy associated with the molecular alignment and the decrease in gauche conforma- tion number. On the other hand, polymer molecules are long and the self-assembly process will not lead to incor- poration of an appreciable fraction of a polymer chain in an ordered array of parallel chains, notwithstanding the expected increase in the root mean square end-to-end dis- tance in the end attached chains relative to that in a free chain. Yet it is clear that the van der Waals attraction between pairs of segments on different polymer chains is sufficient to generate aggregation of the PS-b-PMMA mol- ecules by association of randomly distributed pairs, i.e., without generating a substantial change in the overall poly- mer configuration. Although the expansion compression and solvent induced annealing of our initially prepared monolayers suggests that there is some interpenetration of the chains of adjacent polymer molecules, we do not be- lieve there is extensive interpenetration as in a polymer melt.
27rn3 sin or Q:,= ;1 d I+&&-
2 cos c$ -= l.lQ:,,
I sin 19, (32)
where n3 is the refractive index of bulk PS ( n3= 1.6) and 6, is the angle of refraction of the light entering the dense PS core. With our experimental resolution we cannot see the difference in the structure functions arising from the difference between Q&, and Q&,. As a result, all of the
If the polymer aggregation is driven by a succession of independent segment pair association reactions we must expect there to be a distribution of aggregate sizes, which translates into a distribution of disk diameters. If, however, there is a collective component to the association reaction, e.g., if a minimum number of pairs must associate before any aggregate is stabilized, the competition between the large entropy change and large energy change that charac- terize that collective association can lead to a very sharp transition between the free and aggregated states, and to a nearly uniform distribution of aggregate sizes. A possible source for the entropy barrier to formation of the aggregate is the stretching of the end attached PMMA chains. Alter- natively, competition between the free energy gain when a
J. Chem. Phys., Vol. 99, No. 10, 15 November 1993
Downloaded 03 Jul 2001 to 140.247.57.188. Redistribution subject to AIP license or copyright, see http://ojps.aip.org/jcpo/jcpcr.jsp
polymer molecule is added to the interior of the disk and the free energy cost of extending the perimeter of the ag- gregate when a polymer molecule is added to the interior can lead, in certain circumstances, to a stable inhomoge- neous phase consisting of disks or stripes of the aggregated polymer molecules; there is at least one example of a solu- tion to a model phase stability problem of this type in which the disks in the inhomogeneous phase are of uniform size.3”
It should be noted that the previous remarks concem- ing the plausibility of the existence of a stable phase with polymer molecules aggregated in disks of uniform size are based on the assumption that the system studied is in an equilibrium state. Given the relaxation phenomena we have observed, it is not at all clear that the monolayers we have studied are at equilibrium. Indeed, it is possible that the systems we have studied are in long lived metastable states. If so, both the disk size and the distribution of disk sizes are likely determined by kinetic effects, unless the local equilibrium in the metastable state supports the same aggregation process as does the global equilibrium. The determination of whether or not the polymer monolayers we have studied, and by inference those that others have studied, are at equilibrium, is important and can only be established by additional experimental work.
Finally, we remark that we have made preliminary measurements of the properties of monolayers of PS-b- PMMA (460:220 K) and PS-b-PMMA (450:450 K). The characteristics of these samples are listed in Table I. The currently available data suggest that it is likely that mono- layers of PS-b-PMMA (460:220 K) also consist of furry disks of about the same size as in monolayers of PS-b- PMMA (880:290 K). On the other hand, the currently available data suggest that in monolayers of PS-b-PMMA (450:450 K) there are no aggregates of the type found in PS-b-PMMA (880:290 K). The latter result is consistent with the notion that the attraction between collapsed PS blocks drives the copolymer aggregation, so that if the PMMA blocks are large enough to keep the PS blocks from coming close together no aggregate will be formed.
ACKNOWLEDGMENTS
We thank Professor T. Witten for several helpful com- ments on the theory of polymer brushes. We thank Dr. J. Gao, Dr. F. Novak, and P. Dolmer for their contributions to the construction of the surface light scattering spectrom- eter, and Professor M. Tirrell for the sample of PS-b- PMMA (450:450 K). We also thank Dr. M. Schlossman for several useful discussions. This research was started with support from the Petroleum Research Fund of the American Chemical Society and completed with support from the National Science Foundation. We have also ben- efitted from the use of facilities provided by the National Science Foundation for materials research at the Univer- sity of Chicago under Grant No. DMR 8819860. D. A. Weitz thanks the Chicago MRL for hospitality under the Industrial Visitor program.
8323
APPENDIX: THE FORM FACTOR FOR A TWO- DIMENSIONAL HARD DISK
The form factor I;(Q) for a centrosymmetric two- dimensional thin disk with a radius R is
F(Q)= & I s 2 ?rR2 exp(iQ*bl)dA
= I--& JoR b db J:ff exp(iQb cos q)dqi2
2
b db Jo(Qb)
2J,(QR) 2 ZZ I 1 QR -
Lin, Rice, and Weitz: Evanescent wave light scattering
(Al)
F(Q) as a function of Q in the range of 0-3X lo5 cm-’ with several values of R is displayed in Fig. 14.
‘G. L. Gaines, Jr., Insoluble Monolayers at Liquid-Gas Interfaces (In- terscience, New York, 1966).
‘R. A. M. Leermakers and N. M. Bashara, EIlQxometty and Polarized Light (North-Holland, Amsterdam, 1977).
‘H. Yu, in Physics of Polymer Surfaces and Interfaces, edited by I. C. Sanchez (Buttenvorth-Heinemann, Boston, 1992), pp. 263.
4M. L. Schlossman, D. K. Schwartz, E. H. Kawamoto, G. J. Kellogg, P. S. Pershan, M. W. Kim, and T. C. Chung, J. Phys. Chem. 95, 6628 (1991).
‘J. A. Henderson, R. W. Richards, J. Penfold, and R. K. Thomas, Macromolecules 26, 65 ( 1993).
6M. S. Kent, L.-T. Lee, B. Farnoux, and F. Rondelez, Macromolecules 25, 6240 (1992).
‘F. Rondelez, D. Ausserre and H. Hervet, Annu. Rev. Phys. Chem. 38, 317 (1987).
* M. L. Schlossman (personal communication). ‘J. Gao and S. A. Rice, J. Chem. Phys. 90, 3469 (1989).
“J. Gao, K. F. Freed, and S. A. Rice, J. Chem. Phys. 93, 2785 (1990). “B. Lin and S. A. Rice, J. Chem. Phys. 98, 6561 (1993). 12M. Born and E. Wolf, Principles of Optics (Pergamon, Oxford, 1980). I3 B. Chu, Laser Light Scattering: Basic Principles and Practice (Aca-
demic, Boston, 1991). 14J. Kumaki, Macromolecules 19, 2258 ( 1986). “N. W. Ashcroft and N. D. Mermin, Solid State Physics (Halt, Rinehart,
and Winston, New York, 1976). 16Y. Rosenfeld, Phys. Rev. A 42, 5978 (1990). “J. Kumaki, Macromolecules 21, 749 ( 1988). ‘*J Zhu, A. Eisenberg, and R. B. Lennox, J. Am. Chem. Sot. 113, 5583
(.1991). “J. Zhu, R. B. Lennox, and A. Eisenberg, Langmuir 7, 1579 ( 1991). “J. Zhu, R. B. Lennox, and A. Eisenberg, J. Phys. Chem. 96, 4726
(1992). 2’J. Zhu, S. Hanley, A. Eisenberg, and R. B. Lennox, Makromol. Chem.,
Macromol. Symp. 53, 211 ( 1992). ‘=R Pecora, Dynamic Light Scattering: Application of Photon Correlation
Spectroscopy (Plenum, New York, 1985). 23H. Lamb, Hydrodynamics (Dover, New York, 1932). 24B Radoev, M. Nedjalkov, and N. Djakovich, Langmuir 8, 2962
(;992). “K Myers, A. M. Nemirovsky, and K. F. Freed, J. Chem. Phys. 95,
61’12 (1991). 26J. Brandrup and E. H. Immergut, Polymer Handbook (Wiley, New
York, 1975). 27M. A. Carignano and I. Szleifer, J. Chem. Phys. 98, 5006 (1993). 28P. Debye and A. M. Bueche, J. Chem. Phys. 16, 514 (1948).
J. Chem. Phys., Vol. 99, No. 10, 15 November 1993
Downloaded 03 Jul 2001 to 140.247.57.188. Redistribution subject to AIP license or copyright, see http://ojps.aip.org/jcpo/jcpcr.jsp
8324 Lin, Rice, and Weitz: Evanescent wave light scattering
29H. M. Lindsay, R. Klein, D. A. Weitx, M. Y. Lin, and P. Meakin, Phys. Rev. A 38, 2614 (1988).
“M Y Lin, H. M. Lindsay, D. A. Weitz, R. Klein, R. C. Ball, and P. . . Meakin, J. Phys. Condensed Matter 2, 3093 (1990).
3’ F. Brochard, J. F. Joanny, and D. Andehnan, in Physics of Amphiphitic Layers, edited by D. Langevin and N. Boccara (Springer-Verlag, Berlin, 1987), p. 28.
J. Chem. Phys., Vol. 99, No. 10, 15 November 1993
Downloaded 03 Jul 2001 to 140.247.57.188. Redistribution subject to AIP license or copyright, see http://ojps.aip.org/jcpo/jcpcr.jsp
Recommended