co
ns
ult
ing
& t
ec
hn
olo
gy
Statewide Freight Transportation Network
Optimization Strategy OverviewSeptember 21, 2016
© 2016 Quetica, LLC. All rights reserved

quèt�icaquèt�ica
Freight Network Optimization Model (FOM)
2
� Vision: To effectively identify & prioritize investment
opportunities for an optimized freight transportation network
to lower transportation costs & promote business growth.
� State DOT can optimize statewide freight transportation
network to reduce transportation costs
� Traditional approaches focus more on capacity planning
� Traditional methods don’t quantify cost saving opportunities in a
multimodal network
� FOM and Travel Demand Modeling are complementary tools
for State DOT planning
© 2016 Quetica, LLC. All rights reserved

quèt�ica quèt�ica
Supply Chain Network and Optimization
3
� Up to 80% of the landed costs are locked in with the supply chain network
© 2016 Quetica, LLC. All rights reserved

quèt�icaquèt�ica
Business Architecture Overview
4
© 2016 Quetica, LLC. All rights reserved
quèt�icaquèt�ica
Optimization Analysis
� Quantitative Analysis
� Cost and network
capacity
� Economic viability
� Improved network
resilience
� Qualitative Analysis
� Strategic alignment
� Funding availability
� Job creation and local buy-in
� Service levels / transportation
time
� Road mile reduction
� etc.
5
© 2016 Quetica, LLC. All rights reserved

quèt�icaquèt�ica
Complementary Tools for
Transportation Planning6
NetworkNetworkNetworkNetwork OptimizationOptimizationOptimizationOptimization Traditional Freight PlanningTraditional Freight PlanningTraditional Freight PlanningTraditional Freight Planning
ScopeScopeScopeScope Design / redesign the network (to-be) Use the current network (as-is)
ObjectiveObjectiveObjectiveObjectiveIdentify highest cost (value)
constraints in regional freight network
Identify bottlenecks based on stakeholder
input and/or travel demand models
(shortest path).
FocusFocusFocusFocus
Strategic planning of critical
components in supply chain network
(site, capacity, inventory, mode, etc.)
Long range planning (primarily policy
planning) based on highly aggregated
commodity data
ToolsToolsToolsTools Network Optimization Model Travel Demand Model
Network Network Network Network
DetailDetailDetailDetail
Defines origin-destination pairs in to-
be network (lanes, modes, equipment,
capacity, etc.)
Determines modal choice, major markets;
makes assumptions on interchanges and
routing.
© 2016 Quetica, LLC. All rights reserved
� FOM uses network data from the Travel Demand Model TDM)
� Optimization results fed back to the TDM to analyze future traffic pattern changes

quèt�icaquèt�ica
Benefits of Multi-Modal Freight Network
Optimization 7
� Benefits to State DOT
� Safety & Environment: reducing truck traffic
� Mobility: improving transportation network resiliency
� Economy & Preservation
� Investment opportunities with high ROI
� Identifying commercial freight road networks that are irrelevant
� Benefits to State DOT & private partners
� Determine the highest value multi-modal infrastructure public and private investments that are measured by:
� Lowering the cost of transportation for businesses
� Increasing transportation responsiveness and predictability
� Incenting business expansion
� Provide a foundational model to help businesses optimize their supply chains
© 2016 Quetica, LLC. All rights reserved

quèt�icaquèt�ica
Transportation Modal Choice: CA vs. U.S.
8
© 2016 Quetica, LLC. All rights reserved
Data Source: FAF 4.1 2014, Federal Highway Administration
quèt�icaquèt�ica
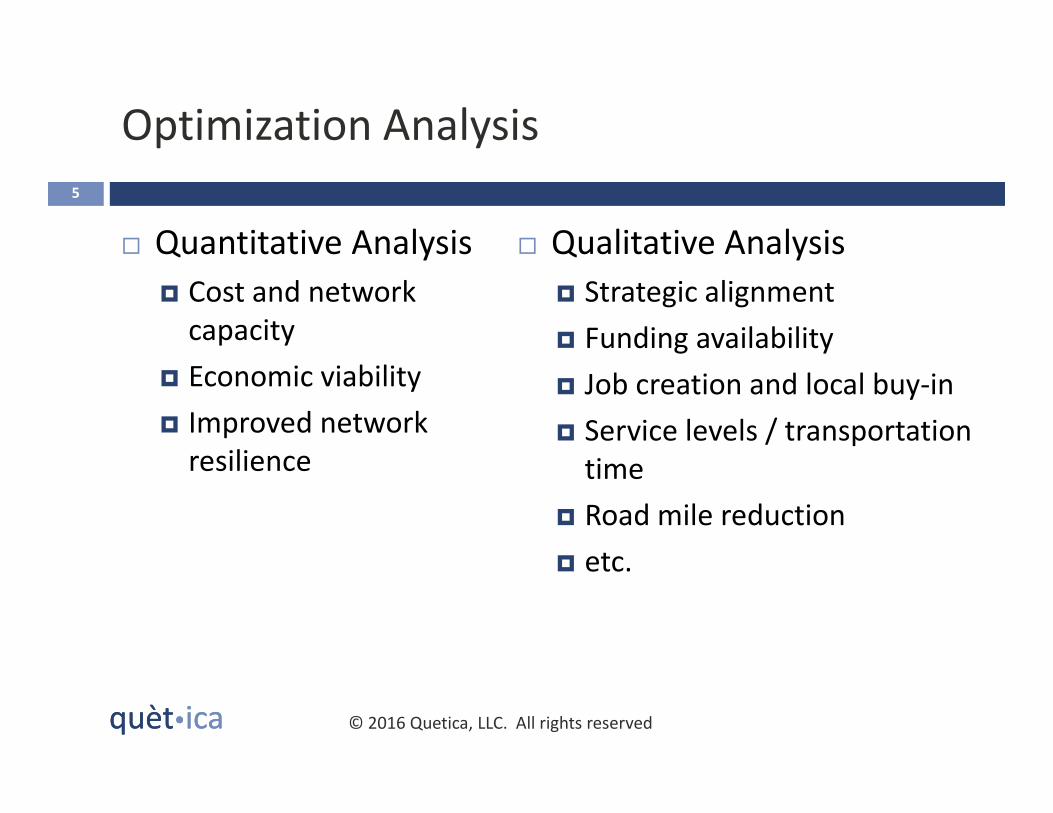
Iowa Case Study Cross Dock
� Truck freight arrives via LTL or FTL
� Freight is unloaded and sorted
based on destination
� Outbound trucks are loaded with
freight going to the same area
� LTL freight is consolidated to long-
haul FTL
� Can offer packaging / palletizing
services
9
© 2016 Quetica, LLC. All rights reserved

quèt�icaquèt�ica
Cross-Dock Opportunity Analysis
10
� Identified four regions based on freight density
� Central Iowa – S has the highest cost saving, but Central Iowa – A and
Eastern Iowa are more viable options because of existing access to
interstate highways
� Selected Eastern Iowa as the primary site candidate with the concept to
co-locate cross-dock and intermodal facilities in a logistics park
LocationLocationLocationLocation Total Annual Saving OpportunityTotal Annual Saving OpportunityTotal Annual Saving OpportunityTotal Annual Saving Opportunity
Central Iowa – A $867 Million
Central Iowa – S $870 Million
Eastern Iowa $852 Million
Western Iowa $670 Million
© 2016 Quetica, LLC. All rights reserved
quèt�icaquèt�ica
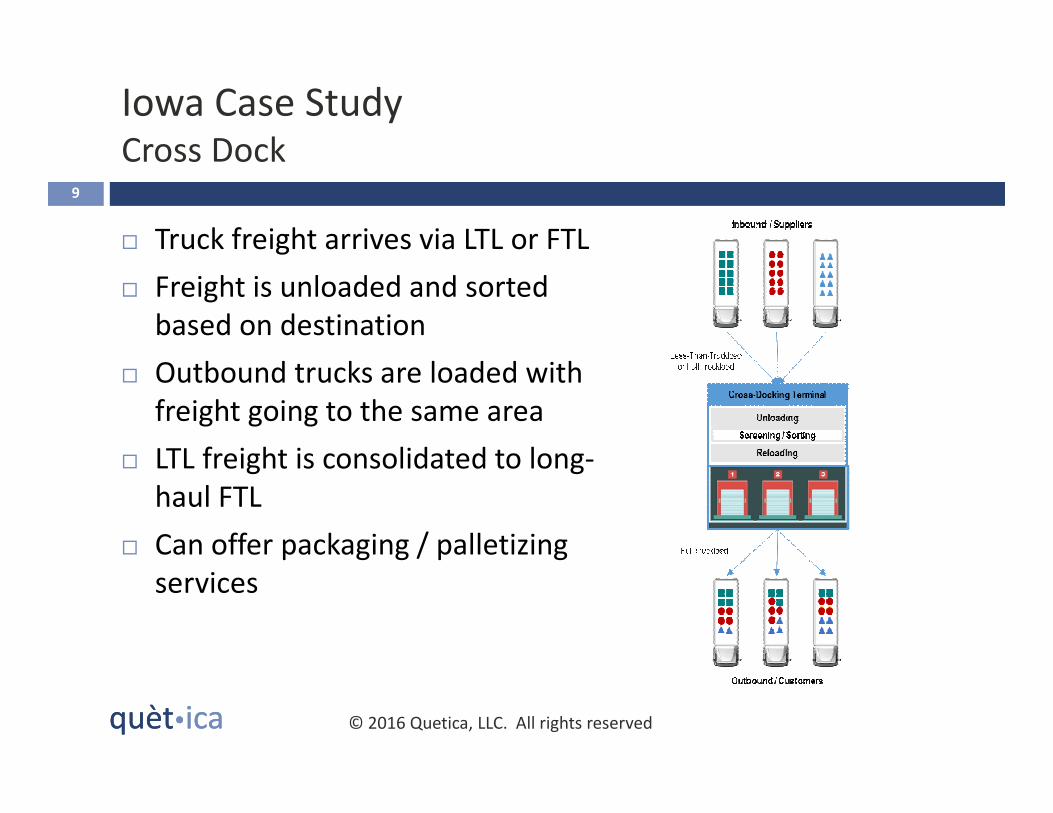
Cross-Dock Network Impact
11
© 2016 Quetica, LLC. All rights reserved
Current State Future State
� Benefits:
� Leverage freight consolidation to reduce transportation costs
� Reduce long distance truck traffic and improve environmental sustainability

quèt�icaquèt�ica
Iowa Case Study Intermodal Facility
12
The total market opportunity for high volume traffic lanes:
ItemItemItemItem OpportunityOpportunityOpportunityOpportunity
Total Number of
Outbound Container377,000
Est. Number of Inbound
Containers139,000
Est. Container Shortage 238,000
Est. Annual Loaded Est. Annual Loaded Est. Annual Loaded Est. Annual Loaded
ContainersContainersContainersContainers516,000516,000516,000516,000
© 2016 Quetica, LLC. All rights reserved
ItemItemItemItem OpportunityOpportunityOpportunityOpportunity
Annual Gross
Transportation Saving$340 Million
Empty Container
Reposition Cost($143 Million)
Annual Net SavingsAnnual Net SavingsAnnual Net SavingsAnnual Net Savings $197 Million$197 Million$197 Million$197 Million

quèt�icaquèt�ica
Case Study 2 IM Facility Network Impact
13
© 2016 Quetica, LLC. All rights reserved
Current State Future State
� Benefits:
� Leverage rail network to reduce transportation costs
� Reduce truck traffic and improve environmental sustainability

quèt�icaquèt�ica
Iowa Case Study Transload Facility
14
� Transload facilities allow shippers to transfer freight between two modes and leverage lower cost shipment options
� In the statewide model, three locations are identified as candidates for transload facilities to provide largest cost saving opportunities
© 2016 Quetica, LLC. All rights reserved
quèt�icaquèt�ica
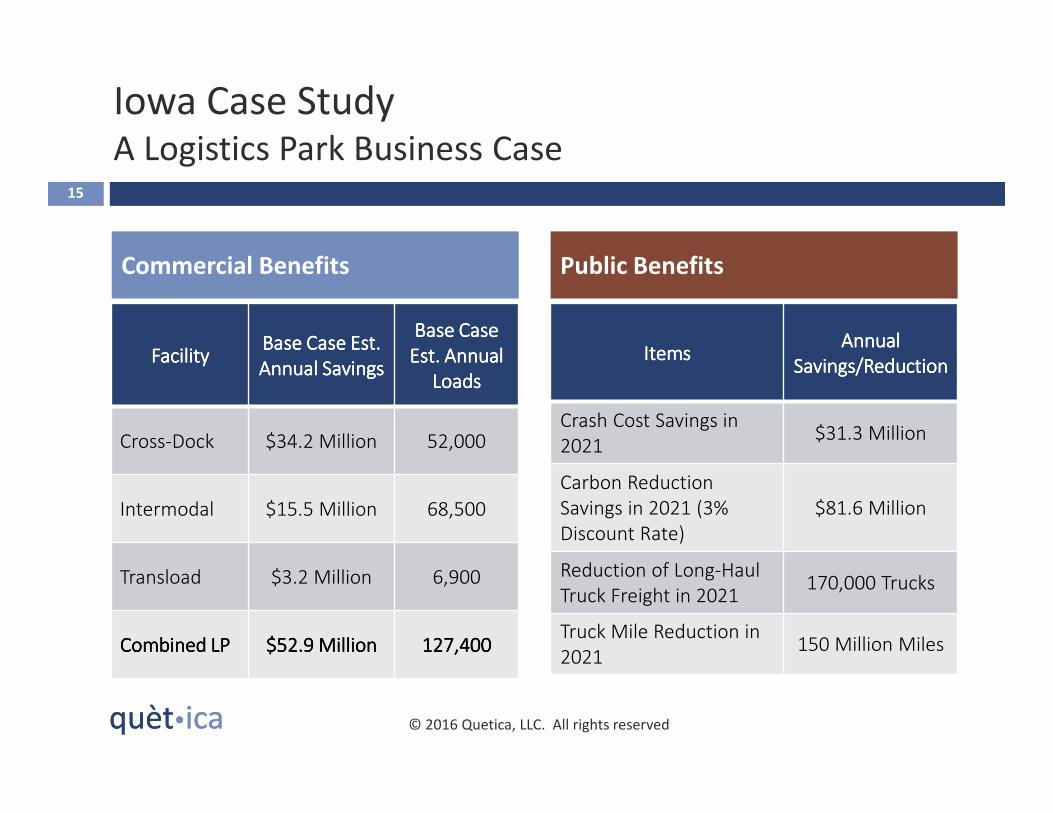
Iowa Case Study A Logistics Park Business Case
FacilityFacilityFacilityFacilityBase Case Est. Base Case Est. Base Case Est. Base Case Est.
Annual SavingsAnnual SavingsAnnual SavingsAnnual Savings
Base Case Base Case Base Case Base Case
Est. Annual Est. Annual Est. Annual Est. Annual
LoadsLoadsLoadsLoads
Cross-Dock $34.2 Million 52,000
Intermodal $15.5 Million 68,500
Transload $3.2 Million 6,900
Combined LPCombined LPCombined LPCombined LP $52.9$52.9$52.9$52.9 MillionMillionMillionMillion 127,400127,400127,400127,400
15
© 2016 Quetica, LLC. All rights reserved
Commercial Benefits Public Benefits
ItemsItemsItemsItemsAnnual Annual Annual Annual
Savings/ReductionSavings/ReductionSavings/ReductionSavings/Reduction
Crash Cost Savings in
2021$31.3 Million
Carbon Reduction
Savings in 2021 (3%
Discount Rate)
$81.6 Million
Reduction of Long-Haul
Truck Freight in 2021170,000 Trucks
Truck Mile Reduction in
2021150 Million Miles

quèt�icaquèt�ica
Application to Commercial Supply ChainsLeveraging Big Data for Optimization & Benchmarking
© 2016 Quetica, LLC. All rights reserved
16
� Assists commercial companies to design & optimize their supply chains
� Baseline Optimization
� Identify opportunities in current network to reduce transportation costs
� Make specific recommendations to improve the supply chains
� Greenfield Scenario Analysis
� Identify locations of new facilities in the supply chains
� Assess cost savings and build business case for investment
� Many companies challenged to collect relevant data and lack expertise
� Quetica’s unique approach merges public data from its state multi-modal network optimizations with a company’s supply chain data
� Product category
� Demand (location of customers, product, and volume)
� Supplier (location of suppliers and volume)
� Private transportation network capacity
� Facility construction and operation cost
� More effective commercial supply chain network design & optimization
� Leverages techniques, tools & computer algorithms proven with Fortune 500
� More robust dataset overcomes internal data limitations
quèt�ica
Richard Langer, Managing Director
Quetica, LLC
651-964-4646 x800
www.quetica.com
Questions17
© 2016 Quetica, LLC. All rights reserved
Weiwen Xie, Executive Director
Quetica, LLC
651-964-4646 x803
www.quetica.com
Recommended