State Statistical Committeeof the Republic of Azerbaijan
Balances of main agricultural products and food commodities
Dr Alisa Zeynalli, Head of Food Security and Balances
Department of the State Statistical Committee
December 5-9, 2011
Rome, Italy
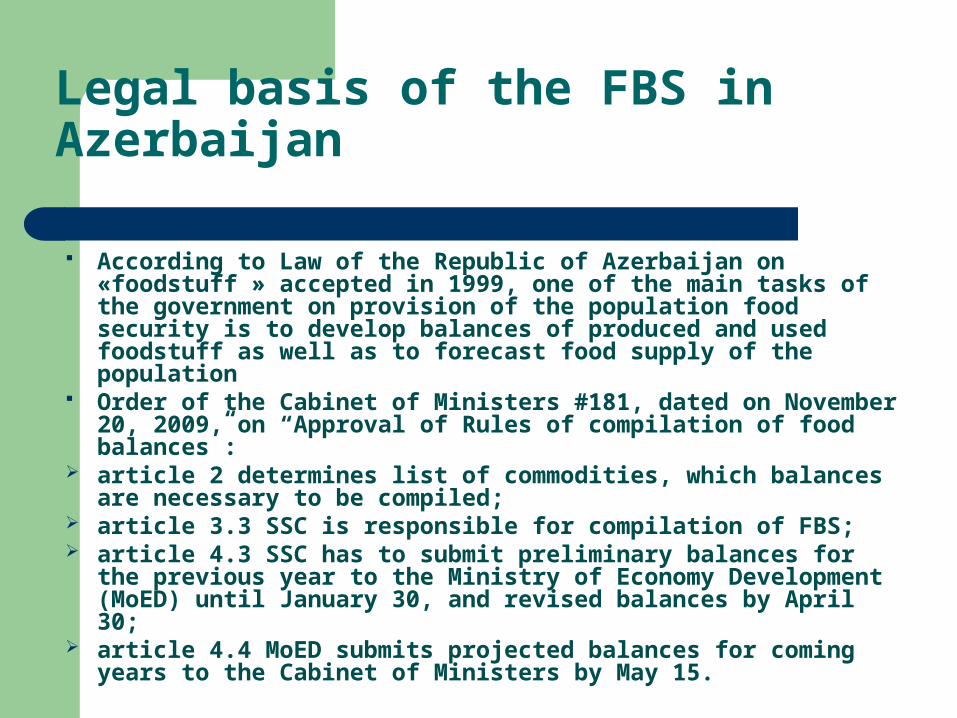
Legal basis of the FBS in Azerbaijan
According to Law of the Republic of Azerbaijan on «foodstuff » accepted in 1999, one of the main tasks of the government on provision of the population food security is to develop balances of produced and used foodstuff as well as to forecast food supply of the population
Order of the Cabinet of Ministers #181, dated on November 20, 2009, on “Approval of Rules of compilation of food balances”:
article 2 determines list of commodities, which balances are necessary to be compiled;
article 3.3 SSC is responsible for compilation of FBS; article 4.3 SSC has to submit preliminary balances for the
previous year to the Ministry of Economy Development (MoED) until January 30, and revised balances by April 30;
article 4.4 MoED submits projected balances for coming years to the Cabinet of Ministers by May 15.
Food Security and Balances Department of SSC
Was established on the base of Food Security Information System department initiated by EC Food Security Programme and functioned during 2000-2008;
Department responsible for elaboration and improvement of methodology; collection information necessary for compilation of FBS; compilation of FBS; statistical analyses of FBS, publication and dissemination
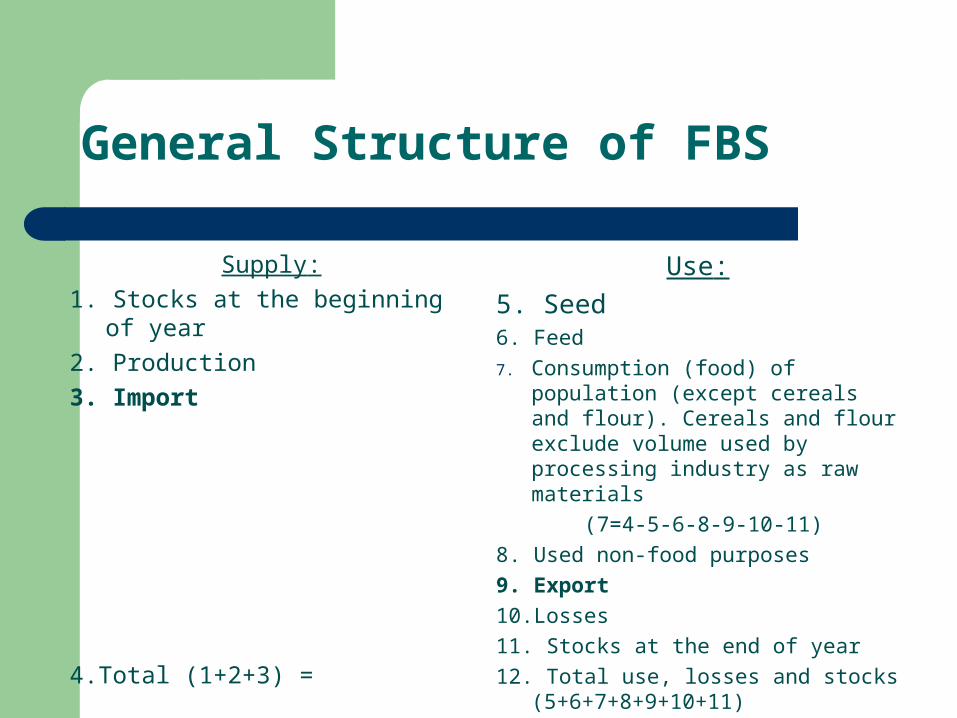
General Structure of FBS
Supply:
1. Stocks at the beginning of year
2. Production
3. Import
4.Total (1+2+3) =
Use:
5. Seed6. Feed
7. Consumption (food) of population (except cereals and flour). Cereals and flour exclude volume used by processing industry as raw materials
(7=4-5-6-8-9-10-11)
8. Used non-food purposes
9. Export
10.Losses
11. Stocks at the end of year
12. Total use, losses and stocks (5+6+7+8+9+10+11)
FBSs groups
Crop products; Livestock products; Derived products (food industry)
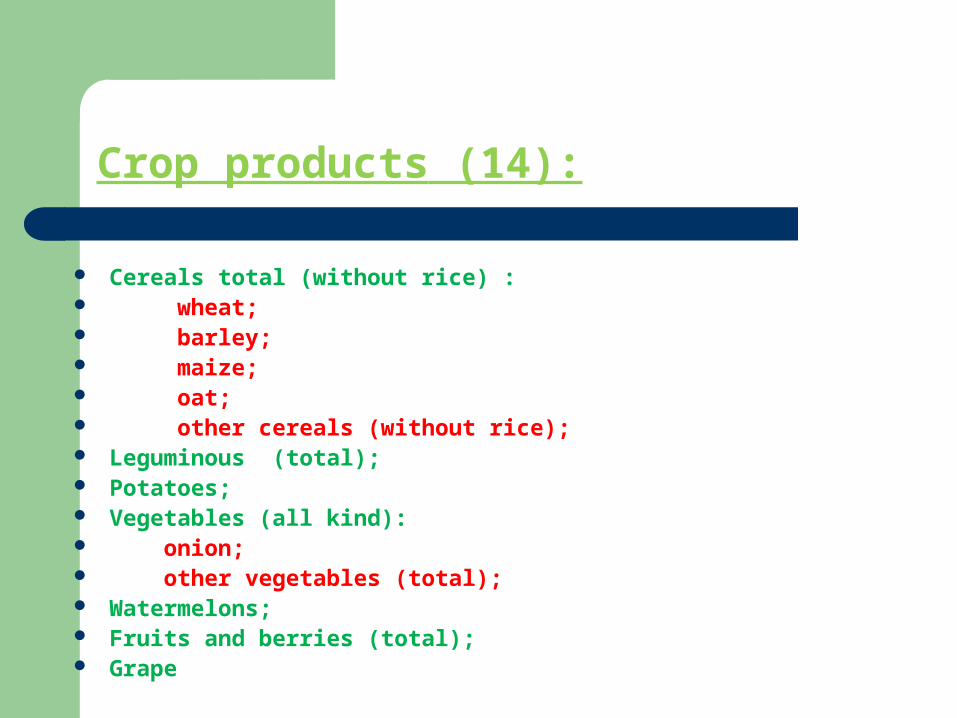
Crop products (14):
Cereals total (without rice) : wheat; barley; maize; oat; other cereals (without rice); Leguminous (total); Potatoes; Vegetables (all kind): onion; other vegetables (total); Watermelons; Fruits and berries (total); Grape
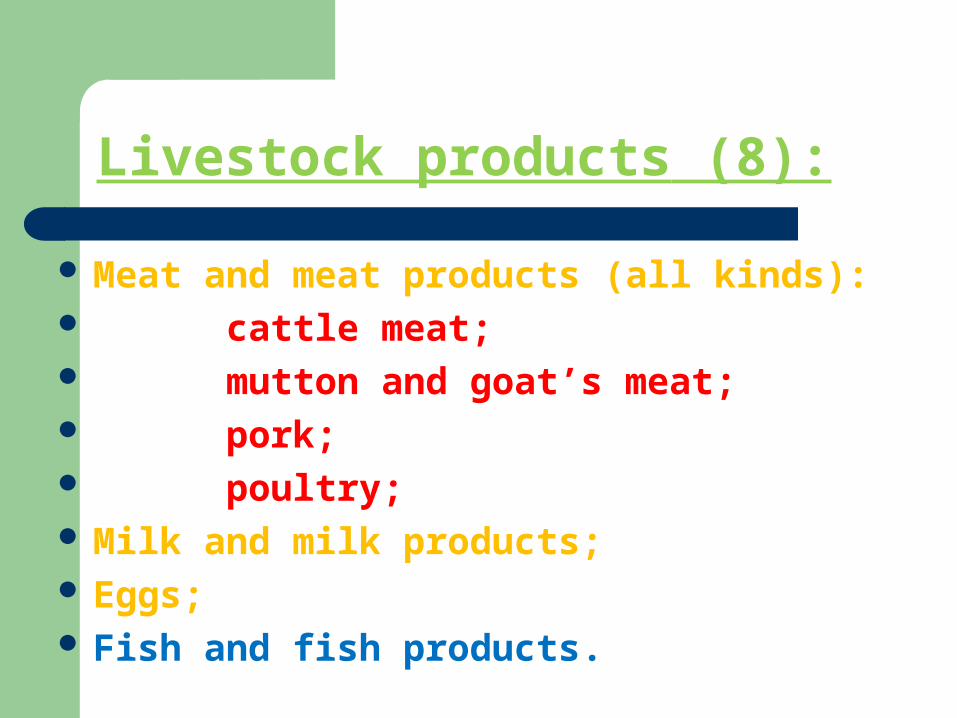
Livestock products (8):
Meat and meat products (all kinds): cattle meat; mutton and goat’s meat; pork; poultry; Milk and milk products; Eggs; Fish and fish products.
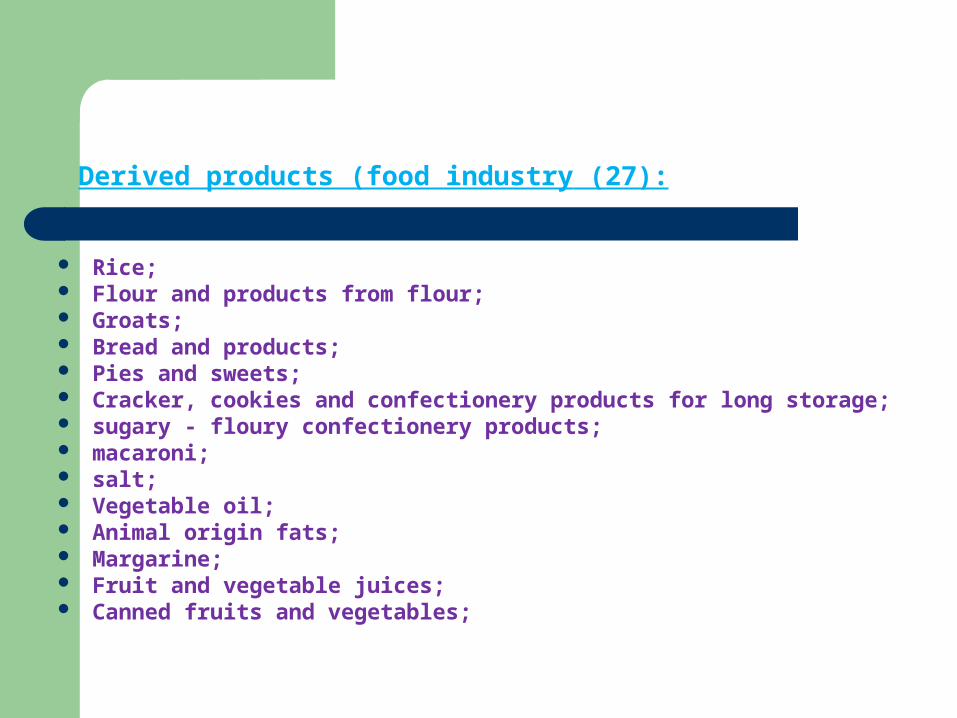
Derived products (food industry (27):
Rice; Flour and products from flour; Groats; Bread and products; Pies and sweets; Cracker, cookies and confectionery products for long storage; sugary - floury confectionery products; macaroni; salt; Vegetable oil; Animal origin fats; Margarine; Fruit and vegetable juices; Canned fruits and vegetables;
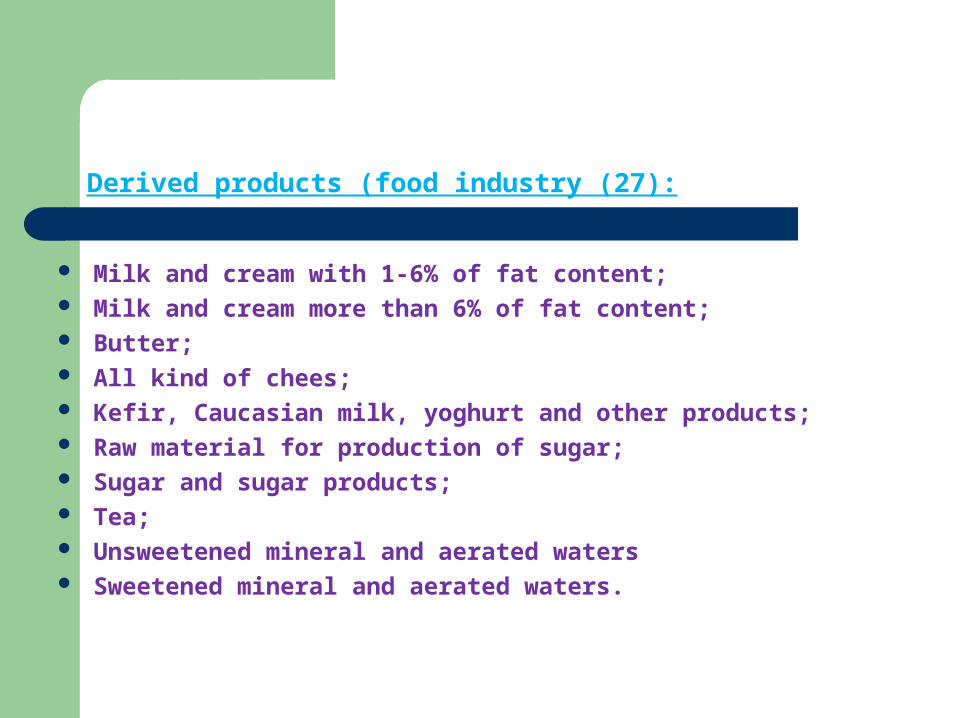
Derived products (food industry (27):
Milk and cream with 1-6% of fat content; Milk and cream more than 6% of fat content; Butter; All kind of chees; Kefir, Caucasian milk, yoghurt and other products; Raw material for production of sugar; Sugar and sugar products; Tea; Unsweetened mineral and aerated waters Sweetened mineral and aerated waters.
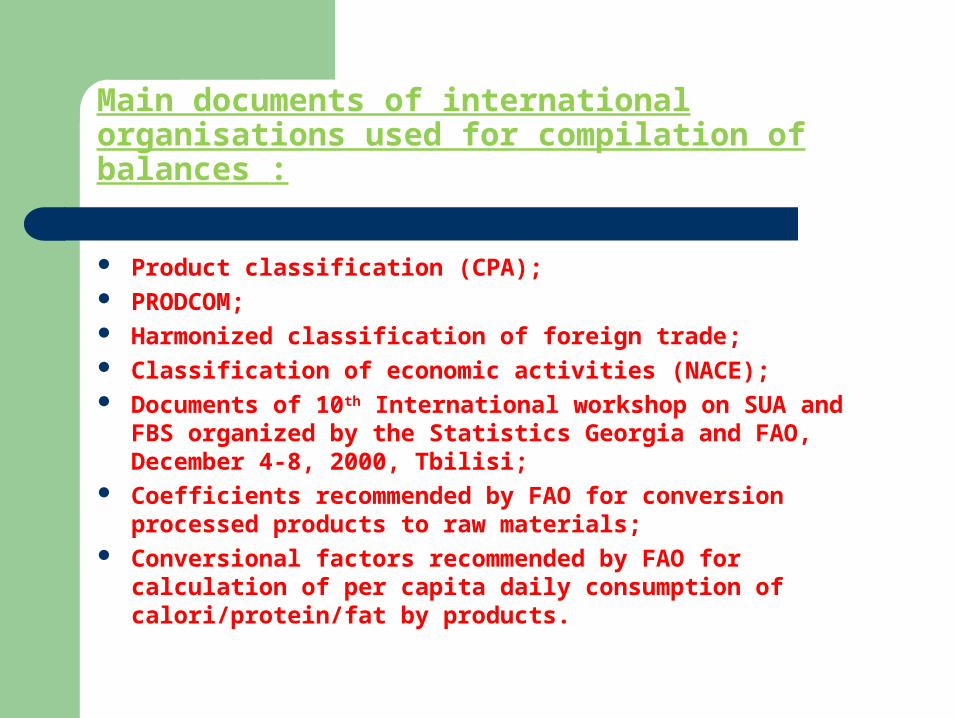
Main documents of international organisations used for compilation of balances :
Product classification (СРА); PRODCOM; Harmonized classification of foreign trade; Classification of economic activities (NACE); Documents of 10th International workshop on SUA and FBS
organized by the Statistics Georgia and FAO, December 4-8, 2000, Tbilisi;
Coefficients recommended by FAO for conversion processed products to raw materials;
Conversional factors recommended by FAO for calculation of per capita daily consumption of calori/protein/fat by products.

Source of information :
Current statistics Administrative data Special surveys
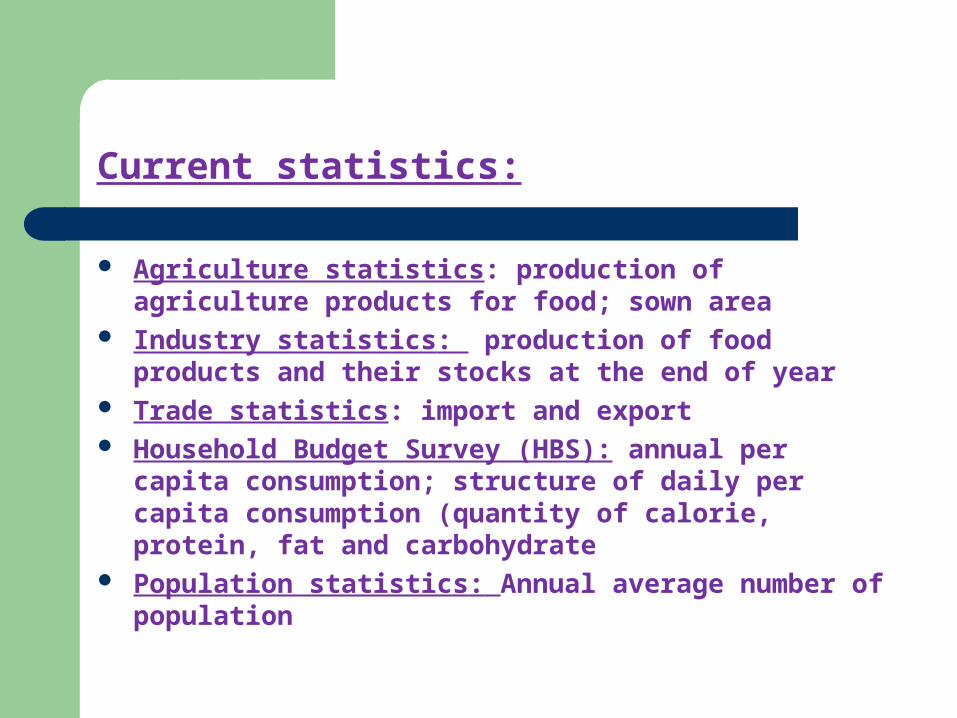
Current statistics:
Agriculture statistics: production of agriculture products for food; sown area
Industry statistics: production of food products and their stocks at the end of year
Trade statistics: import and export Household Budget Survey (HBS): annual per capita
consumption; structure of daily per capita consumption (quantity of calorie, protein, fat and carbohydrate
Population statistics: Annual average number of population
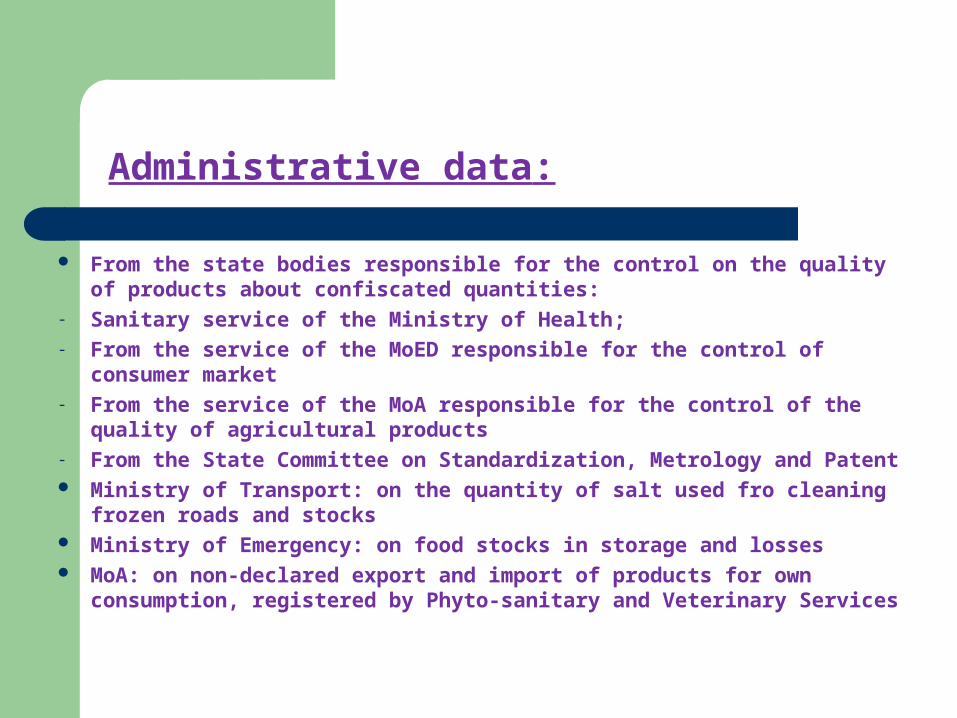
Administrative data:
From the state bodies responsible for the control on the quality of products about confiscated quantities:
- Sanitary service of the Ministry of Health;- From the service of the MoED responsible for the control of consumer
market - From the service of the MoA responsible for the control of the quality of
agricultural products- From the State Committee on Standardization, Metrology and Patent Ministry of Transport: on the quantity of salt used fro cleaning frozen
roads and stocks Ministry of Emergency: on food stocks in storage and losses MoA: on non-declared export and import of products for own
consumption, registered by Phyto-sanitary and Veterinary Services
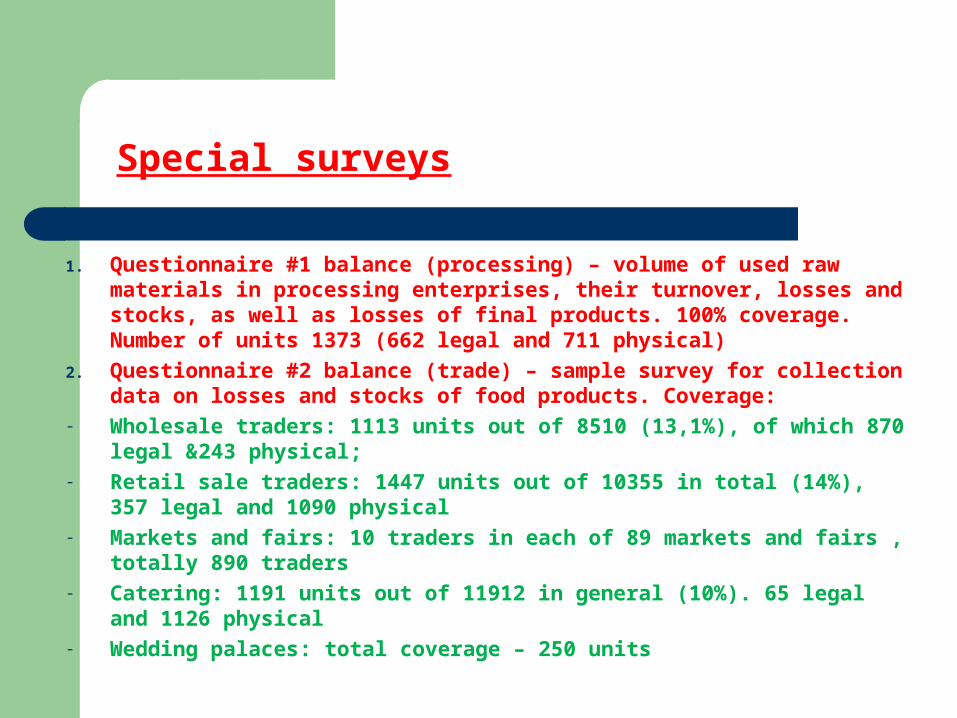
Special surveys
1. Questionnaire #1 balance (processing) – volume of used raw materials in processing enterprises, their turnover, losses and stocks, as well as losses of final products. 100% coverage. Number of units 1373 (662 legal and 711 physical)
2. Questionnaire #2 balance (trade) – sample survey for collection data on losses and stocks of food products. Coverage:
- Wholesale traders: 1113 units out of 8510 (13,1%), of which 870 legal &243 physical;
- Retail sale traders: 1447 units out of 10355 in total (14%), 357 legal and 1090 physical
- Markets and fairs: 10 traders in each of 89 markets and fairs , totally 890 traders
- Catering: 1191 units out of 11912 in general (10%). 65 legal and 1126 physical
- Wedding palaces: total coverage – 250 units
Special surveys
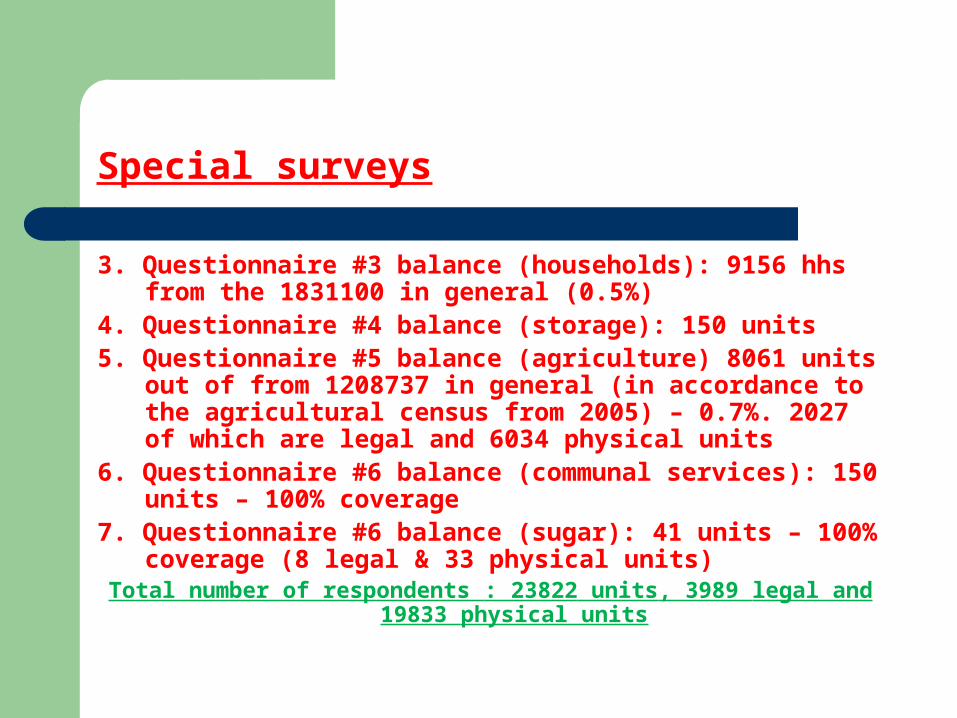
3. Questionnaire #3 balance (households): 9156 hhs from the 1831100 in general (0.5%)
4. Questionnaire #4 balance (storage): 150 units5. Questionnaire #5 balance (agriculture) 8061 units out of from
1208737 in general (in accordance to the agricultural census from 2005) – 0.7%. 2027 of which are legal and 6034 physical units
6. Questionnaire #6 balance (communal services): 150 units – 100% coverage
7. Questionnaire #6 balance (sugar): 41 units – 100% coverage (8 legal & 33 physical units)Total number of respondents : 23822 units, 3989 legal and 19833
physical units
Various elements of balances include:
Stocks and losses – corresponding information of agricultural producers, processing enterprises. Storages, wholesale and retail traders, HHs
Losses also includes confiscated quantities, which are not safe to eat
Special calculation
Calculation of consumption of bread, bakery products, rice, groats – data on consumption for food collected from corresponding balances and recalculated to flour and grains multiplying to corresponding coefficients
Calculation of consumption of sugar and products with sugar (recalculated to sugar)
Self-sufficiency Dependency on import Per capita consumption: per year and per day Calorie, protein and fat contents of daily consumption All balances and calculations for calendar year
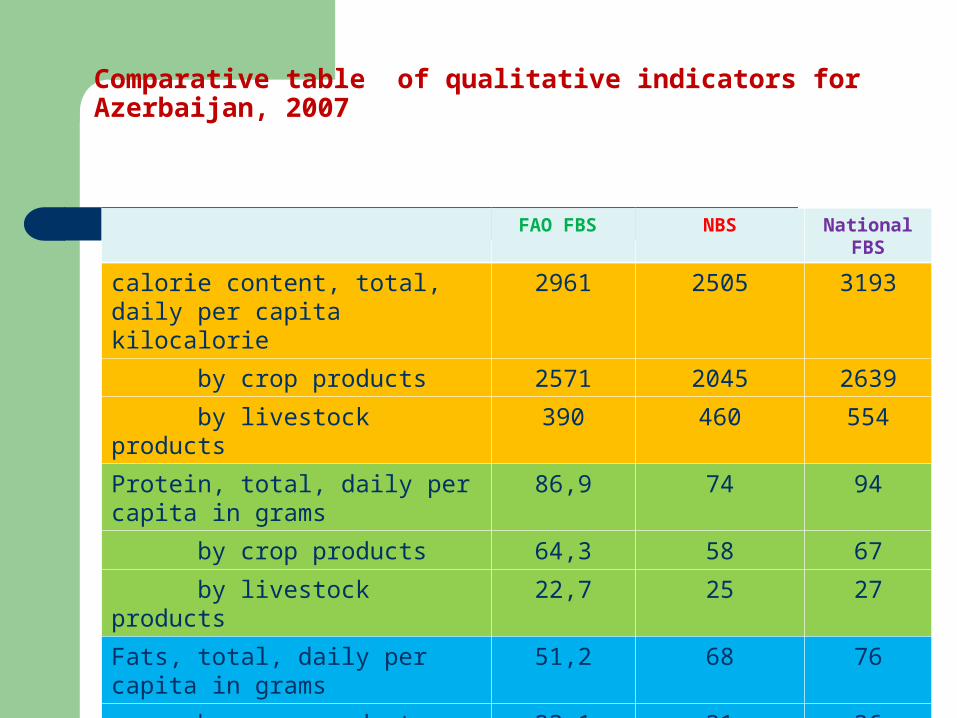
Comparative table of qualitative indicators for Azerbaijan, 2007
FAO FBS NBS National FBS
calorie content, total, daily per capita kilocalorie
2961 2505 3193
by crop products 2571 2045 2639
by livestock products 390 460 554
Protein, total, daily per capita in grams
86,9 74 94
by crop products 64,3 58 67
by livestock products 22,7 25 27
Fats, total, daily per capita in grams
51,2 68 76
by crop products 23,1 31 36
by livestock products 28,1 37 40

Time series of food consumption qualitative indicators in accordance to FBS
2007 2008 2009 2010
calorie content, total, daily per capita kilocalorie 3192,6 3091,5 3316,6 3358,9
by crop products 2639 2524 2558 2572
by livestock products 553,4 567,6 758,3 787,3
Protein, total, daily per capita in grams 94,4 90,4 96,8 96,9
by crop products 67,0 63,0 62,0 61,0
by livestock products 27,2 27,7 35,1 36,3
Fats, total, daily per capita in grams 75,6 76,5 89,6 92,9
by crop products 37,0 36,0 34,0 36,0
by livestock products 39,0 40,2 55,4 57,3

Thank you for attention!
Recommended