Stat 112 Notes 3
• Today:– Finish Chapter 3.3 (Hypothesis Testing).
• Homework 1 due next Thursday.

Confidence Intervals
• Point Estimate for slope: • Confidence interval: range of plausible values for the
true slope • Confidence Interval: where is an estimate of the standard
deviation of ( )Typically we use a 95% CI.
• 95% CI is approximately 95% CIs for a parameter are usually approximately where the standard error of the point estimate is an
estimate of the standard deviation of the point estimate.
1b
95% 11 .025, 2n bb t s
2)1(
11
x
ebsn
ss
1b
11 2* bb s
point estimate 2*Standard Error (point estimate)
1
es RMSE

Property of Confidence IntervalsSuppose each day, you collect data on a new topic and run a regression. On day 1, you collect data (e.g., on wages and education), and construct a 95 % confidence interval (CI) for the slope (1)
1 . On day 2, you collect
new , unrelated data (e.g., on poverty rates and doctors) and construct a 95% CI for the slope (2)
1 . On day 3,
you collect new, unrelated data (e.g., on deer tracks counted and deer density) and construct a 95% CI for the slope (3)
1 . You continue this way, constructing
confidence intervals for a sequence of unrelated slopes (1) (2)
1 1, , Then over many days, about 95% of your CIs
will contain the true slope for that days’s regression problem.

Computing Confidence Intervals IParameter Estimates Term Estimate Std Error t Ratio Prob>|t| Intercept -89.74965 173.4267 -0.52 0.6060 educ 51.225264 12.82813 3.99 0.0001
95% Confidence Interval for slope:
11 .025, 2n bb t s
The sample size is 100n . We look up .025, 2nt on Table B.2.
The degrees of freedom 2 100 2 98n is not listed; we go to the next highest degrees of freedom listed, which is 120. We find .025,120 1.98t . Thus, the 95% confidence interval for
slope is
11 .025, 2 51.23 1.98*12.83 (25.83,76.63)n bb t s .
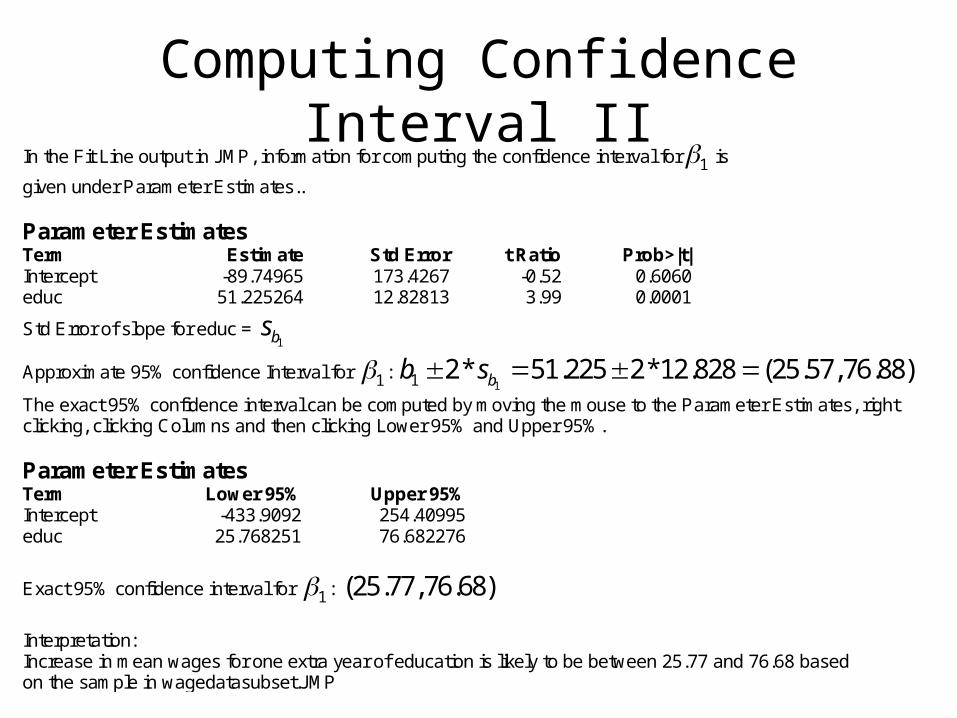
Computing Confidence Interval IIIn the Fit Line output in JMP, information for computing the confidence interval for 1 is
given under Parameter Estimates.. Parameter Estimates Term Estimate Std Error t Ratio Prob>|t| Intercept -89.74965 173.4267 -0.52 0.6060 educ 51.225264 12.82813 3.99 0.0001
Std Error of slope for educ = 1bs
Approximate 95% confidence Interval for 1 : 11 2* 51.225 2*12.828 (25.57,76.88)bb s
The exact 95% confidence interval can be computed by moving the mouse to the Parameter Estimates, right clicking, clicking Columns and then clicking Lower 95% and Upper 95%. Parameter Estimates Term Lower 95% Upper 95% Intercept -433.9092 254.40995 educ 25.768251 76.682276
Exact 95% confidence interval for 1 : (25.77,76.68)
Interpretation: Increase in mean wages for one extra year of education is likely to be between 25.77 and 76.68 based on the sample in wagedatasubset.JMP

Does Playing String Music Change Brain Activity?
• Studies have shown that activity can reorganize the human central nervous system.
• To study this further, psychologists used magnetic source imaging (MSI) to measure neuronal activity in the brains of nine string players (six violinists, two cellists and one guitarist) and six controls when the subject’s thumb and fifth finger of the left hand were exposed to mild stimulations.
• The psychologists felt that stringed instrument players, who use the fingers of their left hand extensively, might show different behavior in the brain – as a result of this extensive physical activity – than individuals who did not play stringed instruments. Specifically, they measured the amount of neuron activity in a region of the brain D5.

Bivariate Fit of Neuron Activity Index By Years Playing
5
10
15
20
25N
euro
n
Act
ivity
Inde
x
0 5 10 15 20
Years Playing
Consider simple linear regression model.
0 1(Neuron Activity Index|Years Playing) *Years PlayingE
If this model describes the data, then we are interested in whether or not 1 0 (Is years playing associated with
neuron activity index?)

Simple Linear Regression ModelBivariate Fit of Neuron Activity Index By Years Playing
5
10
15
20
25
Neu
ron
Act
ivity
Inde
x
0 5 10 15 20
Years Playing
Linear Fit Neuron Activity Index = 8.3872549 + 0.9971405*Years Playing
Checking Assumptions
-6-4-20246
Res
idua
l
0 5 10 15 20
Years Playing
Distributions Residuals Neuron Activity Index
-5 -4 -3 -2 -1 0 1 2 3 4 5
Small data set, so difficult to check assumptions of simple linear regression model but there do not appear to be any gross violations of the model.

Hypothesis Testing Question
0 1(Neuron Activity Index|Years Playing) *Years PlayingE
We are interested in whether or not 1 0 (Is years playing
associated with neuron activity index?) The estimated slope 1b is 0.997. The population of interest is
all people, so this estimated slope from the sample is likely to have some error. Is there strong evidence that the true slope 1 does not equal 0
(i.e., is there strong evidence that string playing affects neuron activity)?

Hypothesis testing for slope
• • Test statistic:
• Reject for (small/large, small, large) values of test statistic depending on . See Figure 3.15 in text book for the decision rules.
• p-value: Measure of how much evidence there is against the null hypothesis. Large p-values indicate no evidence against the null hypothesis, small p-values strong evidence against null.
• Generally accepted rule is to reject H_0 if p-value < 0.05 and not reject H_0 if p-value >=0.05.
*),,(:
),,(:
111
*110
H
H
1
*11
bs
bt
10 ,HH

Risks of Hypothesis Testing
• Two types of errors are possible in hypothesis testing:– Type I error: Reject the null hypothesis when it is true– Type II error: Accept the null hypothesis when it is
false.
• Probability of Type I error when H0 is true = significance level of test, denoted by
• Probability of making correct decision when Ha is true ( = 1-Prob. of Type II error) = power of test

Hypothesis Testing in the Courtroom
• Null hypothesis: The defendant is innocent• Alternative hypothesis: The defendant is guilty• The goal of the procedure is to determine
whether there is enough evidence to conclude that the alternative hypothesis is true. The burden of proof is on the alternative hypothesis.
• Two types of errors:– Type I error: Reject null hypothesis when null
hypothesis is true (convict an innocent defendant)– Type II error: Do not reject null hypothesis when null
is false (fail to convict a guilty defendant)

Hypothesis Testing in Statistics• Use test statistic that summarizes information about parameter in
sample.• Accept H0 if the test statistic falls in a range of values that would
be plausible if H0 were true.• Reject H0 if the test statistic falls in a range of values that would
be implausible if H0 were true.• Choose the rejection region so that the probability of rejecting H0
if H0 is true equals (most commonly 0.05)• p-value: measured of evidence against H0. Small p-values imply
more evidence against H0.
• p-value method for hypothesis tests: Reject H0 if the p-value is . Do not reject H0 if p-value is .

Scale of Evidence Provided by p-valuep-value Evidence against null
hypothesis
> 0.10 No evidence
0.05 – 0.10 Suggestive, but inconclusive
0.01 – 0.05 Moderate
< 0.01 Convincing

Hypothesis Tests and Associated p-values
1. Two-sided test:
Reject if For ,p-value = Prob>|t| reported in JMP
under parameter estimates. 2. One-sided test I:
Reject if For p-value = (Prob>|t|)/2 if t is negative 1-(Prob>|t|)/2 if t is positive
* *0 1 1 0 0
* *1 1 0 0
: (or )
: (or )a
H
H
0H
/ 2, 2 / 2, 2 or n nt t t t
* *0 1 1 0 0
* *1 1 0 0
: (or )
: (or )a
H
H
0H
, 2nt t
*1 0
*1 0

Hypothesis Tests and Associated p-values Continued
2. One-sided test II:
Reject if
For ,p-value = (Prob>|t|)/2 if t is positive
1-(Prob>|t|)/2 if t is negative
0H
* *0 1 1 0 0
* *1 1 0 0
: (or )
: (or )a
H
H
, 2nt t
*1 0

Hypothesis Testing in JMP
• JMP output from Fit Line displays the point estimates of the intercept and slope, standard errors of the intercept and slope ( ), p-values from two-tailed tests of
and .
10, bb ss
0: 00 H 0: 10 H
Parameter Estimates Term Estimate Std Error t Ratio Prob>|t| Intercept 8.3872549 1.114887 7.52 <.0001 Years Playing 0.9971405 0.111045 8.98 <.0001 There is strong evidence that both the intercept and the slope for years playing are not equal to zero

Two Sided TestIs there evidence that years playing string music is associated with neuron activity index?
0 1
1
: 0
: 0a
H
H
Test statistic 1
1 0 0.997 08.98
0.111b
bt
s
Cutoff value: 0.025,15 2 2.160t
Test: | 8.98 | 2.160 . We reject 0 1: 0H . There is strong evidence that years playing
string music is associated with neuron activity index ( 1 0 )
p-value from JMP <.0001

One Sided Test (I)
Is there evidence that playing more years of string music is associated with a decrease in neuron activity index?
0 1
1
: 0
: 0a
H
H
Test statistic 1
1 0 0.997 08.98
0.111b
bt
s
Cutoff value: 0.05,15 2 1.771t (Reject if test statistic smaller than cutoff)
Test: 8.98 1.771 . We do not reject 0 1: 0H . There is not strong evidence that playing
more years of string music is associated with an decrease in neuron activity index.
p-value = 1-.0001
2=.9995
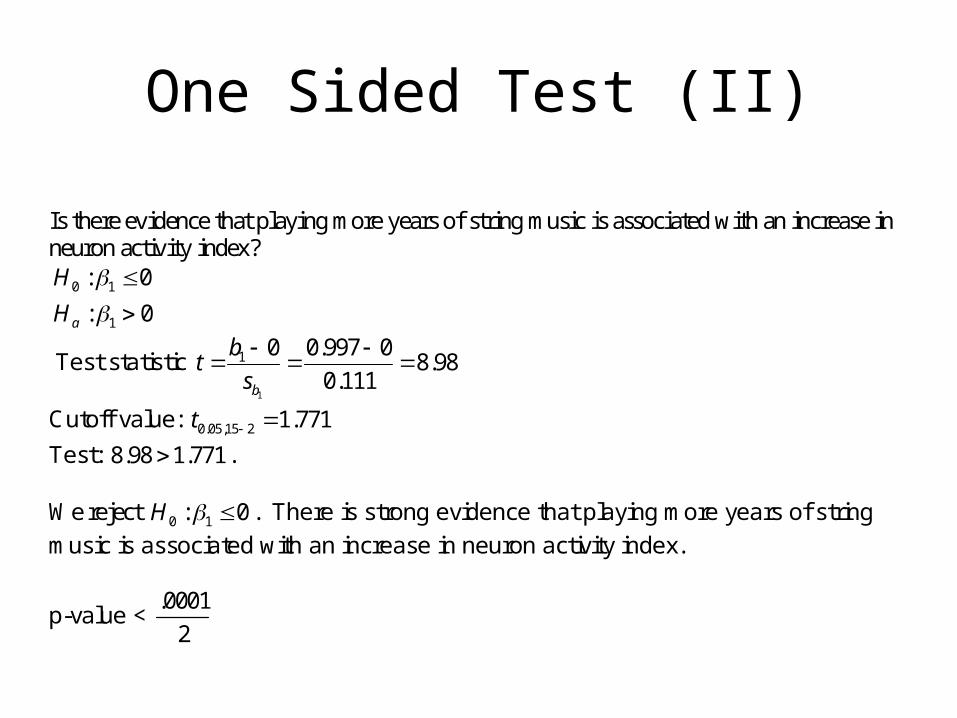
One Sided Test (II)
Is there evidence that playing more years of string music is associated with an increase in neuron activity index?
0 1
1
: 0
: 0a
H
H
Test statistic 1
1 0 0.997 08.98
0.111b
bt
s
Cutoff value: 0.05,15 2 1.771t
Test: 8.98 1.771 . We reject 0 1: 0H . There is strong evidence that playing more years of string
music is associated with an increase in neuron activity index.
p-value < .0001
2

One Sided Test of Non Zero Alternative
Is there evidence that playing an extra year of string music is associated with an increase of more than 0.9 points in neuron activity index?
0 1
1
: 0.9
: 0.9a
H
H
Test statistic 1
1 .9 0.997 .90.87
0.111b
bt
s
Cutoff value: 0.05,15 2 1.771t
Test: 0.87 1.771 . We do not reject 0 1: 0.9H . There is not strong evidence that playing an extra
year of string music is associated with an increase of more than 0.9 points in neuron activity index. (Note: this does not mean that 1 0.9 , just that there is not strong evidence for it).

p-values for Poverty Rates and Doctors Regression
Bivariate Fit of MDs per 100,000 By Poverty Percent
150
200
250
300
350
400
450
MD
s pe
r 10
0,00
0
7.5 10 12.5 15 17.5 20 22.5
Poverty Percent
Parameter Estimates Term Estimate Std Error t Ratio Prob>|t| Intercept 286.84208 33.14046 8.66 <.0001 Poverty Percent -4.329299 2.669525 -1.62 0.1114

Example: One Sided TestDo there tend to be less doctors in states with higher poverty rates? Let Y =MDs per 100,000 X =Poverty Percent Simple Linear Regression Model:
0 1( | )E Y X X
0 1
1
: 0
: 0a
H
H
Because the t-ratio is negative and is on the same side as alternative, the p-value is (Prob>|t|)/2 = 0.1114/2 = .0557. Suggestive but inconclusive evidence that there tend to be less doctors in states with higher poverty rates.

Example Continued: One and Two Sided Tests
Do there tend to be more doctors in states with higher poverty rates?
0 1
1
: 0
: 0a
H
H
Because the t-ratio is negative and on the opposite side of the alternative, the p-value is 1-(Prob>|t|)/2=1-0.1114/2=.9443 Is poverty rate associated with the number of doctors in a state? p-value = Prob>|t|/2 = 0.1114. There is not strong evidence that poverty rate is associated with the number of doctors in a state.
Recommended