arX
iv:a
stro
-ph/
0006
102v
1 7
Jun
200
0
The Effect of Expansion on Mass Entrainment and
Stability of Super-Alfvenic Jets
Alexander Rosen and Philip E. Hardee
Department of Physics & Astronomy
University of Alabama
Tuscaloosa, AL 35487
[email protected], [email protected]
ABSTRACT
We extend investigations of mass entrainment by jets, which previously have
focused on cylindrical supermagnetosonic jets and expanding trans-Alfvenic jets, to a
set of expanding supermagnetosonic jets. We precess these jets at the origin to excite
the helical mode of the Kelvin-Helmholtz (or KH) instability, in order to compare
the results with predictions from linear stability analysis. We analyze this simulation
set for the spatial development of magnetized mass, which we interpret as jet plus
entrained, initially unmagnetized external mass. As with the previous simulation sets,
we find that the growth of magnetized mass is associated with the growth of the KH
instability through linear, nonlinear, and saturated stages and with the expansion of
magnetized material in simulated observations of the jet. From comparison of measured
wavelengths and wave speeds with the predictions from linear stability analysis, we
see evidence that the KH instability is the primary cause for mass entrainment in
these simulations, and that the expansion reduces the rate of mass entrainment.
This reduced rate can be observed as a somewhat greater distance between the two
transition points separating the three stages of expansion.
Subject headings: galaxies:jets — instabilities — MHD
1. INTRODUCTION
Mass entrainment of an external medium into a jet flow affects the spatial development of
the jet and may be a crucial factor in the division between FR I and FR II (Fanaroff & Riley
1974) radio sources. For example, deceleration, presumably via mass entrainment, of a turbulent,
supersonic jet is one of the basic assumptions in the model of Bicknell (1994, 1996) that reproduces
the break between FR I and FR II sources in the radio-optical plane. Additionally, there is
evidence for jet slowing in the low-power radio source B2 1144+35, which is observed to decelerate
from 0.95c to 0.02c between 20 pc and 24 kpc from the core (Giovannini et al. 1999). Mass
entrainment may be important even in slower jet flows, such as the much slower (0.1c) parsec-scale
– 2 –
jets in Seyfert galaxies (Ulvestad et al. 1999). Since our simulations do not include radiative
cooling, which is a crucial element in the energetics of protostellar jets, the simulations we present
here are not strictly applicable to those systems, although perhaps they are appropriate for the
jets in Galactic superluminals.
Rosen et al. (1999, hereafter RHCJ) confirmed that a reasonably strong magnetic field can
slow mass entrainment by a three-dimensional, nonrelativistic, cylindrical supermagnetosonic
jet. RHCJ showed that the spatial growth of mass entrainment is a three-stage process that
corresponds to the growth of the Kelvin-Helmholtz (KH) instability, from a linear stage through a
nonlinear stage to a stage where the growth has become saturated. RHCJ also found three stages
of growth in the width of simulated radio intensity maps of the jets, and that these three stages in
the width are associated with those of the growth of the jet plus entrained mass. However, some
detailed differences did exist in the position of the transition between stages as a function of jet
density. These differences usually occurred for jets lighter than the external medium, and took the
form of continued mass entrainment even though the width in a simulated intensity image of the
jet remained constant. A jet that entrains mass could have an observable spine-sheath morphology,
in which the spine is more disrupted in a jet that is lighter than the external medium. In fact,
recent application of the “spectral tomography” process (Katz-Stone et al. 1999) has revealed the
presence of a low intensity, steep spectrum sheath surrounding a high intensity, flat spectrum core
or jet spine in a few wide-angle tail radio sources. In addition, RHCJ found that the linear growth
of jet plus entrained mass was related to a linear progression as higher order, small amplitude KH
modes with short growth lengths are overwhelmed by lower order, larger amplitude KH modes
with larger growth lengths.
In this paper, we extend our mass entrainment analysis to conical supermagnetosonic jets
that have inlet conditions similar to some of the jets in RHCJ. Based on the KH linear stability
analysis for supermagnetosonic jets in Hardee, Clarke, & Rosen (1997, hereafter HCR), the growth
length at maximum growth (i.e., the inverse of the spatial growth rate at maximum growth) is
proportional to the radius of the jet. Additionally, the maximum growth rates are reduced along
an adiabatically cooling jet, in which the Mach number increases with the jet expansion (Hardee
1986). Thus, in general on supermagnetosonic jets the instability should grow more slowly as the
radius expands than on a cylindrical jet. We investigate whether expanding supermagnetosonic
jets are more stable than similar cylindrical jets and also whether expanding jets show the similar
association between the spatial development of mass entrainment, the spatial development of
the KH instability and the spatial development of the apparent width of magnetized material
in simulated radio intensity images that has been seen previously in cylindrical jet simulations
(RHCJ).
Examination of the potentially smaller effects of the KH instability on conical jets is an
important extension of previous work, as there are observational examples of conical jets, some
of which expand by orders of magnitude and remain undisrupted for more than 100 kpc. For
example, the jet in M87 expands at a nearly constant rate in a recent high resolution (0.′′1 ≈ 8.2
– 3 –
pc) radio image of the source out to knot A (Biretta, Zhou, & Owen 1995). Another example of
jet expansion is provided by NGC 6251, which has a jet that passes through a series of expansions,
each of which has an average half-opening angle of ≈4◦ for at least 10 kiloparsecs in length (Perley
et al. 1984). The jets in both of these radio sources appear more laminar than turbulent in the
regions where the jets are conical.
Since we aim to investigate the spatial growth of the KH instability and mass entrainment,
the simulations we discuss here span a significant axial length and are considered completed only
after much of the computed region reaches a quasi-steady state. This approach contrasts with
that of numerical simulations with periodic boundary conditions along the jet axis, e.g., Bassett
& Woodward (1995), Bodo et al. (1995), and Bodo et al. (1998), which focus on temporal growth.
This paper is organized as follows: in §2, we explain the initialization of the 3D MHD simulations,
and in §3, we discuss, in order, the growth of mass entrainment, the observational characteristics
associated with mass entrainment in simulated (radio wavelength) intensity and polarization
images, and the testing of the presence and measurable consequences of the KH instability.
2. INITIALIZATION OF NUMERICAL SIMULATIONS
These simulations were performed with the three-dimensional magnetohydrodynamics code
ZEUS-3D, an Eulerian finite-difference code with the Consistent Method of Characteristics
(CMoC) that solves the transverse momentum transport and magnetic induction equations
simultaneously and in a planar split fashion (Clarke 1996). Interpolations are carried out by
a second-order accurate monotonic upwinded time-centered scheme (van Leer 1977) and a von
Neumann-Richtmyer artificial viscosity is used to stabilize shocks. The code has been thoroughly
tested via MHD test suites as described by Stone et al. (1992) and Clarke (1996) to establish the
reliability of the techniques.
The useful computational domain for the three expanding jet simulations discussed here is
a 3D Cartesian grid of 325 × 130 × 130 zones, which required roughly 105 Mwords of memory
on the Cray C90 at the Pittsburgh Supercomputer Center (or PSC). The central thirty zones
span the initial jet diameter, 2R0, along the transverse Cartesian axes (the x-axis and y-axis).
Outside the uniform grid zones, the grid zones are ratioed where each subsequent zone increases
in size by a factor of 1.050. The 130 transverse zones span a total distance of 30R0. Along the
jet or z-axis, 225 uniform zones span the interval 0 < z/R0 < 30 and an additional 100 ratioed
zones span an additional 30R0 with each subsequent zone increasing in size by a factor of 1.015.
Outflow boundary conditions are used except where the jet enters the grid, where inflow boundary
conditions are used.
The three simulations are initialized at the inlet with parameter values similar to simulations
in HCR and RHCJ. Specifically, simulation A here is equivalent to run C in RHCJ, simulation B is
equivalent to run A, and simulation C is equivalent to run E. Simulations A and B contain jets that
– 4 –
are denser than the external medium and simulation C is of a light jet. Details of jet properties
are listed in Table 1. While some simulations in RHCJ had a primarily toroidal magnetic field,
all of the simulations here have a primarily axial magnetic field. Limiting this study to axial
field jets was done to maximize the instability of the jet, since we anticipate expanding jets to be
more stable and we know that a toroidal magnetic field can have an additional stabilizing effect
(compared with a primarily axial magnetic field of the same strength, e.g., Appl & Camenzind
1992; RHCJ). A smaller jet velocity, u, is used in order to reduce all of the Mach numbers (i.e.,
sonic, Alfvenic, and magnetosonic) because we wish the instability to grow significantly while
the jet is within the computational domain and the growth length of the instability is roughly
proportional to the product of jet radius and magnetosonic Mach number, with Mms ≡ u/ams.
The magnetosonic speed is defined as a2ms ≡ a2jt + V 2A, where the internal jet sound speed and
the Alfven speed are defined by a2jt ≡ Γp/ρ and V 2A ≡ B2/4πρ, respectively, and we assume the
adiabatic gas law, P ∝ ρΓ with Γ = 5/3. We have analyzed the simulations at a somewhat later
time, at τ = 45 dynamical times for simulations A and B compared with τ = 36 in RHCJ and τ
= 16 for simulation C compared with τ = 14 in RHCJ, where τ ≡ taex/R0 and aex is the external
sound speed. The jets in all of the expanding jet simulations pass through at least 3 flow-through
times at z = 50R0. Each simulation required about 40 CPU-hours on the Cray C90 at PSC.
The jet is initialized across the computational domain with a uniform density, ρjt, and initial
radius, R0. The magnetic field within the jet is initialized with a uniform axial component, Bz, for
r < R0, where r is the radial position, and a toroidal magnetic component, Bφ, with a radial profile
that has the form Bφ(r) = Bpkφ sin2[πf(r)], where Bpk
φ is the maximum value for Bφ and for r < rpk,
f(r) = 0.5(r/rpk)a, and for rpk < r < rmax, f(r) = 1.0 − 0.5 [(1− r/rmax) /(1 − rpk/rmax)]
b. In
these simulations a = 1.106 and b = 0.885, which leads to a FWHM of the Bφ radial profile equal
to 0.5R0. This radial profile for Bφ, which sets Bφ to zero at r/R0 = 0.0 and for r/R0 ≥ 0.9, is
not physically motivated, but is mathematically well-behaved. The magnetic field is set to zero
in the external medium. The jet thermal pressure is initially modified to satisfy an equation of
hydromagnetic equilibrium,
d
dr
(
pjt(r) +B2
z(r)
8π+
B2φ(r)
8π
)
= −B2
φ(r)
4π, (1)
where the term on the right hand side describes the effects of magnetic tension. Note that this
equilibrium condition is one of static balance, but does not necessarily lead to hydromagnetic
dynamic equilibrium, which is determined by the condition ∇× (u×B) = 0. Owing to the small
toroidal field in each of these simulations, this dynamic equilibrium is nearly satisfied and we have
verified that no significant azimuthal velocity occurs within the jet near the inlet. The inlet values
for Bz and Bpkφ are given in footnotes to Table 1 in the units used by ZEUS-3D, which sets the
permeability of free space to 1. While the thermal pressure has been modified to satisfy the radial
static equilibrium, the departure from a “top hat” pressure distribution is small. The typical
plasma β0 ≡ 8πpjt/B2z is 200 in simulation A and 1.1 in simulations B and C.
– 5 –
In the simulations the external medium is isothermal and the external density, ρex(z),
declines to produce a pressure gradient that is designed to lead to a constant expansion,
Rjt(z) = (1+ z/120R0)R0, of a constant velocity adiabatic jet containing a uniform axial magnetic
field and an internal toroidal magnetic field that provides some confinement, i.e.,
ρex(z) =
(
−10/3 + C1−4 − C2
−2
)
C3
(2)
where = R(z)/R0, R(z) is the jet radius at axial position z, the constants C1 and C2 are based
on the ratios at the inlet of jet thermal pressure to magnetic pressure from the axial component
(in C1) or from the toroidal component (in C2), and C3 is a normalization constant equal to 1 +
C1 - C2. We have confirmed that the initial expansion occurs quickly, within 5–7 dynamical times
for the dense jet simulations and 1–2.5 dynamical times for the light jet simulation.
A difference between these simulations and their cylindrical equivalents in RHCJ is a slightly
reduced angular precessional frequency, ω (see Table 2). We decrease ω to obtain the same
normalized precession frequency, ωR(z)/aex, at some small (but nontrivial) distance from the
inlet in each expanding jet as in the appropriate cylindrical equivalent. The spatial KH stability
analysis of expanding jets suggests that at peak growth the normalized precession frequency is
constant (Hardee 1986); our choice for the precession frequency, ω, is below that for peak growth,
but ωR(z)/aex will increase with jet expansion. This avoids the unresponsiveness of a jet to too
high a precessional frequency. The precession is in the counterclockwise sense at the inlet and
should yield a clockwise spatial helical twist when viewed downstream from the origin/inlet. The
simulations are analyzed at 6.5, 7.9, and 3.6 precessional periods for simulations A, B, and C,
respectively. Another difference between the simulation sets is that the radial variation of the
toroidal magnetic field component, Bφ, peaks at 0.5R0 in the expanding jet simulations, while in
all three cylindrically equivalent simulations in RHCJ this maximum in Bφ occurred at r = 0.8R0.
However, since the toroidal field is not dynamically important in these simulations, this difference
is inconsequential.
3. RESULTS
3.1. Linear Mass Density as a Mass Entrainment Estimator
Since the code does not include a tracer of jet material, we use magnetic field and axial
velocity criteria to estimate the mass associated with the jet plus any external medium that
has been accelerated or mixed with the jet sufficiently to be called “entrained” (RHCJ). Such
a velocity criterion has been used previously as an estimate for mass entrainment (Bassett &
Woodward 1995, Loken 1996). Since RHCJ found that the choice of the magnetic field or axial
velocity criteria result in similar values for the estimated jet plus entrained mass, we have chosen
– 6 –
to use the magnetic field criterion alone in this paper. As in RHCJ, we define the linear mass
density, σ, at any point along the jet as
σ(z) =
∫
A
fρ dx dy, (3)
where A is the cross-sectional area of the computational domain at z, and f is a switch set to 1 if
the local magnetic field is above a threshold value and f = 0 otherwise. We set the threshold to
0.04Bmax, where B2max ≡ Bpk
φ (z)2 +Bz(z)2. In a steady expanding flow, Bφ varies as R(z)−1 and
Bz varies as R(z)−2. While the choice of the 4% level is somewhat arbitrary, we believe that a
threshold at this value is a useful demarkation between “mixed” (i.e., jet plus entrained material)
and “unmixed” media. The unmixed external medium may contain some small magnetic field
from numerical diffusion and should not be considered as entrained. In our previous simulations,
this 4% Bmax level corresponded to external material accelerated up to ∼ 15% of the jet speed in
the dense jets and ∼ 4% of the jet speed in the light jet. In a smooth flow of constant jet speed
without entrainment, the linear mass density remains constant for both cylindrical and expanding
jets. In what follows, σ(z) is the linear mass density for the axial position z normalized to the
initial jet linear mass density.
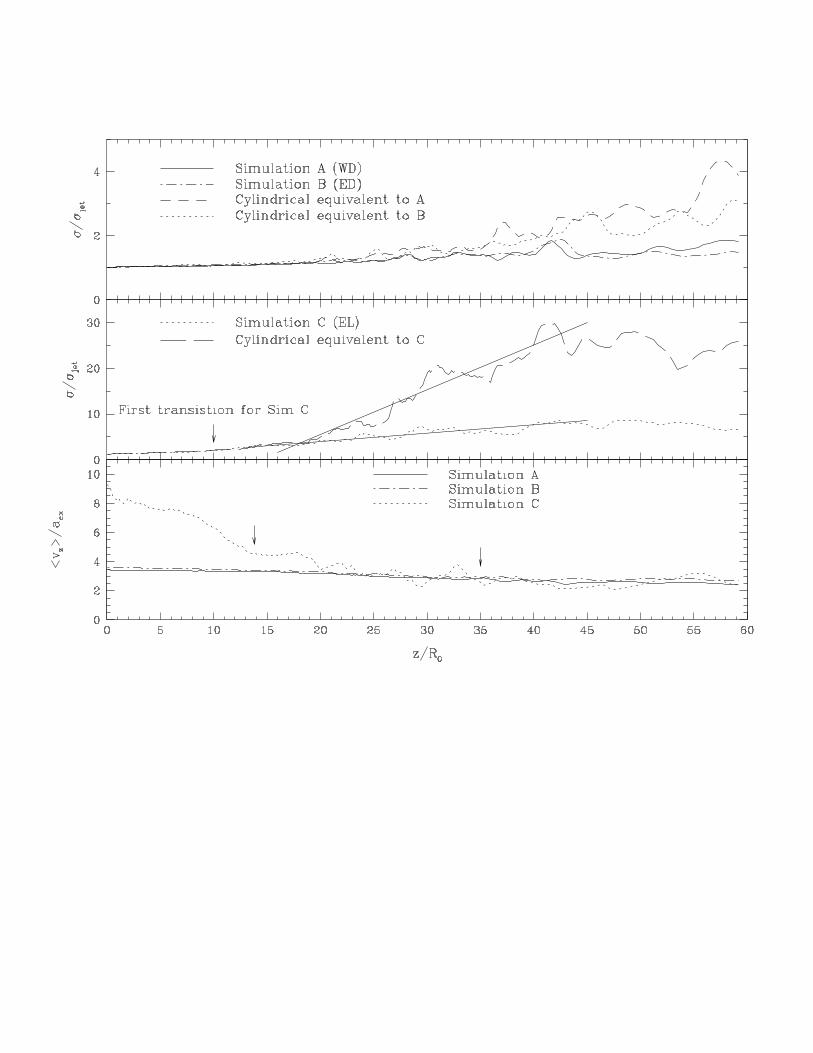
We display the spatial development of σ(z) for the expanding jet simulations and for the
equivalent cylindrical jet simulations in Figure 1. In addition, the bottom panel of Figure 1 shows
the average axial velocity of the magnetized (with B > 0.04Bmax) material, weighted by the linear
mass density (i.e. 〈vz〉 =∫
fρvz dx dy/∫
fρ dx dy), along z. From a comparison of the linear mass
density in equivalent cylindrical and conical jet simulations, the jet plus entrained mass at the
z = 60R0 boundary is reduced by roughly one-half in the dense jets and by at least two-thirds
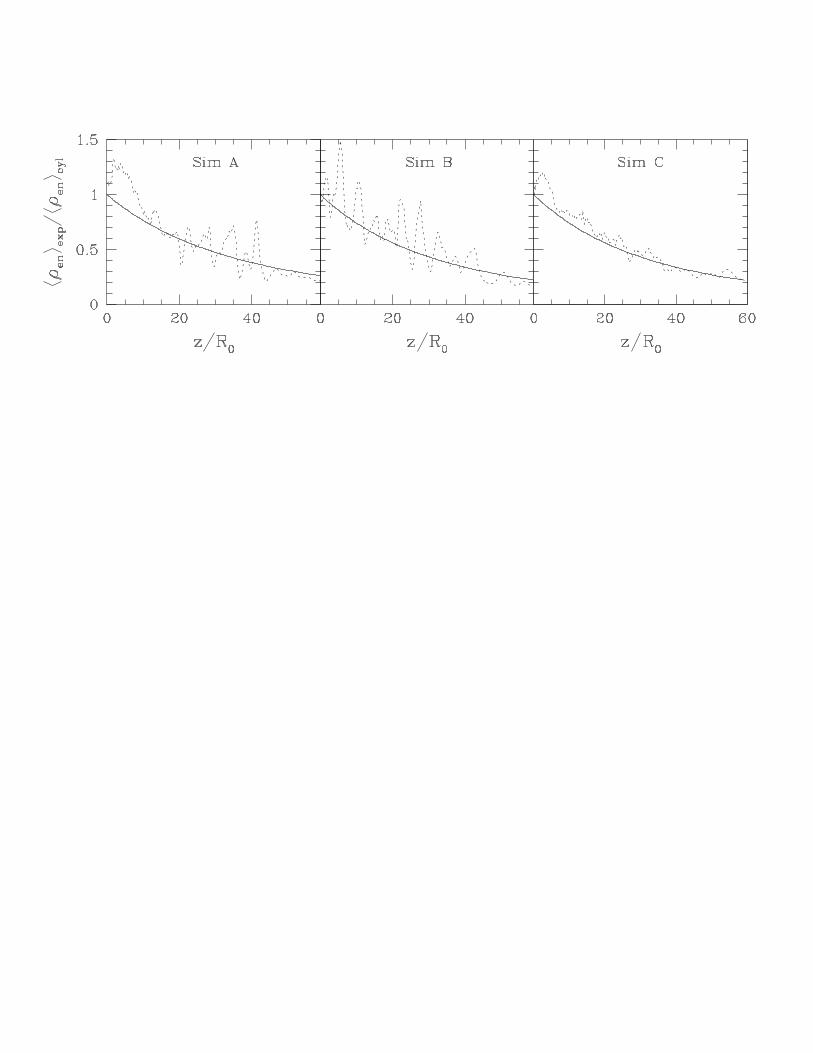
in the light jet (see Table 3). Calculations of the mean density of entrained material (see Figure
2), which is defined as the mixed linear mass density less the initial jet linear mass density and
corrected for different cross-sectional areas, shows that this mean density is similar to the initial
external medium density. Thus, the primary reason for the reduction in entrained mass is the
reduced external density in the expanding jet simulations, which is required by total pressure
balance between the expanding jet and the isothermal external medium. For the parameters that
we have simulated, the reduction of σ in the expanding jets appears similar to (for the dense jets)
or greater than (for the light jet) the reduction caused by changing the magnetic field configuration
from primarily axial to primarily toroidal in the cylindrical jet simulations of RHCJ.
In RHCJ, the linear mass density plots showed regions with different rates of increase of σ(z)
with z, which we interpreted as different mass entrainment rates. Specifically, successive regions
of slow, fast, and no mass entrainment (i.e., mass mixed with the fast moving jet as measured by
our magnetic criterion) were found, and there was evidence that the three stages of growth were
associated with linear, nonlinear and saturated growth of the KH instability. In both dense jets
(simulations A and B), the rate of increase of linear mass density with axial position remains
approximately constant for the entire range plotted. However, for z/R0 ∼> 20 the fluctuation of σ
– 7 –
about this constant rate also increases with z, which is consistent with the notion of increasingly
large “gulping” vortices, such as those discussed by DeYoung (1996), at the jet surface. This in
turn is a signature of a developing KH instability. In addition, there are noticeable changes in
∂σ/∂z near this position (z/R0 ∼ 20) when the linear mass density is computed with a smaller
threshold value (i.e., smaller than 4%). If the onset of the fluctuations in σ in the dense expanding
jet simulations is associated with the first transition point, then the first transition points of the
dense jet simulations occur at roughly the same axial positions as that of the first transition points
in their cylindrical equivalents (see Table 3).
Of the dense expanding and cylindrical jet simulations, only the linear mass density in the
cylindrical equivalent to the weak field jet (simulation A) could be interpreted as leveling off before
the outer z boundary. From our analysis of the growth of magnetized mass in the simulations
here and in RHCJ, we suspect that the linear mass density in the dense expanding jets would
eventually saturate beyond the second transition (saturation) position in the cylindrical jets. If
this is true, then the distance between the first and second transition points would be larger in the
dense expanding jets than in their cylindrical equivalents.
In the expanding light jet (simulation C), there are three regions of differing rates of increase
of σ(z) with z. Estimated rates of increase are shown for the second (fast growth) stage in the
light jet simulations in Figure 1. Transition points between each region are listed in Table 3 for
the expanding and cylindrical jets simulations. The first transition point is significantly closer to
the inlet in the expanding jet simulation than in the cylindrical jet simulation. Since the second
transition point is at roughly the same position in both the expanding and cylindrical jets, we see
that the distance between the first and second transition points is larger in the expanding jet than
in the cylindrical jet. As with the dense jets, the light expanding jet has a smaller spatial rate of
increase of σ(z) with z in the fast growth region than the light cylindrical jet.
We postulate that the KH instability is associated with the mass entrainment in these
expanding jet simulations and compare the transition positions in Table 3 with estimates of the
growth lengths of the KH instability determined from a linear analysis. Estimated growth lengths
of the helical surface wave (n = 1, m = 0) for both the expanding and cylindrical simulations
are listed in Table 4. All of these estimates are from the simple approximation for the growth
length at the maximum growth rate, l∗ = k∗−1
I = −(2Mmsjt R)/ ln(4ωnmR/aex) (equation 5 in
HCR), where ωnmR/aex = (n + 2m + 1/2)π/2 (equation 4a in HCR). Note that this method
consistently underestimated the values found from more sophisticated root-finding techniques for
the cylindrical jet simulations in RHCJ. Since the growth length depends strongly on the jet radius,
for the expanding jet numerical integration was used to compute the number of effective e-folding
lengths, Ne, such that Ne =∫ zz=0
kI(z)dz (equation [17] in Hardee 1986). From the smaller inlet
magnetosonic Mach number, the expanding jets have a slightly smaller initial e-folding length
than their cylindrical equivalents. The similar e-folding length for the expanding and cylindrical
jets is consistent with the similar (or smaller in the light expanding jet) axial position of the
first transition point. The increasing radius of an expanding jet leads to a larger distance for 5
– 8 –
e-foldings, which suggests that the expanding jet simulations should remain more stable farther
down the grid. This greater stability is consistent with the larger distance spanned between first
and second transition points in the expanding jets than in their cylindrical equivalents.
The average axial velocity of the magnetized material decreases at the same rate with z in
the dense expanding jet simulations (simulations A and B). This is similar to the constant rate of
increase in the linear mass density, although the significant fluctuations in σ are absent in 〈vz〉. In
the light expanding jet (simulation C), there are at least three regions where the average axial
velocity behaves differently, and these regions are roughly coincident with the regions of differing
mass entrainment rates. Specifically, there is an initial region out to z/R0 ∼< 14 where there are
very small fluctuations in the average axial velocity, which changes its smooth rate of decline at
z/R0 ≈ 8. Beyond this initial region with small fluctuations, there are significant fluctuations
superimposed on a roughly constant decrease in the average axial velocity for 14 ∼< z/R0 ∼< 35,
and there are small fluctuations about an approximately constant 〈vz〉 thereafter. The greater
reduction in average velocity in the light jet simulation compared with the dense jet simulations
is a result of mixing of the jet with the denser external medium. The region of approximately
constant 〈vz〉 in the light expanding jet suggests that any mixing has ceased and is consistent with
the saturation of the KH instability.
We calculated (but do not show) the transverse area covered by magnetized material with
B > 0.04Bmax. In general, the area occupied by magnetized material is approximately the same
for the dense expanding jets and for their cylindrical equivalents at any computed z. The area
occupied by magnetized material in the light expanding jet simulation is slightly smaller than
the area of its cylindrical equivalent. Therefore, the relative increase in the area occupied by
magnetized material, i.e. (magnetized area)/(initial jet area), is smaller in all expanding jet
simulations than in their cylindrical equivalents. This is consistent with a smaller spatial growth
rate of the KH instability. In addition, we computed (but do not show) the linear momentum flux
density, σv2z , of the mixed and unmixed regions. As in the trans-Alfvenic jets studied in Hardee
& Rosen (1999), the mixed material carries the bulk of the momentum flux. The maximum
momentum flux density carried by the unmixed material in any computed plane of transverse
zones is about 10% of the initial jet momentum flux density for the dense jets (simulations A and
B) and about 5% for the light jet (simulation C).
3.2. Comparison of Linear Mass Density and Simulated Radio Images
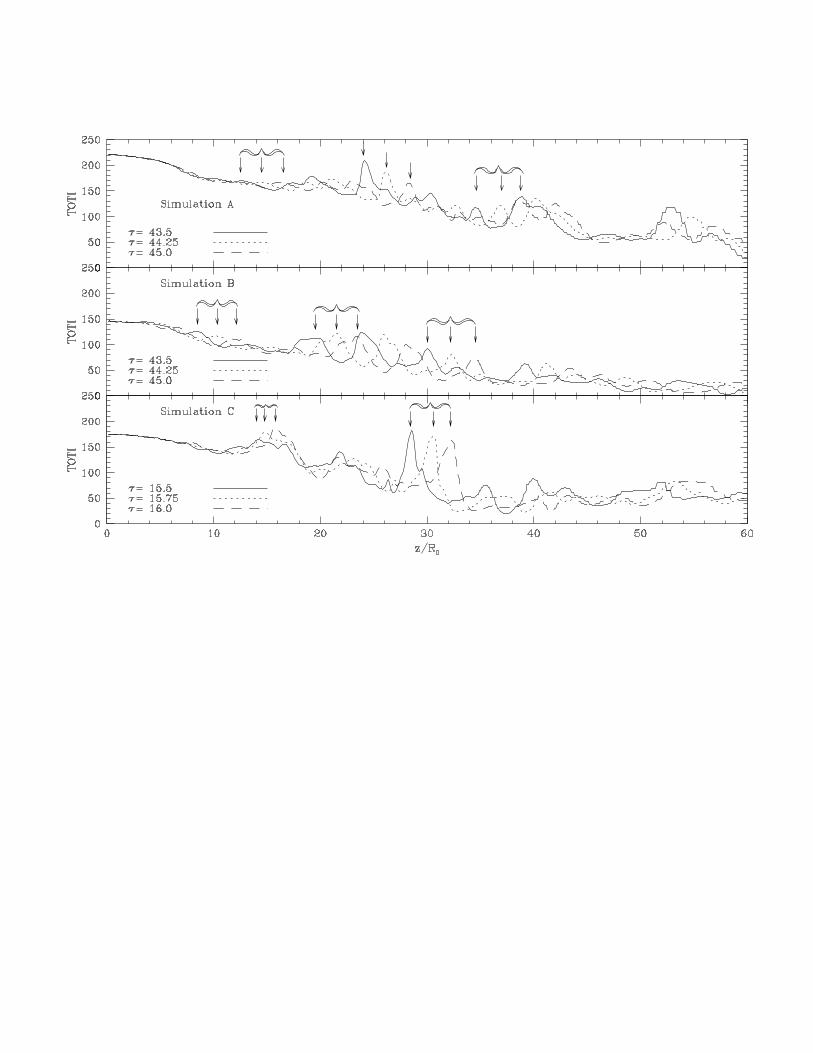
In Figure 3 we display maps of simulated total radio intensity, which are line of sight
integrations of pth(B sin θ)3/2, where θ is the angle between the line of sight and the magnetic
field (Clarke 1989). Such an approximation is necessary when relativistic particles are not tracked
explicitly. The total intensity is integrated along the y-direction and is plotted on the xz-plane in
the figure. In order to compare the morphology of the images, we have used different scales in
each panel of Figure 3. In each panel, the range covers 3 orders of magnitude and the grayscale
– 9 –
maximum is 20% above the actual maximum intensity. The total intensity is overlayed by B-field
polarization vectors. We note that B-vectors are aligned with filaments in the intensity image,
as was also the case in the simulations in RHCJ. Of the three jets, the dense equipartition jet
(simulation B) has the most obvious spine-sheath morphology in the intensity images and also
maintains the spine farthest across the grid. The light jet simulation (simulation C) has a more
uniform intensity for z/R0 ∼> 40 than the dense expanding jet simulations, which is evidence for
more uniform mixing and is consistent with a saturation of the KH instability.
In the cylindrical jets studied in RHCJ, the slow, fast, and saturation stages of mass
entrainment and the KH instability are associated with slow, fast, and zero expansion rates of the
combined spine and sheath in the simulated intensity image. The transition points between the
different expansion rates, as determined from Figure 3, are listed for both the expanding jets and
their cylindrical equivalents in Table 5. In the dense expanding jet simulations presented here
(simulations A and B), a low intensity quickly expanding sheath appears at z/R0 ≈ 20. This rapid
expansion ceases for z/R0 ∼> 50 in the simulation with the stronger field (simulation B), another
indication of somewhat greater stability. The intensity image in simulation B appears to enter the
third (saturation) stage although no equivalent stage for the magnetized mass (σ) appears on the
grid (see Fig. 1). This suggests that this simulation continues to entrain mass for some distance
beyond where the apparent expansion stops. This characteristic was seen in some of the cylindrical
simulations of RHCJ, although this usually occurred for light cylindrical jets. In simulations A
and B, the transition points of the total intensity expansion listed in Table 5 are similar to those
listed for the linear mass density in Table 3. We note that the fluctuations in the linear mass
density may be associated with growing vortices at the jet/external medium interface, and there is
evidence for such vortices in the wispy edges of the total intensity images in simulations A and B.
There are three stages of expansion in the total intensity image from the light jet simulation
C; particularly notable is the nearly constant width for z/R0 ∼> 45. Again we see a correspondence
between the transition positions determined from the linear mass density and from the total
intensity width. As with the transition points demarking different mass entrainment rates, the
distance between the two transition points determined from the intensity images for the expanding
jets is larger than the distance between the transition points for the cylindrical jets. This result
is consistent with the initially shorter e-folding lengths but longer distances to 5 e-foldings on the
expanding jet when compared to the cylindrical jet (see Table 4). Thus, jet expansion has served
to partially stabilize the lower magnetosonic Mach number expanding jet relative to a cylindrical
jet and the total intensity images show observational consequences of this stabilization.
3.3. Jet Structure Related to Mass Entrainment and KH Instability
In this subsection, we compare wavelengths and wave speeds measured in the simulations
with those expected from a linear analysis of KH induced modes. Subsequently, we examine the
effect of the KH instability on the fluting of the jet surface via axial velocity cross-sections and on
– 10 –
internal structure via axial cuts of each velocity component.
3.3.1. Wavelengths and Wave Speed Estimates
From the oscillations observed in the intensity images (Fig. 3), we estimate the wavelength of
the surface helical mode, λh, to be: in simulation A, 15R0; in B, 13R0; and in C, 18R0. The error
in this estimate is roughly 10%. We measured these wavelengths in a region centered on z/R0 =
25 in simulations A and B, and z/R0 = 20 in simulation C; recall that the wavelength at maximum
growth should be proportional to the jet radius. The expanding jets have a smaller precessional
frequency, a lower jet velocity and a different wave speed than their cylindrical equivalents. These
factors combine to give similar wavelengths in the expanding jets and their cylindrical equivalents
(see Table 5).
If the observed wavelength of a mode is much larger than the wavelength associated with peak
growth, λh > 10λ∗, then the wave speed should be roughly ηu/(1 + η). However, if λ∗ ≤ λh ≤ 3λ∗,
the wave speed approximations for peak growth are more appropriate, and the wave speed should
be ≈ η1/2u/(1 + η1/2) (e.g., Hardee 1987, and HCR). From the approximation (4b) in HCR for
the wavelength at maximum growth, we estimate in simulations A and B at z/R0 = 30 that
λ∗ = 10R0 and in simulation C at the same position λ∗ = 16R0. Thus, the measured wavelengths
indicate that the wave speed in these simulations should be ≈ η1/2u/(1 + η1/2). Assuming that
the initial values for the external density and the jet densities follow from the expected expansion,
this approximation yields the wave speeds given in Table 6. These wave speeds are consistent with
wave speeds estimated from the product of the observed helical mode wavelength and the driving
frequency, ν ≡ ω/2π (also in Table 6).
In order to calculate the wave speed directly, we measure the movement over time of
maxima in axial profiles of the simulated total intensity images (Figure 4). The linear analysis
approximation for wave speed suggests that the wave speed should increase only moderately with z
in the dense jet simulations. On the other hand, the wave speed should increase more dramatically
in the light jet simulation. Specifically, in the weak magnetic field dense jet (simulation A), the
wave speed increases from ∼ 2.3aex at z/R0 ∼ 15 to ∼ 2.7aex in the 25 ∼< z/R0 ∼< 40 interval. In
the more strongly magnetized dense jet (simulation B), the wave speed increases from ∼ 2.7aex at
z/R0 ∼ 10 to ∼ 2.9aex for 30 ∼< z/R0 ∼< 50. Thus, the wave speed in the dense jets increases by
roughly 10–20% over this range of axial positions. In contrast, in the light jet simulation the wave
speed increases from ∼ 3.0aex at z/R0 ∼ 15 to ∼ 7.6aex at z/R0 ∼ 30. The large wave speed,
which occurs where the KH instability has reached nonlinear proportions, does not increase much
beyond this axial position. It is likely that this constant wave speed is related to saturation of
the KH instability (as inferred from the saturation in the linear mass density and the constant
apparent width of the intensity image) for z/R0 ∼> 40.
The measured wavelengths and wave speeds, except where the amplitude of the KH instability
– 11 –
has grown beyond the linear approximation, are consistent with those estimated from the linear
analysis of the KH instability. Thus, we conclude that the KH instability is responsible for the
growth of mass entrainment in these simulations.
3.3.2. Cross-Sections of Axial Velocity
The growth of the KH instability and its effect on the jet is dramatically demonstrated in the
grayscale cross-sections of axial velocity from simulations A, B, and C in Figure 5. As observed
in magnetic pressure cross-sections in previous simulations (RHCJ), there are many corrugations
in the fast moving surface at z/R0 ≃ 15 in all three simulations. That the many corrugations are
roughly evenly spaced circumferentially on the jet is evidence for the surface waves of high order
fluting modes. In all the simulations here and in simulations in RHCJ, the higher order modes that
dominate close to the inlet are overwhelmed by the larger distortion amplitudes accompanying the
slower growing, lower order modes farther down the jet. In Figure 5 the helical mode appears as
the clockwise motion of the jet center about the initial jet axis as one moves down the jet. This
clockwise rotation about the jet axis provides an additional estimate for the wavelength of the
helical mode. In the light jet simulation, λh/R0 ≈ 35 between z/R0 = 25, where much of the jet is
to the left of the original jet axis, and z/R0 = 40, where the jet has been displaced to the upper
right. This wavelength is consistent with the very large wave speed (vw/aex = 7.6) measured at
large z/R0.
There is also a correspondence between features in the intensity images and the axial velocity
cross-sections. Recall that the simulated intensity images are integrated along the y axis and
the observer in Figure 3 is to the right in Figure 5. For the light expanding jet simulation,
a spine-sheath morphology is more evident in the cross-sections than in the intensity images.
However, far from the inlet the area of the high vz material is smaller than for the dense expanding
jets. This is another indication of greater mixing occurring in the light jet simulation.
3.3.3. 1D Axial Cuts of Velocity
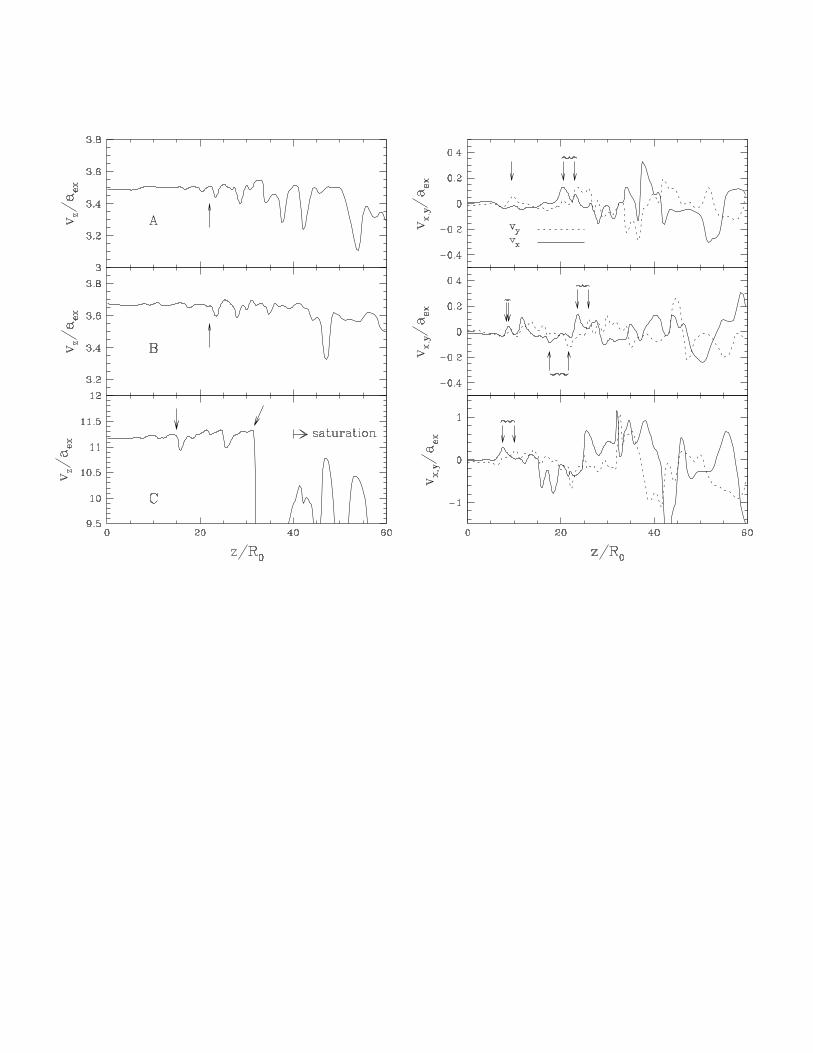
The effect of the KH instability on the internal structure of the jets is demonstrated by the
one-dimensional cuts of velocity components along the jet axis (x, y = 0) shown in Figure 6. In all
three simulations, the variation in the axial velocity component is initially small, ∼< 2%. At some
point the variation grows to significant amplitude relatively abruptly. For the dense jet simulations
this occurs at z/R0 ∼ 22, and for the light jet simulation this occurs at z/R0 ∼ 15. These positions
are close to the first transition point (in either magnetized mass or width of the simulated intensity
image) in all three jets. Thus, changes in the nature of the mass entrainment rate associated with
the growth of the KH instability are able to affect the jet dynamics significantly.
Continued growth of the KH instability as illustrated by axial profiles of vz differs in the dense
– 12 –
jet simulations beyond the first transition point. Specifically, there are significant oscillations of vzin simulation A for 20 ∼< z/R0 ∼< 42, but oscillations in simulation B remain relatively small out
to z/R0 ∼ 47. The smaller variations in the more strongly magnetized jet imply greater stability.
In the light jet simulation, there is an additional, extremely abrupt (0.75u) decrease in vz at
z/R0 ∼ 31. Examination of the axial velocity cross-sections in Figure 5 reveals that this extremely
abrupt drop in axial velocity in the light jet simulation is created as the small high velocity spine
is displaced off the axis by the helical mode of the KH instability, and is not associated with the
onset of the plateau in the jet plus entrained mass. The second transition position in the light jet
does coincide with the reappearance of the vz maxima in Figure 6.
In the dense jet simulations the transverse velocity components show a noticeable relative
phase shift in the region 10 ∼< z/R0 ∼< 30. We consider the maximum in vy at z/R0 = 10 in
simulation A to be a precursor of, and therefore connected to, the maxima in vx at z/R0 = 21
and in vy at z/R0 ∼ 23. The phase shift is more easily seen in the more strongly magnetized jet
(simulation B), with extrema in vx at z/R0 = 12, 18, and 23 repeated in vy at z/R0 = 13, 21,
and 25. In the light jet simulation, the evidence for a relative phase shift between the transverse
velocity components is less obvious, but perhaps the maximum in vx at z/R0 = 7 contributes
to the maximum in vy at z/R0 = 10. In all of the simulations, the extent of the region where
the phase shift is noticeable is related to the growth of the helical mode of the KH instability:
the region begins where the fluctuations in transverse velocity reach a significant amplitude and
ends where the displacement from the KH instability has become significant. Where noticeable,
vy is shifted farther down the jet than vx. Such a sequence is in the sense of a clockwise spatial
variation when viewed toward +z from the inlet and consistent with the counterclockwise temporal
precession at the inlet described in §2. This phase shift is additional evidence for a significant
presence of the helical KH mode.
4. CONCLUSIONS
The magnetized, or jet plus entrained, mass in these expanding jet simulations increases
more slowly than in their cylindrical equivalents. This reduction in the mass entrainment is
a direct consequence of the reduced external mass density, which is required by an expanding
pressure-matched jet. For the parameters that we have simulated, the reduction of magnetized
mass in the expanding jet simulations appears similar to (for the dense jets) or greater than (for
the light jet) the reduction caused by changing the magnetic field configuration from primarily
axial to primarily toroidal in the cylindrical jet simulations of RHCJ. Thus, a conical jet appears
more stable than its cylindrical equivalent, and should be considered, along with relativistic jets
(Hardee et al. 1998; and Hughes, Miller, & Duncan 1999), as another stabilizing influence in the
propagation of astrophysical jets.
As in the cylindrical jet simulations, the spatial development of the magnetized mass passes
through different stages, in which the spatial rate of increase of magnetized mass or the smoothness
– 13 –
of this increase is different. We see evidence for a first transition, between a region of a nearly
constant increase in magnetized mass and a more varied increase in magnetized mass in the
dense jets. In the light jet simulation this first transition occurs between a region with a slow
increase in magnetized mass to one with a faster increase. Also, in the light jet simulation we
see a second transition, between the region of fast increase and a region where the magnetized
mass remains relatively constant. In the expanding jet simulations the distance between first and
second transition points is similar to or larger than this distance in the cylindrical jet equivalent
simulations. The observed behavior is consistent with slower growth of the KH instability on
expanding jets relative to cylindrical jets. Thus, we confirm the theoretical prediction that the
KH instability grows on these expanding jets at a reduced rate relative to an equivalent cylindrical
jet. Previous work (RHCJ) associated the different stages of spatial development with the linear,
nonlinear, and saturated stages of the KH instability, and this appears to be the case in these
expanding jet simulations. The simulations also contain wavelengths and wave speeds that are
consistent with theoretical estimates of the wavelengths and wave speeds appropriate to the
surface helical mode wave triggered at the precession frequency.
Simulated intensity images also reveal three stages in the expansion of the mixed jet and
entrained material. These stages are similar (slow, fast, and zero expansion) and roughly coincident
with the three stages of mass entrainment. However, in one case the jet continues to entrain mass
while maintaining a constant jet width in the intensity image. The reduced KH instability growth
rate in expanding jets does result in a lengthening span between transition points as determined
from the intensity image relative to transition points for cylindrical equivalent jets.
Our present study confirms results from RHCJ. The simulated total radio intensity images
and the axial velocity transverse cross-sections show that dense jets are able to maintain a high
velocity spine as part of a spine/sheath structure. We also see an alignment of polarization vectors
with filaments in the simulated intensity images. In addition, the transverse cross-sections show
a progression from high order, fast growing, small amplitude to low order, slower growing, large
amplitude KH modes. Axial cuts of each velocity component show that the internal structure
exhibits a transition in the growth of the instability in roughly the same position as the first
transition point in the mass entrainment rate or in the width of the intensity images. Beyond this
transition point, especially in the light jet simulation, the displacement of the jet from the initial
axis complicates the profile.
A. Rosen and P. Hardee acknowledge support from the National Science Foundation through
grant AST-9802955 to the University of Alabama. The authors would also like to acknowledge
David Clarke who has provided valuable support through development and maintenance of
ZEUS-3D. The numerical work utilized the Cray C90 at the Pittsburgh Supercomputing Center
and the storage facilities associated with the Cray T90 at the San Diego Computing Center.
– 14 –
REFERENCES
Appl, S., & Camenzind, M. 1992, A&A, 256, 354
Bassett, G.M., & Woodward, P.R. 1995, ApJ, 441, 582
Bicknell, G.V. 1994, ApJ, 422, 542
———. 1996, in ASP Conf. Ser. 100: Energy Transport in Radio Galaxies and Quasars, eds. P.E.
Hardee, A.H. Bridle, & J.A. Zensus, (San Francisco:ASP) 253
Biretta, J.A., Zhou, F., & Owen, F.N. 1995, ApJ, 447, 582
Bodo, G., Massaglia, S., Rossi, P., Rosner, R., Malagoli, A., & Ferrari, A. 1995, A&A, 303, 281
Bodo, G., Rossi, P., Massaglia, S., Ferrari, A., Malagoli, A., & Rosner, R. 1998, A&A, 333, 1117
Clarke, D.A. 1989, ApJ, 342, 700
———. 1996, ApJ, 457, 291
DeYoung, D.S. 1996, in ASP Conf. Ser. 100: Energy Transport in Radio Galaxies and Quasars,
eds. P.E. Hardee, A.H. Bridle, & J.A. Zensus, (San Francisco: ASP) 261
Fanaroff, B.L., & Riley, J.M. 1974, MNRAS, 167, 31P
Giovannini, G., Taylor, G.B., Arbizanni, E., Bondi, M., Cotton, W.D., Feretti, L., Lara, L., &
Venturi, T. 1999, ApJ, 522, 101
Hardee, P.E. 1986, ApJ, 303, 111
———. 1987, ApJ, 313, 607
Hardee, P.E., Clarke, D.A., & Rosen, A. 1997, ApJ, 485, 533 (HCR)
Hardee, P.E., & Rosen, A. 1999, ApJ, 524, 650
Hardee, P.E., Rosen, A., Hughes, P.A., Duncan, G.C. 1998, ApJ, 500, 598
Hughes, P.A., Miller, M.A., & Duncan, G.C. 1999, BAAS, 31, 1547
Katz-Stone, D.M., Rudnick, L., Butenoff, C., & O’Donoghue, A.A. 1999, ApJ, 516, 716
Loken, C., Burns, J.O., Bryan, G., & Norman, M. 1996 in ASP Conf. Ser. 100: Energy Transport
in Radio Galaxies and Quasars, eds. P.E. Hardee, A.H. Bridle, & J.A. Zensus, (San
Francisco:ASP) 267
Perley, R.A., Bridle, A.H., & Willis, A.G. 1984, ApJS, 54, 291
Rosen, A., Hardee, P.E., Clarke, D.A., & Johnson, A. 1999, ApJ, 510, 136 (RHCJ)
Stone, J.M., Hawley, J.F., Evans, C.E., & Norman, M.L. 1992, ApJ, 388, 19
Ulvestad, J.S., Wrobel, J.M., Roy, A.L., Wilson, A.S., Falcke, H., & Krichbaum, T.P. 1999, ApJ,
517, L81
– 15 –
van Leer, B. 1977, J. Comput. Phys., 23, 276
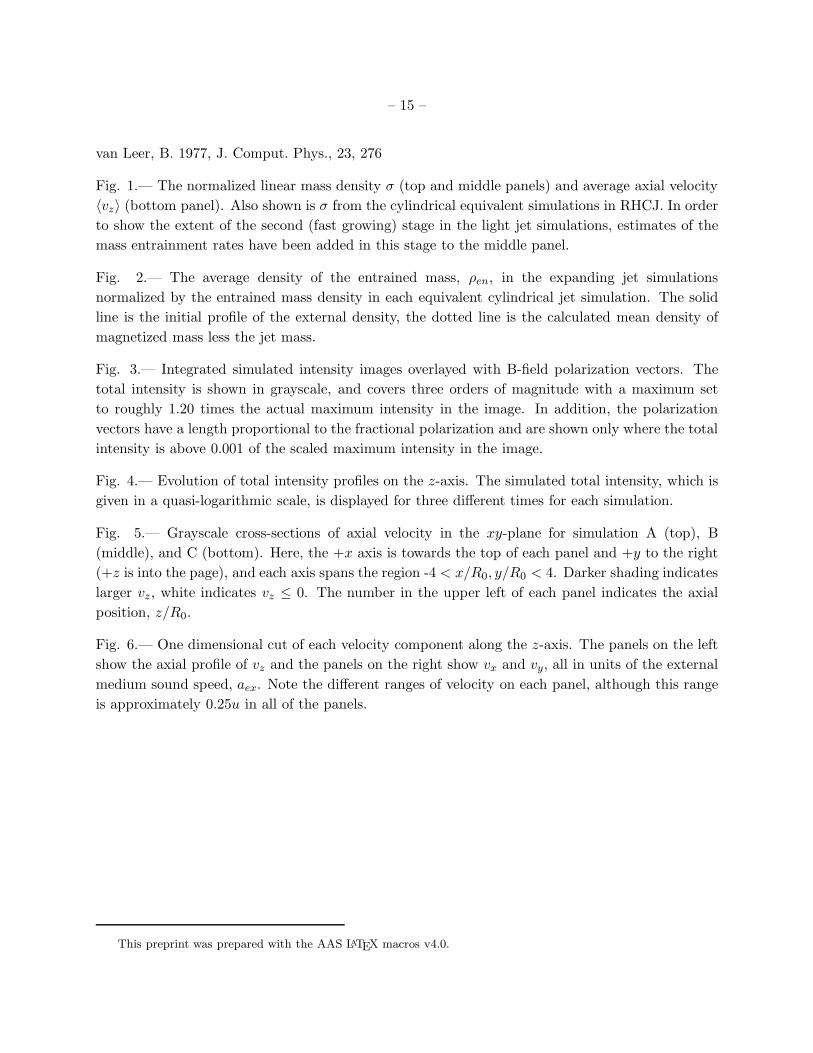
Fig. 1.— The normalized linear mass density σ (top and middle panels) and average axial velocity
〈vz〉 (bottom panel). Also shown is σ from the cylindrical equivalent simulations in RHCJ. In order
to show the extent of the second (fast growing) stage in the light jet simulations, estimates of the
mass entrainment rates have been added in this stage to the middle panel.
Fig. 2.— The average density of the entrained mass, ρen, in the expanding jet simulations
normalized by the entrained mass density in each equivalent cylindrical jet simulation. The solid
line is the initial profile of the external density, the dotted line is the calculated mean density of
magnetized mass less the jet mass.
Fig. 3.— Integrated simulated intensity images overlayed with B-field polarization vectors. The
total intensity is shown in grayscale, and covers three orders of magnitude with a maximum set
to roughly 1.20 times the actual maximum intensity in the image. In addition, the polarization
vectors have a length proportional to the fractional polarization and are shown only where the total
intensity is above 0.001 of the scaled maximum intensity in the image.
Fig. 4.— Evolution of total intensity profiles on the z-axis. The simulated total intensity, which is
given in a quasi-logarithmic scale, is displayed for three different times for each simulation.
Fig. 5.— Grayscale cross-sections of axial velocity in the xy-plane for simulation A (top), B
(middle), and C (bottom). Here, the +x axis is towards the top of each panel and +y to the right
(+z is into the page), and each axis spans the region -4 < x/R0, y/R0 < 4. Darker shading indicates
larger vz, white indicates vz ≤ 0. The number in the upper left of each panel indicates the axial
position, z/R0.
Fig. 6.— One dimensional cut of each velocity component along the z-axis. The panels on the left
show the axial profile of vz and the panels on the right show vx and vy, all in units of the external
medium sound speed, aex. Note the different ranges of velocity on each panel, although this range
is approximately 0.25u in all of the panels.
This preprint was prepared with the AAS LATEX macros v4.0.
– 16 –
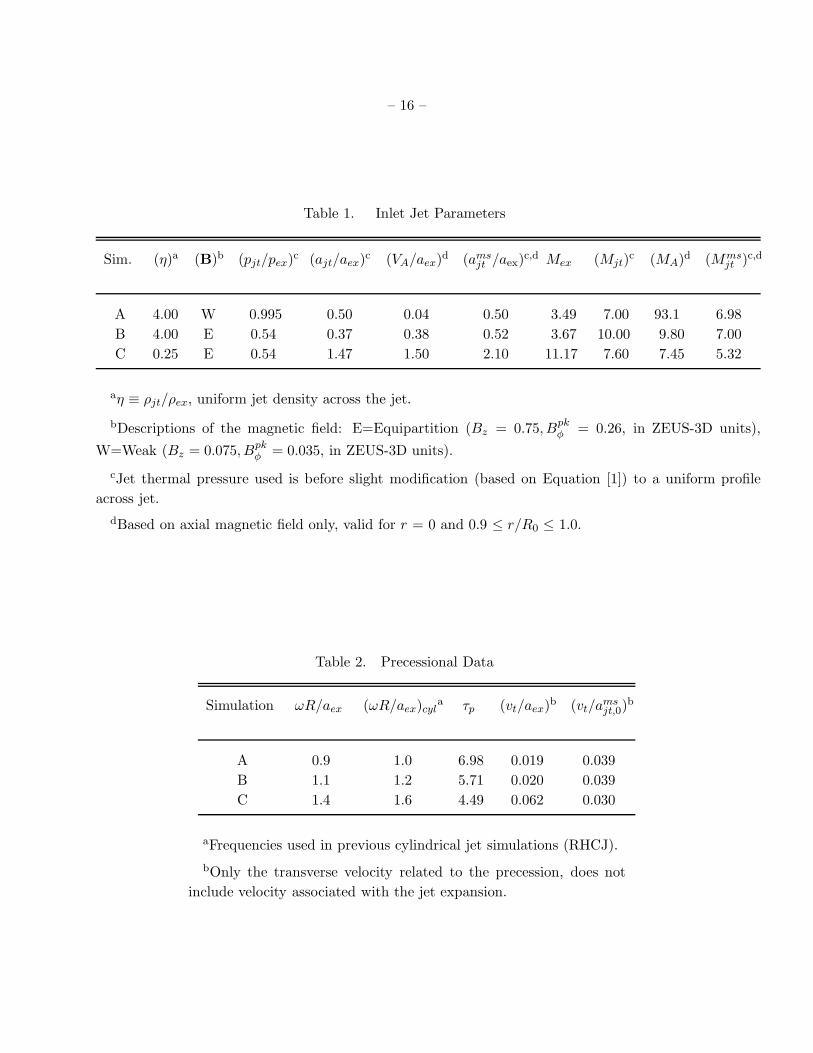
Table 1. Inlet Jet Parameters
Sim. (η)a (B)b (pjt/pex)c (ajt/aex)
c (VA/aex)d (ams
jt /aex)c,d Mex (Mjt)
c (MA)d (Mms
jt )c,d
A 4.00 W 0.995 0.50 0.04 0.50 3.49 7.00 93.1 6.98
B 4.00 E 0.54 0.37 0.38 0.52 3.67 10.00 9.80 7.00
C 0.25 E 0.54 1.47 1.50 2.10 11.17 7.60 7.45 5.32
aη ≡ ρjt/ρex, uniform jet density across the jet.
bDescriptions of the magnetic field: E=Equipartition (Bz = 0.75, Bpkφ = 0.26, in ZEUS-3D units),
W=Weak (Bz = 0.075, Bpkφ = 0.035, in ZEUS-3D units).
cJet thermal pressure used is before slight modification (based on Equation [1]) to a uniform profile
across jet.
dBased on axial magnetic field only, valid for r = 0 and 0.9 ≤ r/R0 ≤ 1.0.
Table 2. Precessional Data
Simulation ωR/aex (ωR/aex)cyla τp (vt/aex)
b (vt/amsjt,0)
b
A 0.9 1.0 6.98 0.019 0.039
B 1.1 1.2 5.71 0.020 0.039
C 1.4 1.6 4.49 0.062 0.030
aFrequencies used in previous cylindrical jet simulations (RHCJ).
bOnly the transverse velocity related to the precession, does not
include velocity associated with the jet expansion.
– 17 –
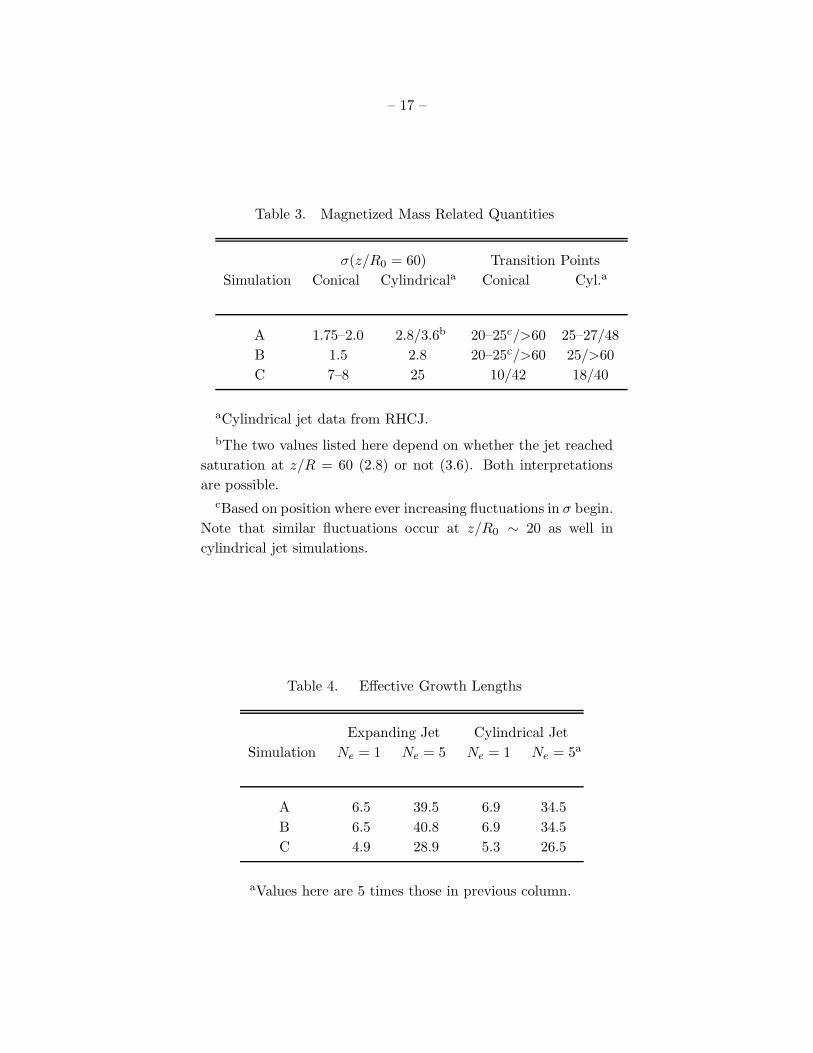
Table 3. Magnetized Mass Related Quantities
σ(z/R0 = 60) Transition Points
Simulation Conical Cylindricala Conical Cyl.a
A 1.75–2.0 2.8/3.6b 20–25c/>60 25–27/48
B 1.5 2.8 20–25c/>60 25/>60
C 7–8 25 10/42 18/40
aCylindrical jet data from RHCJ.
bThe two values listed here depend on whether the jet reached
saturation at z/R = 60 (2.8) or not (3.6). Both interpretations
are possible.
cBased on position where ever increasing fluctuations in σ begin.
Note that similar fluctuations occur at z/R0 ∼ 20 as well in
cylindrical jet simulations.
Table 4. Effective Growth Lengths
Expanding Jet Cylindrical Jet
Simulation Ne = 1 Ne = 5 Ne = 1 Ne = 5a
A 6.5 39.5 6.9 34.5
B 6.5 40.8 6.9 34.5
C 4.9 28.9 5.3 26.5
aValues here are 5 times those in previous column.
– 18 –
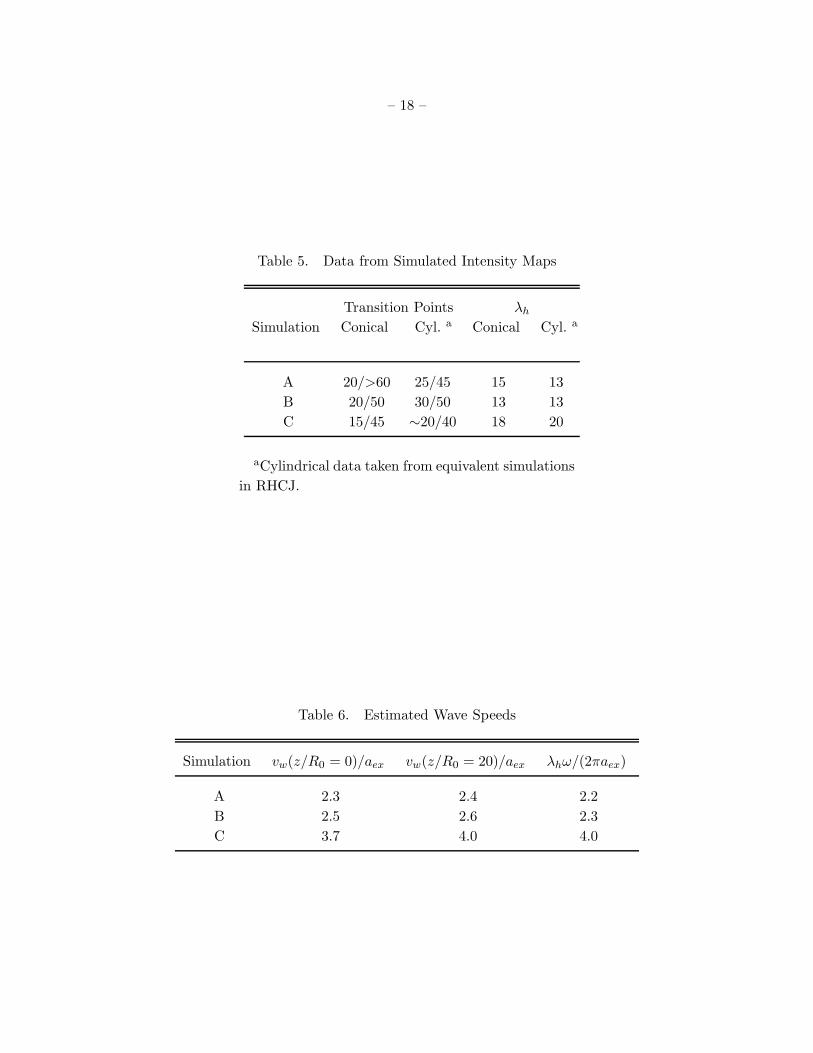
Table 5. Data from Simulated Intensity Maps
Transition Points λh
Simulation Conical Cyl. a Conical Cyl. a
A 20/>60 25/45 15 13
B 20/50 30/50 13 13
C 15/45 ∼20/40 18 20
aCylindrical data taken from equivalent simulations
in RHCJ.
Table 6. Estimated Wave Speeds
Simulation vw(z/R0 = 0)/aex vw(z/R0 = 20)/aex λhω/(2πaex)
A 2.3 2.4 2.2
B 2.5 2.6 2.3
C 3.7 4.0 4.0

This figure "rhfig3.jpg" is available in "jpg" format from:
http://arxiv.org/ps/astro-ph/0006102v1

This figure "rhfig5.jpg" is available in "jpg" format from:
http://arxiv.org/ps/astro-ph/0006102v1
Recommended