1
SST Webinar
SLDS Webinar 9-13-13
The presentation will begin at approximately 1:00 PM EST
Information on how to join the teleconference can be found on the “Info” tab in the upper left of this screen. Be sure to use the “Attendee ID” when dialing in to associate your name with your phone.
In order to cut down on background noise, please mute your phone by dialing *6 upon entry into the meeting.
During the Question and Answer portion of this presentation: You can re-enter *6 to unmute your phone and ask a question; or Type your question into the Q&A panel below the participant list and
click “Send.”
A copy of this presentation and a link to the recording will be shared with the IES Grantees and EIMAC listservs.
Total Cost of Ownership (TCO) Studies
2
SST Webinar
Total Cost of Ownership (TCO) StudiesPanelists
Peter Tamayo (WA) Brian Townsend (VT)
Agenda Washington State Office of Superintendent of Public Instruction’s
(OSPI) TCO Project Vermont Agency of Education’s Sustainability Planning Efforts Questions from Participants
SLDS Webinar 9-13-13

SLDS Webinar 9-13-13 3
SST Webinar
Washington
SLDS Webinar 9-13-13 4
SST Webinar
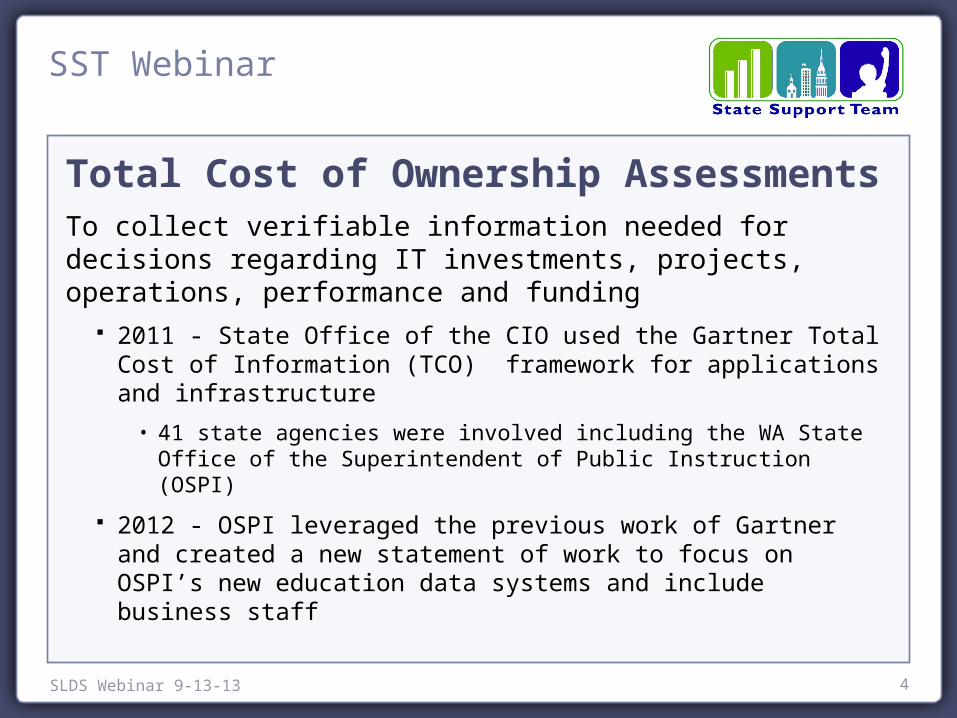
Total Cost of Ownership AssessmentsTo collect verifiable information needed for decisions regarding IT investments, projects, operations, performance and funding
2011 - State Office of the CIO used the Gartner Total Cost of Information (TCO) framework for applications and infrastructure
• 41 state agencies were involved including the WA State Office of the Superintendent of Public Instruction (OSPI)
2012 - OSPI leveraged the previous work of Gartner and created a new statement of work to focus on OSPI’s new education data systems and include business staff

SLDS Webinar 9-13-13 5
SST Webinar
OSPI’s TCO Project Objective (2012) Washington’s FY09 SLDS grant ends May 2014 OSPI receives $1.2M for ongoing maintenance and operations of
education data systems Challenge: Secure additional funding for on-going M&O of new
systems implemented using Federal $ Proposed Approach:
1) Use the Gartner framework to document TCO for the state education data systems and include IT and program area costs
2) Document the value and benefits to the state Objective: With Gartner’s assistance, complete a 2013-15 Data
Systems Budget Decision Package for consideration by the WA State Legislature by September 2012

SLDS Webinar 9-13-13 6
SST Webinar
OSPI / Gartner Project Tasks Task 1: Project Initiation
• Organize Gartner and OSPI project teams• Develop initial project management documents• Gartner provides data collection materials to OSPI
Task 2: Data Collection and Validation• Conduct data collection workshop• Begin data collection effort
Task 3: Peer Selection• Gartner selects appropriate peer groups for comparison and
validation and analysis
SLDS Webinar 9-13-13 7
SST Webinar
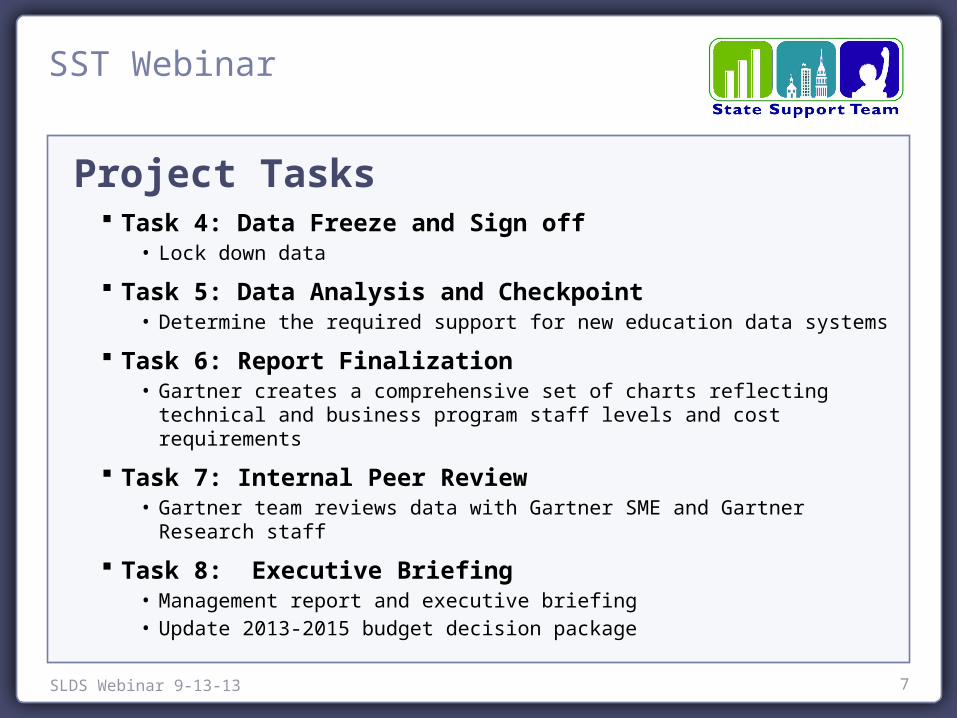
Project Tasks Task 4: Data Freeze and Sign off
• Lock down data
Task 5: Data Analysis and Checkpoint• Determine the required support for new education data systems
Task 6: Report Finalization• Gartner creates a comprehensive set of charts reflecting technical and
business program staff levels and cost requirements
Task 7: Internal Peer Review• Gartner team reviews data with Gartner SME and Gartner Research staff
Task 8: Executive Briefing• Management report and executive briefing• Update 2013-2015 budget decision package
SLDS Webinar 9-13-13 8
SST Webinar
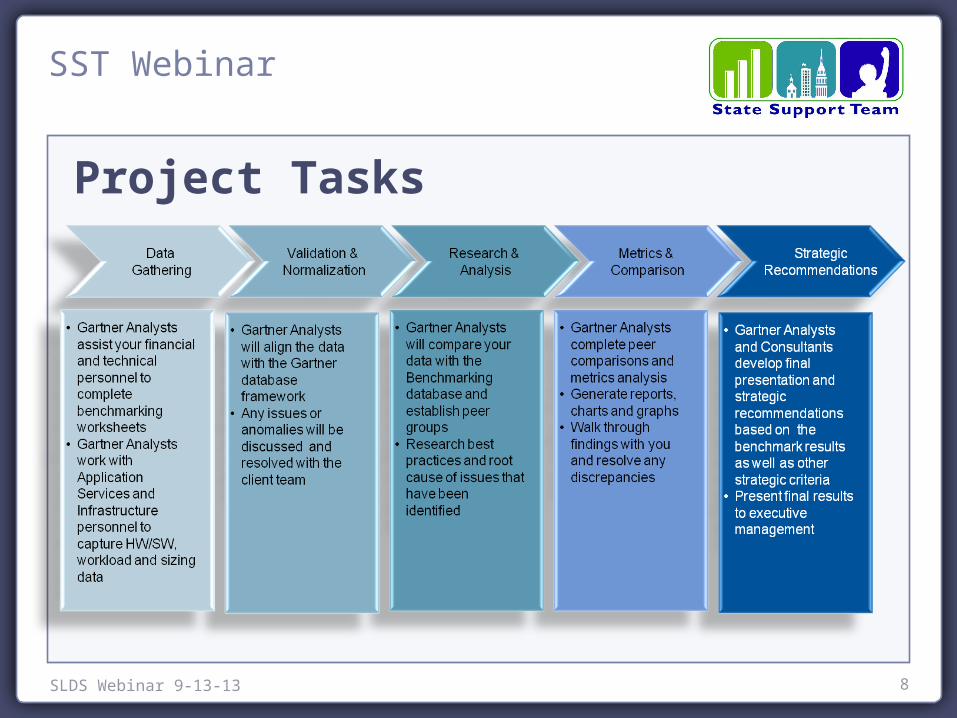
Project Tasks
SLDS Webinar 9-13-13 9
SST Webinar
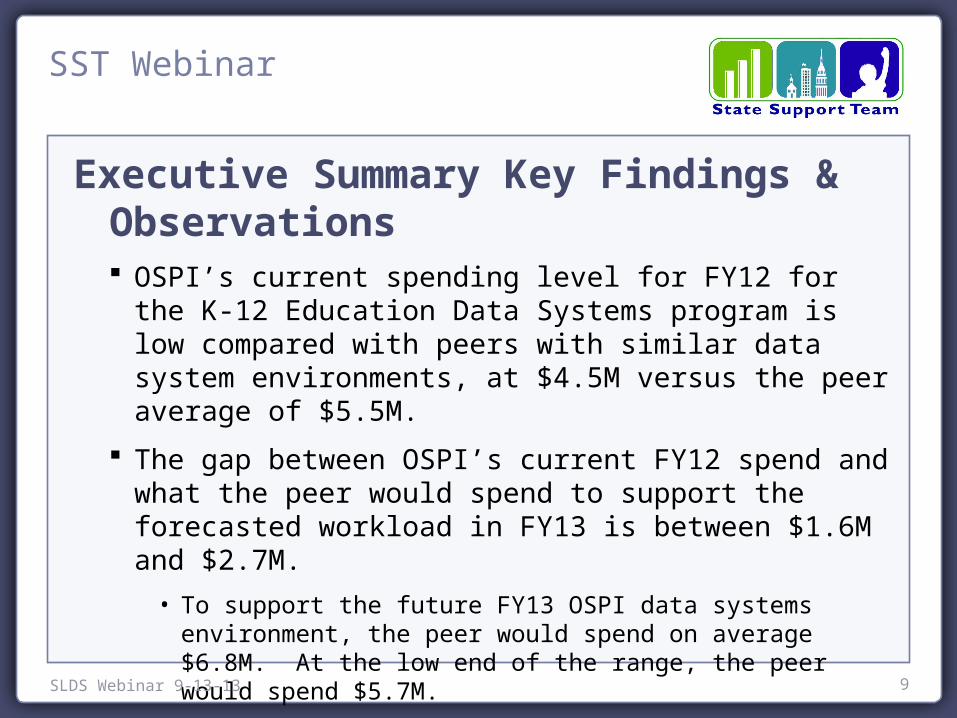
Executive Summary Key Findings & Observations OSPI’s current spending level for FY12 for the K-12 Education Data
Systems program is low compared with peers with similar data system environments, at $4.5M versus the peer average of $5.5M.
The gap between OSPI’s current FY12 spend and what the peer would spend to support the forecasted workload in FY13 is between $1.6M and $2.7M.• To support the future FY13 OSPI data systems environment, the peer
would spend on average $6.8M. At the low end of the range, the peer would spend $5.7M.

SLDS Webinar 9-13-13 10
SST Webinar
Executive Summary Key Findings & Observations OSPI data systems will grow in a variety of dimensions, including:
the number and type of users, the data volume under management, the channel traffic between storage and the CPU complex, the mix of workload types and data volumes loaded.
• OSPI’s service levels are at risk due to current low spending and staffing.
• The long-term costs for maintenance, support, on-going enhancements, optimization, ancillary tools, staffing, consulting, DBMS management tools, training and user growth must all be considered to attain maximum benefit from the platform.
SLDS Webinar 9-13-13 11
SST Webinar
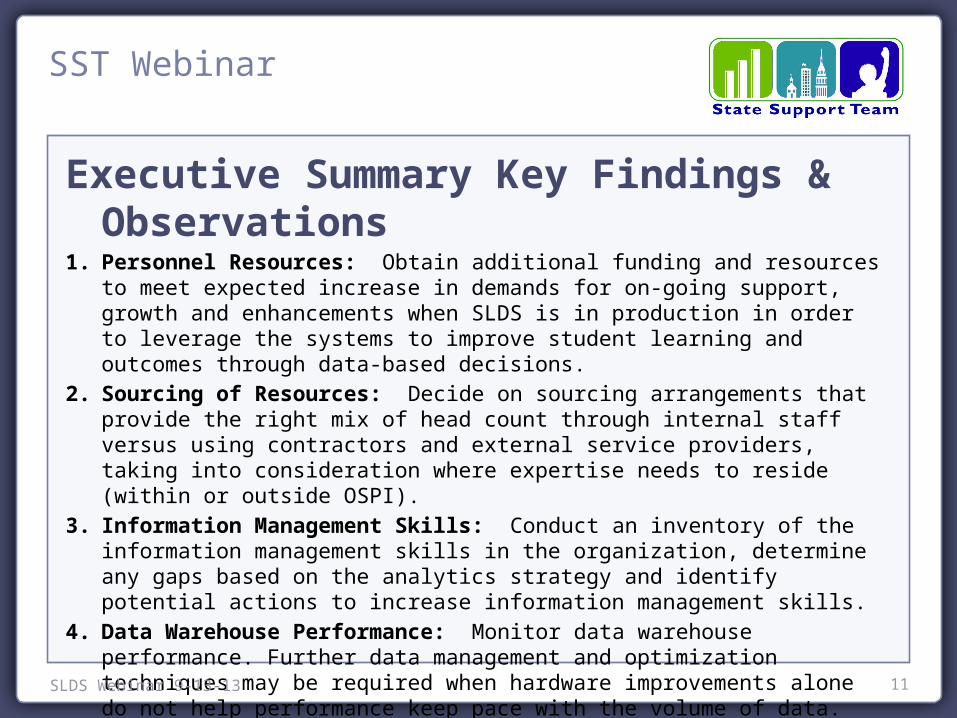
Executive Summary Key Findings & Observations1. Personnel Resources: Obtain additional funding and resources to meet expected increase
in demands for on-going support, growth and enhancements when SLDS is in production in order to leverage the systems to improve student learning and outcomes through data-based decisions.
2. Sourcing of Resources: Decide on sourcing arrangements that provide the right mix of head count through internal staff versus using contractors and external service providers, taking into consideration where expertise needs to reside (within or outside OSPI).
3. Information Management Skills: Conduct an inventory of the information management skills in the organization, determine any gaps based on the analytics strategy and identify potential actions to increase information management skills.
4. Data Warehouse Performance: Monitor data warehouse performance. Further data management and optimization techniques may be required when hardware improvements alone do not help performance keep pace with the volume of data.
5. Big Data and the Gartner Hype Cycle for Education: Hype is building quickly for Big Data in Education. It could be a possibly bumpy five- to 10-year road on the way to the Plateau of Productivity and mainstream adoption, however that can change quickly if standards mature and there is sufficient interest and funding.

SLDS Webinar 9-13-13 12
SST Webinar
Lessons Learned and Recommendations1. Organize the data collection efforts
2. Get executive support to raise awareness and increase cooperation from the other divisions
3. Don’t get bogged down on getting exact numbers
4. Understand the methodology
5. Be proactive with the internal and external funding decision-makers

SLDS Webinar 9-13-13 13
SST Webinar
Vermont

SLDS Webinar 9-13-13 14
SST Webinar
Background Demographics
• Small, homogeneous state w/ ~82k public students
Today’s System• Homegrown Data Collection Applications
o Not sustainable for AOE or locals• EDW
o Manual ETLo Not statewideo Vendor discontinuing support
• EdFacts Reporting: Also Manual Process
SLDS Webinar 9-13-13 15
SST Webinar
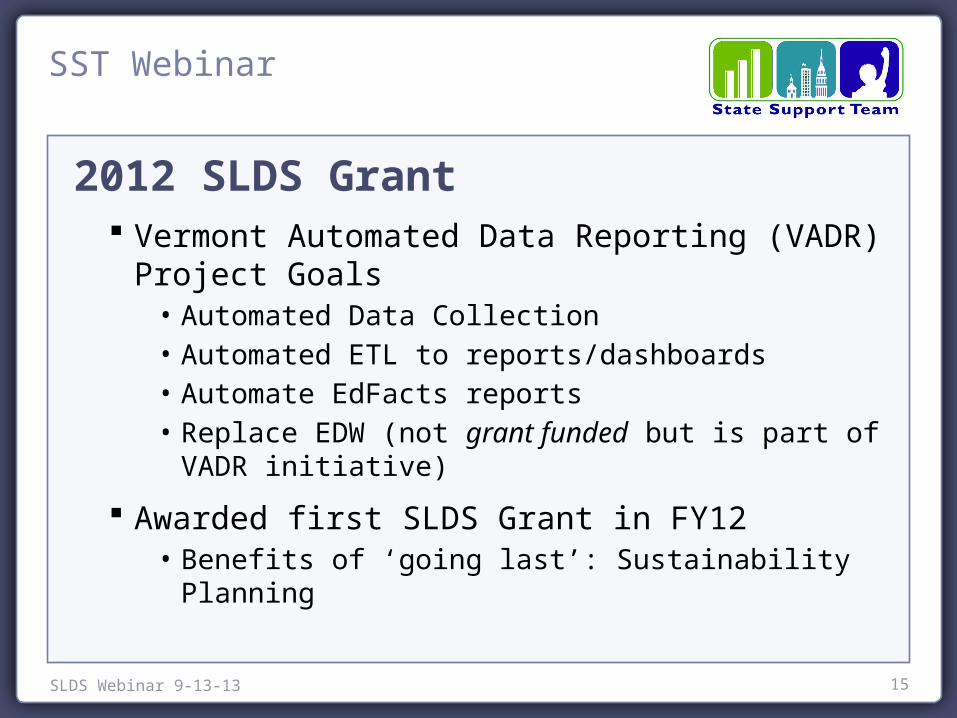
2012 SLDS Grant Vermont Automated Data Reporting (VADR) Project Goals
• Automated Data Collection• Automated ETL to reports/dashboards• Automate EdFacts reports• Replace EDW (not grant funded but is part of VADR initiative)
Awarded first SLDS Grant in FY12• Benefits of ‘going last’: Sustainability Planning

SLDS Webinar 9-13-13 16
SST Webinar
SLDS System Costs Implementation Licensing Maintenance Support Hosting (statewide push) Training District SIS Customization Costs
SLDS Webinar 9-13-13 17
SST Webinar
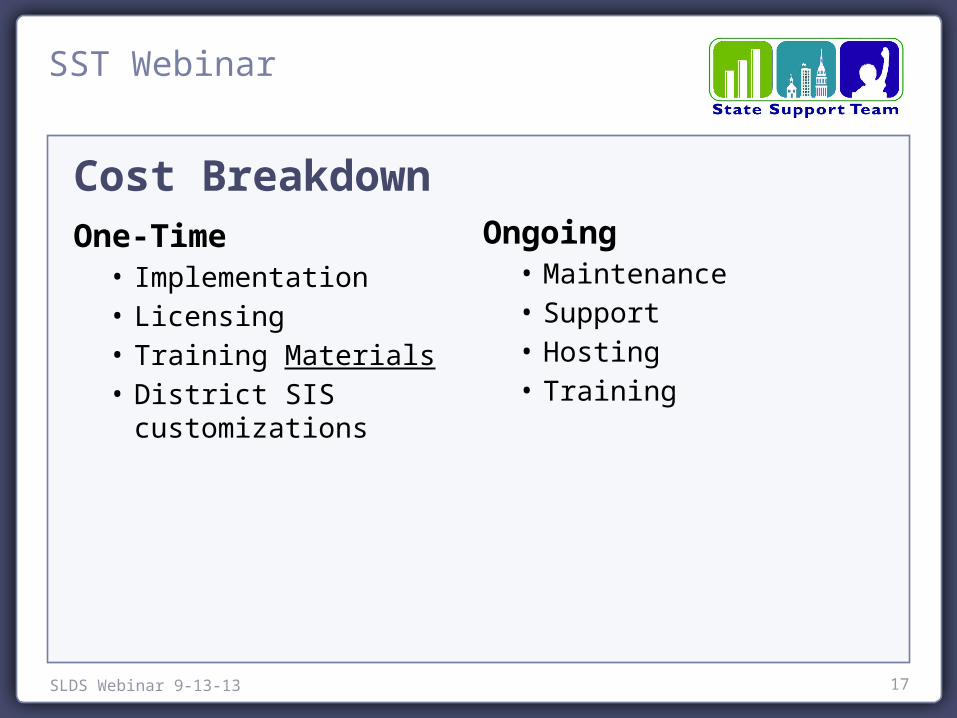
Cost BreakdownOne-Time• Implementation• Licensing• Training Materials• District SIS customizations
Ongoing• Maintenance• Support• Hosting• Training

SLDS Webinar 9-13-13 18
SST Webinar
Sustainability Planning Proposal Planning
• Perpetual licenses: reduce ongoing cost as much as possible• Reusable training materials: prepare for turnover
EDW Replacement• Leveraging Ed-Fi: “free” solution• Reallocating existing EDW annual licensing cost & central IT
data center costs VADR system Hosting, Maintenance & Support
SLDS Webinar 9-13-13 19
SST Webinar
Sustainability in Vermont EPMO/CIO Approval
• Statutorily required oversight and approval• Business Case & 5-year cost model
o Annual updates/reports
SLDS Webinar 9-13-13 20
SST Webinar
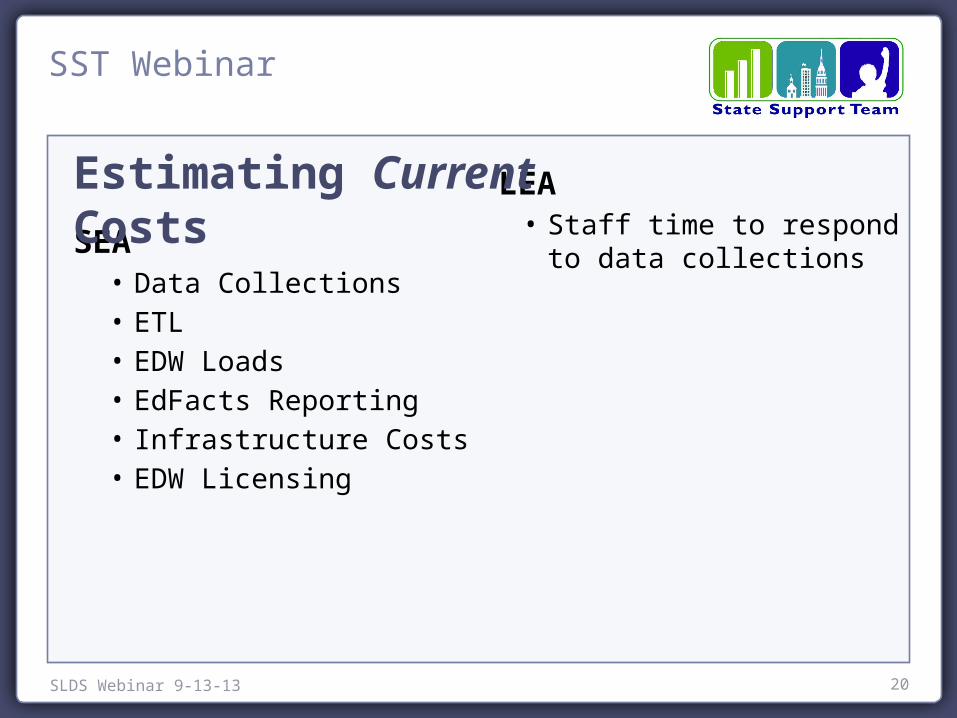
SEA• Data Collections• ETL• EDW Loads• EdFacts Reporting• Infrastructure Costs• EDW Licensing
LEA• Staff time to respond to data
collections
Estimating Current Costs

SLDS Webinar 9-13-13 21
SST Webinar
Estimating Current Costs (SEA) Data Collections; ETL; EDW Loads; EdFacts Reporting
• Determine staff involvement as FTEo Business Analysts, Systems Developers, DBAs, etc.
• Compare to real salary/benefit numbers
Infrastructure Costs• Hardware, Software , Staff Support, Data Center
EDW Licensing
SLDS Webinar 9-13-13 22
SST Webinar
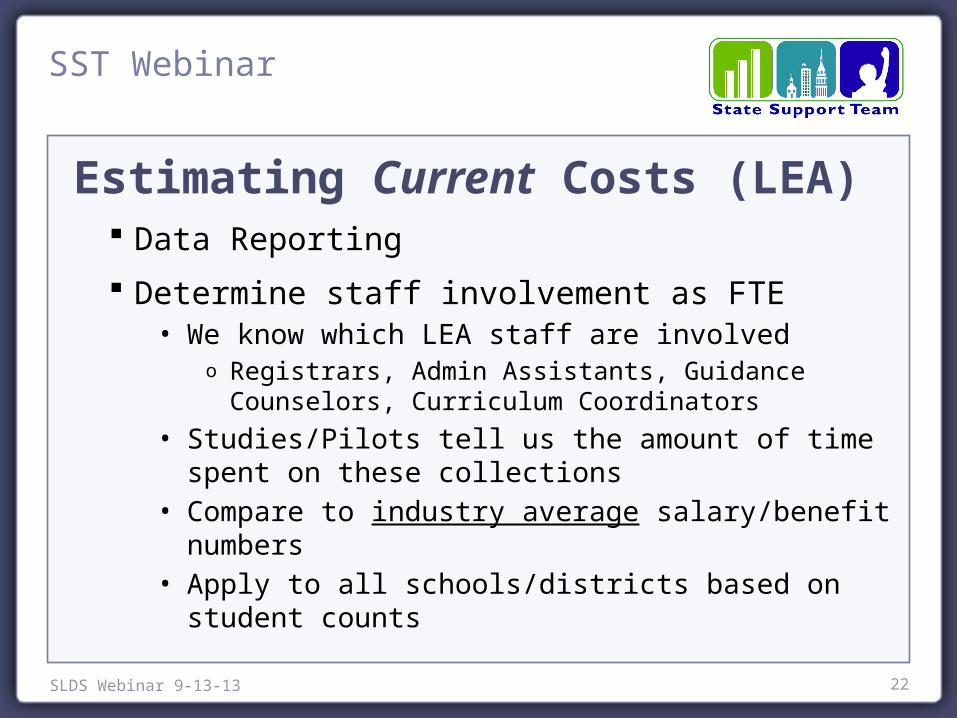
Estimating Current Costs (LEA) Data Reporting
Determine staff involvement as FTE• We know which LEA staff are involved
o Registrars, Admin Assistants, Guidance Counselors, Curriculum Coordinators
• Studies/Pilots tell us the amount of time spent on these collections
• Compare to industry average salary/benefit numbers• Apply to all schools/districts based on student counts
SLDS Webinar 9-13-13 23
SST Webinar
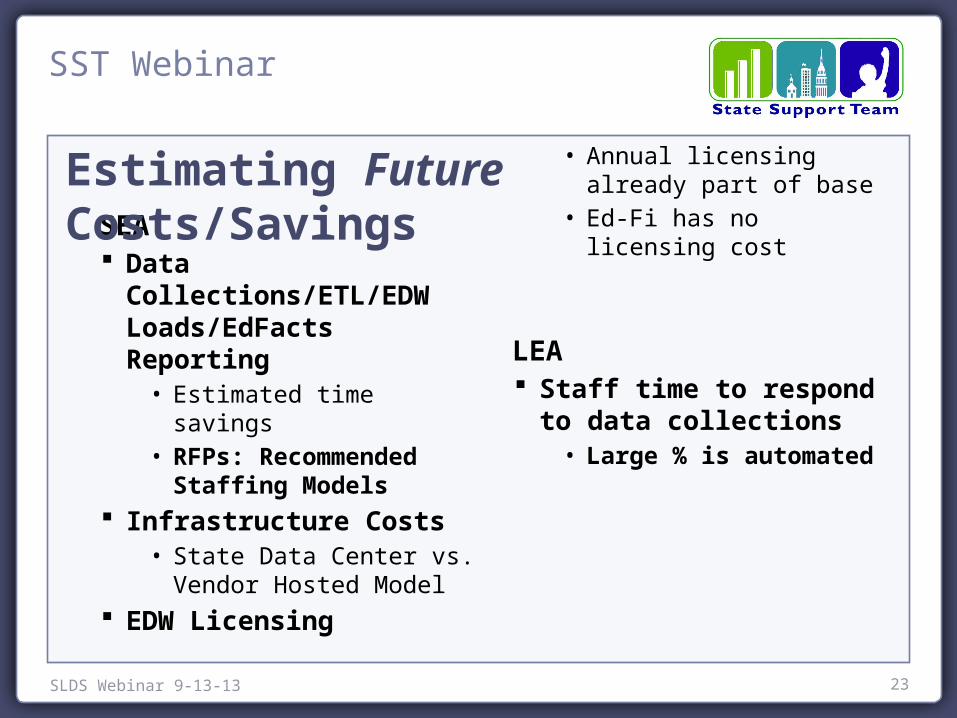
SEA Data Collections/ETL/EDW
Loads/EdFacts Reporting• Estimated time savings• RFPs: Recommended Staffing
Models Infrastructure Costs
• State Data Center vs. Vendor Hosted Model
EDW Licensing• Annual licensing already part
of base• Ed-Fi has no licensing cost
LEA Staff time to respond to data
collections• Large % is automated
Estimating Future Costs/Savings

SLDS Webinar 9-13-13 24
SST Webinar
Compare Current & Future States EPMO/CIO want to see savings/sustainability represented
in “real” dollars (of course, these are mostly estimates at this point)
Concern is funding cliff after grant $ goes away (sound familiar?)
5-year cost model tracks implementation and ongoing costs
Track time savings as we go to track real savings (before & after)
SLDS Webinar 9-13-13 25
SST Webinar
Questions?
26
SST Webinar
Contact Info and ResourcesJeff Sellers, State Support Team, [email protected] Wise, SLDS Team, [email protected]
Panelists:Peter Tamayo, Chief Information OfficerWashington State Office of Superintendent of Public [email protected], 360-725-6134
Brian Townsend, Information Technology DirectorVermont Agency of [email protected], 802-828-6575
SLDS Webinar 9-13-13
Total Cost of Ownership Studies
Recommended