SRS 2.5 Supplier Information
7/5/2012
Supplier Quality System – SRS 2.5
Table of Contents
I. Introduction 4
II. SRS 2.5 Measure (Criteria) 5
III. Measures 6
IV. Supplier Improvement Plan 18
SRS 2.5 Introduction
• To improve our communication and performance with
Suppliers, Flextronics established the Supplier Rating
System using the scorecard as a vehicle to provide
feedback to our suppliers on their performance every
quarter.
• It is a tool to facilitate constructive discussion in the
context of regular business reviews (QBR’s)
• Scores are calculated systemically using data from ERP
transactions and are refreshed Quarterly.
• It is intended to promote world class suppliers and provide
continuous improvement
• The Supplier Rating System process is now enhanced
and automated to establish an unbiased rating for supplier
management.
3
Measures (Criteria)
The eight (8) Measures are as follows:
1) On Time Delivery (OTD) %
2) Order Acknowledgement %
3) Supplier Managed Inventory and Continues Replenishment Program Spend (SMI-CRP) %
4) Terms of Payment
5) Quality Performance
6) Pricing Competitiveness
7) Environmental Response Time %
8) Quotation Response Time %
Supplier ratings are based on scores from eight measures, with targets by corporate goals.
5
Measures
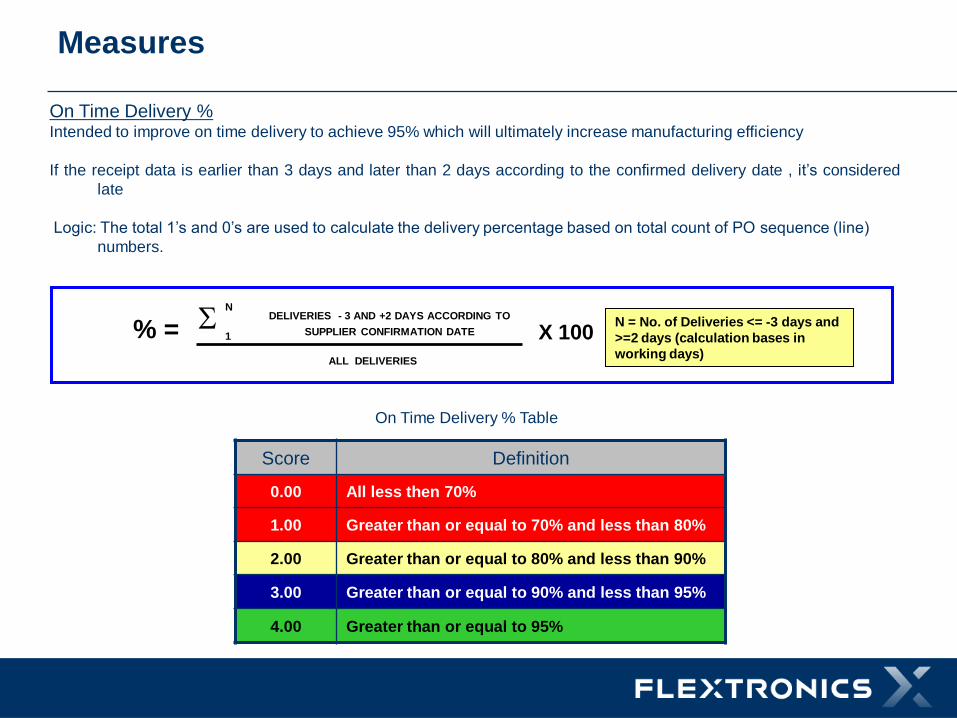
On Time Delivery % Intended to improve on time delivery to achieve 95% which will ultimately increase manufacturing efficiency
If the receipt data is earlier than 3 days and later than 2 days according to the confirmed delivery date , it’s considered
late
Logic: The total 1’s and 0’s are used to calculate the delivery percentage based on total count of PO sequence (line)
numbers.
Score Definition
0.00 All less then 70%
1.00 Greater than or equal to 70% and less than 80%
2.00 Greater than or equal to 80% and less than 90%
3.00 Greater than or equal to 90% and less than 95%
4.00 Greater than or equal to 95%
6
S ALL DELIVERIES
% = X 100
N
1
N = No. of Deliveries <= -3 days and
>=2 days (calculation bases in
working days)
DELIVERIES - 3 AND +2 DAYS ACCORDING TO
SUPPLIER CONFIRMATION DATE
On Time Delivery % Table
Measures
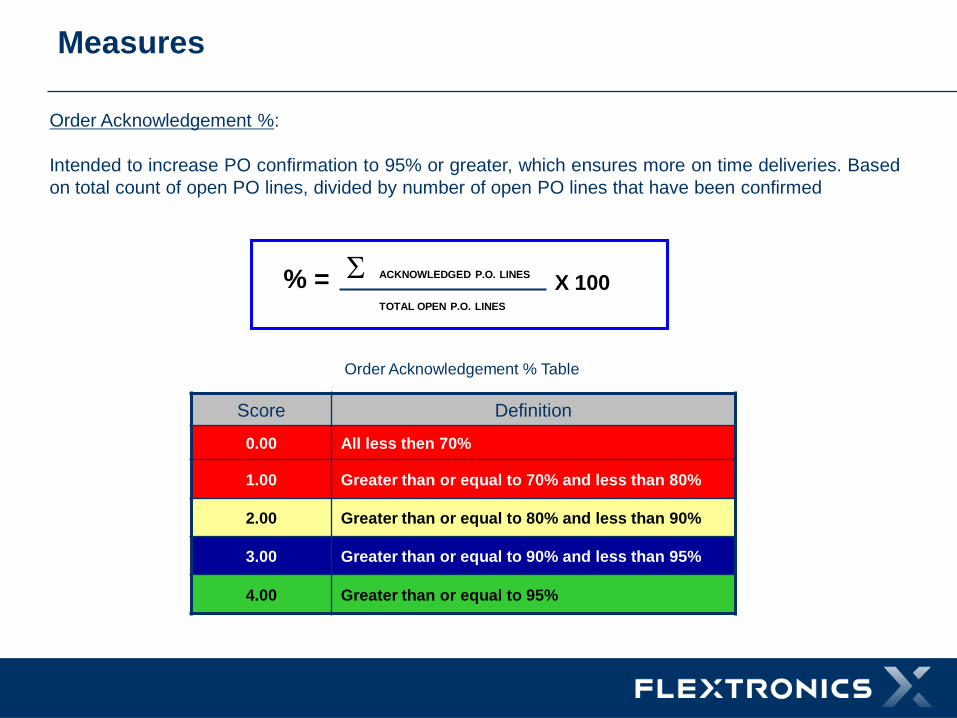
Order Acknowledgement %:
Intended to increase PO confirmation to 95% or greater, which ensures more on time deliveries. Based
on total count of open PO lines, divided by number of open PO lines that have been confirmed
Score Definition
0.00 All less then 70%
1.00 Greater than or equal to 70% and less than 80%
2.00 Greater than or equal to 80% and less than 90%
3.00 Greater than or equal to 90% and less than 95%
4.00 Greater than or equal to 95%
10
S ACKNOWLEDGED P.O. LINES
TOTAL OPEN P.O. LINES
% = X 100
Order Acknowledgement % Table
Measures
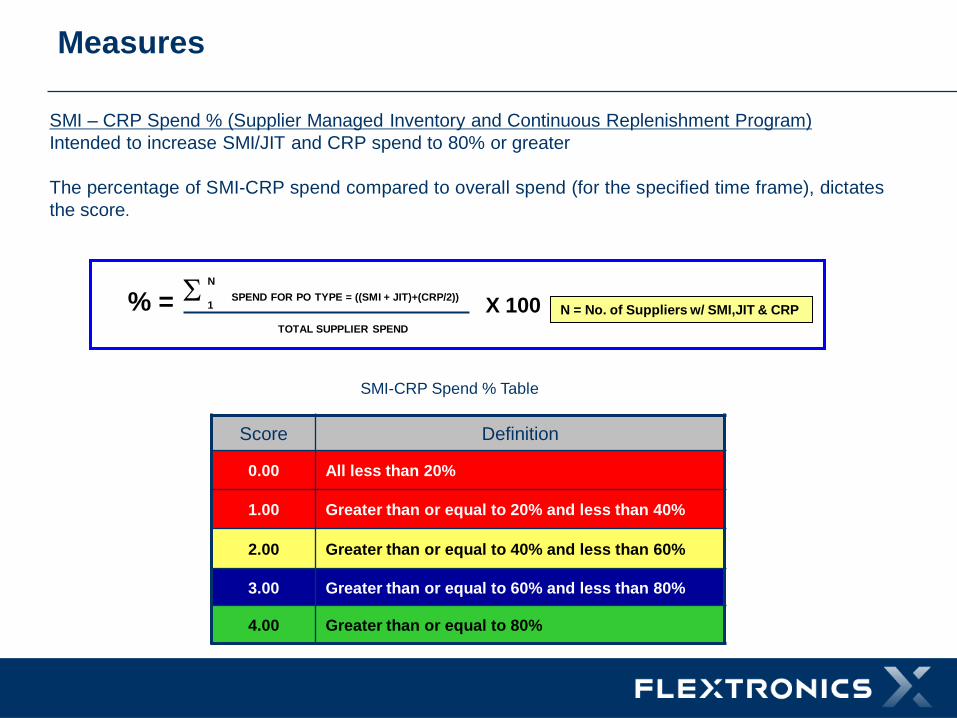
SMI – CRP Spend % (Supplier Managed Inventory and Continuous Replenishment Program)
Intended to increase SMI/JIT and CRP spend to 80% or greater
The percentage of SMI-CRP spend compared to overall spend (for the specified time frame), dictates
the score.
Score Definition
0.00 All less than 20%
1.00 Greater than or equal to 20% and less than 40%
2.00 Greater than or equal to 40% and less than 60%
3.00 Greater than or equal to 60% and less than 80%
4.00 Greater than or equal to 80%
7
S SPEND FOR PO TYPE = ((SMI + JIT)+(CRP/2))
TOTAL SUPPLIER SPEND
% = X 100
N
1 N = No. of Suppliers w/ SMI,JIT & CRP
SMI-CRP Spend % Table
Measures
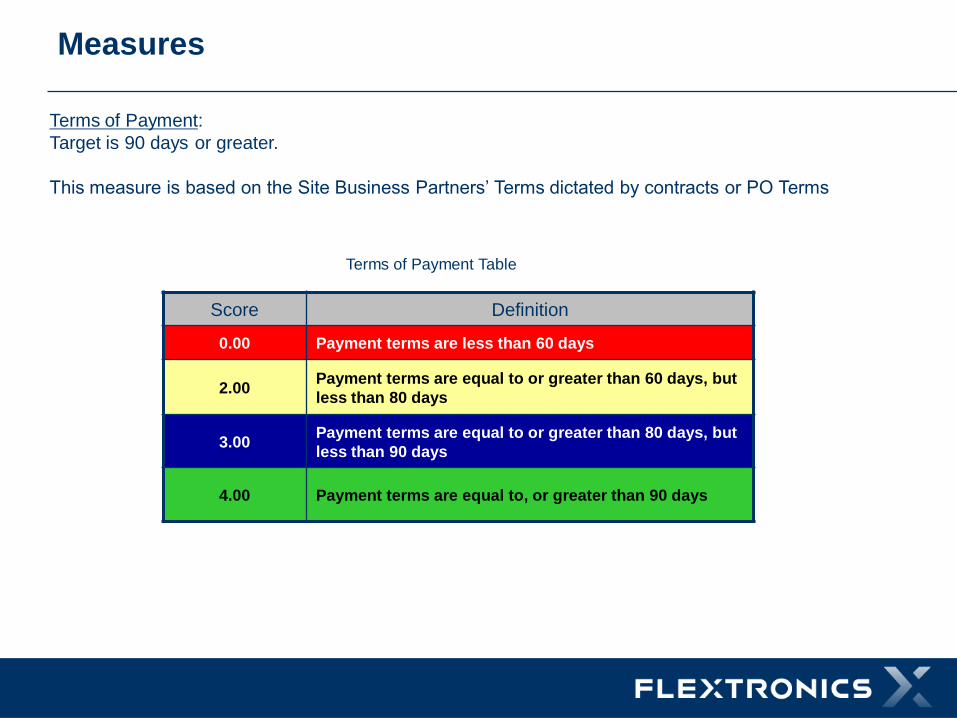
Score Definition
0.00 Payment terms are less than 60 days
2.00 Payment terms are equal to or greater than 60 days, but
less than 80 days
3.00 Payment terms are equal to or greater than 80 days, but
less than 90 days
4.00 Payment terms are equal to, or greater than 90 days
Terms of Payment:
Target is 90 days or greater.
This measure is based on the Site Business Partners’ Terms dictated by contracts or PO Terms
9
Terms of Payment Table
Measures
Quality Performance:
Intended to improve Quality of components and materials delivered to Flextronics, achieving PPM less
than or equal to 1000, less than 1 Quality Events and SCAR Responses Time should be closed at
least 4 days later according to Flextronics Requested date.
Quality Performance Measure is composed by three Quality metrics:
1. DPPM = Defective Parts Per Million
2. Quality Events = It is the number of created SCAR’s during the Quarter
3. SCAR’s Responses Time = It’s the difference days between Close Date from Supplier and Flex
Requested Date
In the next slide we will see in details these quality three metrics
11
Measures
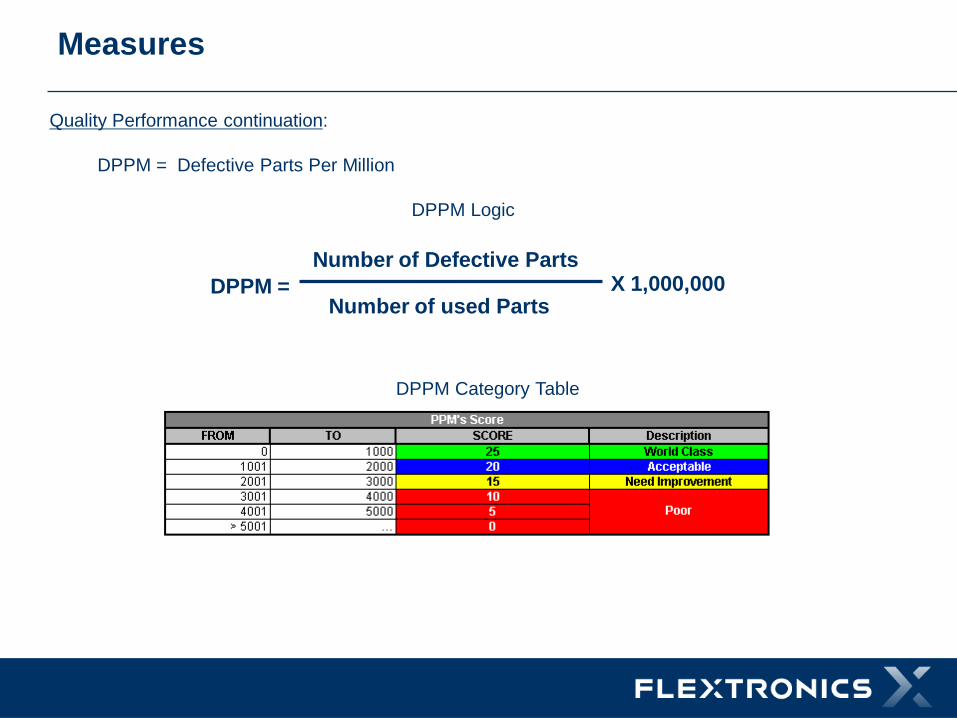
Quality Performance continuation:
DPPM = Defective Parts Per Million
DPPM Logic
DPPM Category Table
11
DPPM =
Number of Defective Parts
Number of used Parts X 1,000,000
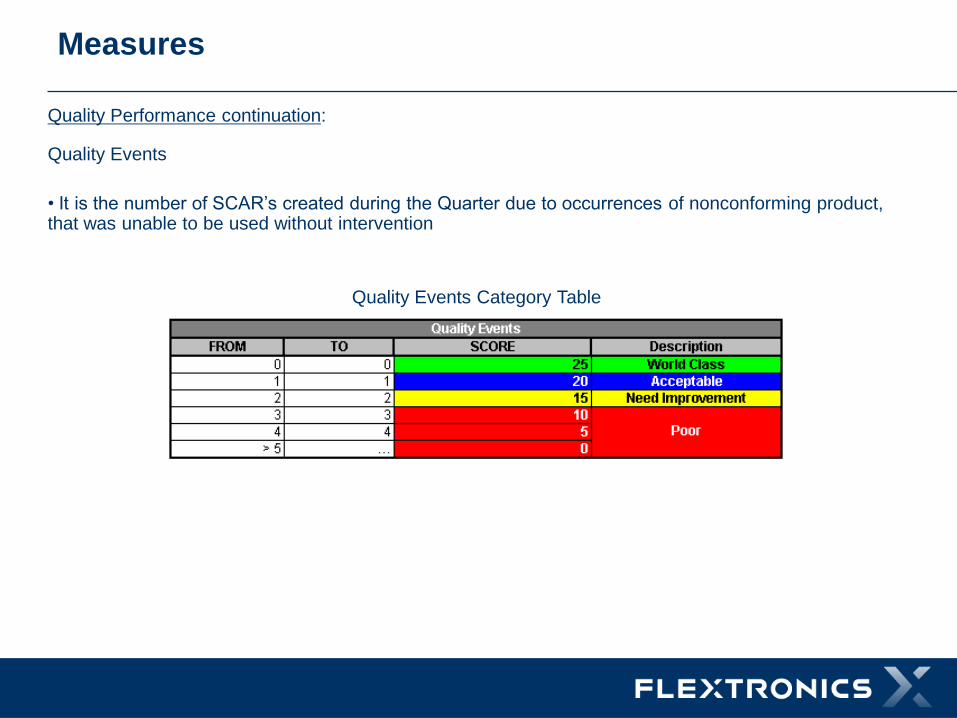
Quality Performance continuation:
Quality Events
• It is the number of SCAR’s created during the Quarter due to occurrences of nonconforming product, that was unable to be used without intervention
Quality Events Category Table
Measures
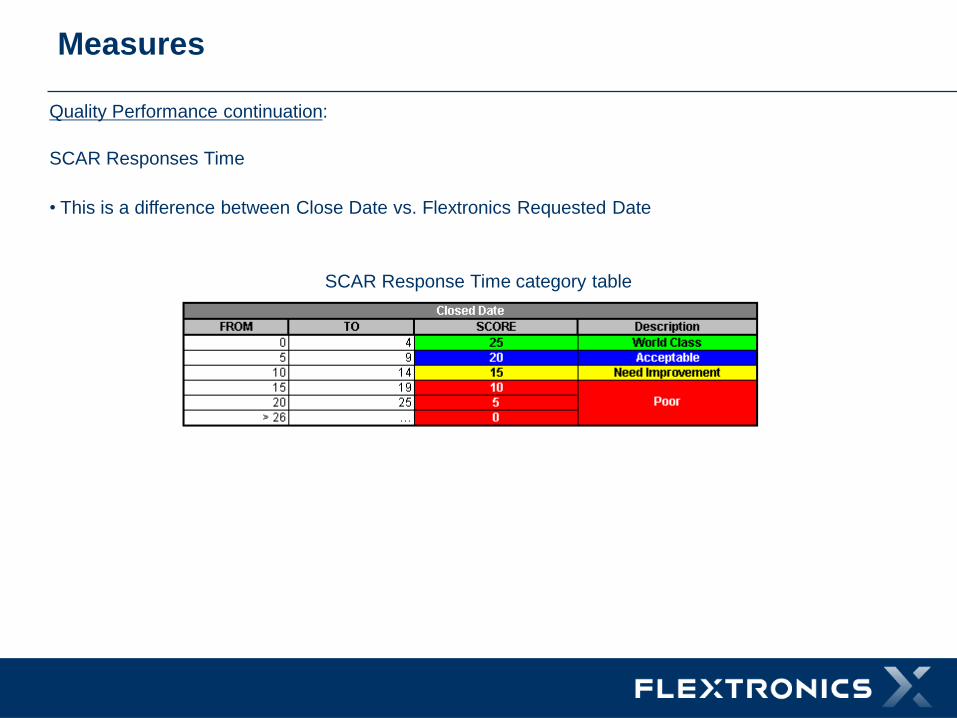
Quality Performance continuation:
SCAR Responses Time
• This is a difference between Close Date vs. Flextronics Requested Date
SCAR Response Time category table
Measures
Measures
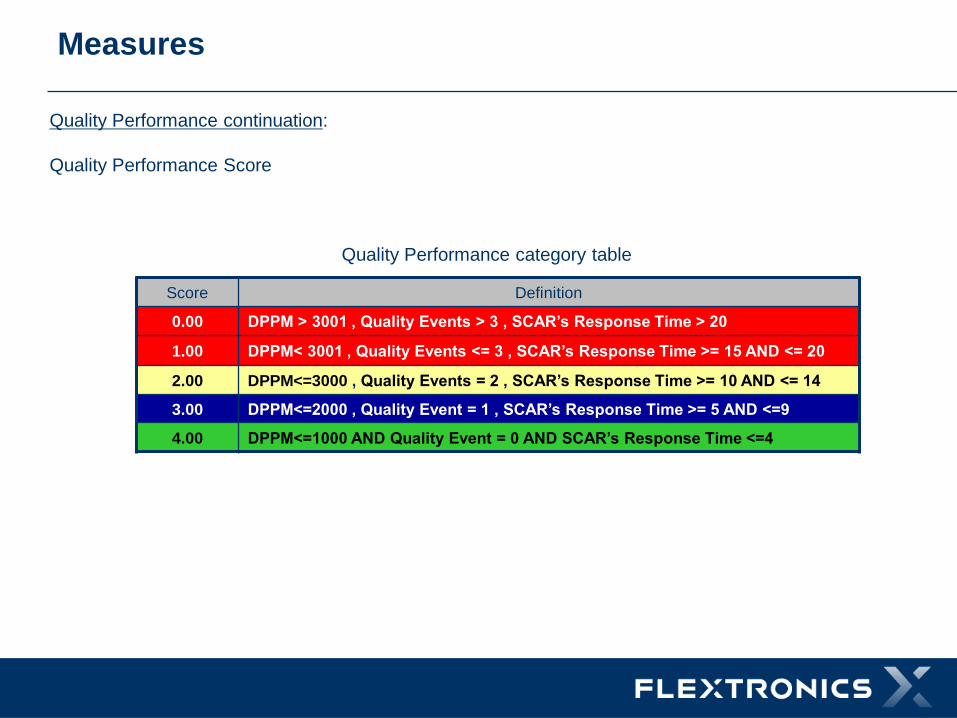
Quality Performance continuation:
Quality Performance Score
Quality Performance category table
11
Score Definition
0.00 DPPM > 3001 , Quality Events > 3 , SCAR’s Response Time > 20
1.00 DPPM< 3001 , Quality Events <= 3 , SCAR’s Response Time >= 15 AND <= 20
2.00 DPPM<=3000 , Quality Events = 2 , SCAR’s Response Time >= 10 AND <= 14
3.00 DPPM<=2000 , Quality Event = 1 , SCAR’s Response Time >= 5 AND <=9
4.00 DPPM<=1000 AND Quality Event = 0 AND SCAR’s Response Time <=4
Measures
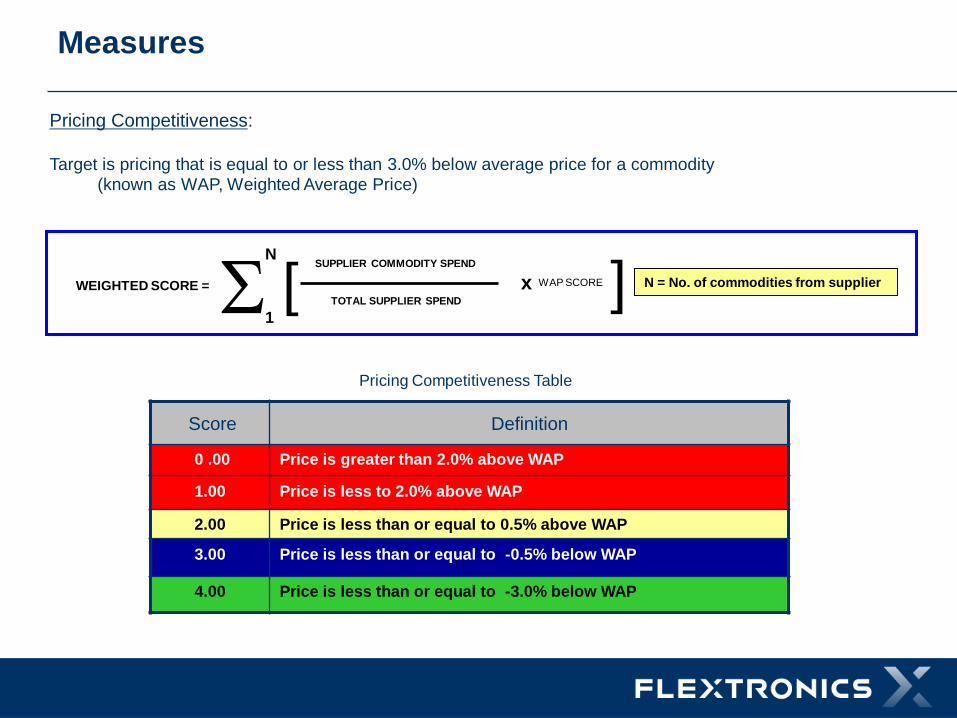
Pricing Competitiveness:
Target is pricing that is equal to or less than 3.0% below average price for a commodity
(known as WAP, Weighted Average Price)
Score Definition
0 .00 Price is greater than 2.0% above WAP
1.00 Price is less to 2.0% above WAP
2.00 Price is less than or equal to 0.5% above WAP
3.00 Price is less than or equal to -0.5% below WAP
4.00 Price is less than or equal to -3.0% below WAP
12
N = No. of commodities from supplier [ S 1
N
WAP SCORE x SUPPLIER COMMODITY SPEND
TOTAL SUPPLIER SPEND
WEIGHTED SCORE = ]
Pricing Competitiveness Table
Measures
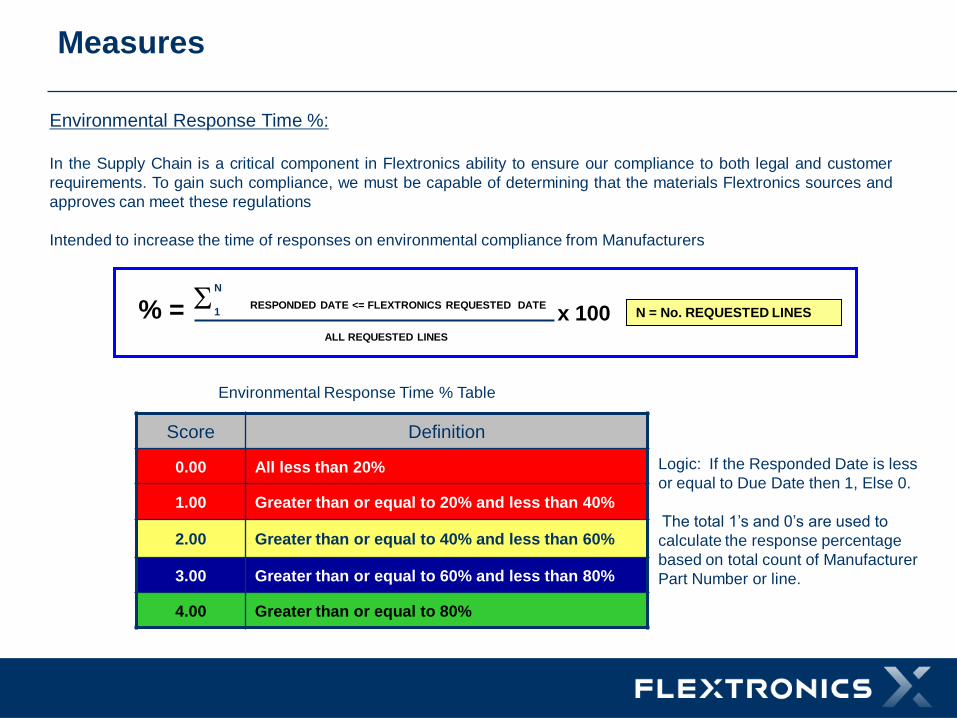
Environmental Response Time %:
In the Supply Chain is a critical component in Flextronics ability to ensure our compliance to both legal and customer
requirements. To gain such compliance, we must be capable of determining that the materials Flextronics sources and
approves can meet these regulations
Intended to increase the time of responses on environmental compliance from Manufacturers
Score Definition
0.00 All less than 20%
1.00 Greater than or equal to 20% and less than 40%
2.00 Greater than or equal to 40% and less than 60%
3.00 Greater than or equal to 60% and less than 80%
4.00 Greater than or equal to 80%
8
Logic: If the Responded Date is less
or equal to Due Date then 1, Else 0.
The total 1’s and 0’s are used to
calculate the response percentage
based on total count of Manufacturer
Part Number or line.
S RESPONDED DATE <= FLEXTRONICS REQUESTED DATE
ALL REQUESTED LINES
% = x 100
N
1 N = No. REQUESTED LINES
Environmental Response Time % Table
Measures
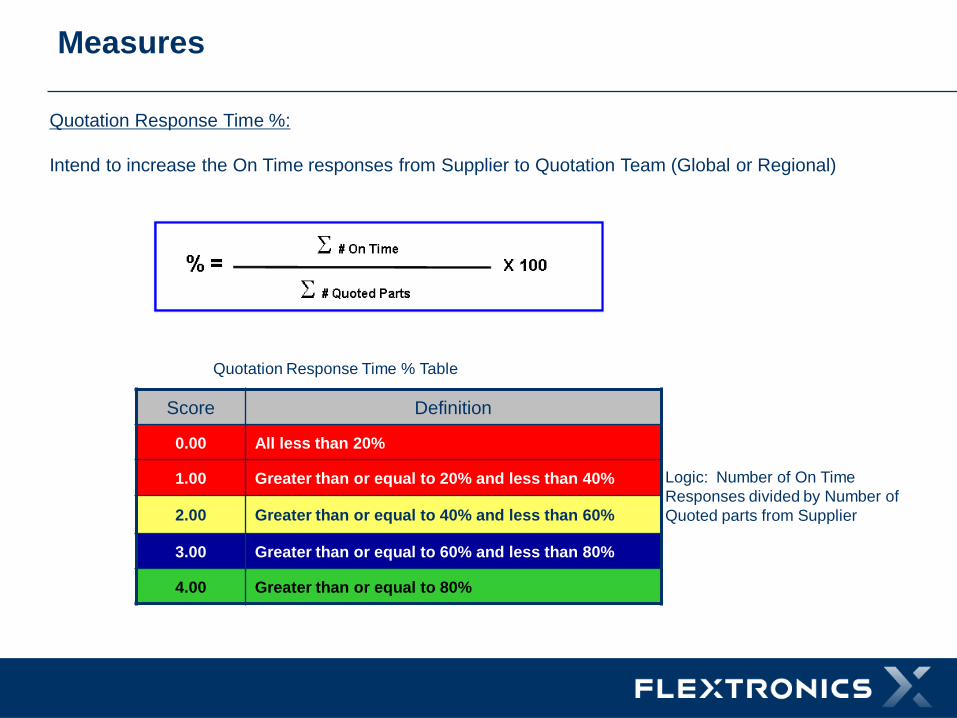
Quotation Response Time %:
Intend to increase the On Time responses from Supplier to Quotation Team (Global or Regional)
Score Definition
0.00 All less than 20%
1.00 Greater than or equal to 20% and less than 40%
2.00 Greater than or equal to 40% and less than 60%
3.00 Greater than or equal to 60% and less than 80%
4.00 Greater than or equal to 80%
8
Logic: Number of On Time
Responses divided by Number of
Quoted parts from Supplier
Quotation Response Time % Table
Supplier Improvement Plan
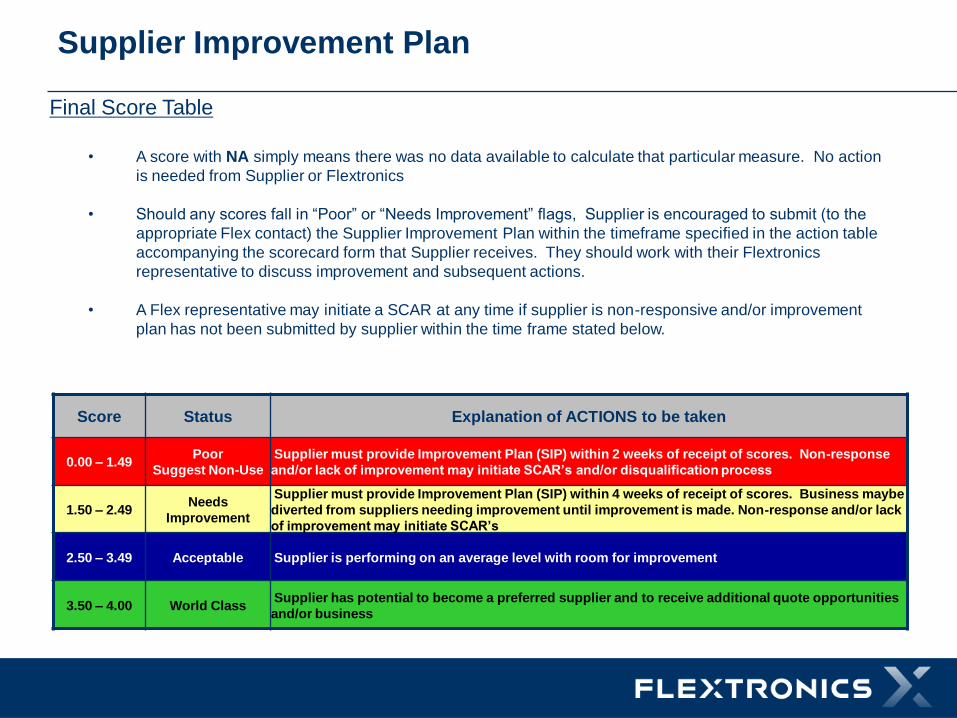
Final Score Table
8
Score Status Explanation of ACTIONS to be taken
0.00 – 1.49 Poor
Suggest Non-Use
Supplier must provide Improvement Plan (SIP) within 2 weeks of receipt of scores. Non-response
and/or lack of improvement may initiate SCAR’s and/or disqualification process
1.50 – 2.49 Needs
Improvement
Supplier must provide Improvement Plan (SIP) within 4 weeks of receipt of scores. Business maybe
diverted from suppliers needing improvement until improvement is made. Non-response and/or lack
of improvement may initiate SCAR’s
2.50 – 3.49 Acceptable Supplier is performing on an average level with room for improvement
3.50 – 4.00 World Class Supplier has potential to become a preferred supplier and to receive additional quote opportunities
and/or business
• A score with NA simply means there was no data available to calculate that particular measure. No action
is needed from Supplier or Flextronics
• Should any scores fall in “Poor” or “Needs Improvement” flags, Supplier is encouraged to submit (to the
appropriate Flex contact) the Supplier Improvement Plan within the timeframe specified in the action table
accompanying the scorecard form that Supplier receives. They should work with their Flextronics
representative to discuss improvement and subsequent actions.
• A Flex representative may initiate a SCAR at any time if supplier is non-responsive and/or improvement
plan has not been submitted by supplier within the time frame stated below.

Thank You
Recommended