© 2003, Stephen M. Rasey, WiserWays, LLCSome Rights ReservedSpotfire San Francisco Users Meeting, Oct. 15, 2003
Slide:1
Spotfire Communicates Portfolio Analysis of Investment Opportunities on
Efficient Frontiers of Many Measures Dr. Stephen M. Rasey, CFO, WiserWays, LLC
Spotfire San Francisco Users Meeting, October 15, 2003
Confidence of Portfolio Performance
MMBOE Conf
500
1000
1500
2000
2500
3000
BOE DSRisk
C.BOE.DSRisk0 25 50 75 100 125 150 175 200 225
0
250
500
750
1000
1250
1500
1750
2000
Effic
ient F
ront
ier
Rew
ard
Risk
Equivalent Reserves

© 2003, Stephen M. Rasey, WiserWays, LLCSome Rights ReservedSpotfire San Francisco Users Meeting, Oct. 15, 2003
Slide:2
Portfolio Analysis
A search for Efficient candidate Portfolios from a collection of potential Investment Opportunities.
Acceptable CandidatePortfolios must satisfyBusiness Needs:
Prospect Database
Make Portfolios Apply ConstraintsA Few Good
Portfolios
+ =
DECIDE ! ACT !
RIGSCAPEX
PERFORMANCE
MinimumAcceptable
Results
© 2003, Stephen M. Rasey, WiserWays, LLCSome Rights ReservedSpotfire San Francisco Users Meeting, Oct. 15, 2003
Slide:3
Investment Opportunities
• Projects where you have an opportunity to invest capital with estimated, but uncertain, profitable returns in the future.
• Example here: Exploration Projects
Invest?
G&G
Expl Wells
Drill?
NPV = 0
Write Off G&G
Fail
Write Off G&G & DH
Develop Produce Tax The Prize!NPV >0Cash Flow >0Earnings >0estimated but Uncertain Success
© 2003, Stephen M. Rasey, WiserWays, LLCSome Rights ReservedSpotfire San Francisco Users Meeting, Oct. 15, 2003
Slide:4
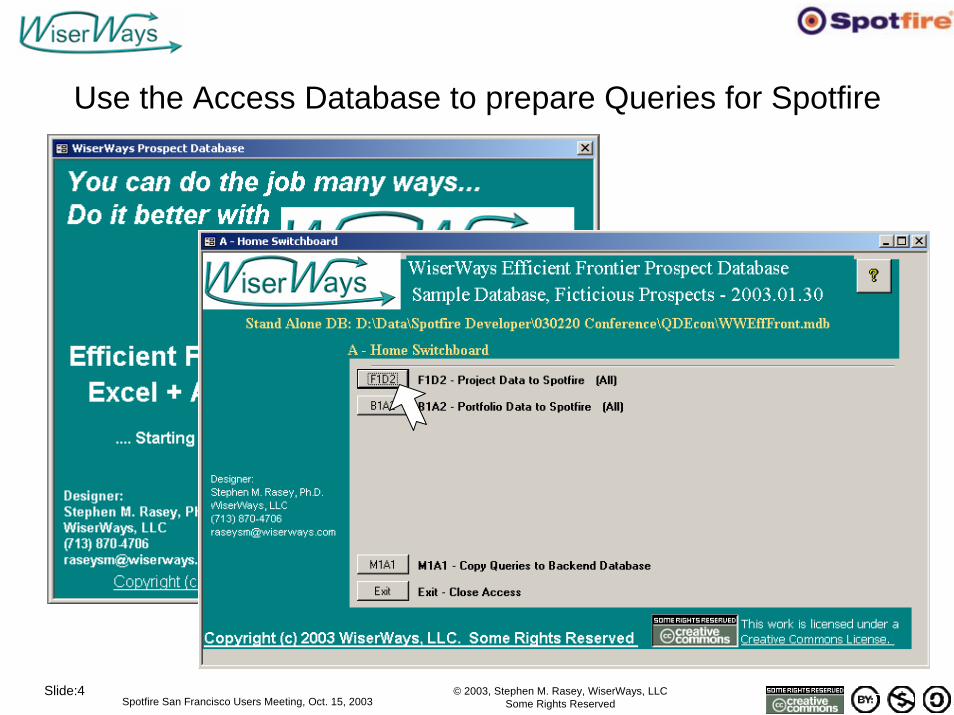
Use the Access Database to prepare Queries for Spotfire
A “Plug” for CreativeCommons.org
A group trying to bring common sense to copyright practices in a digital age.
I view it as a starting point for “Object Oriented Legal agreements”
© 2003, Stephen M. Rasey, WiserWays, LLCSome Rights ReservedSpotfire San Francisco Users Meeting, Oct. 15, 2003
Slide:5
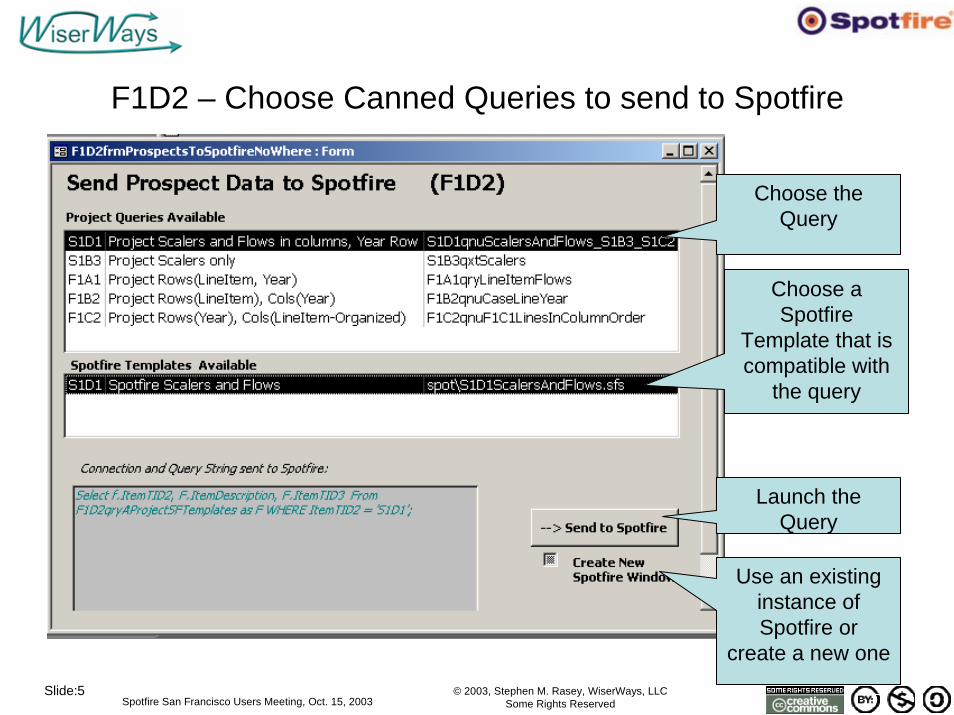
F1D2 – Choose Canned Queries to send to Spotfire
Choose a Spotfire
Template that is compatible with
the query
Use an existing instance of Spotfire or
create a new one
Launch the Query
Choose the Query
© 2003, Stephen M. Rasey, WiserWays, LLCSome Rights ReservedSpotfire San Francisco Users Meeting, Oct. 15, 2003
Slide:6
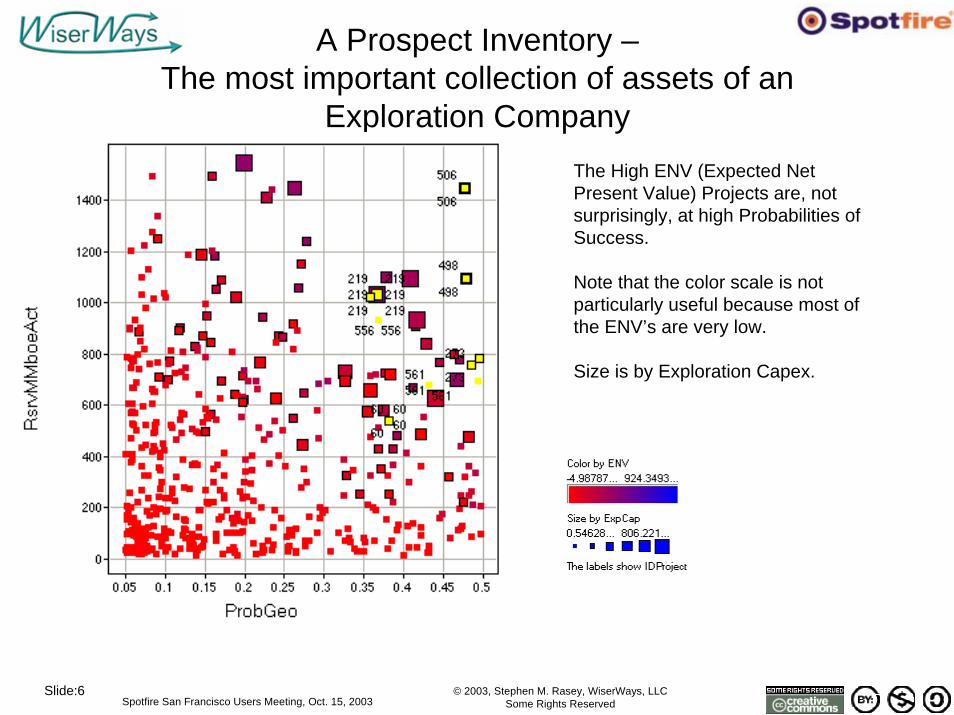
A Prospect Inventory –The most important collection of assets of an
Exploration CompanyThe High ENV (Expected Net Present Value) Projects are, not surprisingly, at high Probabilities of Success.
Note that the color scale is not particularly useful because most of the ENV’s are very low.
Size is by Exploration Capex.
© 2003, Stephen M. Rasey, WiserWays, LLCSome Rights ReservedSpotfire San Francisco Users Meeting, Oct. 15, 2003
Slide:7
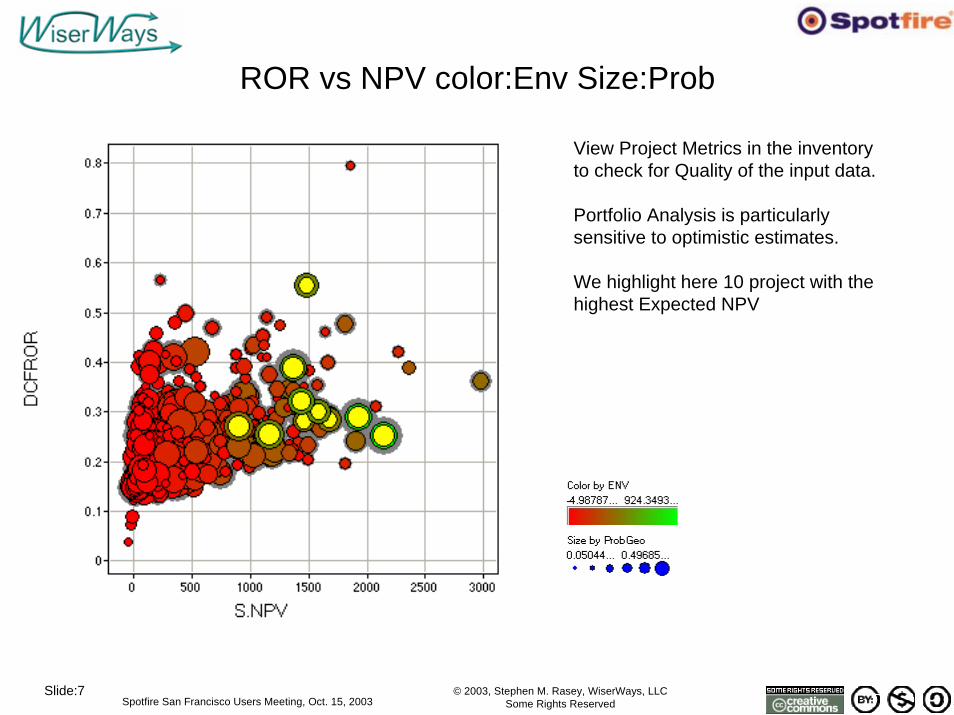
ROR vs NPV color:Env Size:Prob
View Project Metrics in the inventory to check for Quality of the input data.
Portfolio Analysis is particularly sensitive to optimistic estimates.
We highlight here 10 project with the highest Expected NPV
© 2003, Stephen M. Rasey, WiserWays, LLCSome Rights ReservedSpotfire San Francisco Users Meeting, Oct. 15, 2003
Slide:8
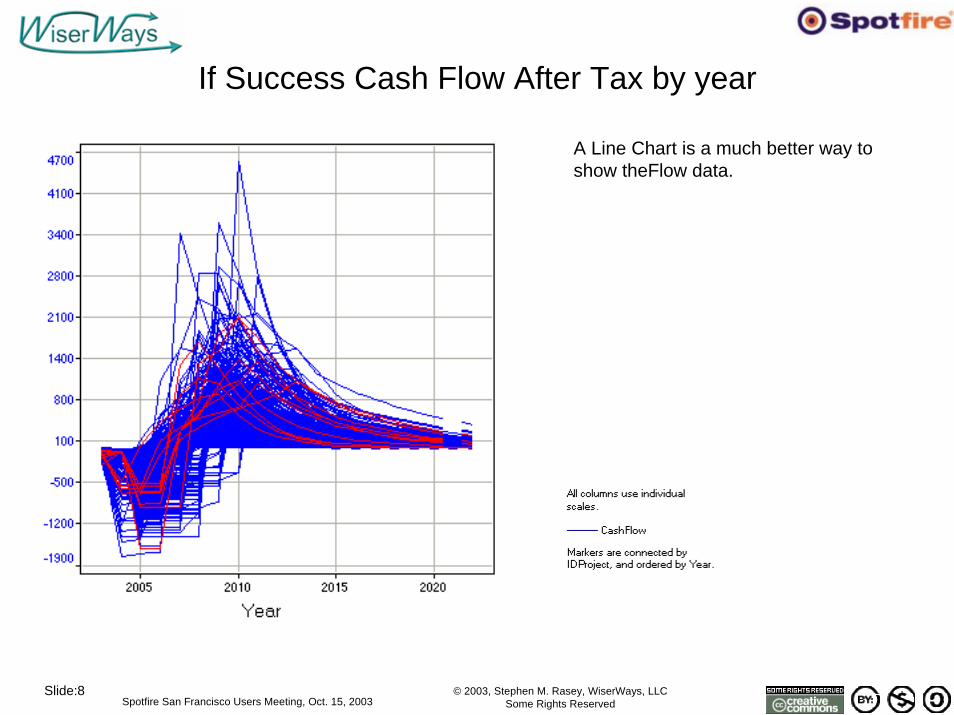
If Success Cash Flow After Tax by year
A Line Chart is a much better way to show theFlow data.
© 2003, Stephen M. Rasey, WiserWays, LLCSome Rights ReservedSpotfire San Francisco Users Meeting, Oct. 15, 2003
Slide:9
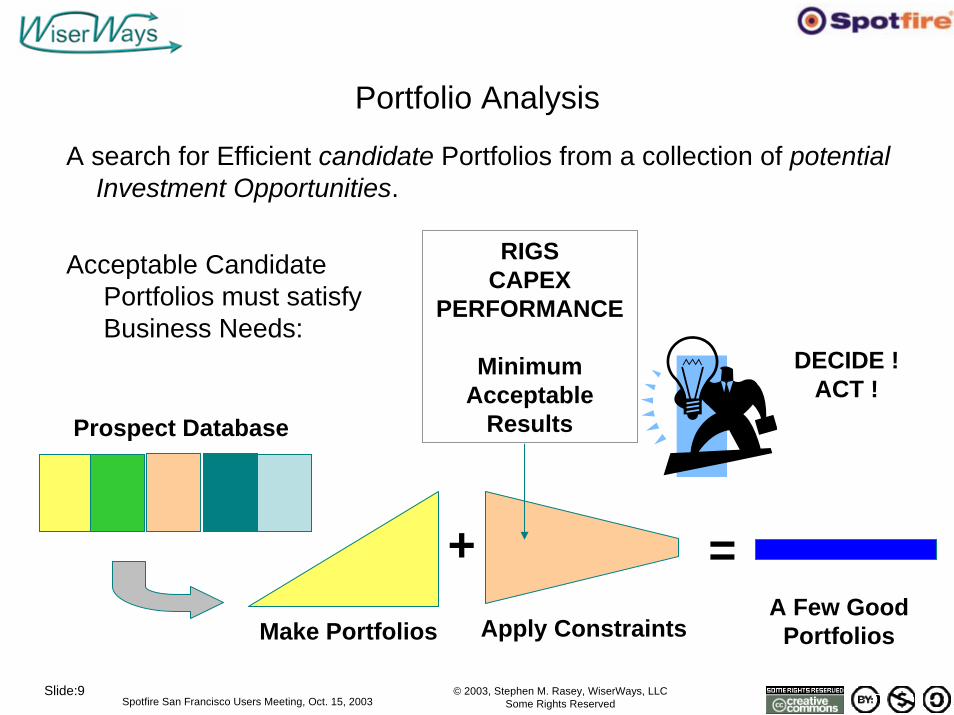
Portfolio Analysis
A search for Efficient candidate Portfolios from a collection of potential Investment Opportunities.
Acceptable CandidatePortfolios must satisfyBusiness Needs:
Prospect Database
Make Portfolios Apply ConstraintsA Few Good
Portfolios
+ =
DECIDE ! ACT !
RIGSCAPEX
PERFORMANCE
MinimumAcceptable
Results
© 2003, Stephen M. Rasey, WiserWays, LLCSome Rights ReservedSpotfire San Francisco Users Meeting, Oct. 15, 2003
Slide:10
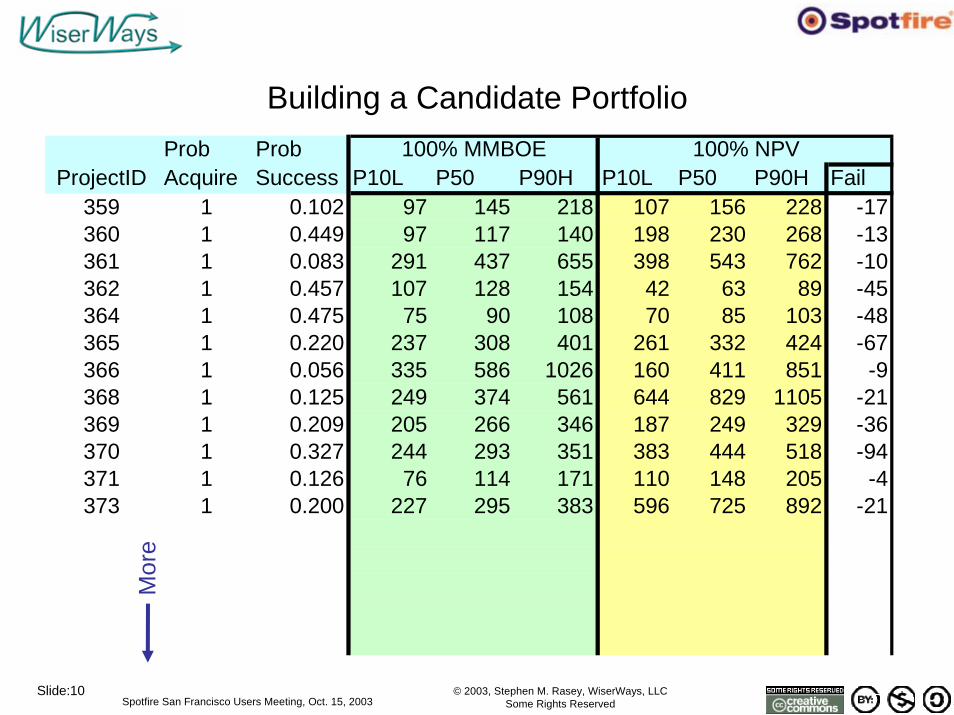
Building a Candidate PortfolioProb Prob
ProjectID Acquire Success P10L P50 P90H P10L P50 P90H Fail359 1 0.102 97 145 218 107 156 228 -17360 1 0.449 97 117 140 198 230 268 -13361 1 0.083 291 437 655 398 543 762 -10362 1 0.457 107 128 154 42 63 89 -45364 1 0.475 75 90 108 70 85 103 -48365 1 0.220 237 308 401 261 332 424 -67366 1 0.056 335 586 1026 160 411 851 -9368 1 0.125 249 374 561 644 829 1105 -21369 1 0.209 205 266 346 187 249 329 -36370 1 0.327 244 293 351 383 444 518 -94371 1 0.126 76 114 171 110 148 205 -4373 1 0.200 227 295 383 596 725 892 -21
100% MMBOE 100% NPVM
ore
© 2003, Stephen M. Rasey, WiserWays, LLCSome Rights ReservedSpotfire San Francisco Users Meeting, Oct. 15, 2003
Slide:11
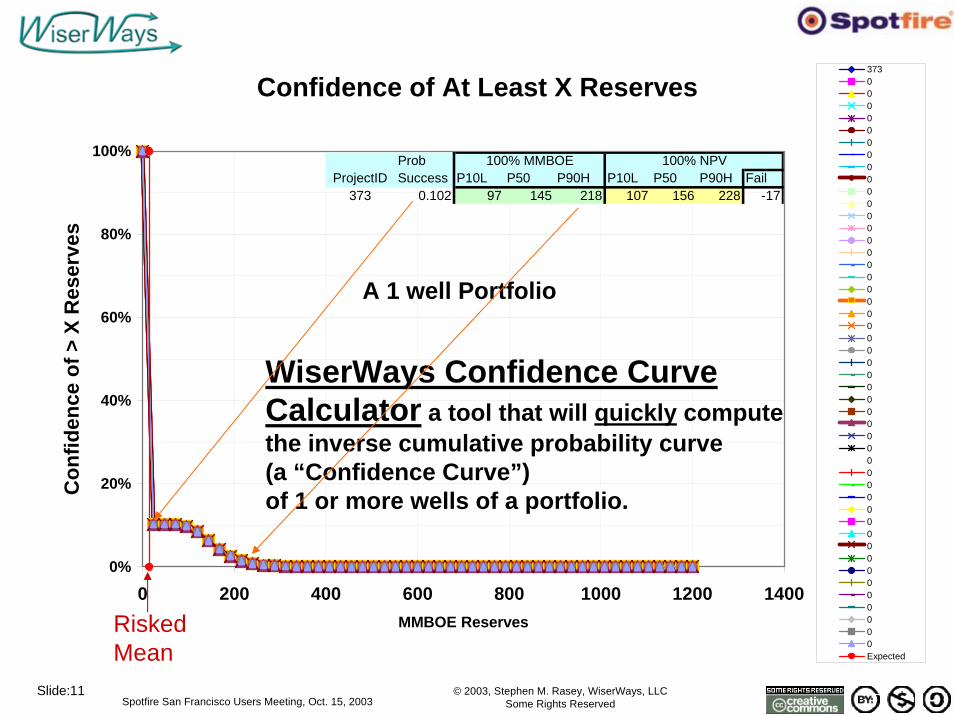
Confidence of At Least X Reserves
0%
20%
40%
60%
80%
100%
0 200 400 600 800 1000 1200 1400MMBOE Reserves
Con
fiden
ce o
f > X
Res
erve
s37300000000000000000000000000000000000000000000000Expected
ProbProjectID Success P10L P50 P90H P10L P50 P90H Fail
373 0.102 97 145 218 107 156 228 -17
100% MMBOE 100% NPV
Risked Mean
A 1 well Portfolio
WiserWays Confidence Curve Calculator a tool that will quickly compute the inverse cumulative probability curve (a “Confidence Curve”) of 1 or more wells of a portfolio.
© 2003, Stephen M. Rasey, WiserWays, LLCSome Rights ReservedSpotfire San Francisco Users Meeting, Oct. 15, 2003
Slide:12
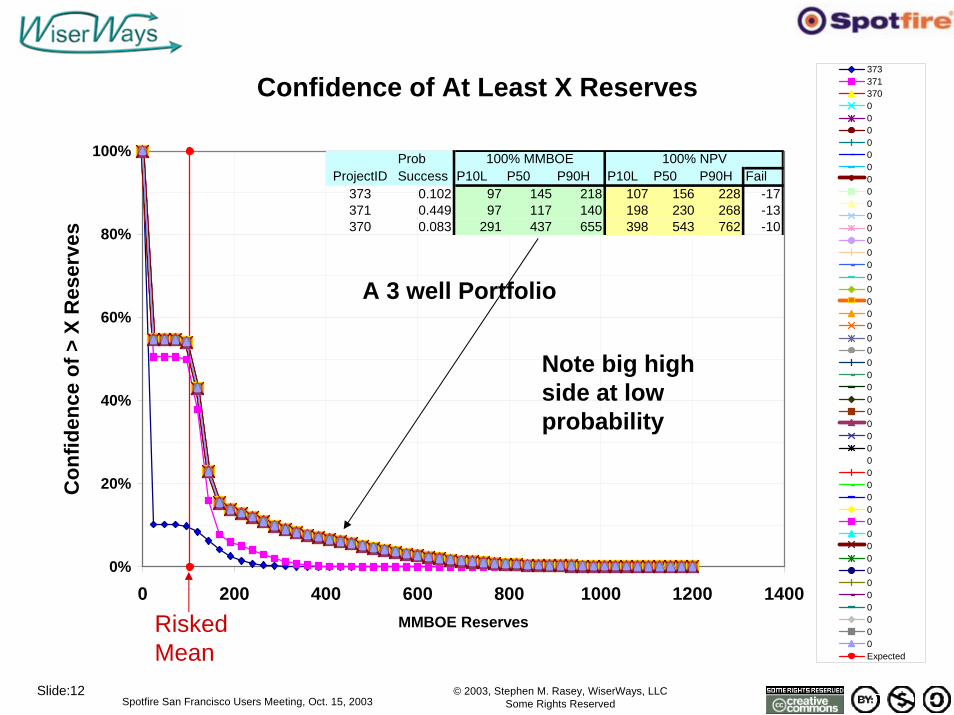
Confidence of At Least X Reserves
0%
20%
40%
60%
80%
100%
0 200 400 600 800 1000 1200 1400MMBOE Reserves
Con
fiden
ce o
f > X
Res
erve
s373371370000000000000000000000000000000000000000000000Expected
ProbProjectID Success P10L P50 P90H P10L P50 P90H Fail
373 0.102 97 145 218 107 156 228 -17371 0.449 97 117 140 198 230 268 -13370 0.083 291 437 655 398 543 762 -10
100% MMBOE 100% NPV
Risked Mean
A 3 well Portfolio
Note big high side at low probability
© 2003, Stephen M. Rasey, WiserWays, LLCSome Rights ReservedSpotfire San Francisco Users Meeting, Oct. 15, 2003
Slide:13
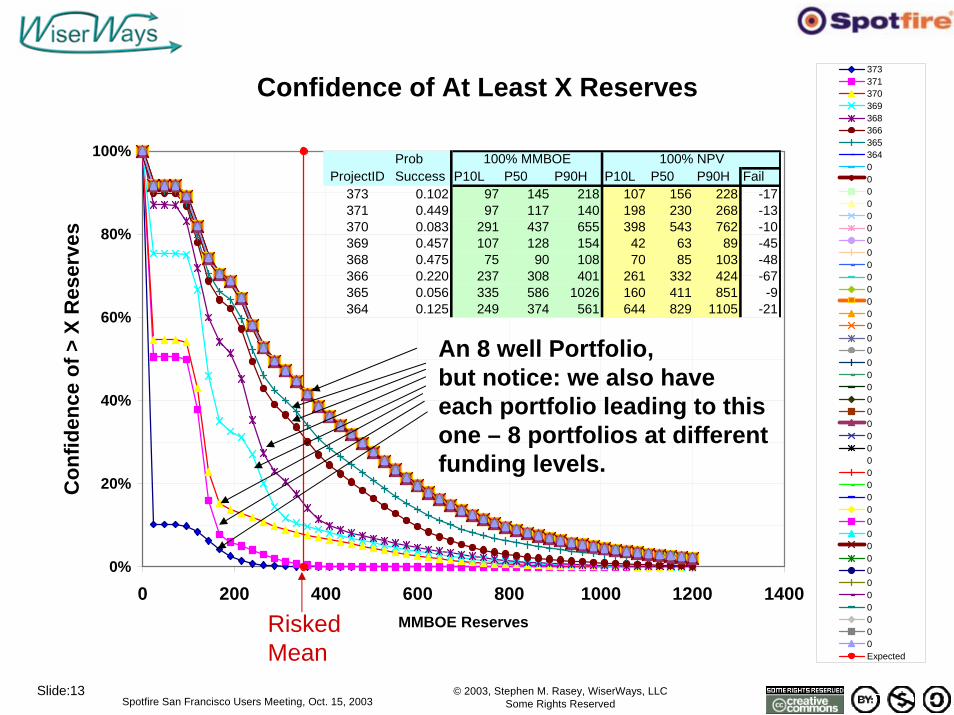
Confidence of At Least X Reserves
0%
20%
40%
60%
80%
100%
0 200 400 600 800 1000 1200 1400MMBOE Reserves
Con
fiden
ce o
f > X
Res
erve
s3733713703693683663653640000000000000000000000000000000000000000Expected
ProbProjectID Success P10L P50 P90H P10L P50 P90H Fail
373 0.102 97 145 218 107 156 228 -17371 0.449 97 117 140 198 230 268 -13370 0.083 291 437 655 398 543 762 -10369 0.457 107 128 154 42 63 89 -45368 0.475 75 90 108 70 85 103 -48366 0.220 237 308 401 261 332 424 -67365 0.056 335 586 1026 160 411 851 -9364 0.125 249 374 561 644 829 1105 -21
100% MMBOE 100% NPV
Risked Mean
An 8 well Portfolio,but notice: we also have each portfolio leading to this one – 8 portfolios at different funding levels.
© 2003, Stephen M. Rasey, WiserWays, LLCSome Rights ReservedSpotfire San Francisco Users Meeting, Oct. 15, 2003
Slide:14
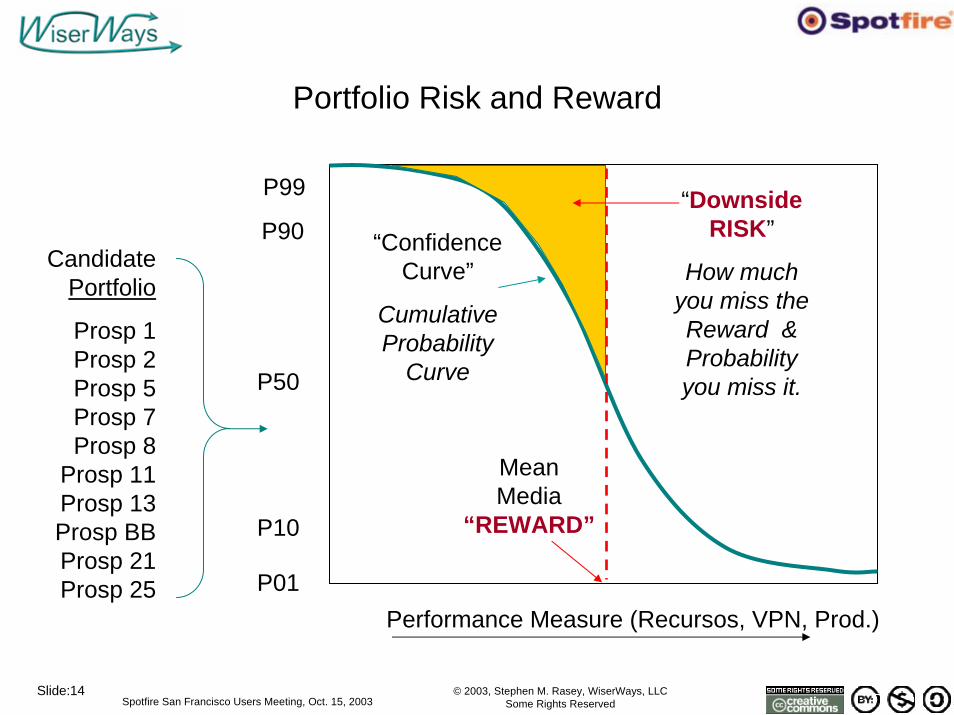
Portfolio Risk and Reward
P01
P10
P50
P90
P99
Performance Measure (Recursos, VPN, Prod.)
MeanMedia
“REWARD”
“Confidence Curve”
Cumulative Probability
Curve
“Downside RISK”
How much you miss the Reward & Probability you miss it.
Candidate Portfolio
Prosp 1Prosp 2Prosp 5Prosp 7Prosp 8
Prosp 11Prosp 13Prosp BBProsp 21Prosp 25
© 2003, Stephen M. Rasey, WiserWays, LLCSome Rights ReservedSpotfire San Francisco Users Meeting, Oct. 15, 2003
Slide:15
DS BOE
C.BOE.DSRisk0 50 100 150 200 250
0
250
500
750
1000
1250
1500
1750
2000
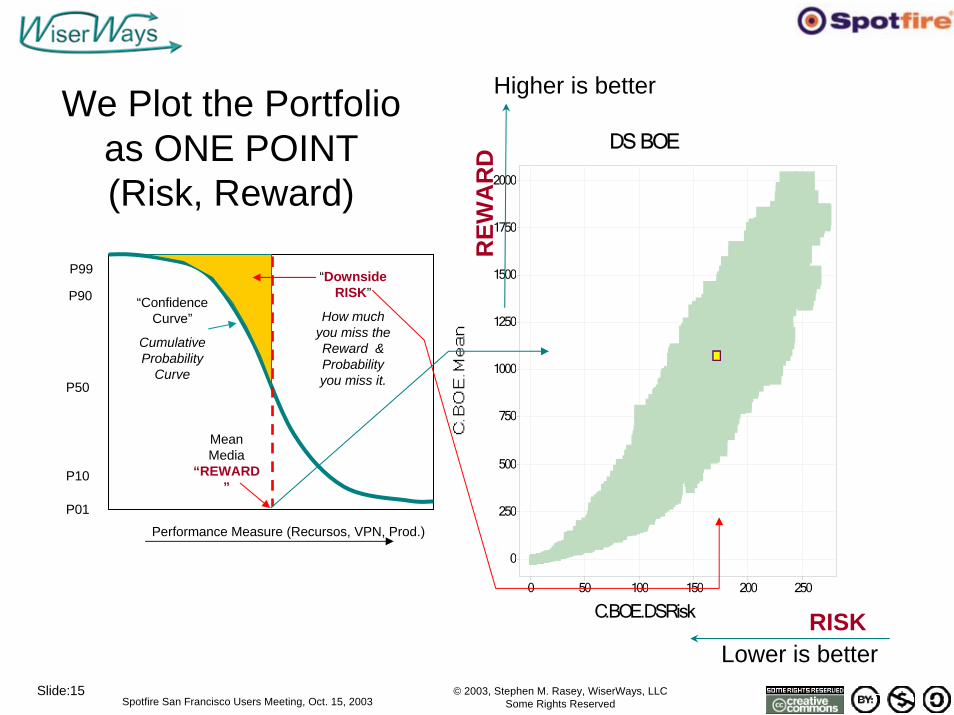
We Plot the Portfolio as ONE POINT (Risk, Reward)
P01
P10
P50
P90
P99
Performance Measure (Recursos, VPN, Prod.)
MeanMedia
“REWARD”
“Confidence Curve”
Cumulative Probability
Curve
“Downside RISK”
How much you miss the Reward & Probability you miss it.
RISKLower is better
REW
AR
D
Higher is better
© 2003, Stephen M. Rasey, WiserWays, LLCSome Rights ReservedSpotfire San Francisco Users Meeting, Oct. 15, 2003
Slide:16
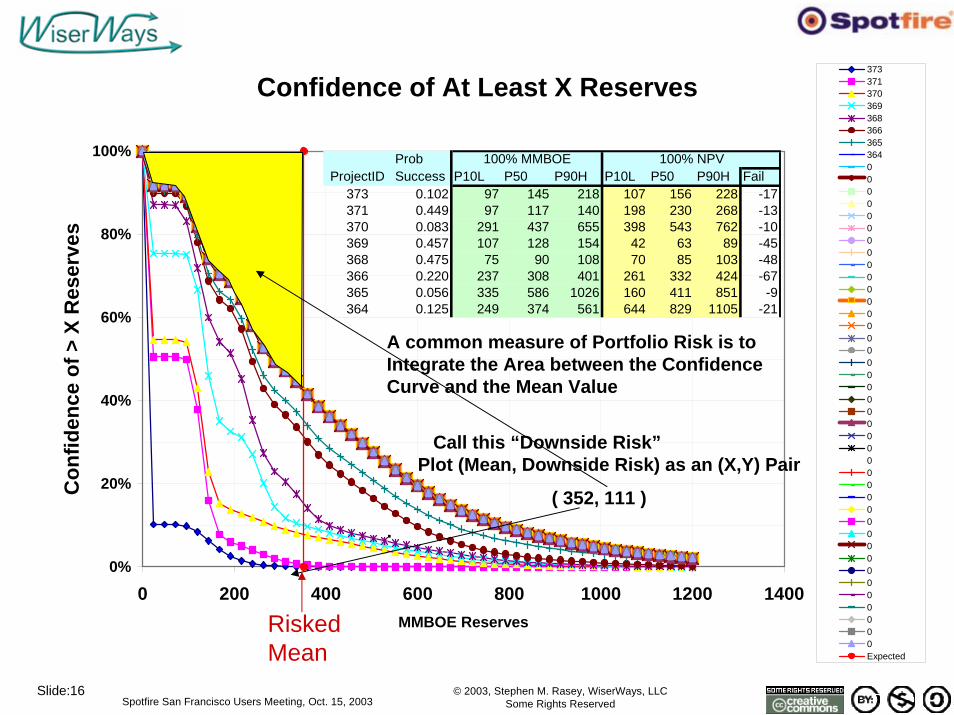
Confidence of At Least X Reserves
0%
20%
40%
60%
80%
100%
0 200 400 600 800 1000 1200 1400MMBOE Reserves
Con
fiden
ce o
f > X
Res
erve
s3733713703693683663653640000000000000000000000000000000000000000Expected
ProbProjectID Success P10L P50 P90H P10L P50 P90H Fail
373 0.102 97 145 218 107 156 228 -17371 0.449 97 117 140 198 230 268 -13370 0.083 291 437 655 398 543 762 -10369 0.457 107 128 154 42 63 89 -45368 0.475 75 90 108 70 85 103 -48366 0.220 237 308 401 261 332 424 -67365 0.056 335 586 1026 160 411 851 -9364 0.125 249 374 561 644 829 1105 -21
100% MMBOE 100% NPV
Risked Mean
A common measure of Portfolio Risk is to Integrate the Area between the Confidence Curve and the Mean Value
Call this “Downside Risk”Plot (Mean, Downside Risk) as an (X,Y) Pair
( 352, 111 )
.
© 2003, Stephen M. Rasey, WiserWays, LLCSome Rights ReservedSpotfire San Francisco Users Meeting, Oct. 15, 2003
Slide:17
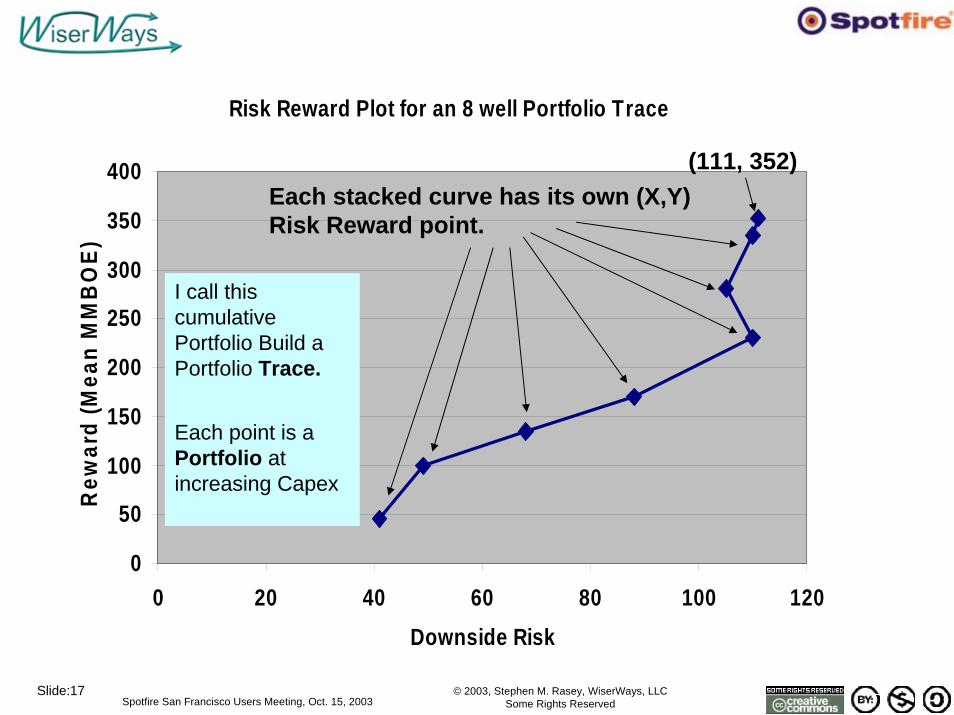
Risk Reward Plot for an 8 well Portfolio Trace
0
50
100
150
200
250
300
350
400
0 20 40 60 80 100 120Downside Risk
Rew
ard
(Mea
n M
MB
OE)
(111, 352)Each stacked curve has its own (X,Y) Risk Reward point.
I call this cumulative Portfolio Build a Portfolio Trace.
Each point is a Portfolio at increasing Capex
© 2003, Stephen M. Rasey, WiserWays, LLCSome Rights ReservedSpotfire San Francisco Users Meeting, Oct. 15, 2003
Slide:18
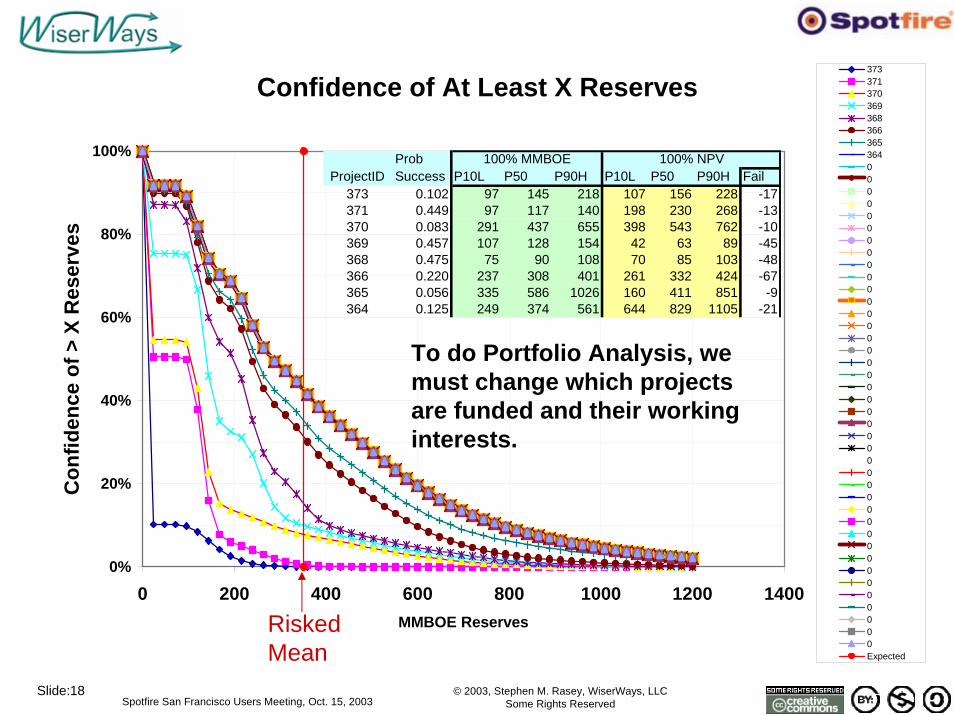
Confidence of At Least X Reserves
0%
20%
40%
60%
80%
100%
0 200 400 600 800 1000 1200 1400MMBOE Reserves
Con
fiden
ce o
f > X
Res
erve
s3733713703693683663653640000000000000000000000000000000000000000Expected
ProbProjectID Success P10L P50 P90H P10L P50 P90H Fail
373 0.102 97 145 218 107 156 228 -17371 0.449 97 117 140 198 230 268 -13370 0.083 291 437 655 398 543 762 -10369 0.457 107 128 154 42 63 89 -45368 0.475 75 90 108 70 85 103 -48366 0.220 237 308 401 261 332 424 -67365 0.056 335 586 1026 160 411 851 -9364 0.125 249 374 561 644 829 1105 -21
100% MMBOE 100% NPV
Risked Mean
To do Portfolio Analysis, we must change which projects are funded and their working interests.
© 2003, Stephen M. Rasey, WiserWays, LLCSome Rights ReservedSpotfire San Francisco Users Meeting, Oct. 15, 2003
Slide:19
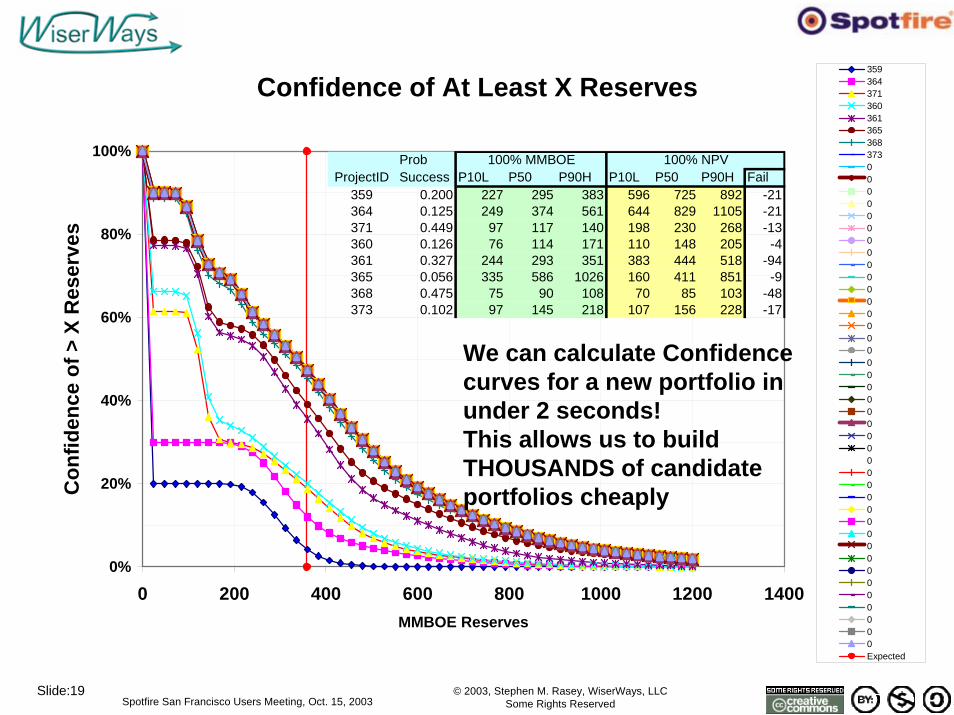
Confidence of At Least X Reserves
0%
20%
40%
60%
80%
100%
0 200 400 600 800 1000 1200 1400MMBOE Reserves
Con
fiden
ce o
f > X
Res
erve
s3593643713603613653683730000000000000000000000000000000000000000Expected
ProbProjectID Success P10L P50 P90H P10L P50 P90H Fail
359 0.200 227 295 383 596 725 892 -21364 0.125 249 374 561 644 829 1105 -21371 0.449 97 117 140 198 230 268 -13360 0.126 76 114 171 110 148 205 -4361 0.327 244 293 351 383 444 518 -94365 0.056 335 586 1026 160 411 851 -9368 0.475 75 90 108 70 85 103 -48373 0.102 97 145 218 107 156 228 -17
100% MMBOE 100% NPV
We can calculate Confidence curves for a new portfolio in under 2 seconds! This allows us to build THOUSANDS of candidate portfolios cheaply
© 2003, Stephen M. Rasey, WiserWays, LLCSome Rights ReservedSpotfire San Francisco Users Meeting, Oct. 15, 2003
Slide:20
WiserWays MultiField Confidence Curve Calculator
• The largest version can handle – a 5000 Project inventory, – Up to 150 funded at any one portfolio– Up to 3 discrete working interest per project– Customized weighted project selection based upon good
heuristics.• Each trace calculates has up to 150 Portfolio points. • Each Portfolio point has FIVE confidence curves at
isotiles (every 5%) for MMBOE and NPV written to the database.
• Process time: 10 seconds per trace including writing to the Database. -- 15 Portfolios per second. (2.4Ghz Pentium IV)
• Confidence Curves calculated directly without simulation• Available for sale from WiserWays.
© 2003, Stephen M. Rasey, WiserWays, LLCSome Rights ReservedSpotfire San Francisco Users Meeting, Oct. 15, 2003
Slide:21
WiserWays MultiField Confidence Curve CalculatorSuperior to Monte Carlo Simulation
• Calculation speed is 20 seconds. Monte Carlo simulation could take 200 to 2000 seconds.
• Repeatable. No random numbers used.
• Output of Monte Carlo simulation always have a statistical uncertainty in the result. MultiField has no such error.
• MultiField automatically writes results to a database. Most Monte Carlo applications us manual processes to write to separate spreadsheets.
• Input Distributions are not limited to Log-Normal assumptions.
© 2003, Stephen M. Rasey, WiserWays, LLCSome Rights ReservedSpotfire San Francisco Users Meeting, Oct. 15, 2003
Slide:22
DS BOE
C.BOE.DSRisk0 50 100 150 200 250
0
250
500
750
1000
1250
1500
1750
2000
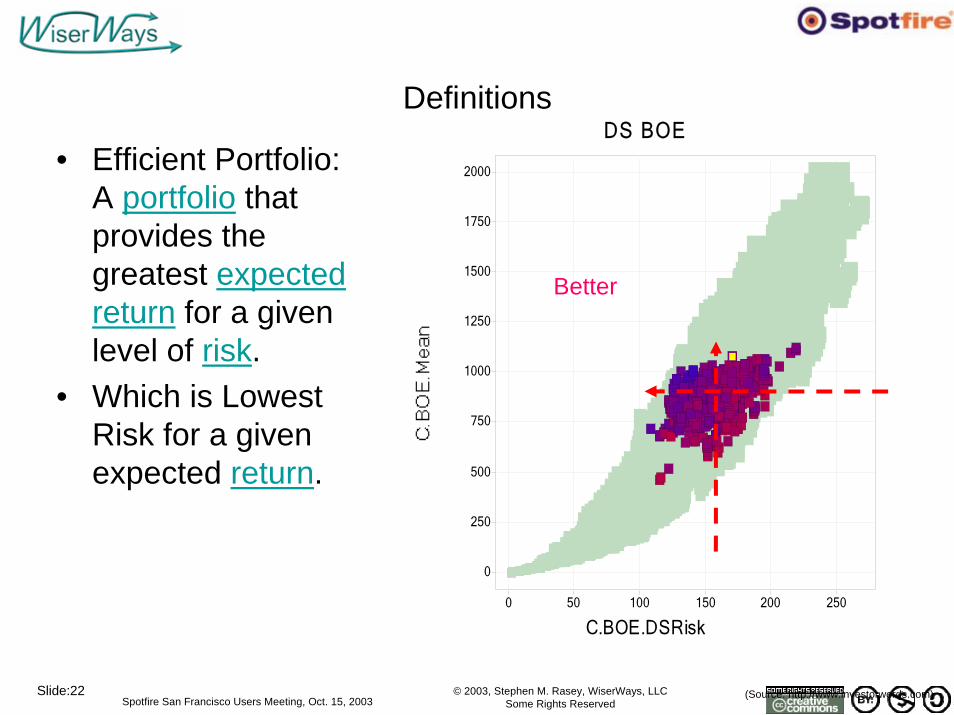
Definitions
• Efficient Portfolio:A portfolio that provides the greatest expected return for a given level of risk.
• Which is Lowest Risk for a given expected return.
Better
(Source: http://www.investorwords.com)
© 2003, Stephen M. Rasey, WiserWays, LLCSome Rights ReservedSpotfire San Francisco Users Meeting, Oct. 15, 2003
Slide:23
DS BOE
C.BOE.DSRisk0 50 100 150 200 250
0
250
500
750
1000
1250
1500
1750
2000
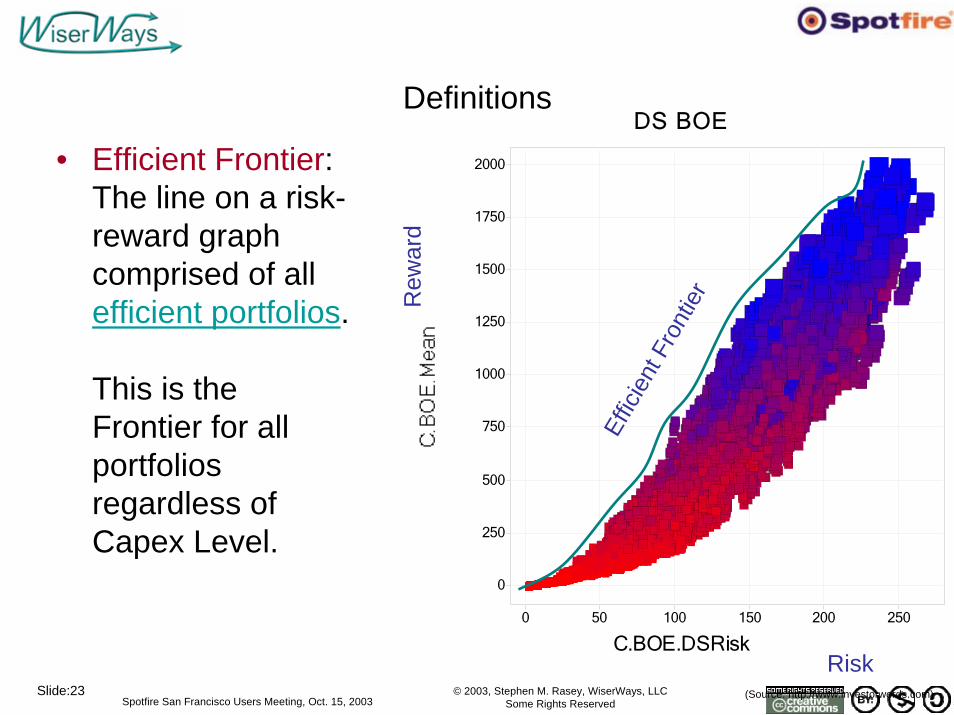
Definitions
• Efficient Frontier:The line on a risk-reward graph comprised of all efficient portfolios.
This is the Frontier for all portfolios regardless of Capex Level.
(Source: http://www.investorwords.com)
Effic
ient
Fro
ntie
rRew
ard
Risk
© 2003, Stephen M. Rasey, WiserWays, LLCSome Rights ReservedSpotfire San Francisco Users Meeting, Oct. 15, 2003
Slide:24
DS BOE
C.BOE.DSRisk0 50 100 150 200 250
0
250
500
750
1000
1250
1500
1750
2000
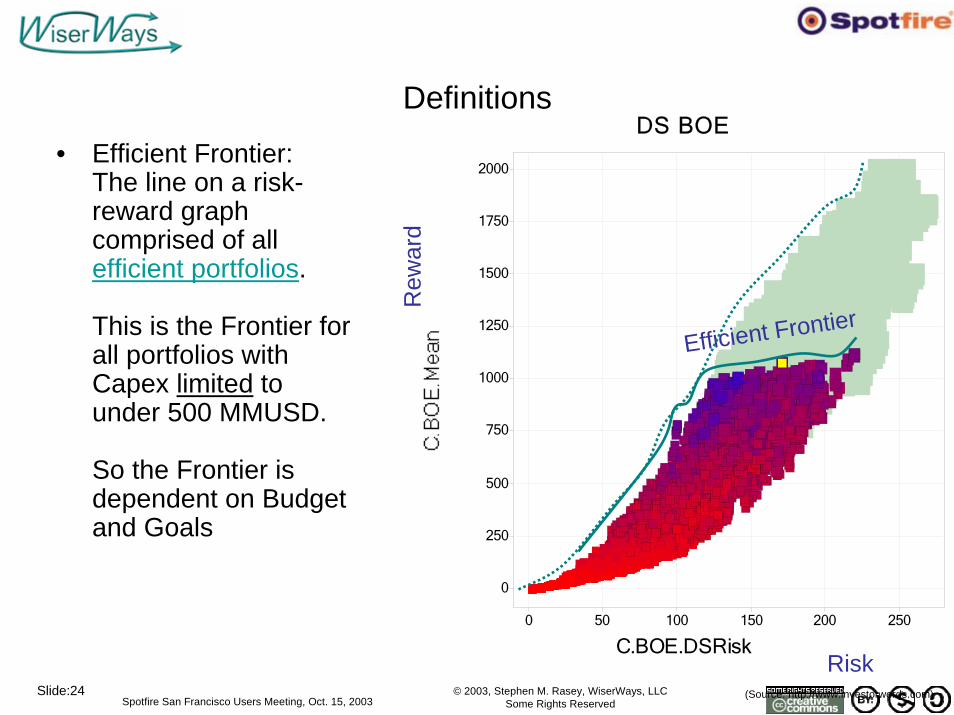
Definitions
• Efficient Frontier:The line on a risk-reward graph comprised of all efficient portfolios.
This is the Frontier for all portfolios with Capex limited to under 500 MMUSD.
So the Frontier is dependent on Budget and Goals
(Source: http://www.investorwords.com)
Efficient Frontier
Rew
ard
Risk
© 2003, Stephen M. Rasey, WiserWays, LLCSome Rights ReservedSpotfire San Francisco Users Meeting, Oct. 15, 2003
Slide:25
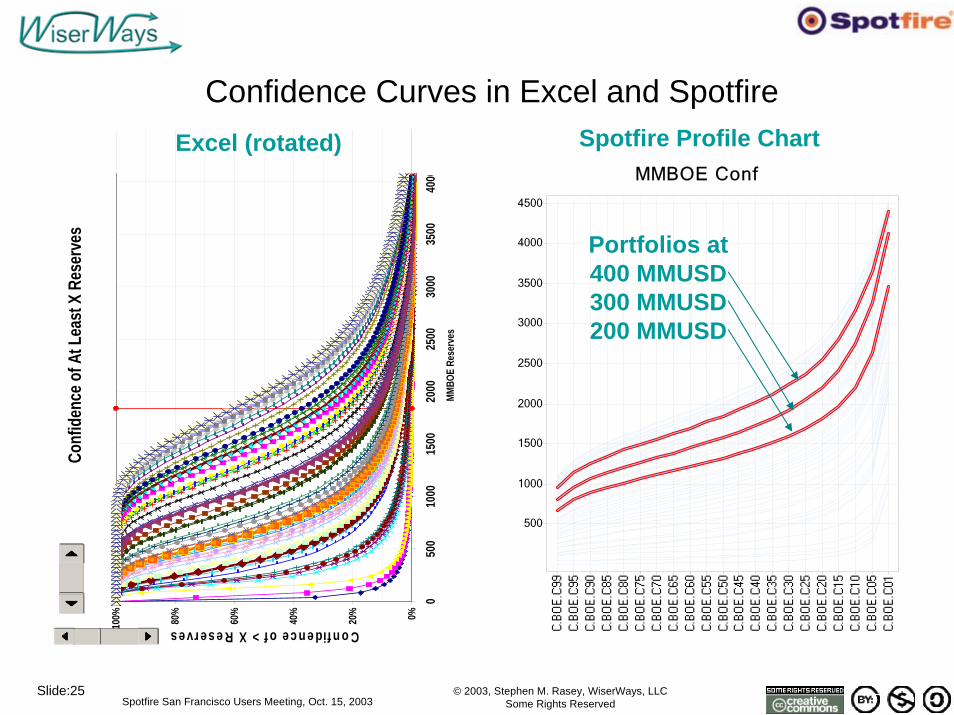
Confidence Curves in Excel and SpotfireCo
nfid
ence
of A
t Lea
st X
Res
erve
s
0%20%
40%
60%
80%
100%
050
010
0015
0020
0025
0030
0035
0040
00MM
BOE
Rese
rves
Confidence of > X Reserves
MMBOE Conf
500
1000
1500
2000
2500
3000
3500
4000
4500
Excel (rotated) Spotfire Profile Chart
Portfolios at 400 MMUSD300 MMUSD200 MMUSD
© 2003, Stephen M. Rasey, WiserWays, LLCSome Rights ReservedSpotfire San Francisco Users Meeting, Oct. 15, 2003
Slide:26
BOE DSRisk
C.BOE.DSRisk0 50 100 150 200
0
250
500
750
1000
1250
1500
1750
2000
M M B O E C o n f
250
500
750
1000
1250
1500
1750
2000
2250
2500
2750
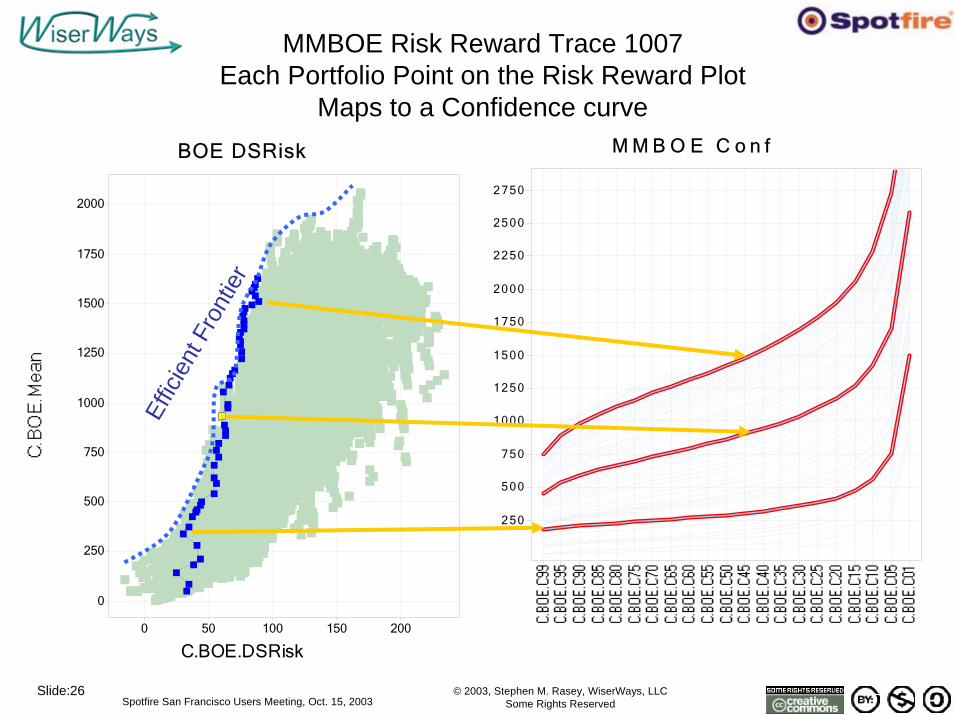
MMBOE Risk Reward Trace 1007Each Portfolio Point on the Risk Reward Plot
Maps to a Confidence curveEf
ficie
nt F
ront
ier
© 2003, Stephen M. Rasey, WiserWays, LLCSome Rights ReservedSpotfire San Francisco Users Meeting, Oct. 15, 2003
Slide:27
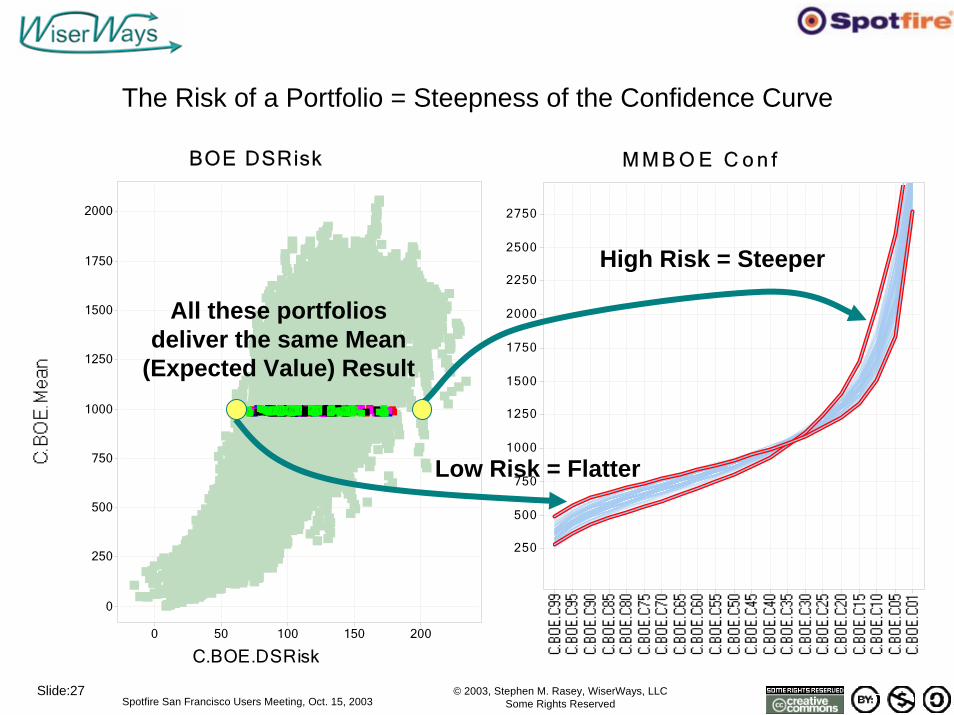
The Risk of a Portfolio = Steepness of the Confidence Curve
BOE DSRisk
C.BOE.DSRisk0 50 100 150 200
0
250
500
750
1000
1250
1500
1750
2000
M M B O E C o n f
250
500
750
1000
1250
1500
1750
2000
2250
2500
2750
All these portfolios deliver the same Mean
(Expected Value) Result
Low Risk = Flatter
High Risk = Steeper
© 2003, Stephen M. Rasey, WiserWays, LLCSome Rights ReservedSpotfire San Francisco Users Meeting, Oct. 15, 2003
Slide:28
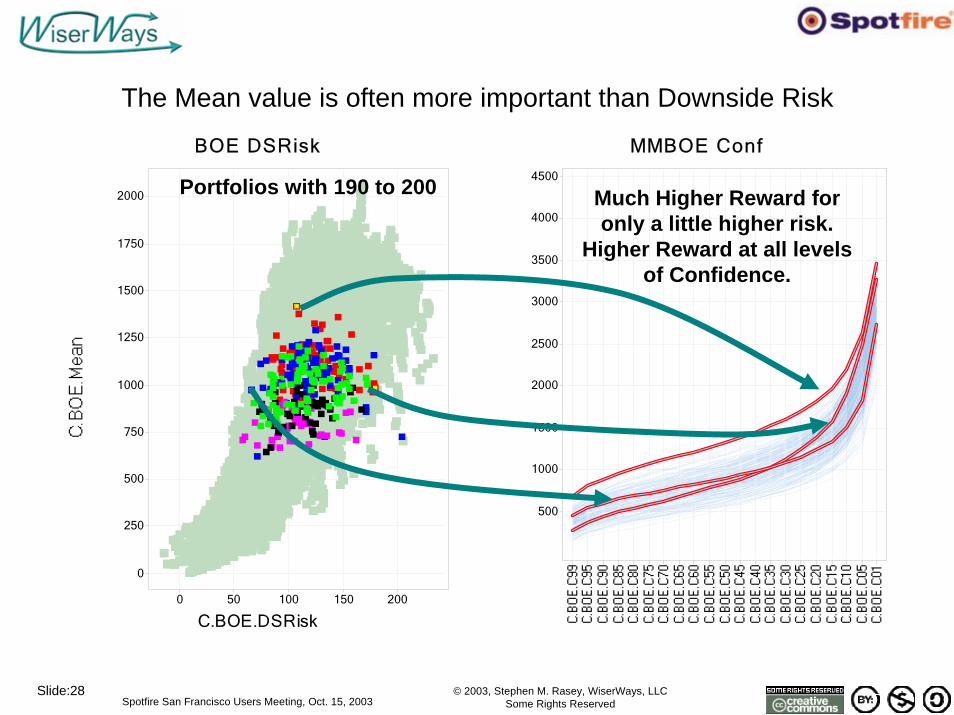
The Mean value is often more important than Downside Risk
MMBOE Conf
500
1000
1500
2000
2500
3000
3500
4000
4500
BOE DSRisk
C.BOE.DSRisk0 50 100 150 200
0
250
500
750
1000
1250
1500
1750
2000 Much Higher Reward for only a little higher risk.
Higher Reward at all levels of Confidence.
Portfolios with 190 to 200
© 2003, Stephen M. Rasey, WiserWays, LLCSome Rights ReservedSpotfire San Francisco Users Meeting, Oct. 15, 2003
Slide:29
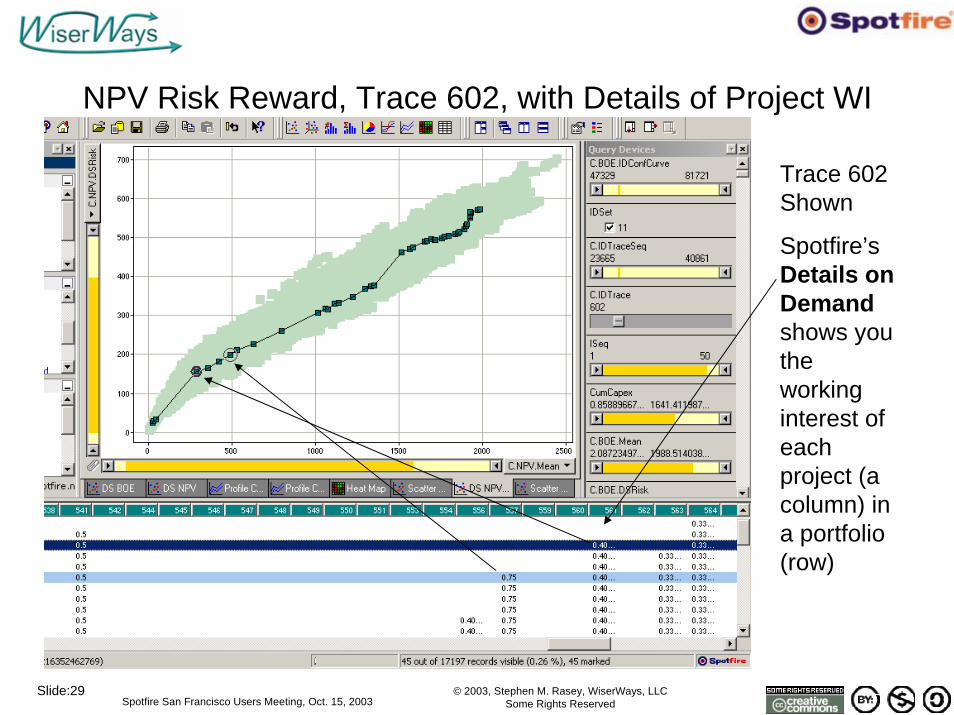
NPV Risk Reward, Trace 602, with Details of Project WI
Trace 602 Shown
Spotfire’sDetails on Demand shows you the working interest of each project (a column) in a portfolio (row)
© 2003, Stephen M. Rasey, WiserWays, LLCSome Rights ReservedSpotfire San Francisco Users Meeting, Oct. 15, 2003
Slide:30
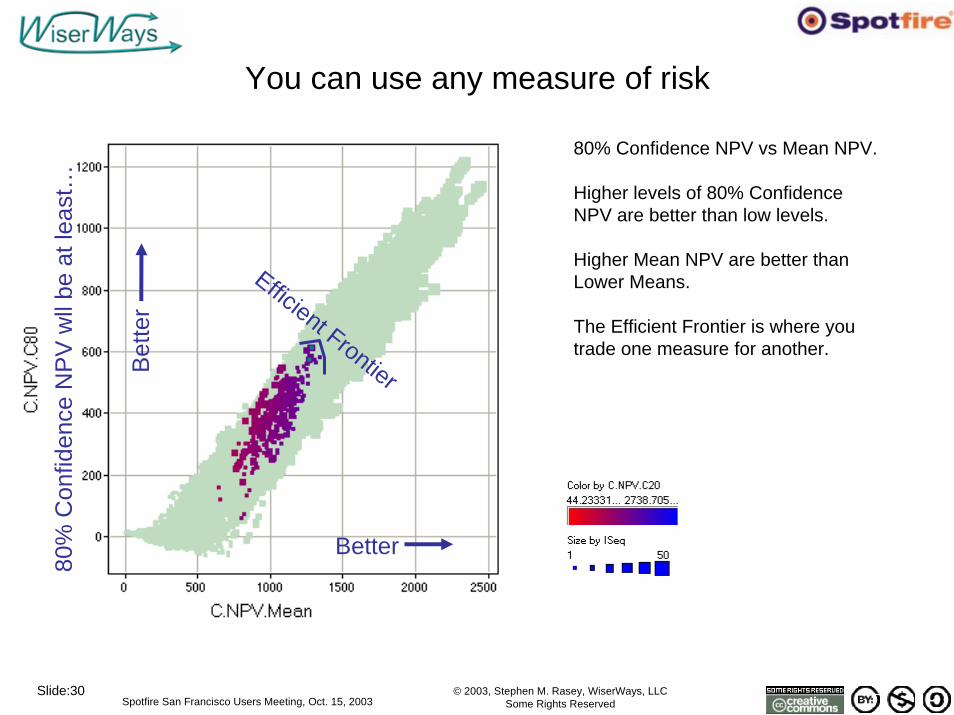
You can use any measure of risk
80% Confidence NPV vs Mean NPV.
Higher levels of 80% Confidence NPV are better than low levels.
Higher Mean NPV are better than Lower Means.
The Efficient Frontier is where you trade one measure for another.
Better
Bet
ter
Efficient Frontier
80%
Con
fiden
ce N
PV
wll
be a
t lea
st…
© 2003, Stephen M. Rasey, WiserWays, LLCSome Rights ReservedSpotfire San Francisco Users Meeting, Oct. 15, 2003
Slide:31
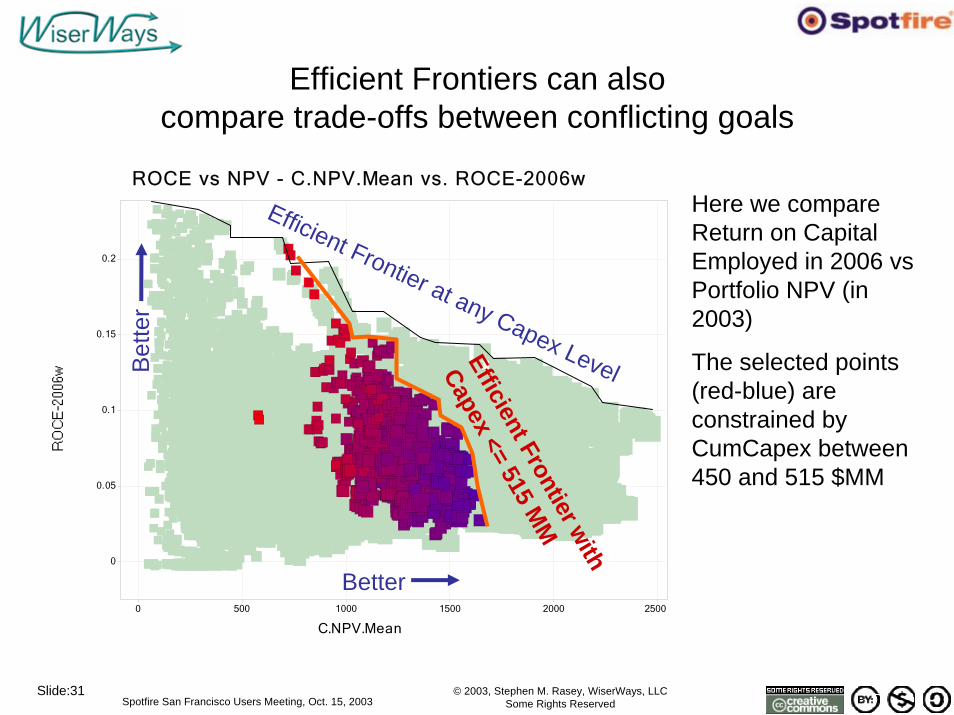
Efficient Frontiers can also compare trade-offs between conflicting goals
ROCE vs NPV - C.NPV.Mean vs. ROCE-2006w
C.NPV.Mean
0 500 1000 1500 2000 2500
0
0.05
0.1
0.15
0.2
Better
Bet
ter
Efficient Frontier at any Capex Level
Efficient Frontier with
Capex<= 515 M
M
Here we compare Return on Capital Employed in 2006 vsPortfolio NPV (in 2003)
The selected points (red-blue) are constrained by CumCapex between 450 and 515 $MM
© 2003, Stephen M. Rasey, WiserWays, LLCSome Rights ReservedSpotfire San Francisco Users Meeting, Oct. 15, 2003
Slide:32
Are there any Companies using this Portfolio System?
¡Sí!EXPLORACIÓN Y PRODUCCIÓN
At the April 2002 AAPG Convention, Pemex presented their processes for Risk Analysis and outlines of their Prospect Inventory. They reported they had over 1000 prospects.
Brett Edwards of Custer Resources saw a version of this Portfolio Analysis presentation from the May 2003 London Spotfire User’s Conference. We made a proposal to Pemex Exploration Executive Management on July 20. We got an immediate go-ahead.
By October 8, the we had generated over 1,500,000 portfolios on over 20,000 traces.
© 2003, Stephen M. Rasey, WiserWays, LLCSome Rights ReservedSpotfire San Francisco Users Meeting, Oct. 15, 2003
Slide:33
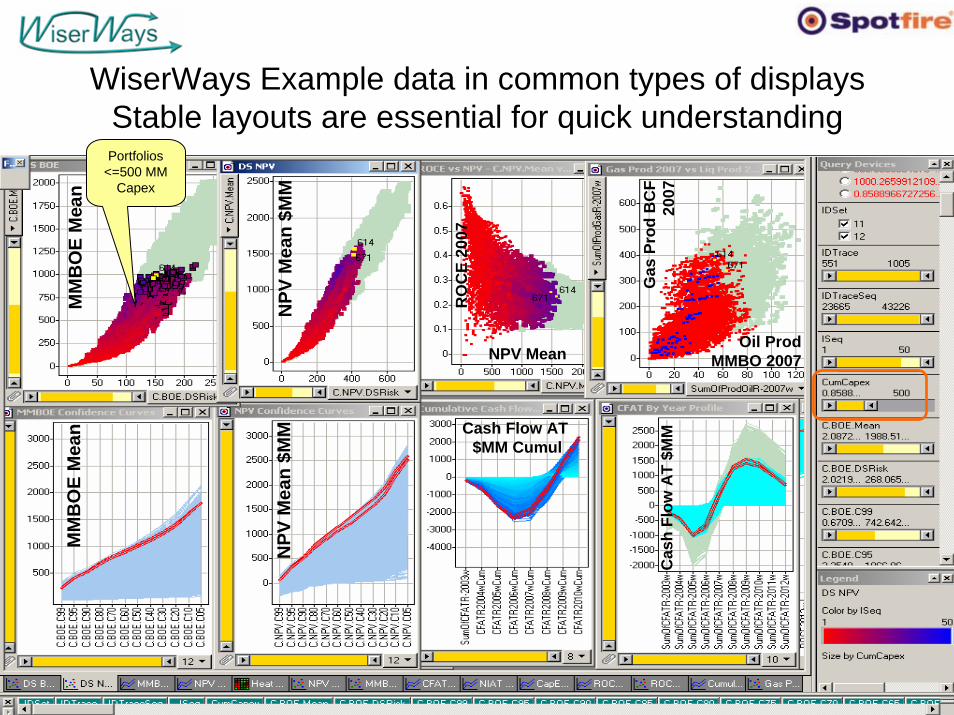
WiserWays Example data in common types of displaysStable layouts are essential for quick understanding
MM
BO
E M
ean
MM
BO
E M
ean
NPV
Mea
n $M
M
NPV
Mea
n $M
M
NPV Mean Oil Prod
MMBO 2007
Gas
Pro
d B
CF
2007
RO
CE
2007
Cash Flow AT$MM Cumul
Cas
h Fl
ow A
T $M
M
Portfolios <=500 MM
Capex
© 2003, Stephen M. Rasey, WiserWays, LLCSome Rights ReservedSpotfire San Francisco Users Meeting, Oct. 15, 2003
Slide:34
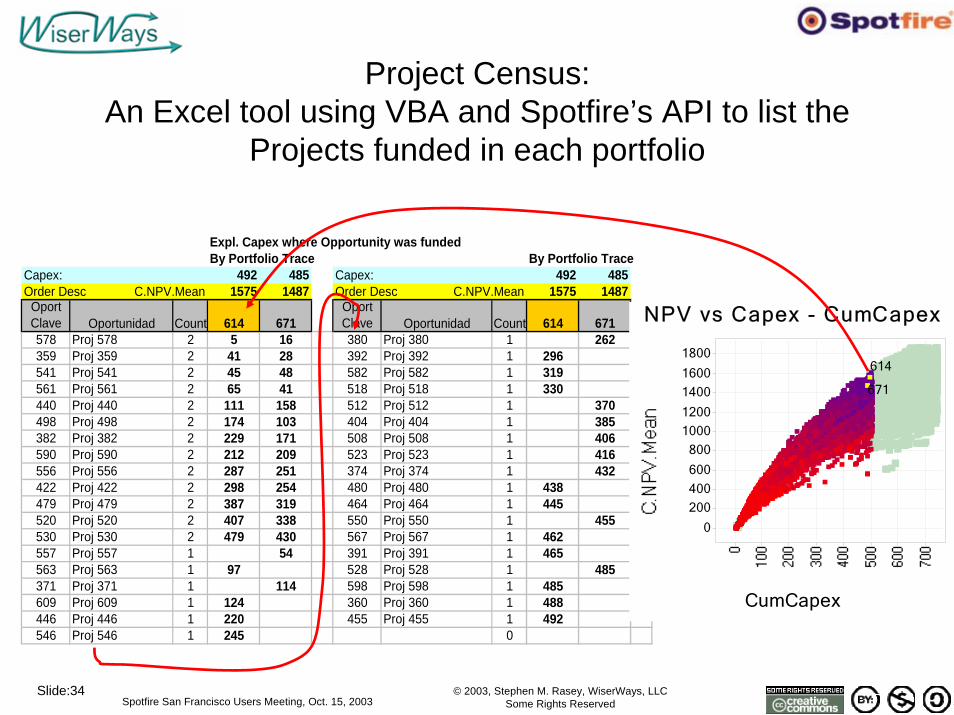
Project Census: An Excel tool using VBA and Spotfire’s API to list the
Projects funded in each portfolio
Expl. Capex where Opportunity was fundedBy Portfolio Trace By Portfolio Trace
Capex: 492 485 Capex: 492 485Order Desc C.NPV.Mean 1575 1487 Order Desc C.NPV.Mean 1575 1487
OportClave Oportunidad Count 614 671
OportClave Oportunidad Count 614 671
578 Proj 578 2 5 16 380 Proj 380 1 262359 Proj 359 2 41 28 392 Proj 392 1 296541 Proj 541 2 45 48 582 Proj 582 1 319561 Proj 561 2 65 41 518 Proj 518 1 330440 Proj 440 2 111 158 512 Proj 512 1 370498 Proj 498 2 174 103 404 Proj 404 1 385382 Proj 382 2 229 171 508 Proj 508 1 406590 Proj 590 2 212 209 523 Proj 523 1 416556 Proj 556 2 287 251 374 Proj 374 1 432422 Proj 422 2 298 254 480 Proj 480 1 438479 Proj 479 2 387 319 464 Proj 464 1 445520 Proj 520 2 407 338 550 Proj 550 1 455530 Proj 530 2 479 430 567 Proj 567 1 462557 Proj 557 1 54 391 Proj 391 1 465563 Proj 563 1 97 528 Proj 528 1 485371 Proj 371 1 114 598 Proj 598 1 485609 Proj 609 1 124 360 Proj 360 1 488446 Proj 446 1 220 455 Proj 455 1 492546 Proj 546 1 245 0
NPV vs Capex - CumCapex
CumCapex
614
671
0
200
400
600
800
1000
1200
1400
1600
1800
© 2003, Stephen M. Rasey, WiserWays, LLCSome Rights ReservedSpotfire San Francisco Users Meeting, Oct. 15, 2003
Slide:35
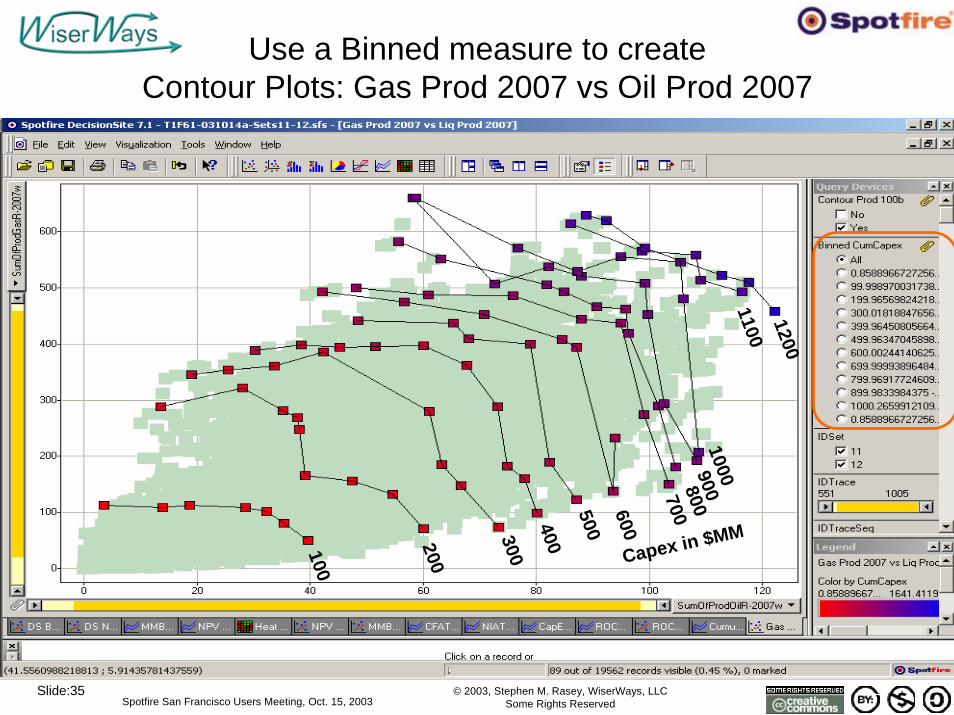
Use a Binned measure to create Contour Plots: Gas Prod 2007 vs Oil Prod 2007
100
200
300400
500600
700800
9001000
11001200
Capex in $MM
© 2003, Stephen M. Rasey, WiserWays, LLCSome Rights ReservedSpotfire San Francisco Users Meeting, Oct. 15, 2003
Slide:36
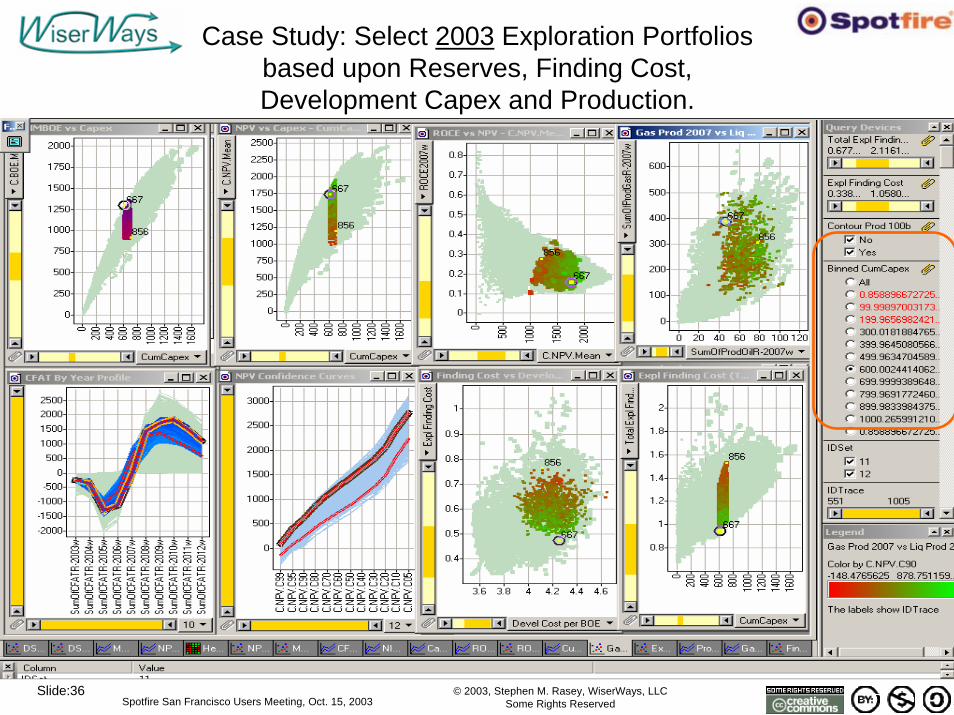
Case Study: Select 2003 Exploration Portfolios based upon Reserves, Finding Cost, Development Capex and Production.
© 2003, Stephen M. Rasey, WiserWays, LLCSome Rights ReservedSpotfire San Francisco Users Meeting, Oct. 15, 2003
Slide:37
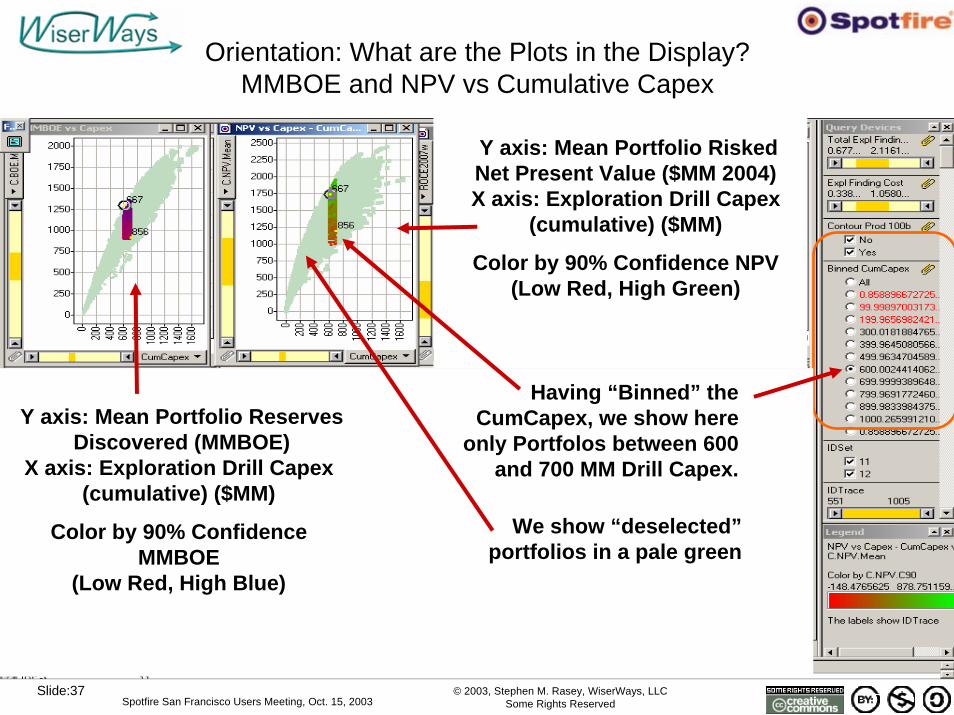
Orientation: What are the Plots in the Display?MMBOE and NPV vs Cumulative Capex
Y axis: Mean Portfolio ReservesDiscovered (MMBOE)
X axis: Exploration Drill Capex(cumulative) ($MM)
Color by 90% Confidence MMBOE
(Low Red, High Blue)
Y axis: Mean Portfolio Risked Net Present Value ($MM 2004)X axis: Exploration Drill Capex
(cumulative) ($MM)
Color by 90% Confidence NPV(Low Red, High Green)
Having “Binned” the CumCapex, we show here
only Portfolos between 600 and 700 MM Drill Capex.
We show “deselected”portfolios in a pale green
© 2003, Stephen M. Rasey, WiserWays, LLCSome Rights ReservedSpotfire San Francisco Users Meeting, Oct. 15, 2003
Slide:38
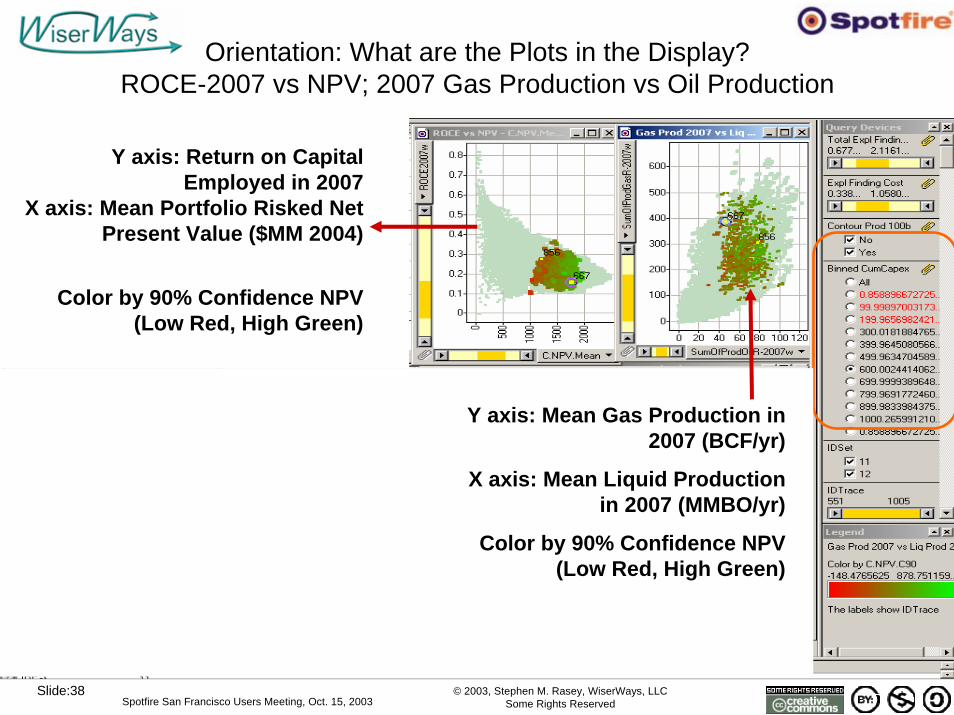
Orientation: What are the Plots in the Display? ROCE-2007 vs NPV; 2007 Gas Production vs Oil Production
Y axis: Mean Gas Production in 2007 (BCF/yr)
X axis: Mean Liquid Production in 2007 (MMBO/yr)
Color by 90% Confidence NPV (Low Red, High Green)
Y axis: Return on Capital Employed in 2007
X axis: Mean Portfolio Risked Net Present Value ($MM 2004)
Color by 90% Confidence NPV(Low Red, High Green)
© 2003, Stephen M. Rasey, WiserWays, LLCSome Rights ReservedSpotfire San Francisco Users Meeting, Oct. 15, 2003
Slide:39
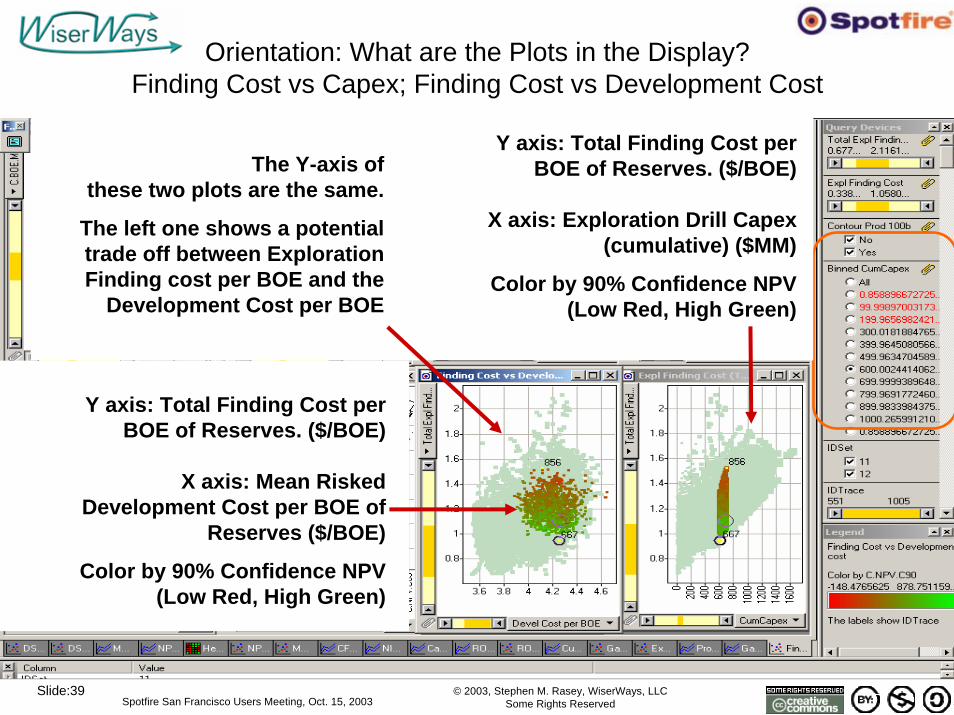
Orientation: What are the Plots in the Display? Finding Cost vs Capex; Finding Cost vs Development Cost
Y axis: Total Finding Cost per BOE of Reserves. ($/BOE)
X axis: Mean Risked Development Cost per BOE of
Reserves ($/BOE)
Color by 90% Confidence NPV (Low Red, High Green)
Y axis: Total Finding Cost per BOE of Reserves. ($/BOE)
X axis: Exploration Drill Capex(cumulative) ($MM)
Color by 90% Confidence NPV(Low Red, High Green)
The Y-axis ofthese two plots are the same.
The left one shows a potential trade off between Exploration Finding cost per BOE and the
Development Cost per BOE
© 2003, Stephen M. Rasey, WiserWays, LLCSome Rights ReservedSpotfire San Francisco Users Meeting, Oct. 15, 2003
Slide:40
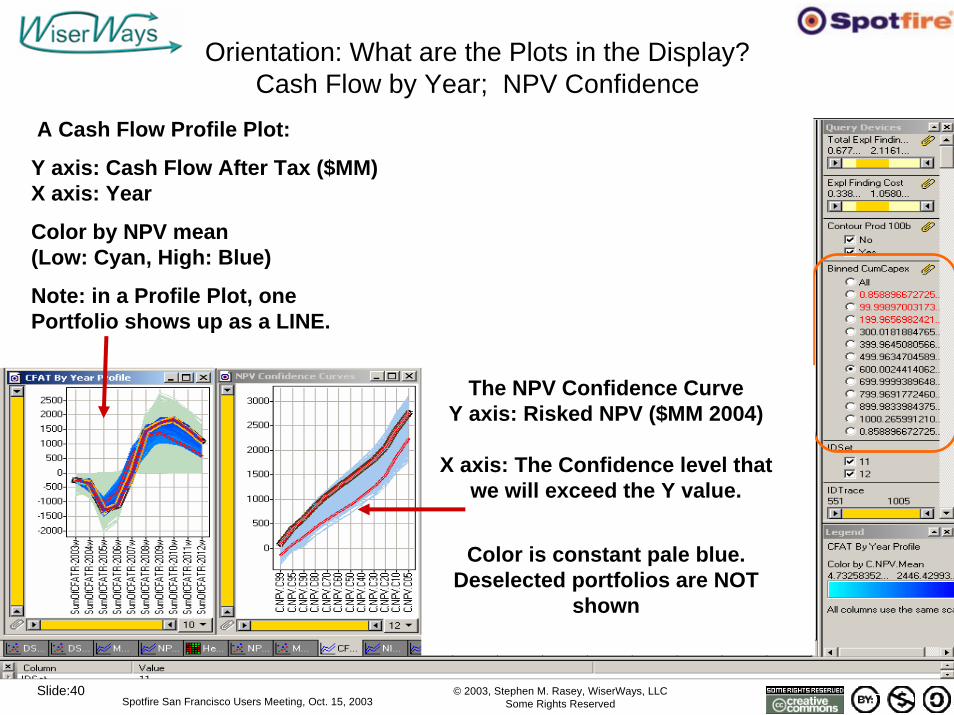
Orientation: What are the Plots in the Display? Cash Flow by Year; NPV Confidence
The NPV Confidence Curve Y axis: Risked NPV ($MM 2004)
X axis: The Confidence level that we will exceed the Y value.
Color is constant pale blue. Deselected portfolios are NOT
shown
A Cash Flow Profile Plot:
Y axis: Cash Flow After Tax ($MM)X axis: Year
Color by NPV mean (Low: Cyan, High: Blue)
Note: in a Profile Plot, one Portfolio shows up as a LINE.
© 2003, Stephen M. Rasey, WiserWays, LLCSome Rights ReservedSpotfire San Francisco Users Meeting, Oct. 15, 2003
Slide:41
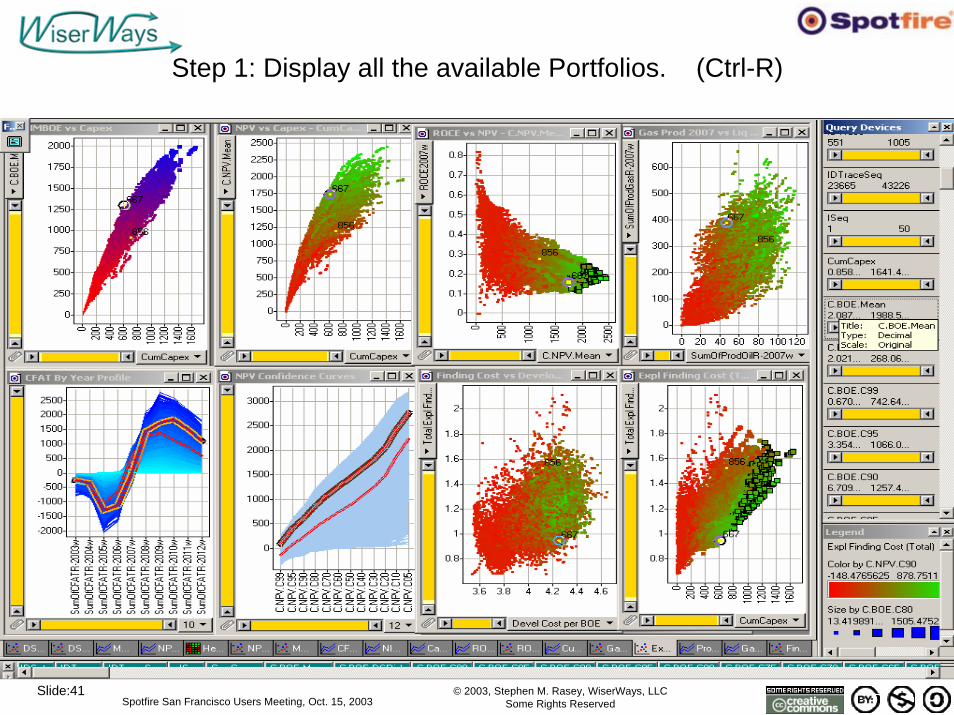
Step 1: Display all the available Portfolios. (Ctrl-R)
© 2003, Stephen M. Rasey, WiserWays, LLCSome Rights ReservedSpotfire San Francisco Users Meeting, Oct. 15, 2003
Slide:42
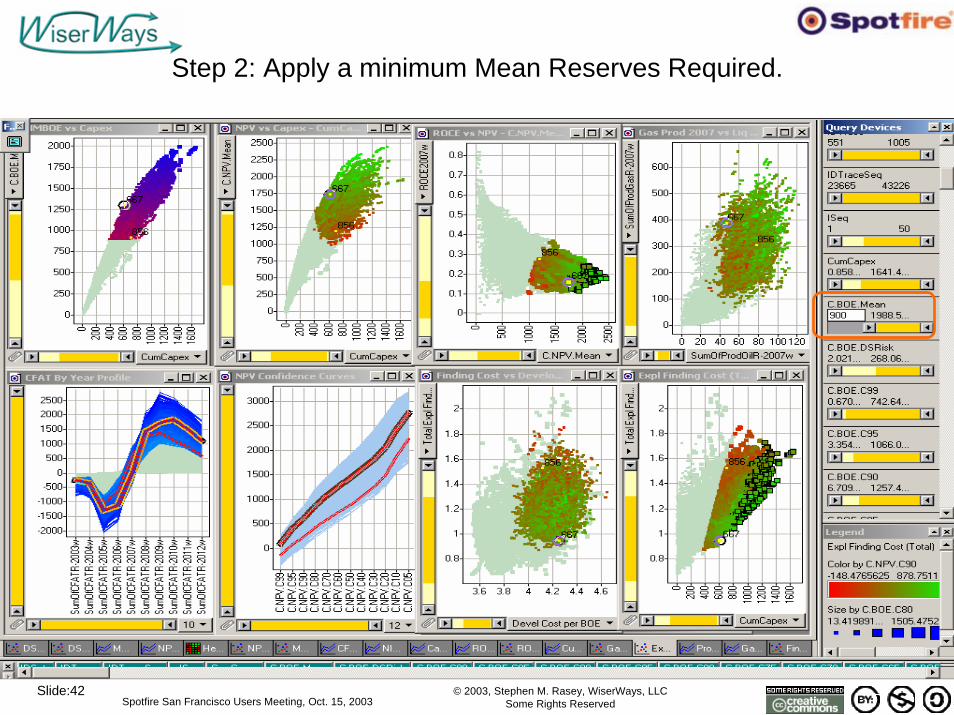
Step 2: Apply a minimum Mean Reserves Required.
© 2003, Stephen M. Rasey, WiserWays, LLCSome Rights ReservedSpotfire San Francisco Users Meeting, Oct. 15, 2003
Slide:43
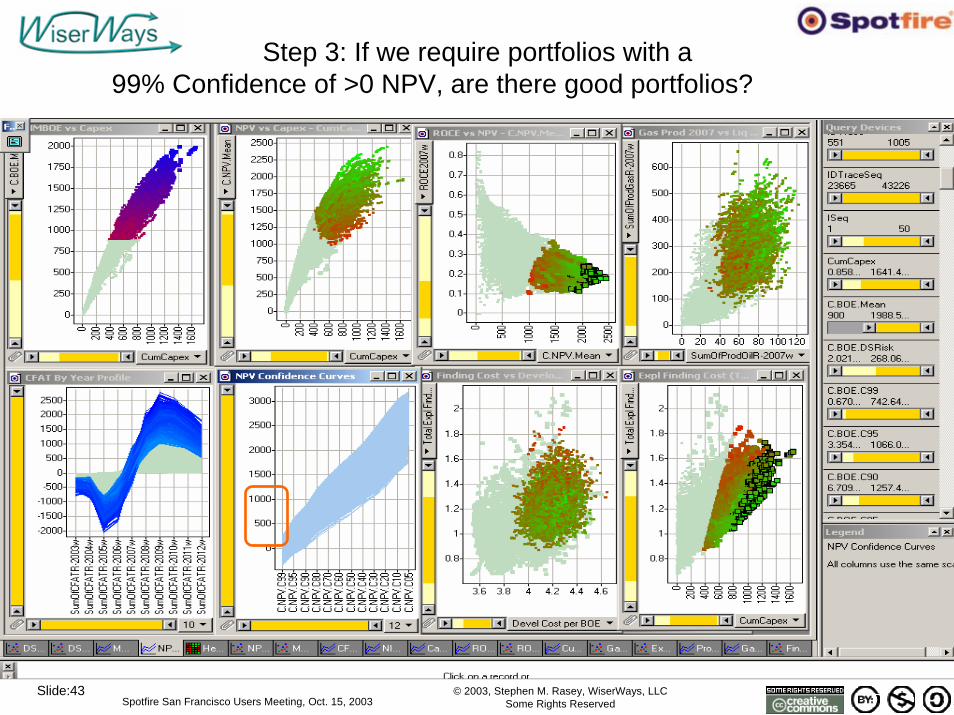
Step 3: If we require portfolios with a 99% Confidence of >0 NPV, are there good portfolios? YES.
© 2003, Stephen M. Rasey, WiserWays, LLCSome Rights ReservedSpotfire San Francisco Users Meeting, Oct. 15, 2003
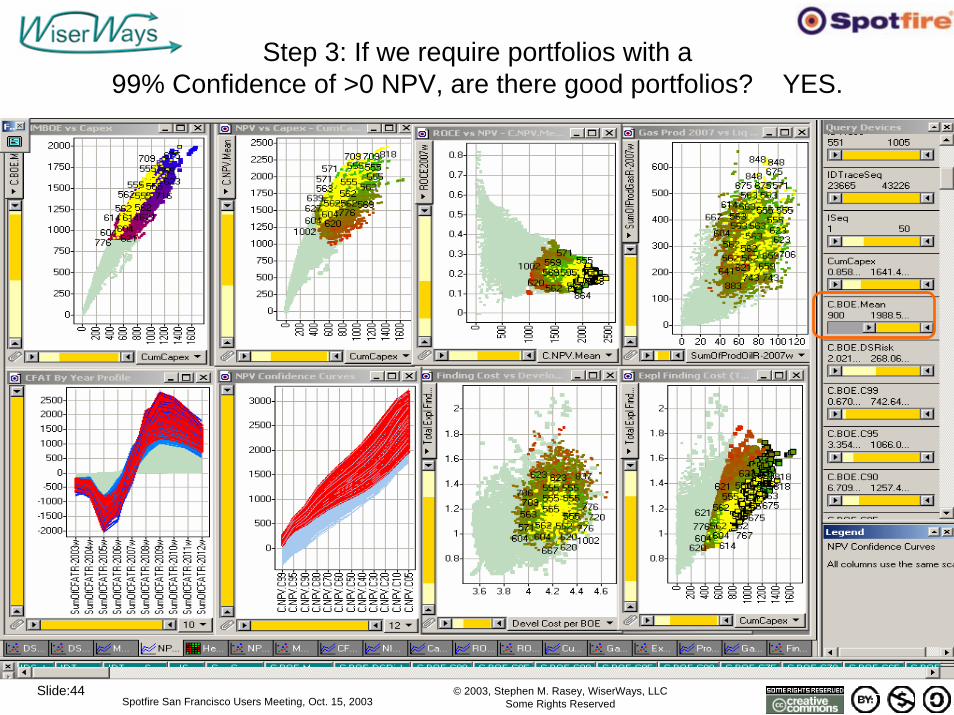
Slide:44
Step 3: If we require portfolios with a 99% Confidence of >0 NPV, are there good portfolios? YES.
© 2003, Stephen M. Rasey, WiserWays, LLCSome Rights ReservedSpotfire San Francisco Users Meeting, Oct. 15, 2003
Slide:45
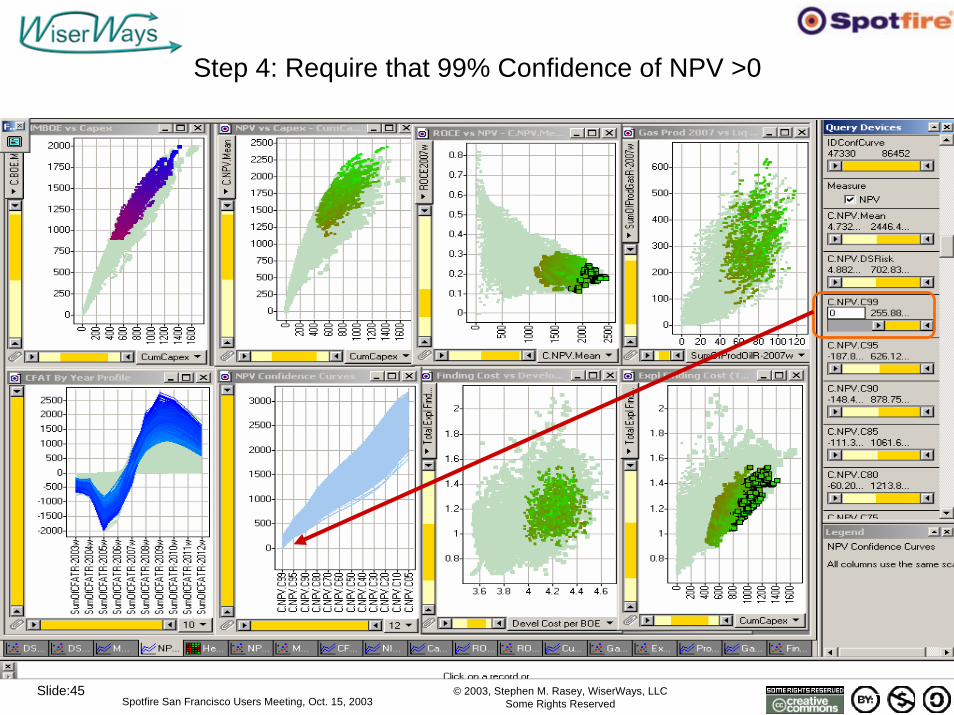
Step 4: Require that 99% Confidence of NPV >0
© 2003, Stephen M. Rasey, WiserWays, LLCSome Rights ReservedSpotfire San Francisco Users Meeting, Oct. 15, 2003
Slide:46
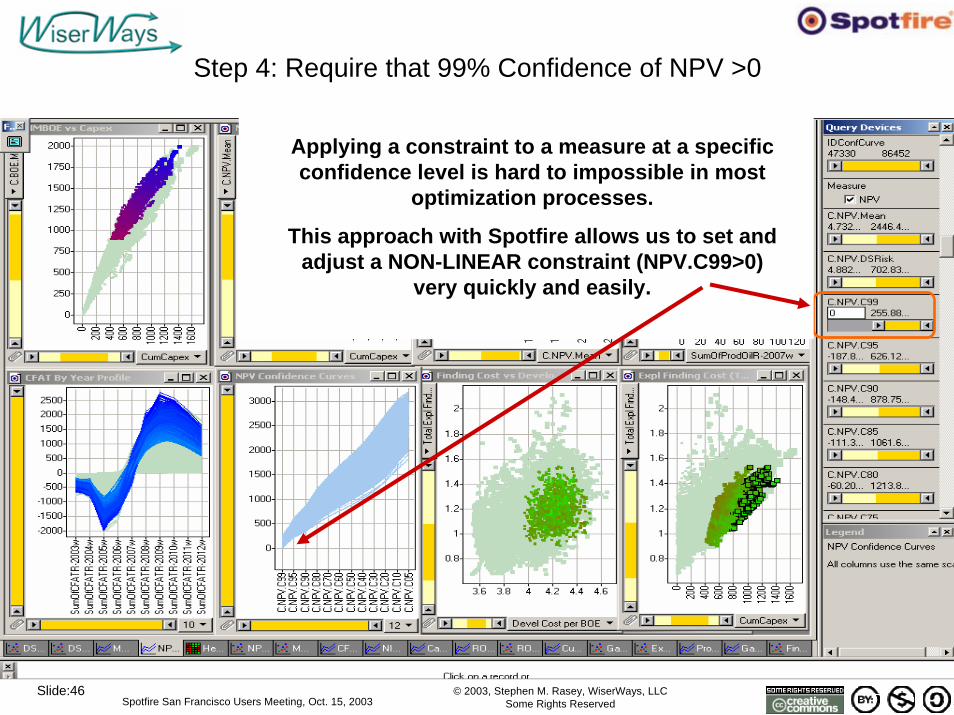
Step 4: Require that 99% Confidence of NPV >0
Applying a constraint to a measure at a specific confidence level is hard to impossible in most
optimization processes.
This approach with Spotfire allows us to set and adjust a NON-LINEAR constraint (NPV.C99>0)
very quickly and easily.
© 2003, Stephen M. Rasey, WiserWays, LLCSome Rights ReservedSpotfire San Francisco Users Meeting, Oct. 15, 2003
Slide:47
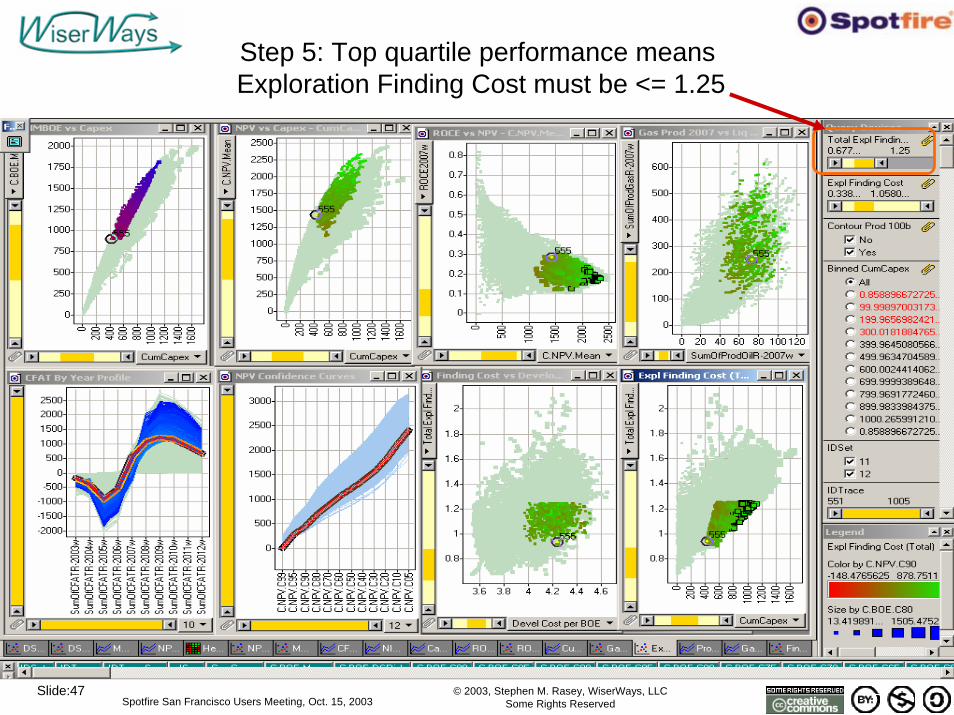
Step 5: Top quartile performance means Exploration Finding Cost must be <= 1.25
© 2003, Stephen M. Rasey, WiserWays, LLCSome Rights ReservedSpotfire San Francisco Users Meeting, Oct. 15, 2003
Slide:48
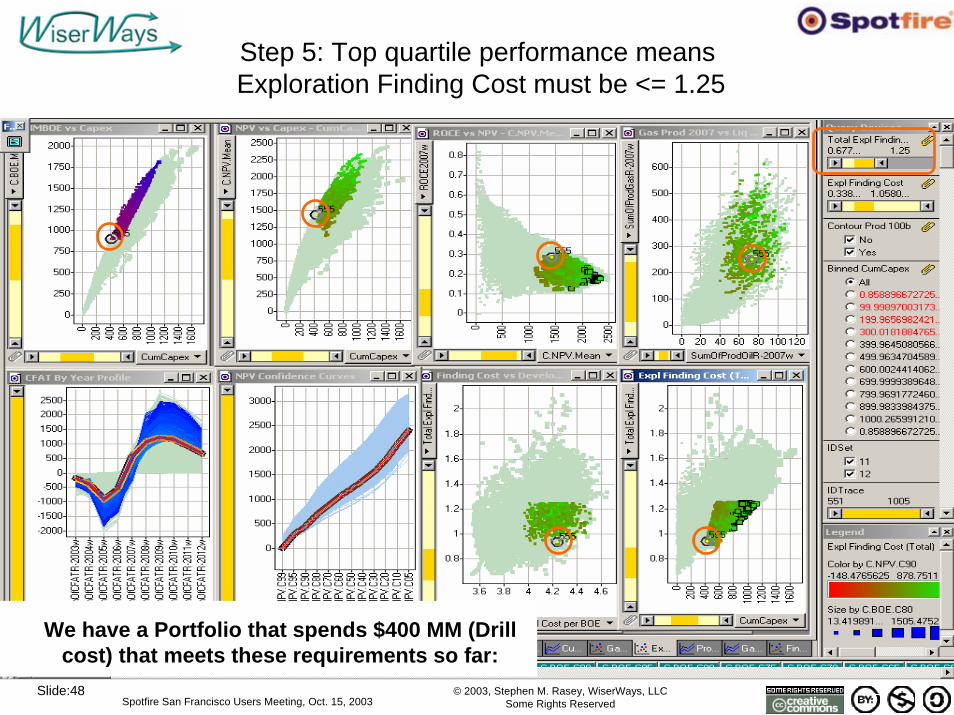
Step 5: Top quartile performance means Exploration Finding Cost must be <= 1.25
We have a Portfolio that spends $400 MM (Drill cost) that meets these requirements so far:
© 2003, Stephen M. Rasey, WiserWays, LLCSome Rights ReservedSpotfire San Francisco Users Meeting, Oct. 15, 2003
Slide:49
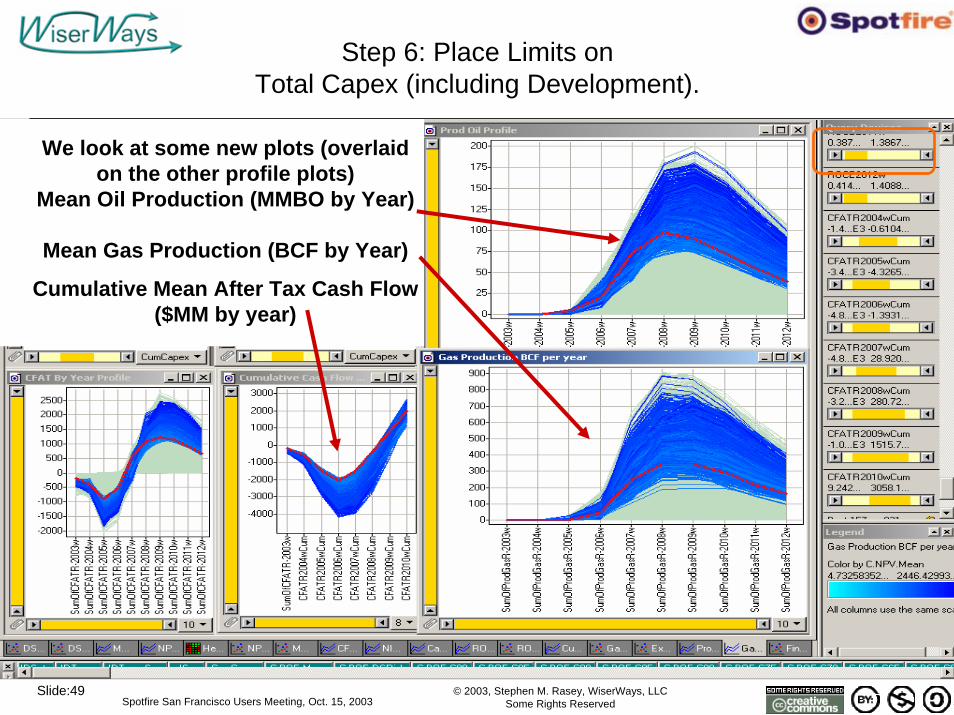
Step 6: Place Limits on Total Capex (including Development).
We look at some new plots (overlaid on the other profile plots)
Mean Oil Production (MMBO by Year)
Mean Gas Production (BCF by Year)
Cumulative Mean After Tax Cash Flow ($MM by year)
© 2003, Stephen M. Rasey, WiserWays, LLCSome Rights ReservedSpotfire San Francisco Users Meeting, Oct. 15, 2003
Slide:50
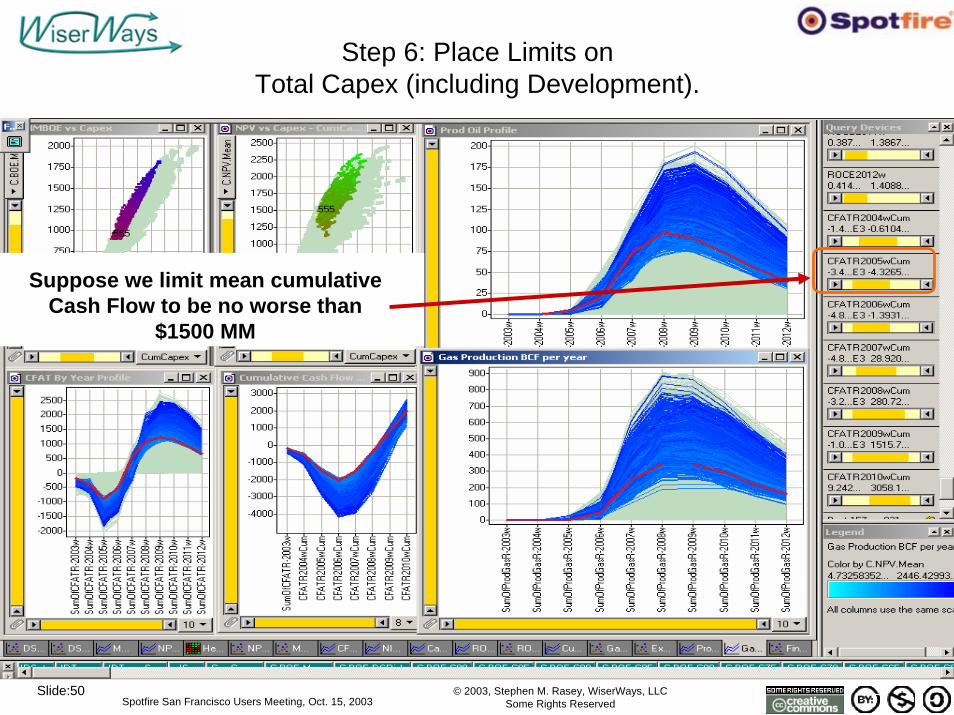
Step 6: Place Limits on Total Capex (including Development).
Suppose we limit mean cumulative Cash Flow to be no worse than
$1500 MM
© 2003, Stephen M. Rasey, WiserWays, LLCSome Rights ReservedSpotfire San Francisco Users Meeting, Oct. 15, 2003
Slide:51
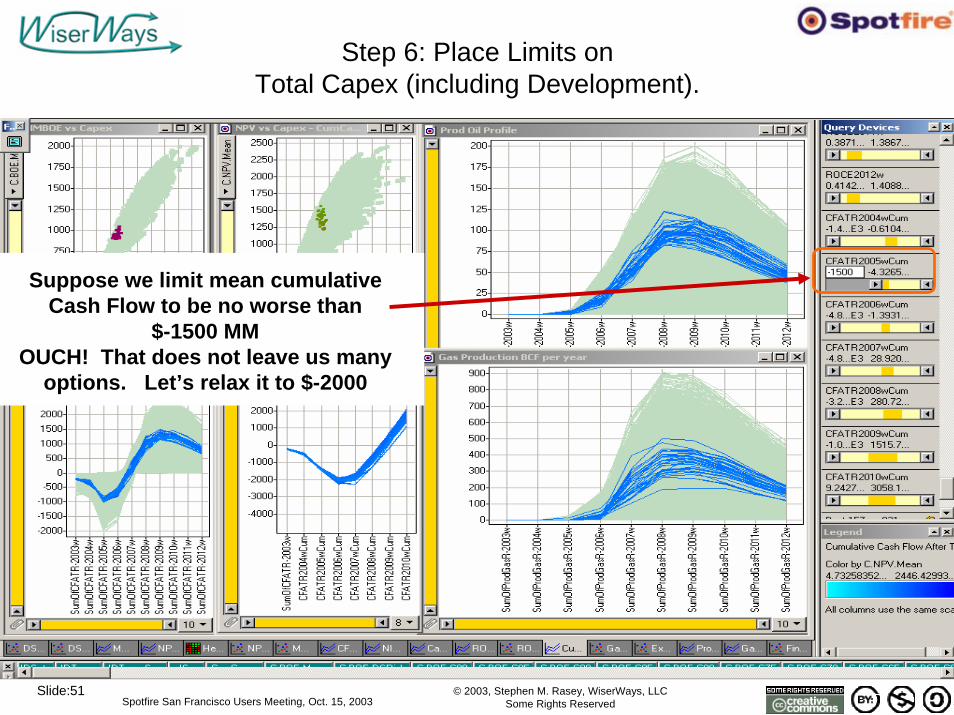
Step 6: Place Limits on Total Capex (including Development).
Suppose we limit mean cumulative Cash Flow to be no worse than
$-1500 MMOUCH! That does not leave us many
options. Let’s relax it to $-2000
© 2003, Stephen M. Rasey, WiserWays, LLCSome Rights ReservedSpotfire San Francisco Users Meeting, Oct. 15, 2003
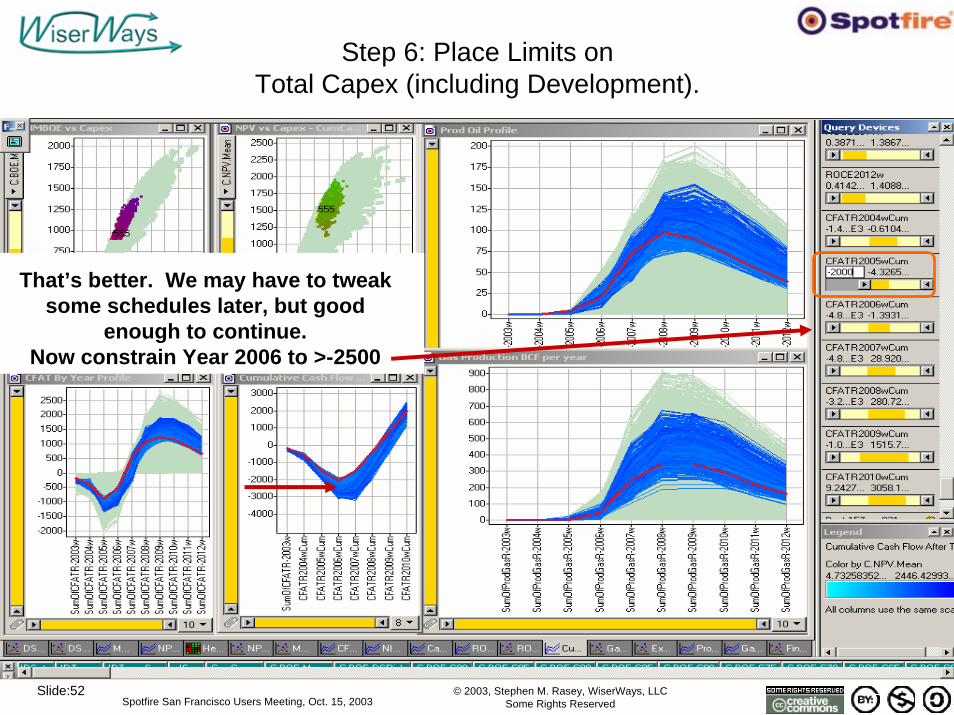
Slide:52
Step 6: Place Limits on Total Capex (including Development).
That’s better. We may have to tweak some schedules later, but good
enough to continue.Now constrain Year 2006 to >-2500
© 2003, Stephen M. Rasey, WiserWays, LLCSome Rights ReservedSpotfire San Francisco Users Meeting, Oct. 15, 2003
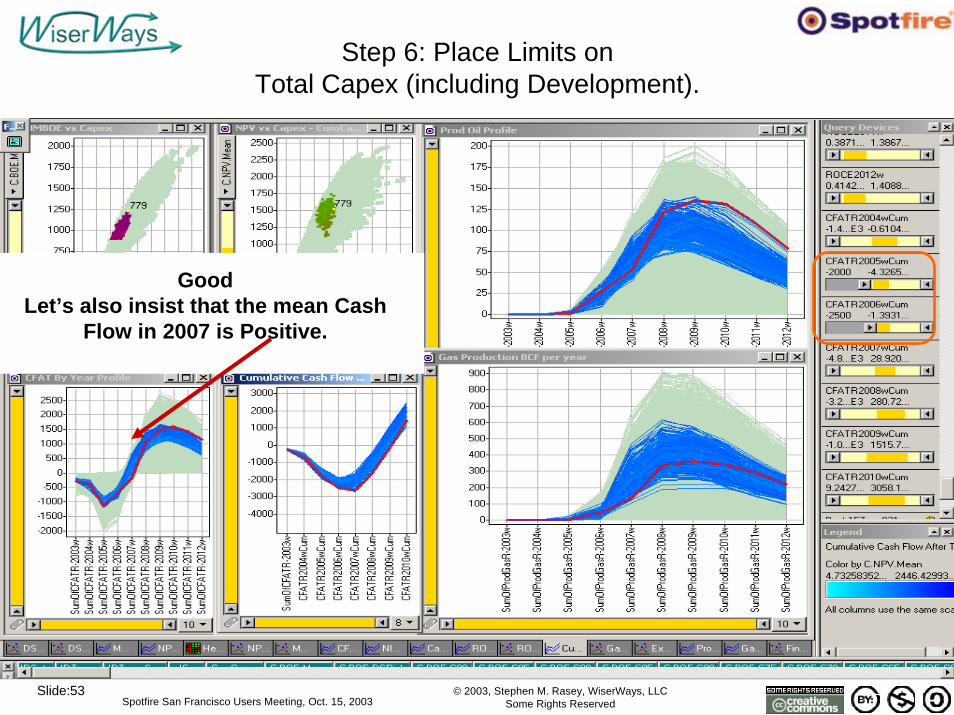
Slide:53
Step 6: Place Limits on Total Capex (including Development).
GoodLet’s also insist that the mean Cash
Flow in 2007 is Positive.
© 2003, Stephen M. Rasey, WiserWays, LLCSome Rights ReservedSpotfire San Francisco Users Meeting, Oct. 15, 2003
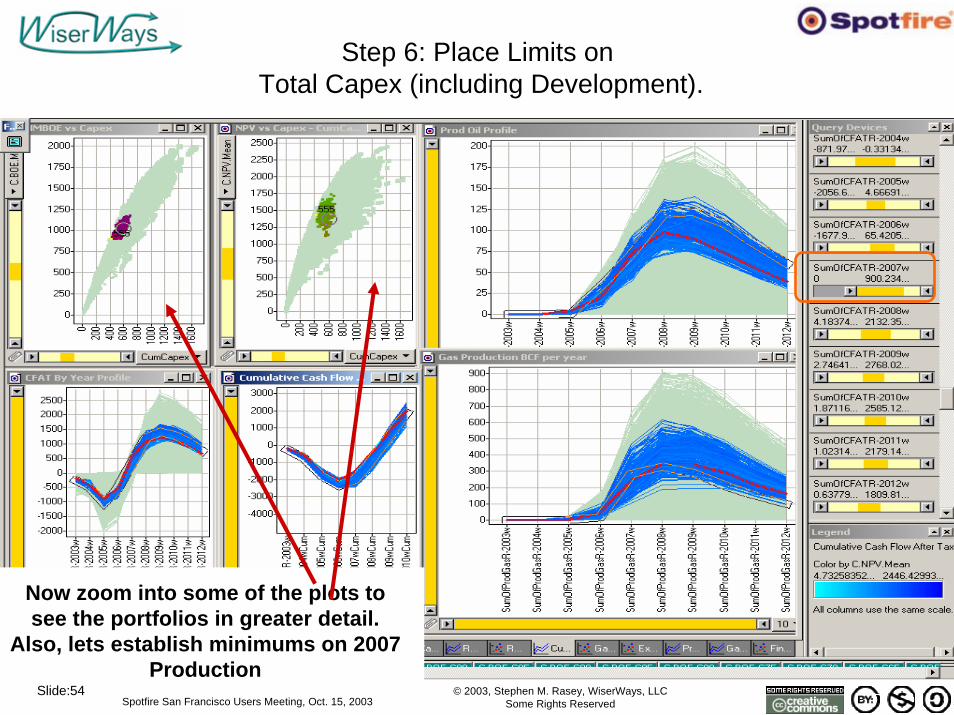
Slide:54
Step 6: Place Limits on Total Capex (including Development).
Now zoom into some of the plots to see the portfolios in greater detail.
Also, lets establish minimums on 2007 Production
© 2003, Stephen M. Rasey, WiserWays, LLCSome Rights ReservedSpotfire San Francisco Users Meeting, Oct. 15, 2003
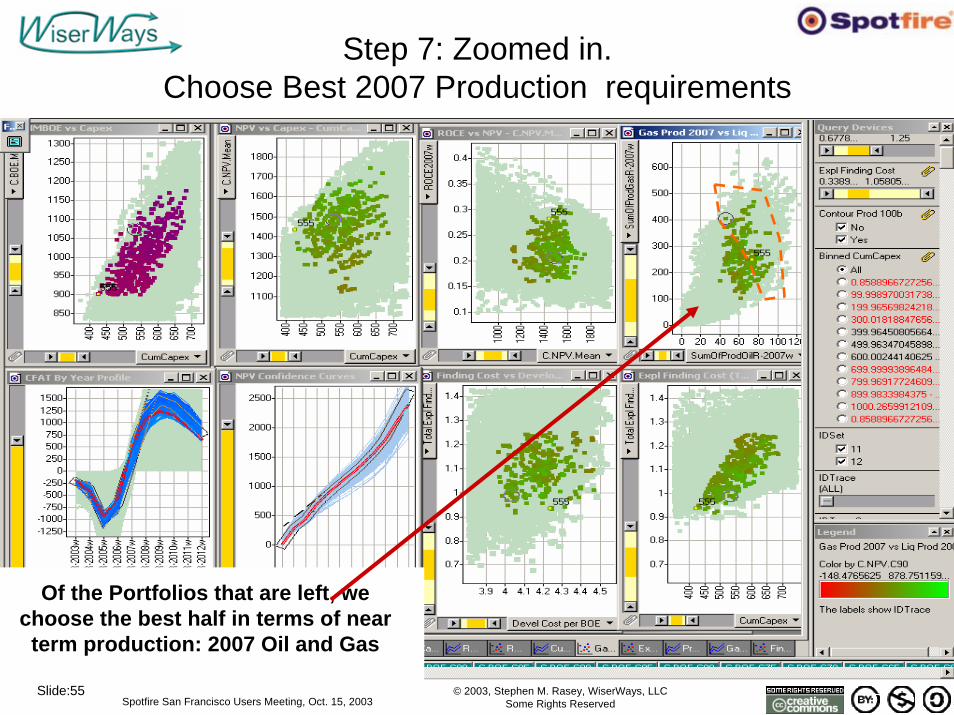
Slide:55
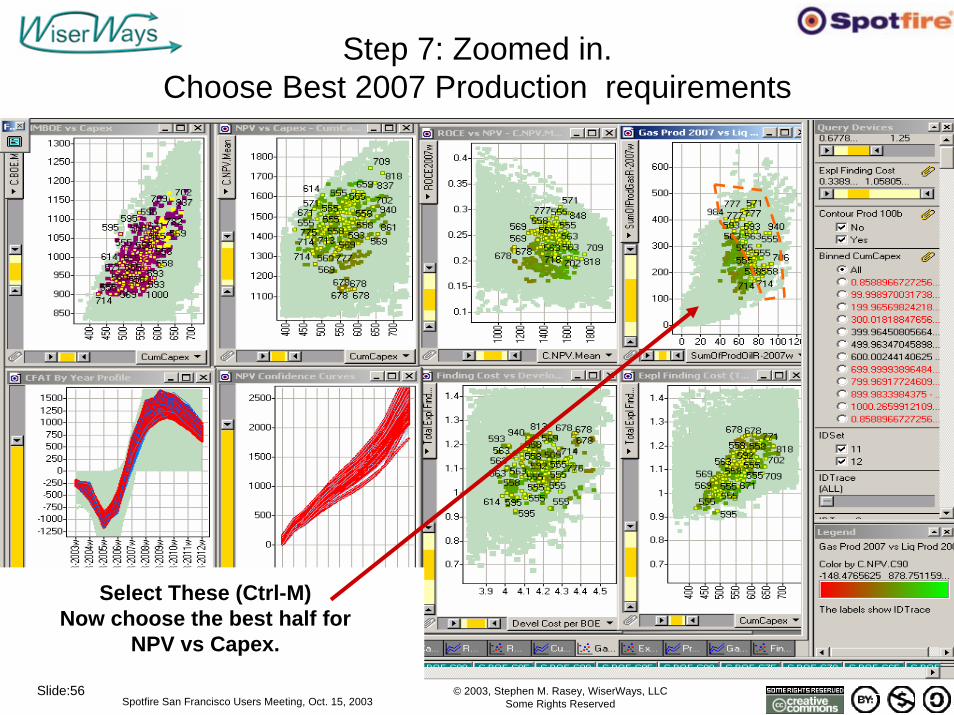
Step 7: Zoomed in. Choose Best 2007 Production requirements
Of the Portfolios that are left, we choose the best half in terms of near term production: 2007 Oil and Gas
© 2003, Stephen M. Rasey, WiserWays, LLCSome Rights ReservedSpotfire San Francisco Users Meeting, Oct. 15, 2003
Slide:56
Step 7: Zoomed in. Choose Best 2007 Production requirements
Select These (Ctrl-M)Now choose the best half for
NPV vs Capex.
© 2003, Stephen M. Rasey, WiserWays, LLCSome Rights ReservedSpotfire San Francisco Users Meeting, Oct. 15, 2003
Slide:57
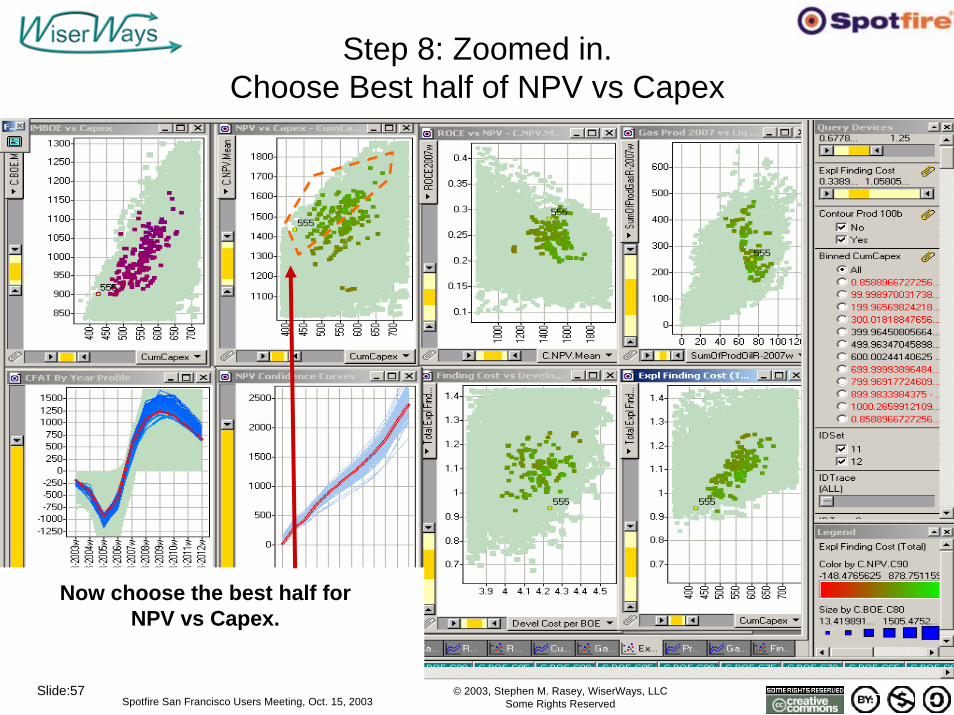
Step 8: Zoomed in. Choose Best half of NPV vs Capex
Now choose the best half for NPV vs Capex.
© 2003, Stephen M. Rasey, WiserWays, LLCSome Rights ReservedSpotfire San Francisco Users Meeting, Oct. 15, 2003
Slide:58
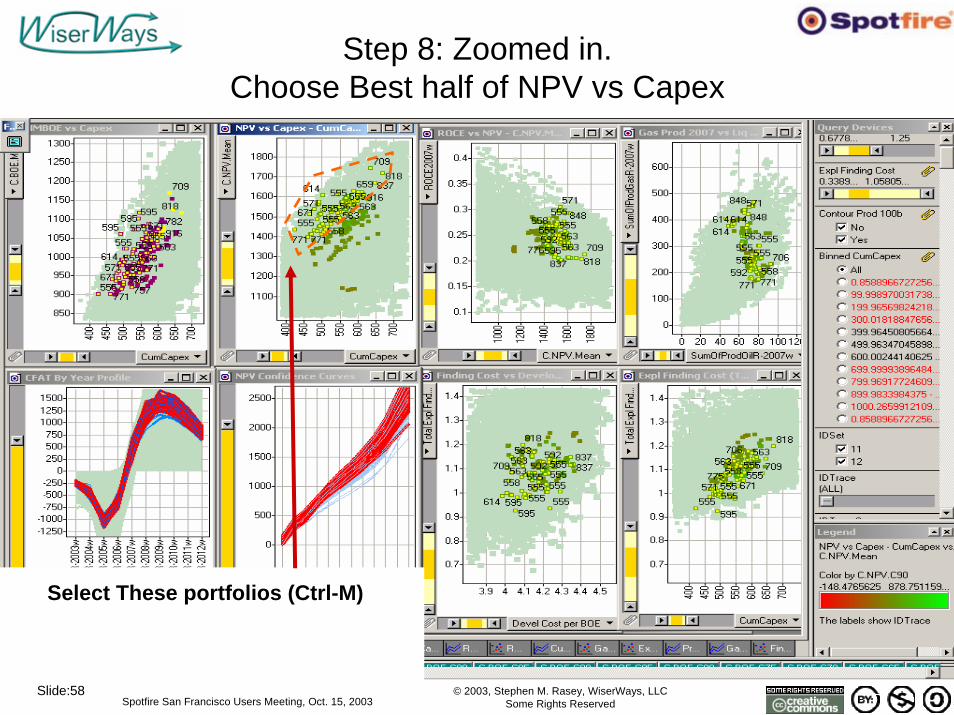
Step 8: Zoomed in. Choose Best half of NPV vs Capex
Select These portfolios (Ctrl-M)
© 2003, Stephen M. Rasey, WiserWays, LLCSome Rights ReservedSpotfire San Francisco Users Meeting, Oct. 15, 2003
Slide:59
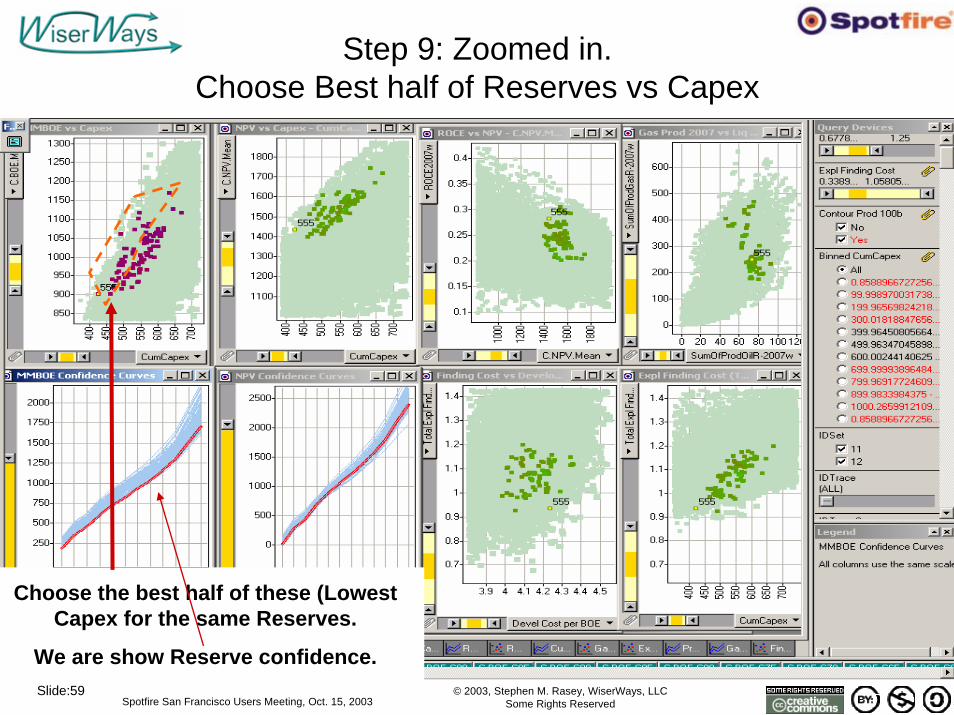
Step 9: Zoomed in. Choose Best half of Reserves vs Capex
Choose the best half of these (Lowest Capex for the same Reserves.
We are show Reserve confidence.
© 2003, Stephen M. Rasey, WiserWays, LLCSome Rights ReservedSpotfire San Francisco Users Meeting, Oct. 15, 2003
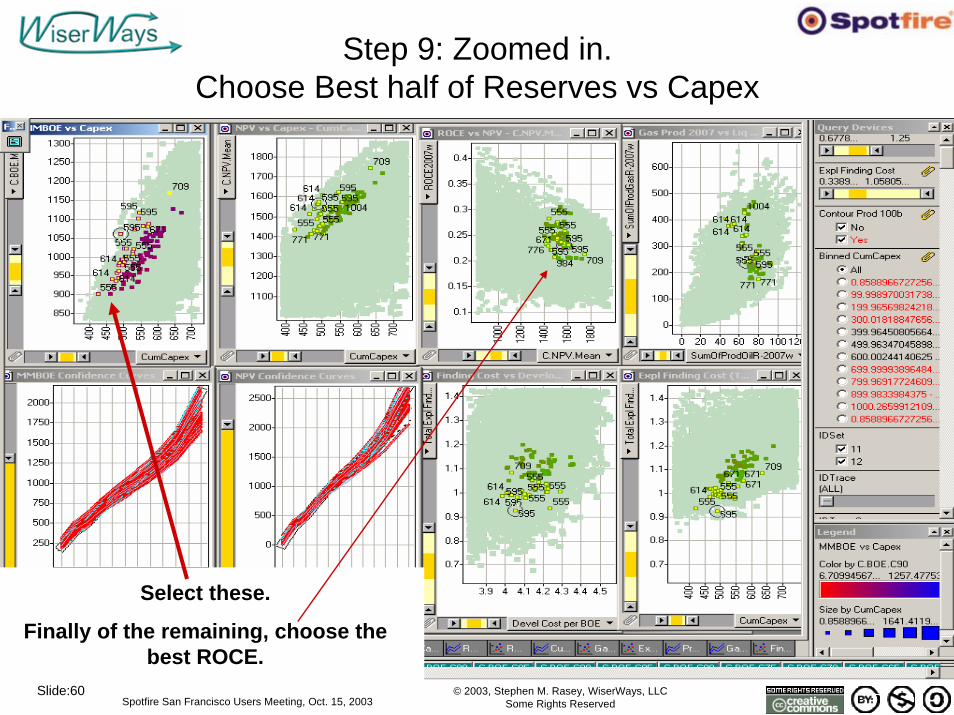
Slide:60
Step 9: Zoomed in. Choose Best half of Reserves vs Capex
Select these.
Finally of the remaining, choose the best ROCE.
© 2003, Stephen M. Rasey, WiserWays, LLCSome Rights ReservedSpotfire San Francisco Users Meeting, Oct. 15, 2003
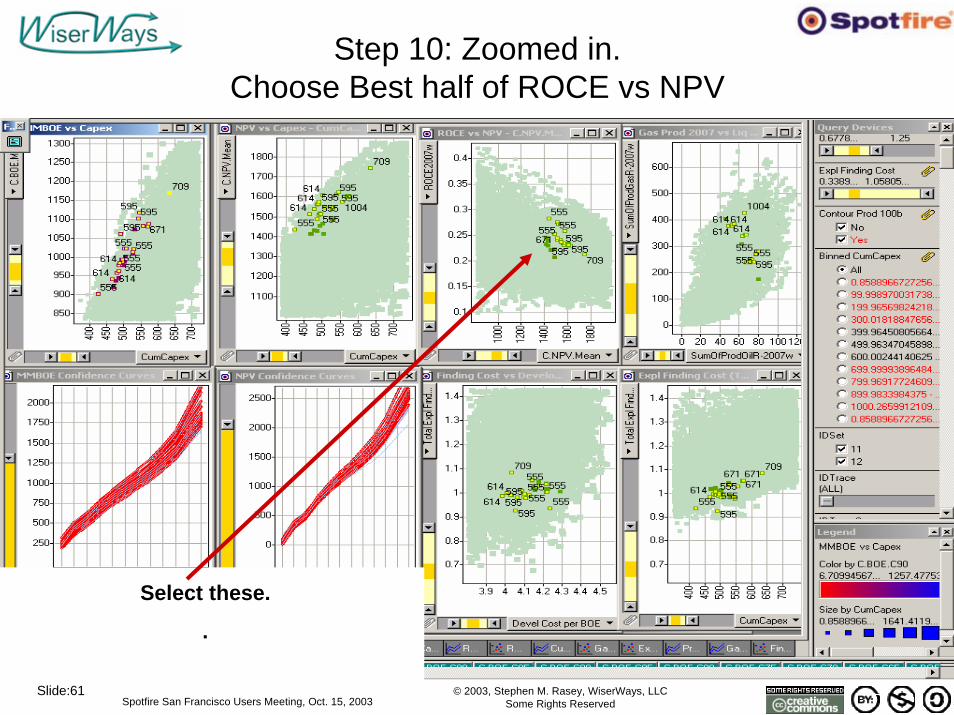
Slide:61
Step 10: Zoomed in. Choose Best half of ROCE vs NPV
Select these.
.
© 2003, Stephen M. Rasey, WiserWays, LLCSome Rights ReservedSpotfire San Francisco Users Meeting, Oct. 15, 2003
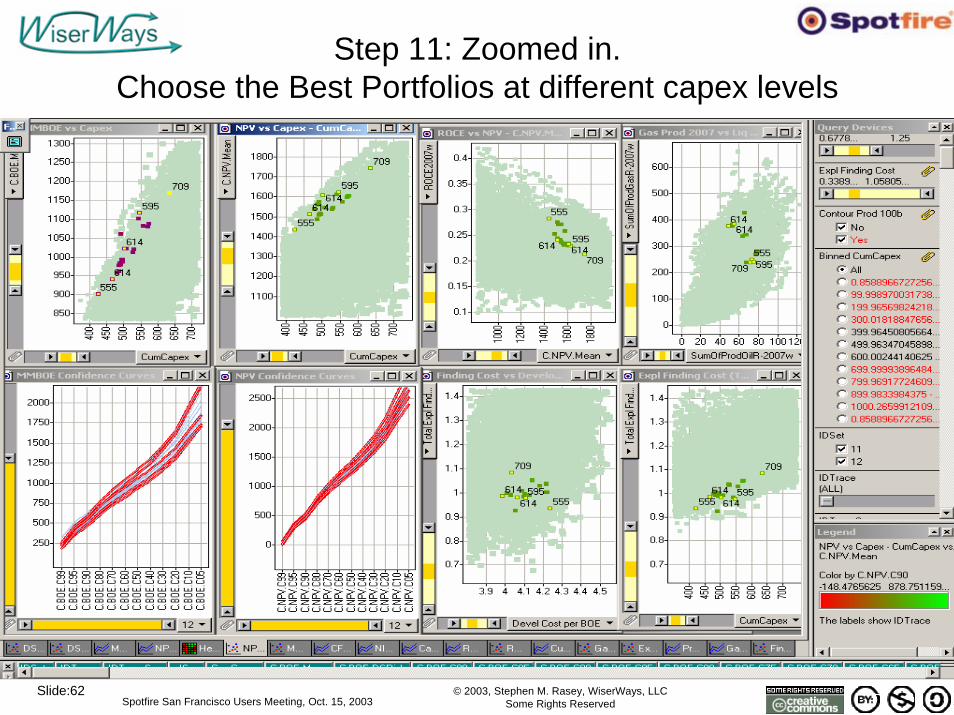
Slide:62
Step 11: Zoomed in. Choose the Best Portfolios at different capex levels
© 2003, Stephen M. Rasey, WiserWays, LLCSome Rights ReservedSpotfire San Francisco Users Meeting, Oct. 15, 2003
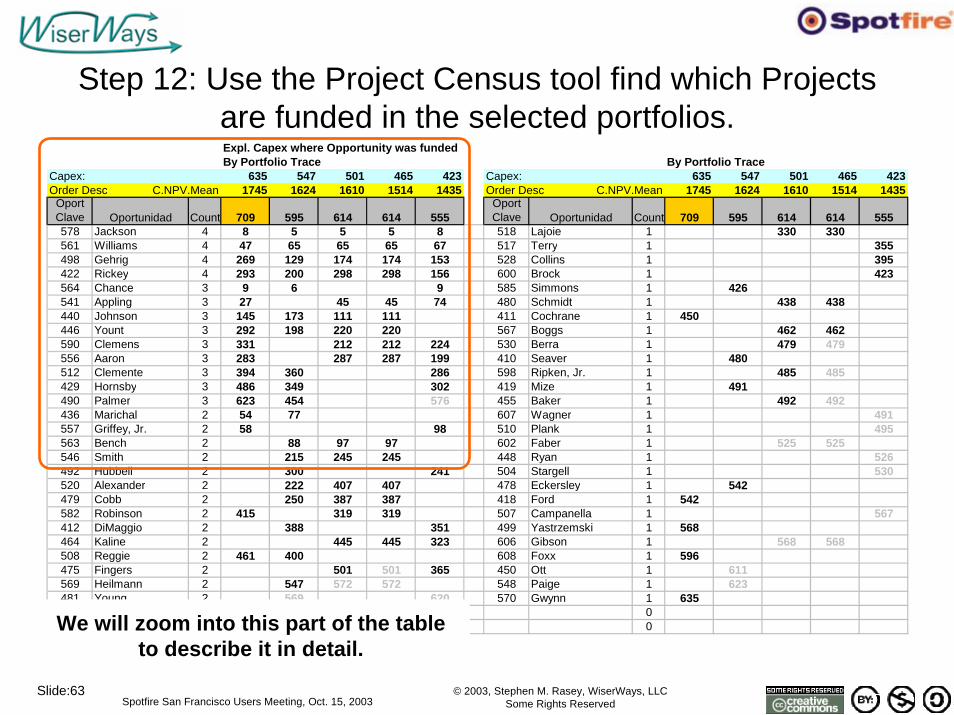
Slide:63
Step 12: Use the Project Census tool find which Projects are funded in the selected portfolios.Expl. Capex where Opportunity was fundedBy Portfolio Trace By Portfolio Trace
Capex: 635 547 501 465 423 Capex: 635 547 501 465 423Order Desc C.NPV.Mean 1745 1624 1610 1514 1435 Order Desc C.NPV.Mean 1745 1624 1610 1514 1435
OportClave Oportunidad Count 709 595 614 614 555
OportClave Oportunidad Count 709 595 614 614 555
578 Jackson 4 8 5 5 5 8 518 Lajoie 1 330 330561 Williams 4 47 65 65 65 67 517 Terry 1 355498 Gehrig 4 269 129 174 174 153 528 Collins 1 395422 Rickey 4 293 200 298 298 156 600 Brock 1 423564 Chance 3 9 6 9 585 Simmons 1 426541 Appling 3 27 45 45 74 480 Schmidt 1 438 438440 Johnson 3 145 173 111 111 411 Cochrane 1 450446 Yount 3 292 198 220 220 567 Boggs 1 462 462590 Clemens 3 331 212 212 224 530 Berra 1 479 479556 Aaron 3 283 287 287 199 410 Seaver 1 480512 Clemente 3 394 360 286 598 Ripken, Jr. 1 485 485429 Hornsby 3 486 349 302 419 Mize 1 491490 Palmer 3 623 454 576 455 Baker 1 492 492436 Marichal 2 54 77 607 Wagner 1 491557 Griffey, Jr. 2 58 98 510 Plank 1 495563 Bench 2 88 97 97 602 Faber 1 525 525546 Smith 2 215 245 245 448 Ryan 1 526492 Hubbell 2 300 241 504 Stargell 1 530520 Alexander 2 222 407 407 478 Eckersley 1 542479 Cobb 2 250 387 387 418 Ford 1 542582 Robinson 2 415 319 319 507 Campanella 1 567412 DiMaggio 2 388 351 499 Yastrzemski 1 568464 Kaline 2 445 445 323 606 Gibson 1 568 568508 Reggie 2 461 400 608 Foxx 1 596475 Fingers 2 501 501 365 450 Ott 1 611569 Heilmann 2 547 572 572 548 Paige 1 623481 Young 2 569 620 570 Gwynn 1 635601 Waner 1 231 0571 Dickey 1 258 0We will zoom into this part of the table
to describe it in detail.
© 2003, Stephen M. Rasey, WiserWays, LLCSome Rights ReservedSpotfire San Francisco Users Meeting, Oct. 15, 2003
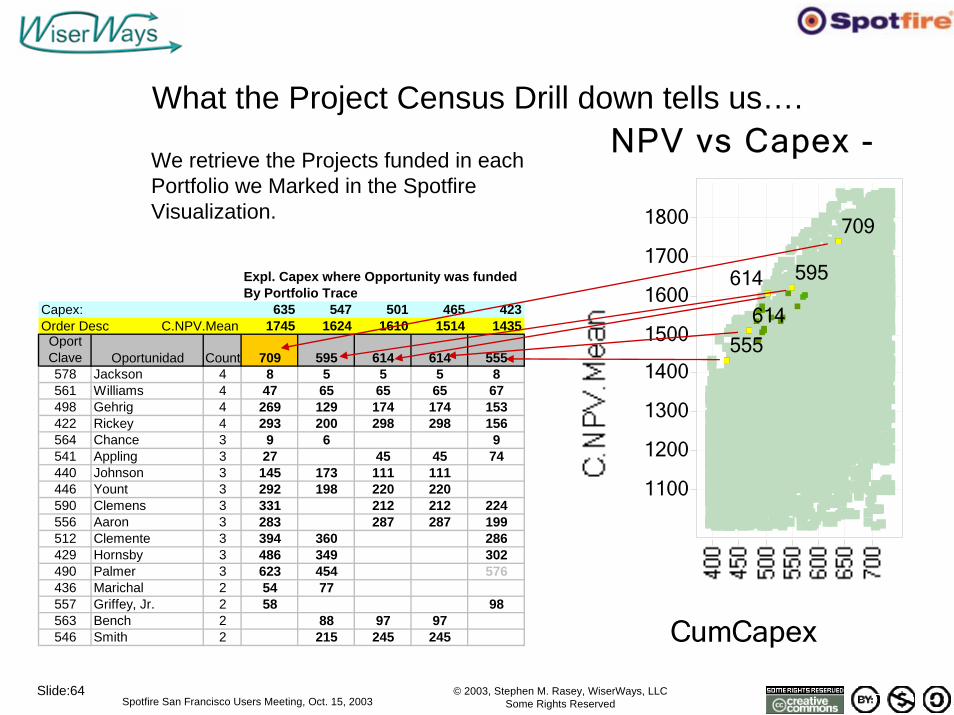
Slide:64
NPV vs Capex -
CumCapex
555
595
614
614
709
1100
1200
1300
1400
1500
1600
1700
1800
What the Project Census Drill down tells us….
Expl. Capex where Opportunity was fundedBy Portfolio Trace
Capex: 635 547 501 465 423Order Desc C.NPV.Mean 1745 1624 1610 1514 1435
OportClave Oportunidad Count 709 595 614 614 555578 Jackson 4 8 5 5 5 8561 Williams 4 47 65 65 65 67498 Gehrig 4 269 129 174 174 153422 Rickey 4 293 200 298 298 156564 Chance 3 9 6 9541 Appling 3 27 45 45 74440 Johnson 3 145 173 111 111446 Yount 3 292 198 220 220590 Clemens 3 331 212 212 224556 Aaron 3 283 287 287 199512 Clemente 3 394 360 286429 Hornsby 3 486 349 302490 Palmer 3 623 454 576436 Marichal 2 54 77557 Griffey, Jr. 2 58 98563 Bench 2 88 97 97546 Smith 2 215 245 245
We retrieve the Projects funded in each Portfolio we Marked in the Spotfire Visualization.
© 2003, Stephen M. Rasey, WiserWays, LLCSome Rights ReservedSpotfire San Francisco Users Meeting, Oct. 15, 2003
Slide:65
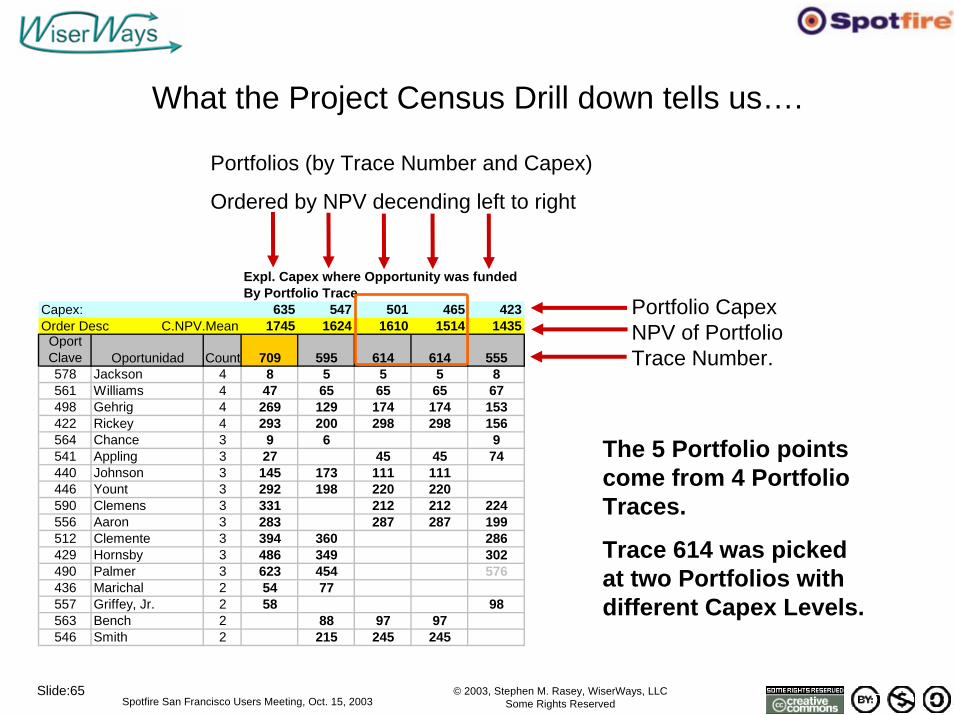
What the Project Census Drill down tells us….
Expl. Capex where Opportunity was fundedBy Portfolio Trace
Capex: 635 547 501 465 423Order Desc C.NPV.Mean 1745 1624 1610 1514 1435
OportClave Oportunidad Count 709 595 614 614 555578 Jackson 4 8 5 5 5 8561 Williams 4 47 65 65 65 67498 Gehrig 4 269 129 174 174 153422 Rickey 4 293 200 298 298 156564 Chance 3 9 6 9541 Appling 3 27 45 45 74440 Johnson 3 145 173 111 111446 Yount 3 292 198 220 220590 Clemens 3 331 212 212 224556 Aaron 3 283 287 287 199512 Clemente 3 394 360 286429 Hornsby 3 486 349 302490 Palmer 3 623 454 576436 Marichal 2 54 77557 Griffey, Jr. 2 58 98563 Bench 2 88 97 97546 Smith 2 215 245 245
The 5 Portfolio points come from 4 Portfolio Traces.
Trace 614 was picked at two Portfolios with different Capex Levels.
Portfolio CapexNPV of Portfolio Trace Number.
Portfolios (by Trace Number and Capex)
Ordered by NPV decending left to right
© 2003, Stephen M. Rasey, WiserWays, LLCSome Rights ReservedSpotfire San Francisco Users Meeting, Oct. 15, 2003
Slide:66
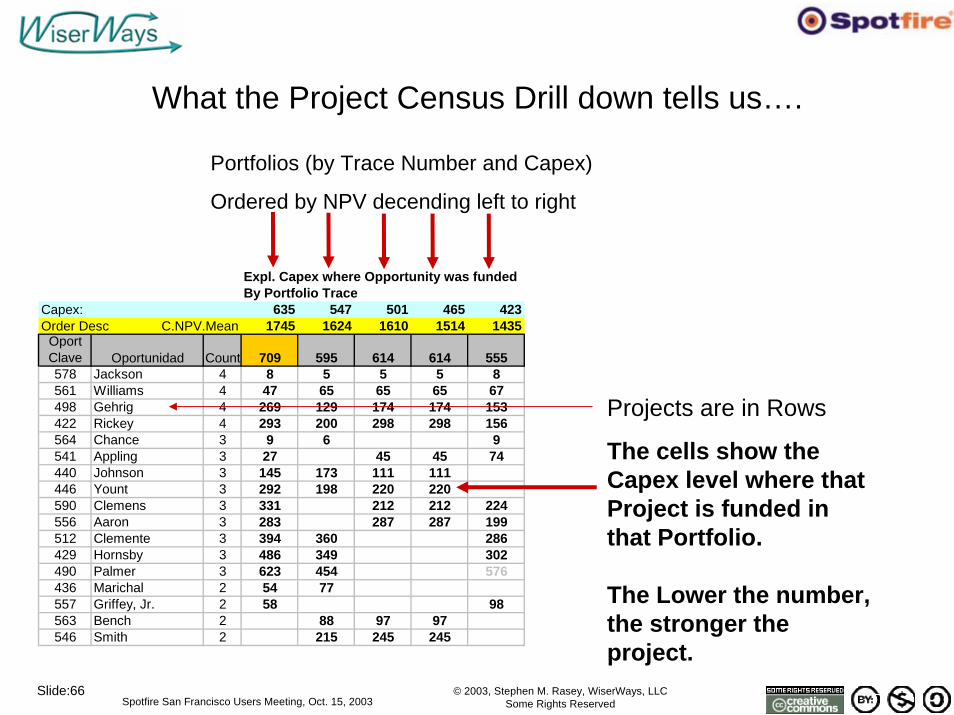
What the Project Census Drill down tells us….
Expl. Capex where Opportunity was fundedBy Portfolio Trace
Capex: 635 547 501 465 423Order Desc C.NPV.Mean 1745 1624 1610 1514 1435
OportClave Oportunidad Count 709 595 614 614 555578 Jackson 4 8 5 5 5 8561 Williams 4 47 65 65 65 67498 Gehrig 4 269 129 174 174 153422 Rickey 4 293 200 298 298 156564 Chance 3 9 6 9541 Appling 3 27 45 45 74440 Johnson 3 145 173 111 111446 Yount 3 292 198 220 220590 Clemens 3 331 212 212 224556 Aaron 3 283 287 287 199512 Clemente 3 394 360 286429 Hornsby 3 486 349 302490 Palmer 3 623 454 576436 Marichal 2 54 77557 Griffey, Jr. 2 58 98563 Bench 2 88 97 97546 Smith 2 215 245 245
Projects are in Rows
The cells show the Capex level where that Project is funded in that Portfolio.
The Lower the number, the stronger the project.
Portfolios (by Trace Number and Capex)
Ordered by NPV decending left to right
© 2003, Stephen M. Rasey, WiserWays, LLCSome Rights ReservedSpotfire San Francisco Users Meeting, Oct. 15, 2003
Slide:67
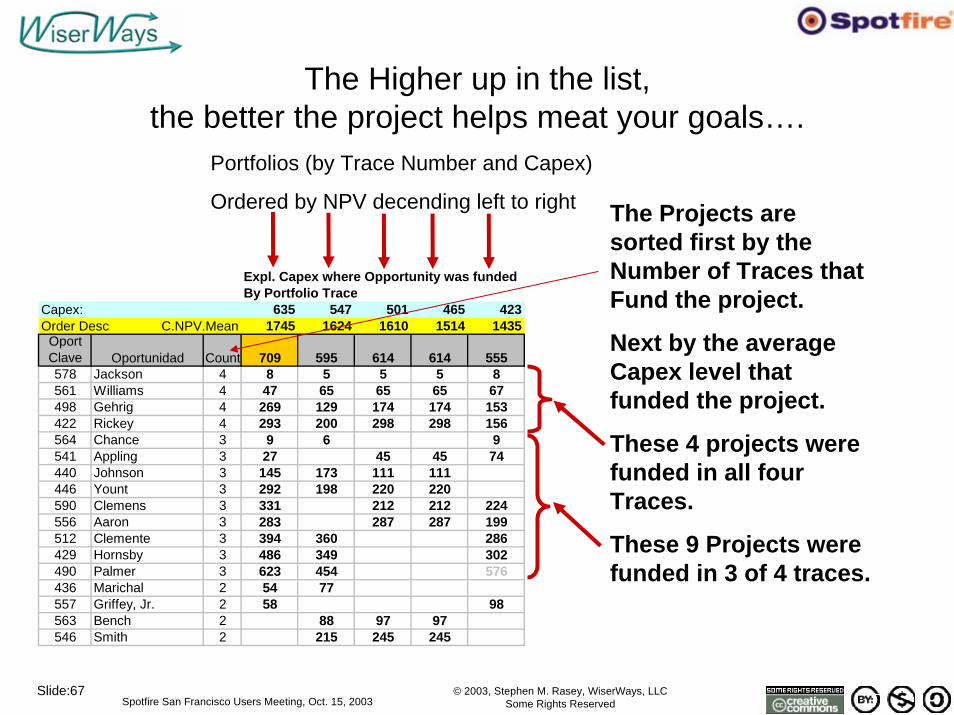
The Higher up in the list, the better the project helps meat your goals….
Expl. Capex where Opportunity was fundedBy Portfolio Trace
Capex: 635 547 501 465 423Order Desc C.NPV.Mean 1745 1624 1610 1514 1435
OportClave Oportunidad Count 709 595 614 614 555578 Jackson 4 8 5 5 5 8561 Williams 4 47 65 65 65 67498 Gehrig 4 269 129 174 174 153422 Rickey 4 293 200 298 298 156564 Chance 3 9 6 9541 Appling 3 27 45 45 74440 Johnson 3 145 173 111 111446 Yount 3 292 198 220 220590 Clemens 3 331 212 212 224556 Aaron 3 283 287 287 199512 Clemente 3 394 360 286429 Hornsby 3 486 349 302490 Palmer 3 623 454 576436 Marichal 2 54 77557 Griffey, Jr. 2 58 98563 Bench 2 88 97 97546 Smith 2 215 245 245
The Projects are sorted first by the Number of Traces that Fund the project.
Next by the average Capex level that funded the project.
These 4 projects were funded in all four Traces.
These 9 Projects were funded in 3 of 4 traces.
Portfolios (by Trace Number and Capex)
Ordered by NPV decending left to right
© 2003, Stephen M. Rasey, WiserWays, LLCSome Rights ReservedSpotfire San Francisco Users Meeting, Oct. 15, 2003
Slide:68
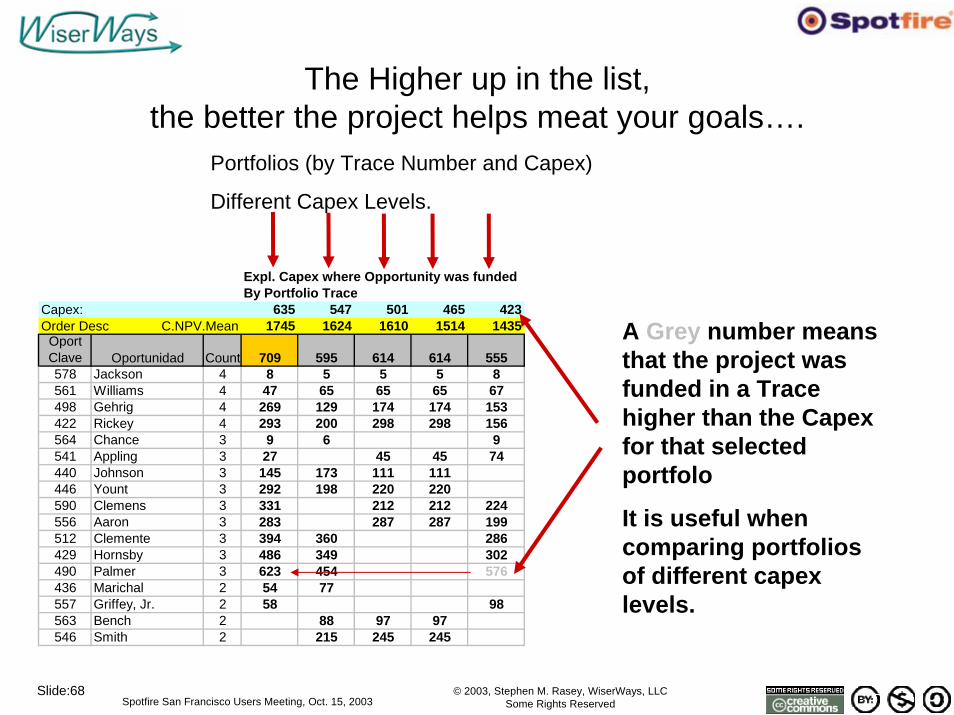
The Higher up in the list, the better the project helps meat your goals….
Expl. Capex where Opportunity was fundedBy Portfolio Trace
Capex: 635 547 501 465 423Order Desc C.NPV.Mean 1745 1624 1610 1514 1435
OportClave Oportunidad Count 709 595 614 614 555578 Jackson 4 8 5 5 5 8561 Williams 4 47 65 65 65 67498 Gehrig 4 269 129 174 174 153422 Rickey 4 293 200 298 298 156564 Chance 3 9 6 9541 Appling 3 27 45 45 74440 Johnson 3 145 173 111 111446 Yount 3 292 198 220 220590 Clemens 3 331 212 212 224556 Aaron 3 283 287 287 199512 Clemente 3 394 360 286429 Hornsby 3 486 349 302490 Palmer 3 623 454 576436 Marichal 2 54 77557 Griffey, Jr. 2 58 98563 Bench 2 88 97 97546 Smith 2 215 245 245
A Grey number means that the project was funded in a Trace higher than the Capexfor that selected portfolo
It is useful when comparing portfolios of different capexlevels.
Portfolios (by Trace Number and Capex)
Different Capex Levels.
© 2003, Stephen M. Rasey, WiserWays, LLCSome Rights ReservedSpotfire San Francisco Users Meeting, Oct. 15, 2003
Slide:69
Spotfire Sheds Light on a Complicated Problem
• Woolsey’s 1st Law– “A Manager would rather live with a problem he
cannot solve than accept a solution he does not understand.”
• Woolsey’s 2nd Law– “A Manager does not want, and will not pay for, an
OPTIMUM solution. He wants to be better off now, as quickly and as cheaply as possible.
*Dr. R. E. D. Woolsey, Professor of OR/MS, Colorado School of MinesWoolsey & Swanson, Operations Research for Immediate Applications, Harper & Row, 1974.
© 2003, Stephen M. Rasey, WiserWays, LLCSome Rights ReservedSpotfire San Francisco Users Meeting, Oct. 15, 2003
Slide:70
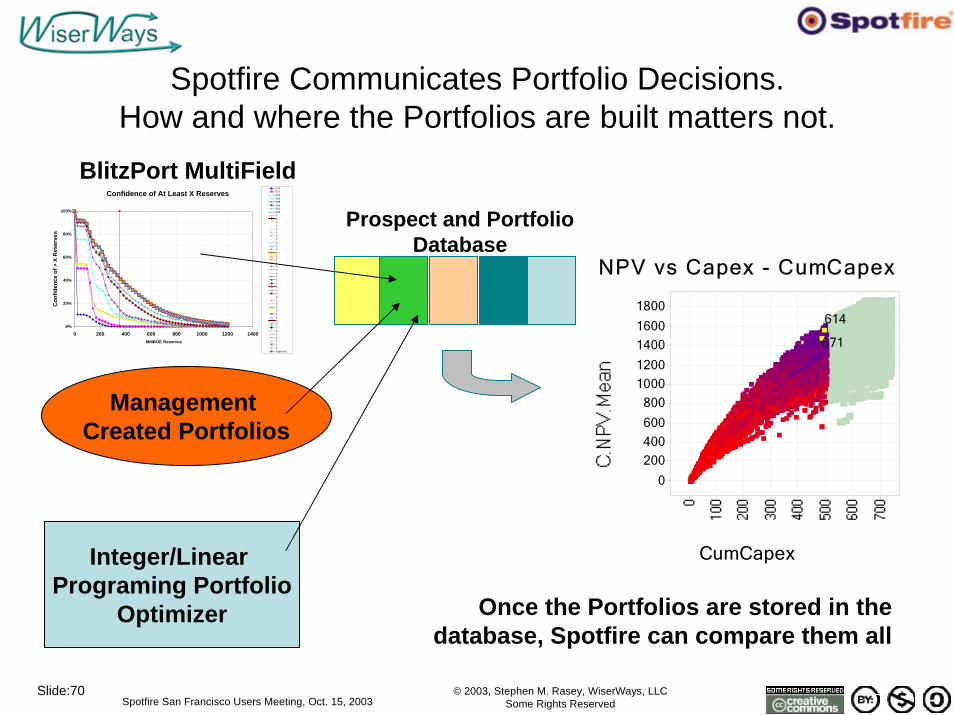
Spotfire Communicates Portfolio Decisions. How and where the Portfolios are built matters not.
NPV vs Capex - CumCapex
CumCapex
614
671
0
200
400
600
800
1000
1200
1400
1600
1800
Confidence of At Least X Reserves
0%
20%
40%
60%
80%
100%
0 200 400 600 800 1000 1200 1400MMBOE Reserves
Con
fiden
ce o
f > X
Res
erve
s
3733713703693683663653640000000000000000000000000000000000000000Expected
Prospect and Portfolio Database
Integer/Linear Programing Portfolio
Optimizer
Management Created Portfolios
BlitzPort MultiField
Once the Portfolios are stored in the database, Spotfire can compare them all
© 2003, Stephen M. Rasey, WiserWays, LLCSome Rights ReservedSpotfire San Francisco Users Meeting, Oct. 15, 2003
Slide:71
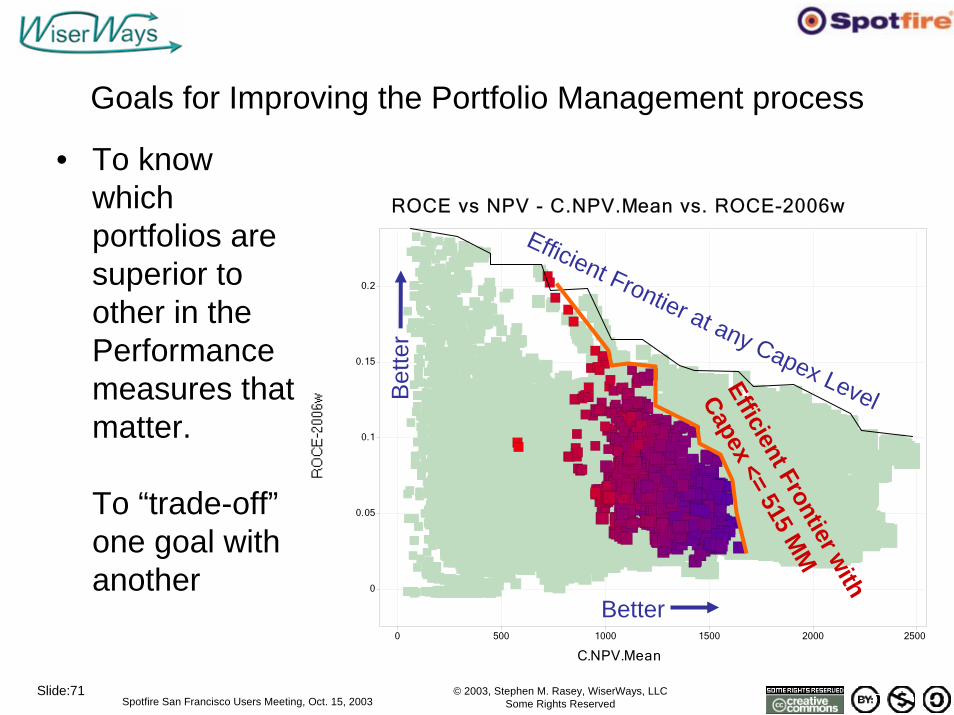
Goals for Improving the Portfolio Management process
• To know which portfolios are superior to other in the Performance measures that matter.
To “trade-off”one goal with another
ROCE vs NPV - C.NPV.Mean vs. ROCE-2006w
C.NPV.Mean
0 500 1000 1500 2000 2500
0
0.05
0.1
0.15
0.2
Better
Bet
ter
Efficient Frontier at any Capex Level
Efficient Frontier with
Capex<= 515 M
M
© 2003, Stephen M. Rasey, WiserWays, LLCSome Rights ReservedSpotfire San Francisco Users Meeting, Oct. 15, 2003
Slide:72
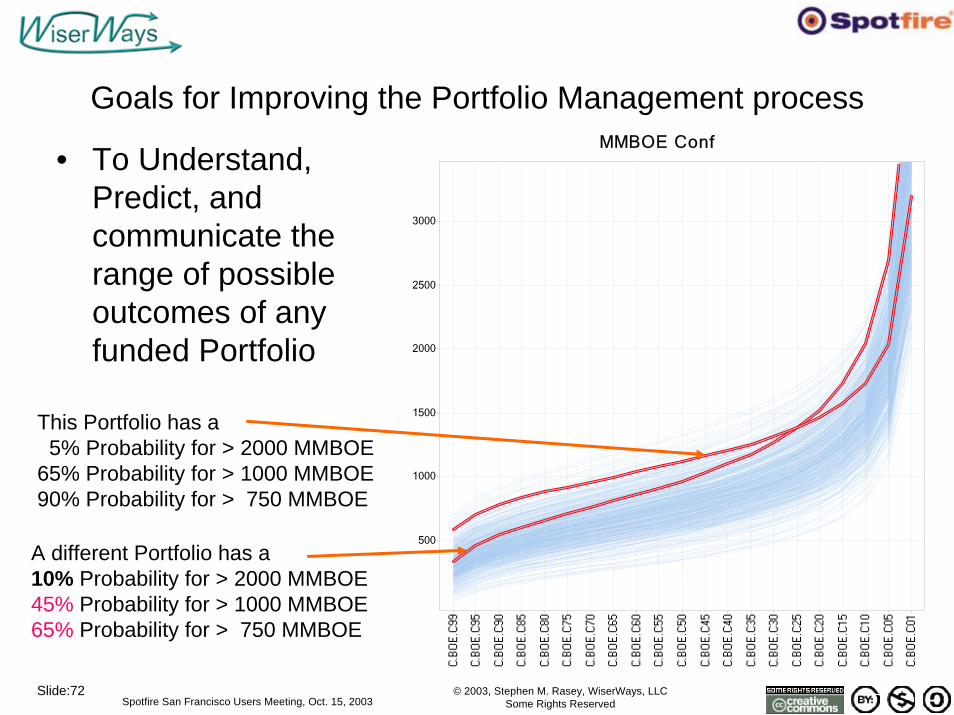
Goals for Improving the Portfolio Management process
• To Understand, Predict, and communicate the range of possible outcomes of any funded Portfolio
MMBOE Conf
500
1000
1500
2000
2500
3000
This Portfolio has a 5% Probability for > 2000 MMBOE
65% Probability for > 1000 MMBOE90% Probability for > 750 MMBOE
A different Portfolio has a 10% Probability for > 2000 MMBOE45% Probability for > 1000 MMBOE65% Probability for > 750 MMBOE
© 2003, Stephen M. Rasey, WiserWays, LLCSome Rights ReservedSpotfire San Francisco Users Meeting, Oct. 15, 2003
Slide:73
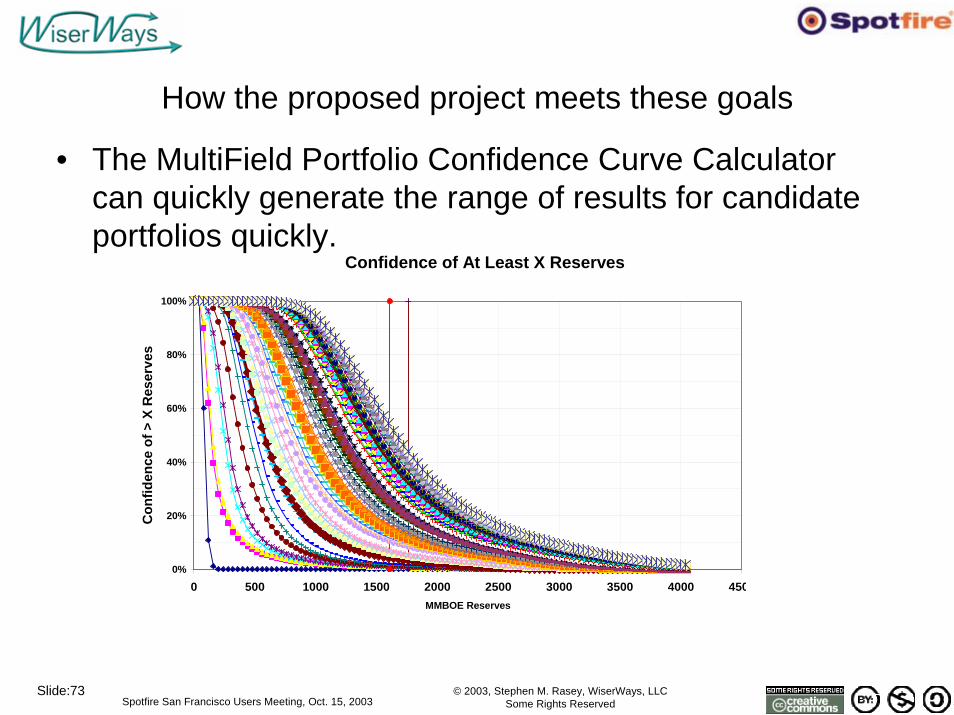
How the proposed project meets these goals
• The MultiField Portfolio Confidence Curve Calculator can quickly generate the range of results for candidate portfolios quickly.
Confidence of At Least X Reserves
0%
20%
40%
60%
80%
100%
0 500 1000 1500 2000 2500 3000 3500 4000 450MMBOE Reserves
Con
fiden
ce o
f > X
Res
erve
s
© 2003, Stephen M. Rasey, WiserWays, LLCSome Rights ReservedSpotfire San Francisco Users Meeting, Oct. 15, 2003
Slide:74
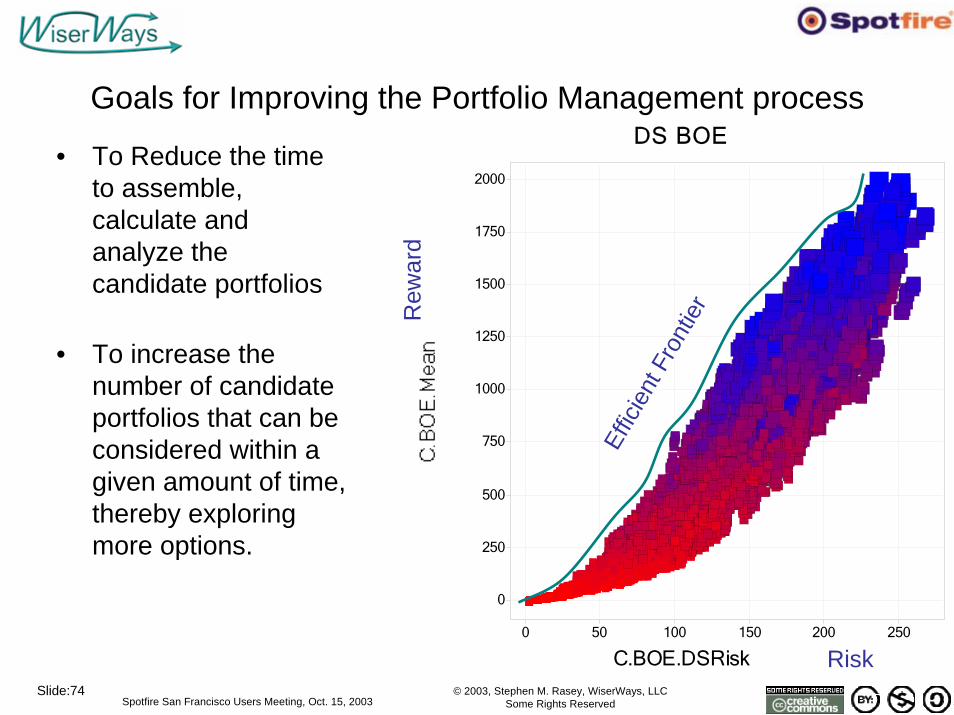
Goals for Improving the Portfolio Management process
• To Reduce the time to assemble, calculate and analyze the candidate portfolios
• To increase the number of candidate portfolios that can be considered within a given amount of time, thereby exploring more options.
DS BOE
C.BOE.DSRisk0 50 100 150 200 250
0
250
500
750
1000
1250
1500
1750
2000
Effic
ient
Fro
ntie
rRew
ard
Risk
© 2003, Stephen M. Rasey, WiserWays, LLCSome Rights ReservedSpotfire San Francisco Users Meeting, Oct. 15, 2003
Slide:75
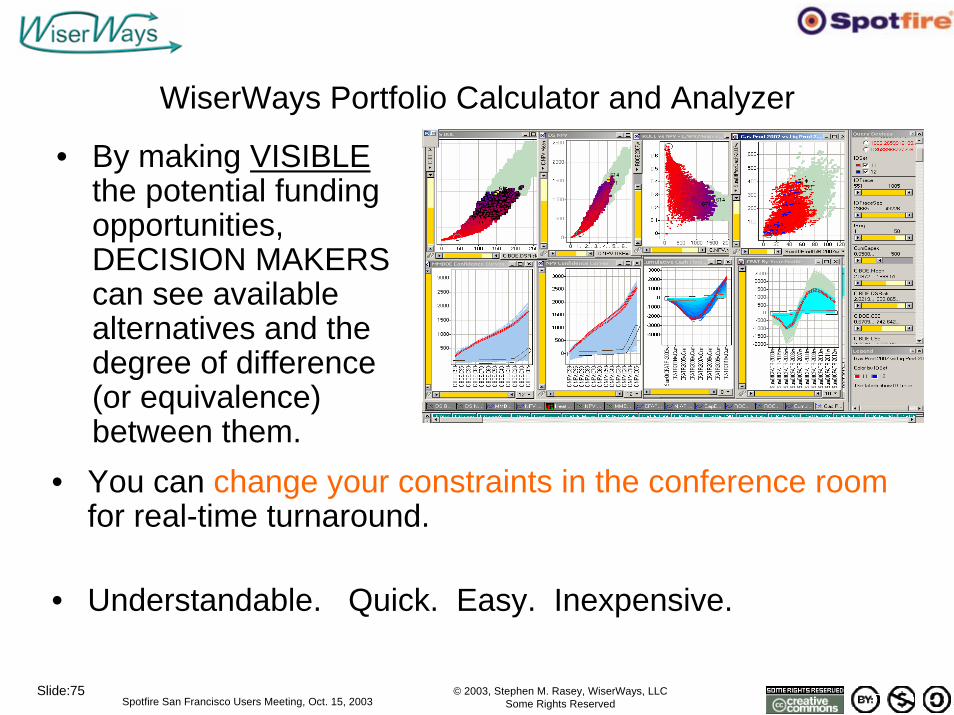
WiserWays Portfolio Calculator and Analyzer
• By making VISIBLEthe potential funding opportunities, DECISION MAKERS can see available alternatives and the degree of difference (or equivalence) between them.
• You can change your constraints in the conference roomfor real-time turnaround.
• Understandable. Quick. Easy. Inexpensive.
© 2003, Stephen M. Rasey, WiserWays, LLCSome Rights ReservedSpotfire San Francisco Users Meeting, Oct. 15, 2003
Slide:76
Thanks to
• Spotfire– For the opportunity to speak here and for the work we
have done together since 2001.• Adán Oviedo Pérez, Subdirector,
Exploración Vicepresident, Pemex• Brett Edwards, President, Custer Resources
© 2003, Stephen M. Rasey, WiserWays, LLCSome Rights ReservedSpotfire San Francisco Users Meeting, Oct. 15, 2003
Slide:77
And Thank You for your attention.
• The San Francisco version of this presentation is available on-line athttp://wiserways.com/downloads/031015Spotfire.pdf
You can do the job many ways….Do it better withDr. Stephen M. RaseyWiserWays, LLCAssociate of Custer ResourcesHouston, TXhttp://[email protected]
Recommended