© 2017 SPLUNK INC.© 2017 SPLUNK INC.
Splunk
Delivering the Promise of DevOps
Prakash Vyas | ITOA Market Specialist
Apr 2019

© 2017 SPLUNK INC.
During the course of this presentation, we may make forward-looking statements regarding future events or
the expected performance of the company. We caution you that such statements reflect our current
expectations and estimates based on factors currently known to us and that actual events or results could
differ materially. For important factors that may cause actual results to differ from those contained in our
forward-looking statements, please review our filings with the SEC.
The forward-looking statements made in this presentation are being made as of the time and date of its live
presentation. If reviewed after its live presentation, this presentation may not contain current or accurate
information. We do not assume any obligation to update any forward-looking statements we may make. In
addition, any information about our roadmap outlines our general product direction and is subject to change
at any time without notice. It is for informational purposes only and shall not be incorporated into any contract
or other commitment. Splunk undertakes no obligation either to develop the features or functionality
described or to include any such feature or functionality in a future release.
Splunk, Splunk>, Listen to Your Data, The Engine for Machine Data, Splunk Cloud, Splunk Light and SPL are trademarks and registered trademarks of Splunk Inc. in
the United States and other countries. All other brand names, product names, or trademarks belong to their respective owners. © 2017 Splunk Inc. All rights reserved.
Forward-Looking Statements
THIS SLIDE IS REQUIRED FOR ALL 3 PARTY PRESENTATIONS.

© 2017 SPLUNK INC.
Devops to create a cultural output to
drive collaboration, automation,
sharing and learning.
To see the progress of my Digital
Transformation programmes in
real-time with changes in CI/CD.
My application delivery to be secure,
whilst also being frictionless for my
engineers and users
All of my DevOps tools and
practices to work holistically,
as well as being locally
optimised.
“I EXPECT…”EXECUTIVE SUMMARY“Executives have a rosier view of their DevOps progress than the teams they manage.” – State of DevOps Report 2018

© 2017 SPLUNK INC.
Outcomes from DevOps Roundtables
END TO END
BUSINESS
KPIs
END TO
END
ANALYTICS
TO
OPTIMISE
CI/CD
BU
SIN
ES
S V
ALU
E
TECHNICAL VALUE
DRIVING VALUE
& LEVERAGING
EXISTING TOOLS
HOLISTIC
AVAILABLITY
OF SERVICES
&
PLATFORMS
DEVELOPER /
TEAM ANALYTICS
CUSTOMER
JOURNEY
Very high focus on the business
value of DevOps
aligning to Customer Experience

© 2017 SPLUNK INC.
DevOps Lifecycle Analytics: Splunk Capability
Application Lifecycle Analytics
Code
Analytics
Build
Analytics
Quality
Analytics
Config
Analytics
Release
Analytics
Value Stream Analytics
Busin
ess Im
pact
Analy
tics
DevOps Organizational Analytics
Resource Analytics DevTeam Analytics Cost Analytics
CI-Aligned Task
Automation
Continuous
Learning
Organizational
Alignment
Agile Team
Collaboration
Continuous
Delivery
DevO
ps M
atu
rity
DevOps Lifecycle
Plan Code Build Test/QA Stage Release MonitorConfig
TAs, HEC, etc.

© 2017 SPLUNK INC.
KPIs across the lifecycle for value-stream management
Splunk for
Lifecycle Analytics
▶ Key Metrics:
• Cycle time
• Story completion
• Deployment rate
▶ Data Sources:
• Jira
• Bamboo/Jenkins
• BitBucket
© 2017 SPLUNK INC.
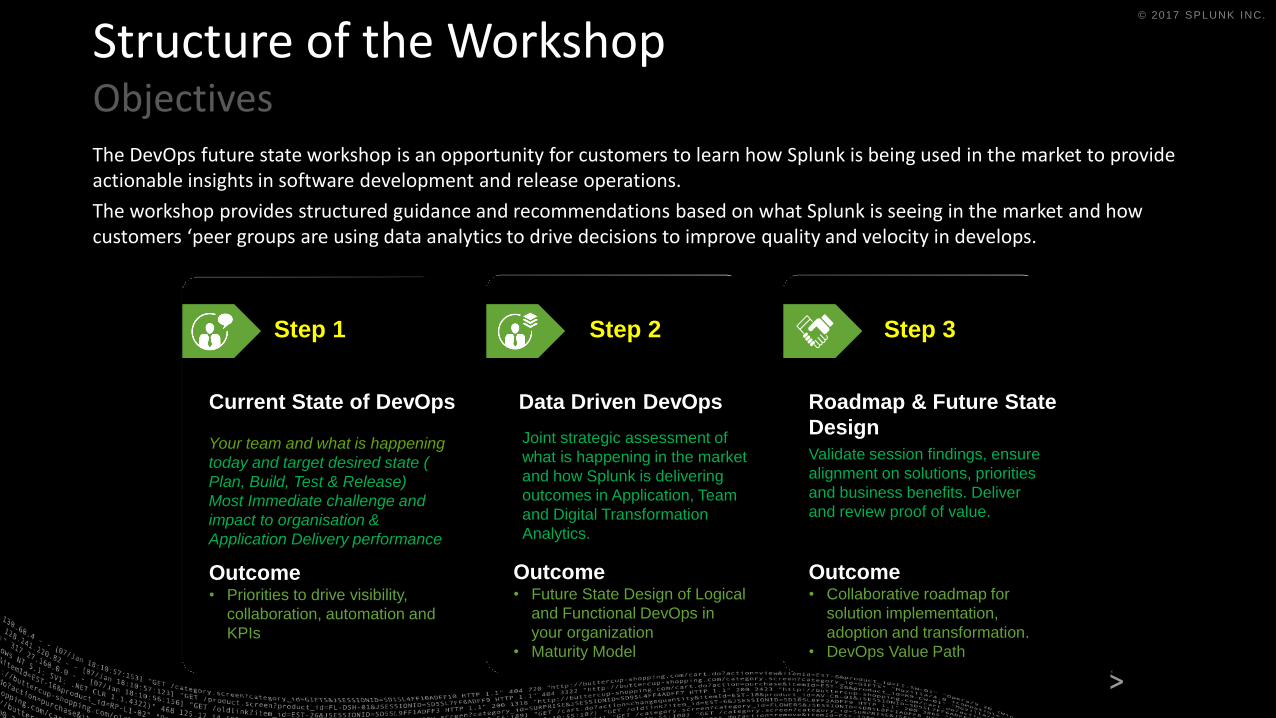
Structure of the WorkshopObjectives
Validate session findings, ensure
alignment on solutions, priorities
and business benefits. Deliver
and review proof of value.
Outcome• Future State Design of Logical
and Functional DevOps in
your organization
• Maturity Model
Outcome• Collaborative roadmap for
solution implementation,
adoption and transformation.
• DevOps Value Path
Joint strategic assessment of
what is happening in the market
and how Splunk is delivering
outcomes in Application, Team
and Digital Transformation
Analytics.
Outcome• Priorities to drive visibility,
collaboration, automation and
KPIs
Step 1
Your team and what is happening
today and target desired state (
Plan, Build, Test & Release)
Most Immediate challenge and
impact to organisation &
Application Delivery performance
Step 2 Step 3
Current State of DevOps Data Driven DevOps Roadmap & Future State
Design
The DevOps future state workshop is an opportunity for customers to learn how Splunk is being used in the market to provide actionable insights in software development and release operations.
The workshop provides structured guidance and recommendations based on what Splunk is seeing in the market and how customers ‘peer groups are using data analytics to drive decisions to improve quality and velocity in develops.

© 2017 SPLUNK INC.
Copyright © 2015 Splunk Inc.
Proven DevOps Outcomes……Repeat Time and Again

© 2017 SPLUNK INC.
WHY SPLUNK?Business Outcomes
Accelerate
Delivery Velocity
Get from idea to customer faster
by rapidly finding and removing
delivery bottlenecks, waste, and
other workflow issues that add to
cycle time
“We can monitor automation and
handoffs to deploy 5-10 times a day.”
Improve
Application Quality
Enhance customer experience and
site reliability by using data analytics
for better dev, test, release, and
support decisions and faster MTTI,
MTTR
“Our devs are able to find and fix
issues 5-10 times faster.”
Increase
Business Impact
Drive continuous improvement
using data-driven feedback
loops to share business-
relevant insight from real user
behavior and application use
“My code isn’t ready until
it’s Splunk-ready.”
Drive continuous improvement
using data-driven feedback loops
to share business-relevant insight
from real user behavior and
application use
• Reduced target application’s error rate
by 2 orders of magnitude in a
matter of weeks
• More than 30 developers use Splunk
• Accelerated code quality deployment time
by 30%
• Gained back 12 developers• 4 TB on AWS

© 2017 SPLUNK INC.
Successful Businesses use Splunk for DevOps

© 2017 SPLUNK INC.
Customer OutcomesUsing Splunk Analytics for DevOps
• Code Check-In to deploy in 20 mins
• 900 deploys per day
• Gained back 12 developers• 4 TB on AWS
• More than 30 developers use
Splunk
• Accelerated code quality
deployment time by 30%
• Developers are detecting errors
and troubleshoot issues up to
10 times faster
• Reduced target application’s error
rate by 2 orders of
magnitude in a matter of weeks
• Increased success rate of deployments
• Ability to detect issues before they
affect broad production
• Monitoring deployment process several
times per day

© 2017 SPLUNK INC.
Thank You
© 2017 SPLUNK INC.
▶ Key Customer Benefits
• Increased success rate of deployments
• Ability to detect issues before they affect broad production
• Monitoring deployment process several times per day
Improved DevOps Agility
“It’s like we were working without peripheral vision before and now we have it.”– Robert Gonsalves, Web Operations
MEDIA & ENTERTAINMENT – APPLICATION DELIVERY

© 2017 SPLUNK INC.
▶ Key Customer Benefits
• Provide full visibility into QA sanity and load testing before production
• Exceed SLA thresholds with full visibility and benchmark key infrastructure metrics and errors
• Easily troubleshoot if tests do not contain the expected results
Deliver Better Code Quality
“Developers are now able to look for errors and troubleshoot issues five to 10 times faster by having all their event data centralized in Splunk.”– Principal Engineer, Apollo Group
EDUCATION – APPLICATION DELIVERY
© 2017 SPLUNK INC.
▶ Key Customer Benefits
• Quickly validate and troubleshoot code pushes to production
• Ensure that new code does not negatively impact performance or user experience
• Reduced one application’s error rate by 2 orders of magnitude in a matter of weeks
Enable Data-Driven Continuous Delivery
“Dump all the logs into Splunk, and it starts looking like one big system, instead of a bazillion teeny ones that hate each other.”– Alison Perkins, Senior Systems Engineer
TECHNOLOGY – APPLICATION DELIVERY

© 2017 SPLUNK INC.
Splunk for Product Lifecycle Analytics
Use Cases, Examples, Screens, and Concepts

© 2017 SPLUNK INC.
Splunk Provides Analytics At Every Phase of The Product Delivery Lifecycle
• resource usage
• idea to cash
• unplanned work
• code volume
• code complexity
• commit rate
• build speed
• build failure rates
• manual exceptions
• test volume
• code coverage
• exception counts
• configuration drift
• remediation time
• provisioning time
• performance
• latency
• scalability
• response time
• uptime/availability
• resource usage
• revenue
• signups
• satisfaction
Plan Code Build Config Stage Release MonitorTest/QA
© 2017 SPLUNK INC.
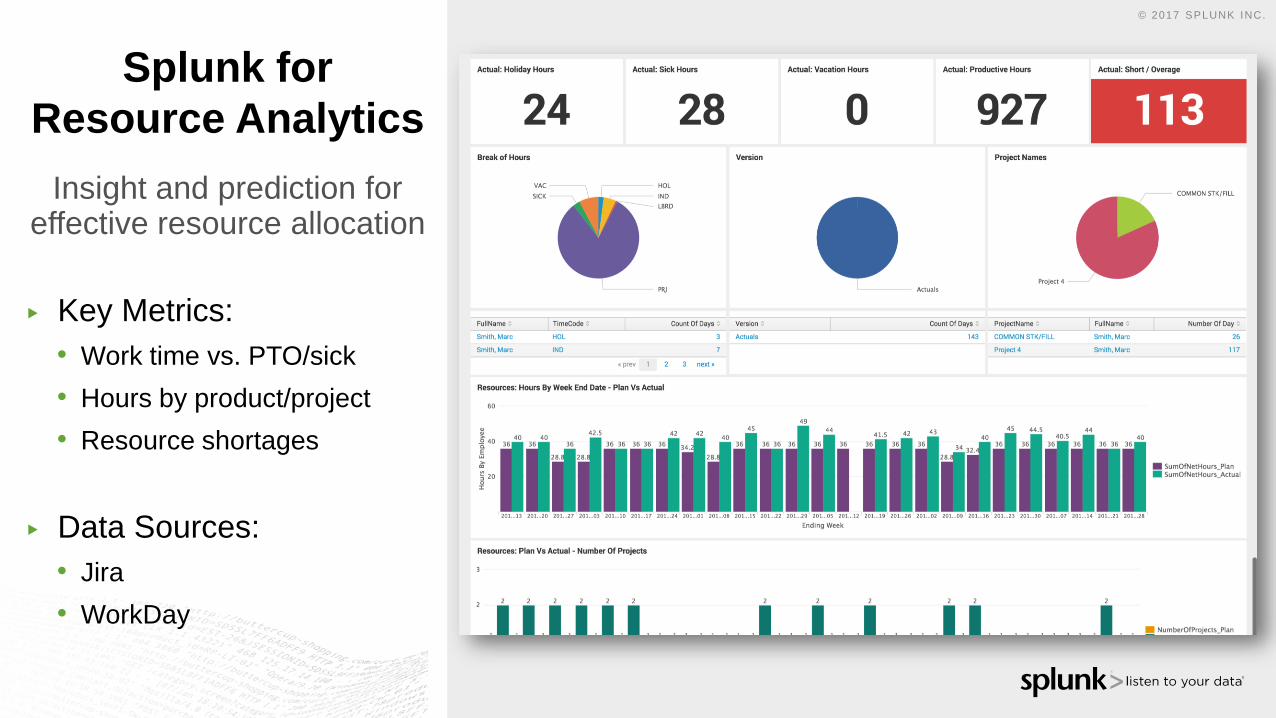
Insight and prediction for effective resource allocation
Splunk for
Resource Analytics
▶ Key Metrics:
• Work time vs. PTO/sick
• Hours by product/project
• Resource shortages
▶ Data Sources:
• Jira
• WorkDay

© 2017 SPLUNK INC.
Measurement and predictability for cost control
Splunk for
Cost Analytics
▶ Key Metrics:
• Productive hours
• Labor costs
• Plan vs. actual
▶ Data Sources:
• WorkDay
• PeopleSoft

© 2017 SPLUNK INC.
Insight to coder activity for teaming & work/life balance
Splunk for
DevTeam Analytics
▶ Key Metrics:
• Commit count
• Commits by author
• Commit days/times
▶ Data Sources:
• GitHub

© 2017 SPLUNK INC.
Real-time data on code quality and compliance
Splunk for
Code Analytics
▶ Key Metrics:
• Code policy compliance
• Code/file/class complexity
• Code analysis coverage
▶ Data Sources:
• GitHub
• Sonarcube

© 2017 SPLUNK INC.
Find and fix build issues to accelerate product lifecycle
Splunk for
Build Analytics
▶ Key Metrics:
• Build success/failure
• Build queue status
• Build process times
▶ Data Sources:
• Jenkins
• Sonarcube

© 2017 SPLUNK INC.
Automatically review QA results to improve quality
Splunk for
Quality Analytics
▶ Key Metrics:
• Defects detected
• Test coverage
• Test executions
▶ Data Sources:
• Selenium
• AppScan
• ServiceNow

© 2017 SPLUNK INC.
Monitor provisioning/config to accelerate time to ‘done’
Splunk for
Config Analytics
▶ Key Metrics:
• Provisioning success/failure
• Provisioning times
• Config drift by node
▶ Data Sources:
• Puppet

© 2017 SPLUNK INC.
Real-time data for better, faster release decisions
Splunk for
Release Analytics
▶ Key Metrics:
• Availability by release
• Tickets by release
• Release readiness
▶ Data Sources:
• ServiceNow
• SonarCube
• HP OpenView
Recommended