Spatial Access Priority Mapping (SAPM) with Fishers: AQuantitative GIS Method for Participatory PlanningKatherine L. Yates1*, David S. Schoeman2
1 Environmental Science Research Institute, University of Ulster, Coleraine, United Kingdom, 2 Faculty of Science, Health, Education and Engineering, University of the
Sunshine Coast, Maroochydore DC, Queensland, Australia
Abstract
Spatial management tools, such as marine spatial planning and marine protected areas, are playing an increasinglyimportant role in attempts to improve marine management and accommodate conflicting needs. Robust data are neededto inform decisions among different planning options, and early inclusion of stakeholder involvement is widely regarded asvital for success. One of the biggest stakeholder groups, and the most likely to be adversely impacted by spatial restrictions,is the fishing community. In order to take their priorities into account, planners need to understand spatial variation in theirperceived value of the sea. Here a readily accessible, novel method for quantitatively mapping fishers’ spatial accesspriorities is presented. Spatial access priority mapping, or SAPM, uses only basic functions of standard spreadsheet and GISsoftware. Unlike the use of remote-sensing data, SAPM actively engages fishers in participatory mapping, documentingrather than inferring their priorities. By so doing, SAPM also facilitates the gathering of other useful data, such as localecological knowledge. The method was tested and validated in Northern Ireland, where over 100 fishers participated in asemi-structured questionnaire and mapping exercise. The response rate was excellent, 97%, demonstrating fishers’willingness to be involved. The resultant maps are easily accessible and instantly informative, providing a very clear visualindication of which areas are most important for the fishers. The maps also provide quantitative data, which can be used toanalyse the relative impact of different management options on the fishing industry and can be incorporated into planningsoftware, such as MARXAN, to ensure that conservation goals can be met at minimum negative impact to the industry. Thisresearch shows how spatial access priority mapping can facilitate the early engagement of fishers and the readyincorporation of their priorities into the decision-making process in a transparent, quantitative way.
Citation: Yates KL, Schoeman DS (2013) Spatial Access Priority Mapping (SAPM) with Fishers: A Quantitative GIS Method for Participatory Planning. PLoS ONE 8(7):e68424. doi:10.1371/journal.pone.0068424
Editor: Jan Geert Hiddink, Bangor University, United Kingdom
Received March 8, 2013; Accepted May 29, 2013; Published July 16, 2013
Copyright: � 2013 Yates, Schoeman. This is an open-access article distributed under the terms of the Creative Commons Attribution License, which permitsunrestricted use, distribution, and reproduction in any medium, provided the original author and source are credited.
Funding: Research was carried out as part of a PhD, funded by the Department of Education and Learning, Northern Ireland. Additional field work resources andequipment were provided by the Agri-Foods and Biosciences Institute, Northern Ireland, as part of a service agreement with the University. The funders had norole in study design, data collection and analysis, decision to publish, or preparation of the manuscript.
Competing Interests: The authors have declared that no competing interests exist.
* E-mail: [email protected]
Introduction
As the human population grows, pressure on the marine
environment escalates and impacts of our unsustainable use can be
seen in biodiversity loss, reduced water quality and declining fish
stocks [1–6]. Efforts to improve management of the marine
environment, and the resources within it, are becoming increas-
ingly spatial, specifically through the development of marine
spatial planning (MSP) and the designation of marine protected
areas (MPAs). Whilst these management tools offer many potential
benefits [7–15], too often these fail to be delivered [16,17], or the
planning process itself fails [18,19].
One reason for the failure of MSP and MPAs is lack of adequate
stakeholder involvement, even though this is often stated as vital
for a successful planning process [20]. Incorporating stakeholders
is important because it allows the planner to better appreciate the
context of the plan and the potential impacts of different planning
options. This greater appreciation provides the opportunity to
develop more inclusive plans, which take into account the needs of
all parties. By so doing, a planner should be able to both reduce
conflict and help to develop a sense of stakeholder ownership over
the project. Compliance with a chosen plan can be enhanced by
this perception of ownership and inclusiveness [21]. Engaging with
stakeholders provides the opportunity to explain the need for
management changes, increasing understanding amongst stake-
holders, which can again improve compliance [21]. Involving
stakeholders can also facilitate generation of information that may
not have otherwise been available, such as data on the distribution
of species. This information can be incorporated into the decision-
making process, which enhances planners’ abilities to find the most
efficient solutions, thereby maximising benefits whilst minimising
conflict and negative impacts. Stakeholder involvement, therefore,
is vital not only to increase a project’s chances of success, but also
to enhance the quality of decisions and reduce implementation
cost [20,22–25].
In the marine environment, one of the largest commercial
stakeholder groups is the fishing community. They are also
arguably the group that are most likely to suffer direct adverse
economic and social impacts of spatial restrictions. For planners to
be able to assess the impact of different options on the fishing
community, they need spatial information on the relative
importance of different parts of the sea. However reliable data
for even the distribution of target species is all too often
unavailable [26], with arguably even less known about the
PLOS ONE | www.plosone.org 1 July 2013 | Volume 8 | Issue 7 | e68424
distribution of fishing effort, and practically nothing about
priorities of the fishers themselves. To fill some of the gaps,
researchers and managers have begun to involve fishers in
participatory mapping studies, and the importance of such
initiatives for effective management is increasingly accepted [27].
Participatory mapping projects have documented a diverse
range of features, including: the locations of fishing grounds; the
distribution of habitats and species; key management areas such as
spawning grounds; and benthic and oceanographic features
[26,28–36]. These projects provide invaluable information for
marine management. However, the maps are of limited use to a
planner trying to take into account stakeholder priorities. First,
these maps are frequently qualitative, making transparent quan-
titative analysis of the different options difficult. Second, even
when quantitative data on stocks are available, they do not
explicitly provide information on fishers’ access priorities: the
distribution of resources does not necessarily relate directly or
linearly to the importance of different areas to fishers or to the
impact of restricting access to them. Nor should a planner assume
to understand the ways in which other variables interact with the
spatial distribution of the resource to determine the importance of
an area to a fisher.
The development of vessel monitoring systems (VMS) attached
to fishing boats has begun to provide very accurate, high-
resolution quantitative data on the distribution of fishing effort
[37]. VMS is very useful, but alone it still only provides
information on where most fishing occurs, which is not necessarily
the same as which parts are the most valuable to fishers. A more
complete picture of the gross economic value can be obtained by
combining VMS data with daily logbook entries, then mapping
the catch value of different parts of the sea to the fishery [38].
In many situations, however, VMS data are still not available: at
present, VMS are generally deployed only on larger vessels and in
developed countries. Detailed landings data are not always
collected, nor are daily logbook systems always in place. Indeed,
even in developed countries such as the UK, the extent and spatial
distribution of inshore fishing effort can be poorly known (pers.
obs). When data are collected, they might still be inaccessible [39].
Thus, VMS-based methods are only possible sometimes, for some
fisheries. Even then, resultant data infer the value of different areas
to fishers, instead of documenting them. Alone, VMS data are not
able to account for all the factors that might affect how important
an area is for a fisher. Grounds closer to home, for example, could
be more important than their gross value implies because of
reduced costs required to access them in both economic (e.g. less
fuel) and/or social (e.g. coming home each night) terms. Other
areas might provide relatively low revenue, but still be very
important because they are the only areas available at a given time
of year, due to weather conditions; in such cases, maintaining
access is necessary for maintaining a regular flow of income.
Furthermore, VMS documents current spatial fishing patterns,
which in many cases are already restricted by area-based quotas,
by-laws, and existing protected areas. Therefore VMS may not
actually represent fishers preferred fishing grounds. Finally, VMS
methods do not facilitate the active involvement of the fishers; they
thus neither meet the recognised and increasingly legislated need
to involve stakeholders, nor provide the opportunity for stake-
holders to feel part of the decision-making process.
Here a novel method, spatial access priority mapping (SAPM),
is described and demonstrated for the Northern Irish fleet. SAPM
requires no VMS, logbook or landings data, is suitable for single or
multiple fisheries of any type, and can be performed using only
basic features of standard spreadsheet and GIS software. It actively
engages fishers, documenting rather than inferring their priorities,
and produces quantitative maps that can be combined easily with
other data if available and desired.
Study Area – the Northern Ireland ContextMarine management in Northern Ireland faces many challeng-
es. Recent European legislation, such as the Marine Strategy
Framework Directive, is setting new standards for the environ-
mental status of coastal waters. A Marine Bill is currently pending
in the Northern Ireland Assembly that will provide the Depart-
ment of the Environment (DOE) with new powers to develop
marine spatial plans and to designate marine conservation zones
(MCZs), a new type of marine protected area. The European
Common Fisheries Policy, which has significant impact on the
Northern Irish Fleet, is under review. The Northern Ireland
Inshore Fisheries Strategy is also under review by the Fisheries
Division of the Department for Agriculture and Rural Develop-
ment (DARD). In addition, there is significant focus on the
development of marine renewable energy in Northern Irish waters
[40–42].
Whilst these developments bring many potential benefits for the
Northern Ireland community, they will likely also bring spatial
restrictions for fishers. In order to properly take fishers into
account, and to make the most efficient plans possible, planners
need to understand which parts of the sea are most important to
fishers. However data are patchy at best. VMS is currently only in
place for vessels 15 m and longer. Associated data have been
processed to produce effort maps for some of their range (Irish
Sea, but not the Clyde or other areas) [43]. Information on the
inshore fishing fleet, which relies on smaller vessels, is limited, with
no current monitoring of effort either in terms of magnitude or
distribution. The distribution and stock levels of Nephrops are
regularly monitored [44], and there are annual surveys for scallops
[45] and ground fish [46]. There is, however, currently no
information on the status of lobster or crab stocks, despite these
resources supporting almost a third of the active vessels in the fleet.
Access to the data that do exist is also restricted, sometimes even
between Government Departments (pers. obs.).
Issues between the Northern Ireland Government Departments,
particularly poor communication and co-operation between
DARD and DOE, have caused problems for marine management
in Northern Ireland in the past [47]. With DOE responsible for
developing the spatial management plans, and DARD responsible
for managing the fisheries that these plans are likely to impact,
there is potential for further conflict. Thus, there is a real need for
universally available data and a transparent way of incorporating
the priorities of the fishers into the planning process.
The majority of the Northern Irish fleet is based at three main
ports: Kilkeel is the largest, followed by Portavogie and Ardglass.
In addition, there are over twenty minor ports at which small
numbers of pot boats are based (Figure 1). A few Northern Ireland
registered boats also fish out of ports in neighbouring countries,
mainly Greencastle in the Republic of Ireland. There are 367
vessels registered in the Northern Ireland fleet, 224 of which are
officially recorded as active (DARD, pers.comm). The majority of
those 224 vessels are under 15 m (127, 57%) and would thus not
be covered by current VMS data.
The most important fishery in terms of revenue and employ-
ment is Nephrops, with 99 of the 224 vessels focusing virtually
exclusively on Nephrops, and a further 11 mixed-fishery vessels
having some Nephrops interest (DARD, pers.comm). Pot-fishing
accounts for the second highest number of vessels, with 69 of the
224 registered as exclusively potting, and 8 mixed-fishery vessels
having potting interest (DARD, pers.comm). There are two main
Fish Producer Organisations (FPOs): the Anglo-Northern Irish
Spatial Access Priority Mapping with Fishers
PLOS ONE | www.plosone.org 2 July 2013 | Volume 8 | Issue 7 | e68424

Fish Producer Organisation (ANIFPO); and the Northern Ireland
Fish Producer organisation (NIFPO). There are two pot fishers
associations, the North Coast Lobster Fishermen’s Association and
the North-East Lobster Fishermen’s Co-Operative, and a Scallop
Fishermen’s Association. All of these representative bodies
reported attempting to engage with the Government Departments
to improve management.
Methods
InterviewsResearch was approved by the School of Environmental
Sciences Ethics Committee, University of Ulster, Coleraine. All
interviews were conducted in accordance with ethics procedures,
and research plans, including the consent procedure, were
submitted and approved prior to the initiation of the project, in
accordance with School and University policy. Prior to each
interview, information sheets detailing the research were provided
to fishers and discussed, and then verbal consent was obtained
from participants. Written consent was not sought, partly to
maintain the informal setting that assisted with the response rate,
but mainly because the respondents were not required to give their
names during the interview, thus requiring a signature (a form of
identification) was considered inappropriate. Verbal consent was
recorded in the response form. All interviews were conducted by
the lead author, ensuring that the procedure was uniform for all
respondents, and all individual responses were recorded in a
confidential database. The pre-interview information sheet and
questionnaire are available in Files S1 & S2.
Interviews consisted of two parts: a semi-structured question-
naire; and a mapping exercise. Each interview lasted between 30
minutes and two hours. The vast majority of fishers interviewed
(.90%) were approached directly at ports. A number of other
fishers responded to flyers that had been distributed by mail. All
respondents were skippers or vessel owners. With the exception of
three interviews conducted in fisher’s homes (2.9%), all interviews
were conducted in ports (97.1%): on vessels, at the quayside, in a
cafe, or in the ANIFPO or NIFPO offices.
During the mapping exercise, fishers were provided with both
paper admiralty charts and digitised admiralty charts within a
GIS. Fishers indicated their priority areas (as polygons) directly
onto the digitised charts. They were encouraged to identify as
many or as few areas as they liked, and to cover as much area as
they wanted. However, each respondent was advised that the
greater the total area, the lower the priority that could be assigned
to each unit of area; thus they were encouraged to be specific.
Those fishers active in multiple fisheries were asked to indicate the
target species of each area. They were given the option of
assigning areas different levels of importance and/or indicating
how much of the year they spent in each area, which was then
converted into a percentage. This then became the importance
value, such that an area that was fished for a fifth of the year
received an importance value of 20. On completion of the
mapping exercise, respondents were encouraged to review their
results and to make changes as desired.
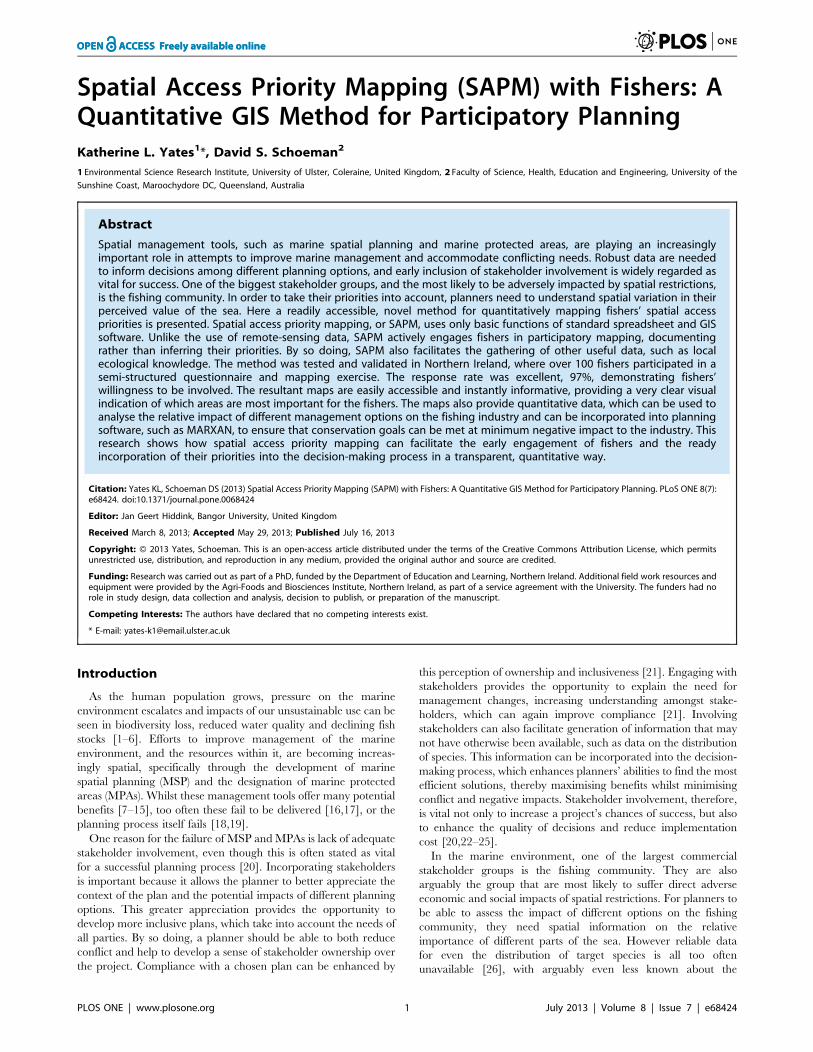
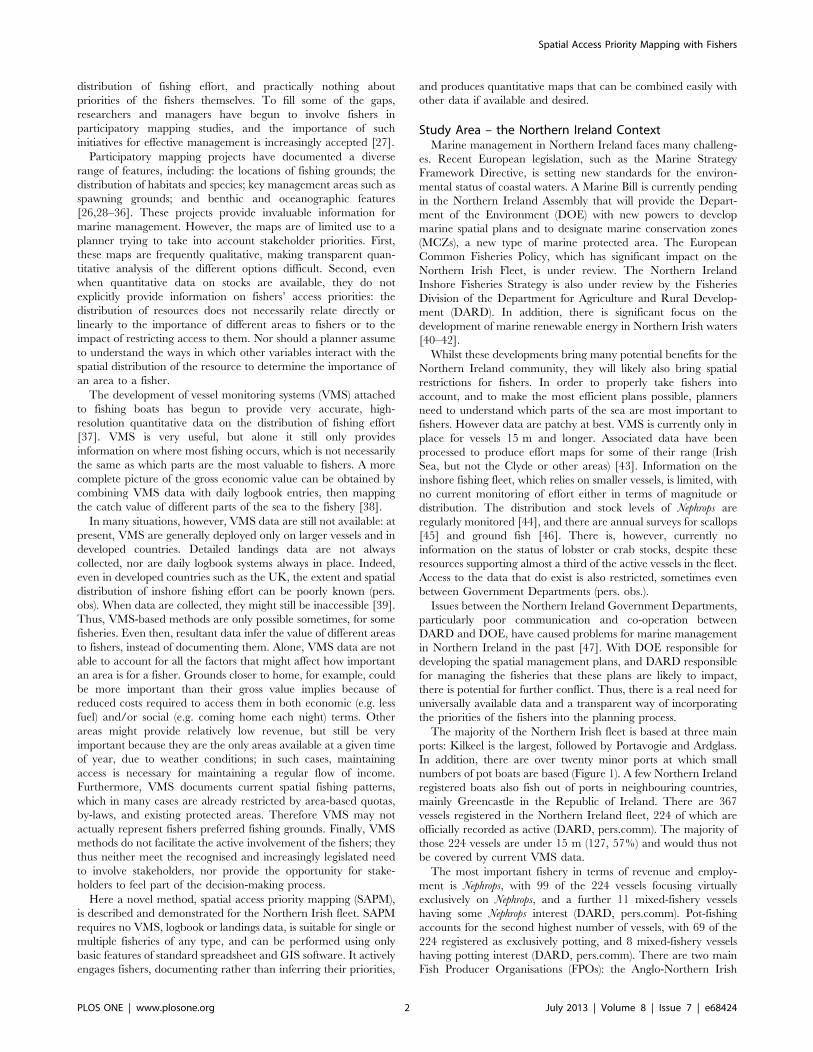
Generating the MapsThe priority (SAP km22) of each of the areas indicated by a
particular respondent was calculated by multiplying the number of
full-time crew on the associated boat by the importance value, and
then dividing by the number of square kilometres the area covered
(Figures 2 & 3 show illustrative examples). Part-time or seasonal
crew were assigned a pro rata proportion of a full-time member’s
weighting, so that a boat that reported four full-time staff
throughout the year and one extra full-time staff for six months
of the year was recorded as having a total of 4.5 crew. Each
individual (full time) fisher has a total SAP of 100, such that a boat
with a crew of 4.5 has a total SAP of 450 associated with it, and an
area that has an SAP of 10 km22 represents a tenth of a fisher per
km2.
In order to create maps that represented the whole fleet, the
results obtained from the individual respondents need to be scaled
up (Figure 4 shows an illustrative example). Based on initial
examination of data and discussions with the fishers, vessels were
divided into six size categories. All vessels under 9 m were pot
boats. With the exception of two specialist offshore crab boats, no
vessels over 10 m fished pots. In the $9 m ,10 m category there
was a mix of pot boats and small dredge or trawl boats. Dredge
and trawl boats of similar size generally have very similar numbers
of crew, but pot boats of the same size tend to have fewer crew and
are often single handed. A two-sided t-test demonstrated that there
were significantly fewer crew on pot boats between 9 and 10 m
than other gear types (t = 3.05, df = 20, p= 0.007). Consequently,
this size category was further divided by gear: pots or not pots.
Data was obtained for only one pelagic vessel, of which there are
three in Northern Ireland; however, an additional category was
assigned for pelagic vessels as they have much higher crew
numbers (8–10) than any other type. Thus vessels were divided
into a total of eight categories (Figure 5) and the average number
of crew per vessel for each of these categories was calculated using
the sample data.
A list of vessels at each port was provided by the fisheries
division of DARD, along with the length and registered gear type
of each vessel. The list showed 224 active registered vessels, but
during the research a number of inaccuracies were found with this
list and it was updated to include additional boats: 14 that were
originally listed as ‘no recorded fish effort this year’, and 8 that
were not listed. The final vessel list contained 246 vessels and was
broken down by port, gear type and length. Using this and the
calculated average crew per vessel, an estimate was made of the
total number of fishers on all active vessels by each port, gear and
length combination.
In each length/gear/port combination, the estimated number
of crew was divided by the actual number of crew sampled in
order to create a final weighting scheme, which was used to
Figure 1. Map of the home ports from which commerciallyactive, Northern Ireland registered vessels fish. Map of the homeports from which commercially active, Northern Ireland registeredvessels fish Data obtained from the Department of Agriculture andRural Development, Northern Ireland, 2012.doi:10.1371/journal.pone.0068424.g001
Spatial Access Priority Mapping with Fishers
PLOS ONE | www.plosone.org 3 July 2013 | Volume 8 | Issue 7 | e68424
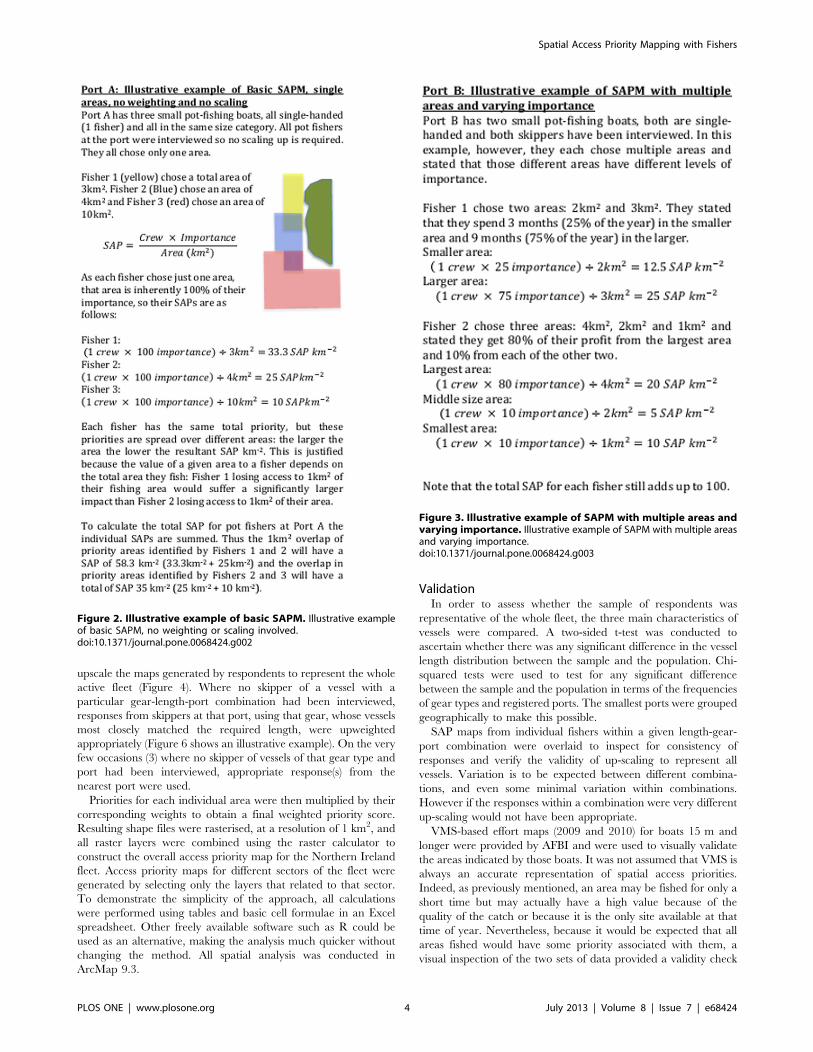
upscale the maps generated by respondents to represent the whole
active fleet (Figure 4). Where no skipper of a vessel with a
particular gear-length-port combination had been interviewed,
responses from skippers at that port, using that gear, whose vessels
most closely matched the required length, were upweighted
appropriately (Figure 6 shows an illustrative example). On the very
few occasions (3) where no skipper of vessels of that gear type and
port had been interviewed, appropriate response(s) from the
nearest port were used.
Priorities for each individual area were then multiplied by their
corresponding weights to obtain a final weighted priority score.
Resulting shape files were rasterised, at a resolution of 1 km2, and
all raster layers were combined using the raster calculator to
construct the overall access priority map for the Northern Ireland
fleet. Access priority maps for different sectors of the fleet were
generated by selecting only the layers that related to that sector.
To demonstrate the simplicity of the approach, all calculations
were performed using tables and basic cell formulae in an Excel
spreadsheet. Other freely available software such as R could be
used as an alternative, making the analysis much quicker without
changing the method. All spatial analysis was conducted in
ArcMap 9.3.
ValidationIn order to assess whether the sample of respondents was
representative of the whole fleet, the three main characteristics of
vessels were compared. A two-sided t-test was conducted to
ascertain whether there was any significant difference in the vessel
length distribution between the sample and the population. Chi-
squared tests were used to test for any significant difference
between the sample and the population in terms of the frequencies
of gear types and registered ports. The smallest ports were grouped
geographically to make this possible.
SAP maps from individual fishers within a given length-gear-
port combination were overlaid to inspect for consistency of
responses and verify the validity of up-scaling to represent all
vessels. Variation is to be expected between different combina-
tions, and even some minimal variation within combinations.
However if the responses within a combination were very different
up-scaling would not have been appropriate.
VMS-based effort maps (2009 and 2010) for boats 15 m and
longer were provided by AFBI and were used to visually validate
the areas indicated by those boats. It was not assumed that VMS is
always an accurate representation of spatial access priorities.
Indeed, as previously mentioned, an area may be fished for only a
short time but may actually have a high value because of the
quality of the catch or because it is the only site available at that
time of year. Nevertheless, because it would be expected that all
areas fished would have some priority associated with them, a
visual inspection of the two sets of data provided a validity check
Figure 2. Illustrative example of basic SAPM. Illustrative exampleof basic SAPM, no weighting or scaling involved.doi:10.1371/journal.pone.0068424.g002
Figure 3. Illustrative example of SAPM with multiple areas andvarying importance. Illustrative example of SAPM with multiple areasand varying importance.doi:10.1371/journal.pone.0068424.g003
Spatial Access Priority Mapping with Fishers
PLOS ONE | www.plosone.org 4 July 2013 | Volume 8 | Issue 7 | e68424

for overall coverage. It would also be expected that a similar
overall pattern would be evident.
Copies of the amalgamated maps for the whole fleet and for the
four main fisheries, with the associated report [48], were made
available to all members of the Northern Ireland fishing fleet to
review. Digital copies were provided to the POs, fishers’
associations and co-operatives, for distribution to their members.
Hard copies were provided to the harbour offices of the POs and
to harbour cafes, where they were made available for fishers to
review. In addition, individuals were able to download digital
copies of maps and reports from the University of Ulster website,
the availability of which was advertised in the national fishing
press. Feedback was provided in a number of ways: POs and
associations solicited and passed on responses from members,
some fishers responded using forms and prepaid envelopes that
were provided along with the hard copies sent to POs and cafes, a
number of individuals submitted responses by email, and others
made direct contact with the lead author to discuss the results.
Results
Interviews were conducted in 20 different ports. The response
rate (97%) was excellent. Fishers were very willing, often keen, to
participate once the project was explained. Indeed, many
expressed concern that those making the decisions understood
neither the industry nor the fishers’ needs, and were glad to have
an avenue to express their opinions. In total, 103 individual
skippers and owners of active vessels were interviewed. Only three
skippers declined, two saying they were too busy and the other
refusing to engage with the process. The respondents skippered
and/or owned 118 vessels, representing 48% of the active fleet
(updated list), and those vessels fish out of 25 different ports
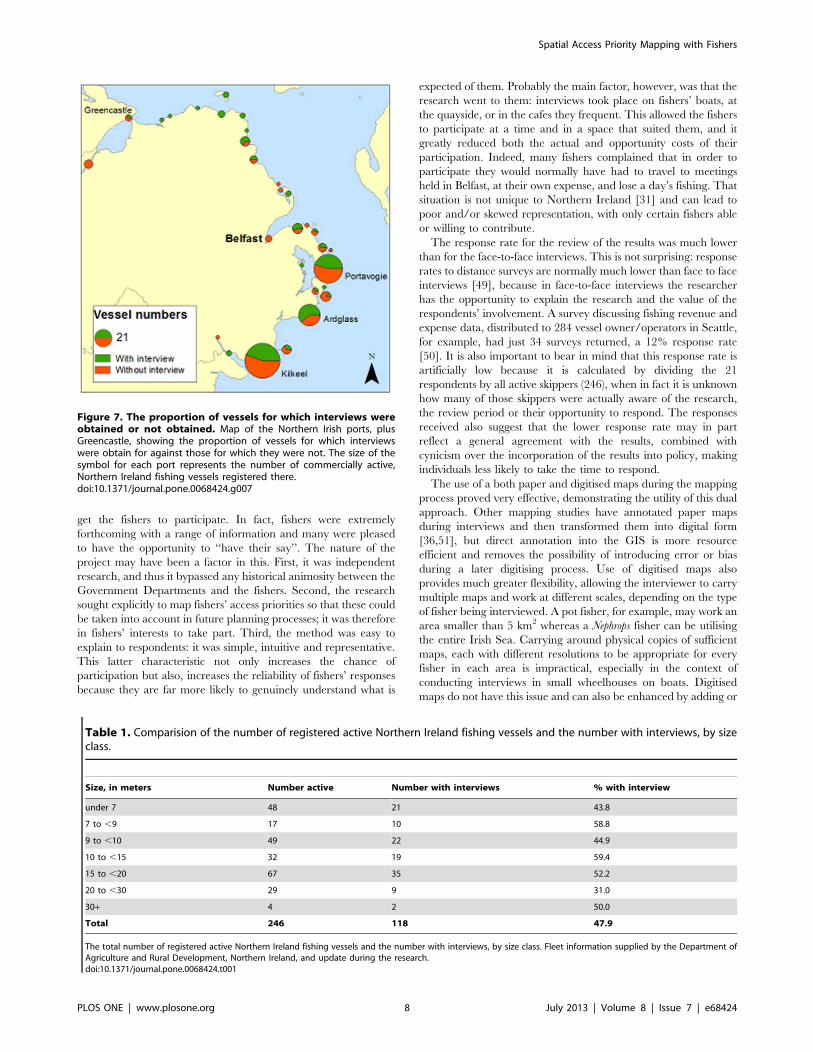
(Figure 7).
Overall, the sample is considered to be an accurate represen-
tation of the fleet (Tables 1& 2, Figure 7). The two-sided t-test on
vessel length showed no significant difference between the sample
and the population (t = 0.06, df = 334, p = 0.995). Chi-squared
tests also showed no significant dependence between sample and
fleet coverage either in terms of the registered port (X2 = 18.232,
df = 19, p= 0.507), or the type of gear used (X2= 3.095, df = 9,
p = 0.96).
The map for the whole fleet produced by SAPM (Figure 8)
shows the spatial heterogeneity in access priority and clearly
highlights areas whose closure would likely cause greatest
contention with the fleet. Unsurprisingly, results show that spatial
priorities vary greatly between different fisheries (Figure 9) and, as
closures are frequently only for certain types of gear, this can
provide valuable input for planners and managers deciding what
activities to restrict and where.
Comparisons among results from individual respondents
showed a high degree of spatial overlap within a given length-
gear-port combination: Figure 10 shows an example from a
combination within the Nephrops fishery. Overlap was high across
all of the three main ports for the Nephrops fishery, within each size
category. Between size categories, overlap reduced, with smaller
vessels having a corresponding reduced range from port. Overlap
was also high across the three main ports for the scallop fishery
(dredge boats). However, overlap across ports for pot-fishing was
very low. This is unsurprising, as the small vessels generally have a
Figure 4. Illustrative example of SAPM using weighting to scaleup the sample to represent the population. Illustrative example ofSAPM using weighting to scale up the sample (interviewed fishers) torepresent the population (whole fleet).doi:10.1371/journal.pone.0068424.g004
Spatial Access Priority Mapping with Fishers
PLOS ONE | www.plosone.org 5 July 2013 | Volume 8 | Issue 7 | e68424

very restricted range and fishers can be territorial between and
sometimes even within ports. This stresses the importance of
obtaining good spatial representation of the pot-fishing commu-
nity, which can be difficult when small ports have just one or two
fishers operating from them. In this study, the involvement of the
Lobster Associations was invaluable in ensuring good coverage.
Overall, visual congruency between the access priority map for
the over 15 m fleet and the VMS effort map is high, with all areas
fished by the fleet being covered on the access priority map
(Figure 11). The access priority map covers a larger total area than
the VMS, which is unsurprising, and is most likely a combination
of the inherently higher accuracy of the VMS and the wider scope
of values that the access priority map captures.
Feedback on the initial report and maps was provided by 21
active skippers/owners, a 9% response rate, as well as by four
retired fishers. Active skippers/owners represented all of the main
Figure 5. Flow diagram of the Spatial Access Priority Mapping Method. Flow diagram of the Spatial Access Priority Mapping Method use tomap the access priorities of the Northern Ireland fleet in 2012. DARD stands for the Department of Agriculture and Rural Development, NorthernIreland.doi:10.1371/journal.pone.0068424.g005
Spatial Access Priority Mapping with Fishers
PLOS ONE | www.plosone.org 6 July 2013 | Volume 8 | Issue 7 | e68424
fisheries and comprised: 8 trawl fishers; 9 pot fishers; 1 dredge/
scallop fisher; and 3 fishers who targeted multiple fisheries. The
response was very positive, with the result perceived by all
respondents to be a good reflection of the fleet’s priorities.
However, many fishers expressed concern that Government
Departments would not use fishers’ inputs in forthcoming plans.
Data SharingAn important aspect of this highly applied research was to
provide data to feed into impending management changes. Once
the maps, and associated report, had been reviewed by the fishing
community and their comments had been added, it was formally
presented to a group of representatives from the relevant Northern
Ireland Government Departments: DARD, AFBI, DOE, the
Northern Ireland Environment Agency and the Department of
Enterprise, Trade and Investment (Marine Renewable Energy
Division). In addition to the digital and hard copies of the report,
they were also provided with the raster data layers for the five
maps (the whole fleet and the four main component fisheries) for
use in their GISs. All agencies stated intentions to use these data in
forthcoming marine spatial planning and MCZ-designation
activities.
The report and data layers were also provided to the UK
Marine Management Organisation, Natural England, the UK
Joint Nature and Conservation Committee, and the Council for
Conservation and the Countryside (Northern Ireland). The report
is freely available to download [47], and interested parties can
request the data layers from the lead author. Data layers will be
deposited in the UK data archive in 2014. Raw data and all
information relating to individual fishers are confidential and will
not be made available.
Discussion
More than 100 skippers and owners of Northern Ireland
registered vessels were interviewed about their spatial access
priorities: their boats represent almost half the active Northern
Irish fleet. Data from these interviews was used to generate spatial
access priority maps for both the whole fleet and for each of the
main fisheries. These maps provide quantitative data on which
parts of the sea are most important to the fishers, and they can be
used to maximise the efficiency of protected area site selection and
to minimise potential conflicts between conservation needs and
those of the fishing industry. The maps can also be used to inform
marine spatial plans, highlight areas of tension between fisheries
and contribute to fisheries management plans.
This research demonstrates the willingness of Northern Ireland
fishers to be involved in both research and management planning.
The response rate was excellent, despite early concerns by many
involved in local marine management that it would be difficult to
Figure 6. Illustrative example of SAPM when not all gear-port-size combinations have been sampled. Illustrative example of SAPMwhen not all gear-port-size combinations have been sampled.doi:10.1371/journal.pone.0068424.g006
Spatial Access Priority Mapping with Fishers
PLOS ONE | www.plosone.org 7 July 2013 | Volume 8 | Issue 7 | e68424
get the fishers to participate. In fact, fishers were extremely
forthcoming with a range of information and many were pleased
to have the opportunity to ‘‘have their say’’. The nature of the
project may have been a factor in this. First, it was independent
research, and thus it bypassed any historical animosity between the
Government Departments and the fishers. Second, the research
sought explicitly to map fishers’ access priorities so that these could
be taken into account in future planning processes; it was therefore
in fishers’ interests to take part. Third, the method was easy to
explain to respondents: it was simple, intuitive and representative.
This latter characteristic not only increases the chance of
participation but also, increases the reliability of fishers’ responses
because they are far more likely to genuinely understand what is
expected of them. Probably the main factor, however, was that the
research went to them: interviews took place on fishers’ boats, at
the quayside, or in the cafes they frequent. This allowed the fishers
to participate at a time and in a space that suited them, and it
greatly reduced both the actual and opportunity costs of their
participation. Indeed, many fishers complained that in order to
participate they would normally have had to travel to meetings
held in Belfast, at their own expense, and lose a day’s fishing. That
situation is not unique to Northern Ireland [31] and can lead to
poor and/or skewed representation, with only certain fishers able
or willing to contribute.
The response rate for the review of the results was much lower
than for the face-to-face interviews. This is not surprising: response
rates to distance surveys are normally much lower than face to face
interviews [49], because in face-to-face interviews the researcher
has the opportunity to explain the research and the value of the
respondents’ involvement. A survey discussing fishing revenue and
expense data, distributed to 284 vessel owner/operators in Seattle,
for example, had just 34 surveys returned, a 12% response rate
[50]. It is also important to bear in mind that this response rate is
artificially low because it is calculated by dividing the 21
respondents by all active skippers (246), when in fact it is unknown
how many of those skippers were actually aware of the research,
the review period or their opportunity to respond. The responses
received also suggest that the lower response rate may in part
reflect a general agreement with the results, combined with
cynicism over the incorporation of the results into policy, making
individuals less likely to take the time to respond.
The use of a both paper and digitised maps during the mapping
process proved very effective, demonstrating the utility of this dual
approach. Other mapping studies have annotated paper maps
during interviews and then transformed them into digital form
[36,51], but direct annotation into the GIS is more resource
efficient and removes the possibility of introducing error or bias
during a later digitising process. Use of digitised maps also
provides much greater flexibility, allowing the interviewer to carry
multiple maps and work at different scales, depending on the type
of fisher being interviewed. A pot fisher, for example, may work an
area smaller than 5 km2 whereas a Nephrops fisher can be utilising
the entire Irish Sea. Carrying around physical copies of sufficient
maps, each with different resolutions to be appropriate for every
fisher in each area is impractical, especially in the context of
conducting interviews in small wheelhouses on boats. Digitised
maps do not have this issue and can also be enhanced by adding or
Figure 7. The proportion of vessels for which interviews wereobtained or not obtained. Map of the Northern Irish ports, plusGreencastle, showing the proportion of vessels for which interviewswere obtain for against those for which they were not. The size of thesymbol for each port represents the number of commercially active,Northern Ireland fishing vessels registered there.doi:10.1371/journal.pone.0068424.g007
Table 1. Comparision of the number of registered active Northern Ireland fishing vessels and the number with interviews, by sizeclass.
Size, in meters Number active Number with interviews % with interview
under 7 48 21 43.8
7 to ,9 17 10 58.8
9 to ,10 49 22 44.9
10 to ,15 32 19 59.4
15 to ,20 67 35 52.2
20 to ,30 29 9 31.0
30+ 4 2 50.0
Total 246 118 47.9
The total number of registered active Northern Ireland fishing vessels and the number with interviews, by size class. Fleet information supplied by the Department ofAgriculture and Rural Development, Northern Ireland, and update during the research.doi:10.1371/journal.pone.0068424.t001
Spatial Access Priority Mapping with Fishers
PLOS ONE | www.plosone.org 8 July 2013 | Volume 8 | Issue 7 | e68424

Table 2. Comparision of the number of registered active Northern Ireland fishing vessels and the number with interviews, by geartype.
Gear Number active Number with interview % with interview
Dredge 5 4 80.0
Dredge & Nephrops trawl 23 13 56.5
Gill Net 13 3 23.1
Hand Fishing 1 0 0.0
Nephrops & Whitefish trawl 5 2 40.0
Nephrops trawl 104 49 47.1
Pelagic trawl 3 1 33.3
Nephrops trawl & Gill net 1 0 0.0
Pots 80 42 52.5
Pots & Nephrops trawl 4 1 25.0
Pots, Dredge & Nephrops trawl 2 2 100.0
Scallop Dredge 2 1 50.0
Seine netting 1 0 0.0
Pots & Dredge 2 0 0.0
Total 246 118 47.9
The total number of registered active Northern Ireland fishing vessels and the number with interviews, by each gear type. Fleet information supplied by the Departmentof Agriculture and Rural Development, Northern Ireland, and update during the research. Please note that many scallop dredgers are registered as dredge or dredgeand nephrops.doi:10.1371/journal.pone.0068424.t002
Figure 8. Map of the spatial access priorities of the NorthernIrish fishing fleet. Map of the spatial access priorities of the NorthernIrish fishing fleet generated from data obtained from 103 interviewswith skippers and boat owners in 2012. It shows the main areas used bythe fleet. There are a number vessels that have a much greater rangethan this. All areas were included in mapping process; however, for thepurpose of maintaining an appropriate scale for visual display, theyhave not been shown.doi:10.1371/journal.pone.0068424.g008
Figure 9. Maps of the spatial access priorities of the four mainfisheries within the Northern Irish fishing fleet. Maps of thespatial access priorities of the four main fisheries within the NorthernIrish fishing fleet: A) Nephrops, B) Pot fishing, C) Scallops and D) Whitefish. Maps were generated using data obtained from interviews with atotal of 103 Skippers and boat owners in 2012. They show the mainareas used by the fleet. There are a small minority of Nephrops vesselsthat have a greater range than this. All areas were included in mappingprocess; however, for the purpose of maintaining an appropriate scalefor visual display, they have not been shown.doi:10.1371/journal.pone.0068424.g009
Spatial Access Priority Mapping with Fishers
PLOS ONE | www.plosone.org 9 July 2013 | Volume 8 | Issue 7 | e68424

highlighting reference points, such as lighthouses. Furthermore,
when using digital maps, built-in tools such as ‘‘zoom’’ and ‘‘pan’’
have been shown to facilitate the mapping process by revealing
more scale-dependent detail [26]. Fishers also appreciated the
ability to quickly and accurately measure distances on the digital
map when they were drawing on their areas. Having some broad-
scale paper maps available did prove useful, mainly as a
comfortable starting point for those less technologically inclined,
and the use of a combination seems to provide the best of both
worlds.
SAPM facilitated the documentation of fishers’ actual access
priorities, as opposed to interpreting their priorities from VMS-
based mapping methods, and thus provides a fuller picture of
which parts of the sea are most important to them. VMS alone
maps only effort. Even when it is possible to incorporate log-book
data with VMS data to estimate gross catch value of the different
parts of the sea, this value is certainly not the only feature that
makes an area important to fishers. Moreover, there are many
boats that simply do not have VMS because they are too small. In
Northern Ireland, over half the fleet would have their access
priorities unaccounted for if planning were to use VMS-based
maps alone.
Notwithstanding the limitations of VMS data, they remain vital
for understanding the distribution of effort and are very important
both for management and for informing the planning process. For
example, they can be used to help predict the displacement impact
of spatial restrictions. SAPM can be an important compliment to
VMS based methods, when they are available, helping to
compensate for their limitations. When they are not, it can be
readily used as a standalone method.
This research also demonstrated how the SAPM method can be
used to combine priorities across different types of fishery and to
generate maps for the overall fleet, as well as for the separate
fisheries. That SAPM can be used in any situation makes it
suitable for enabling the direct comparison, and even combina-
tion, of the access priorities of multiple fleets, which otherwise
might not have been possible due to differences in the associated
data. Examples include: fleets that have VMS and fleets that do
not, or fleets from different jurisdictions that access the same area
but whose regulators have different fisheries data-capture and
analysis methodologies.
Possibly the greatest advantage of SAPM over VMS is that it
directly engages fishers in the process and allows them to
contribute quantitative pre-planning data. The importance of
stakeholder involvement is well recognised [20,23–25,33,52] and is
increasingly becoming a legislative requirement, incorporated into
both national and international policy [23,53]. Recent European
Directives, such as the EU Public Participation Directive (2003/
35/EC), have set new legal standards for stakeholder involvement,
and almost every sustainability conference closes with a commit-
ment to enhancing public participation [25].
Stakeholder involvement is sought because it has been shown to
increase the quality and durability of environmental decisions,
with the resultant plans better adapted to local socio-cultural and
environmental conditions [23–25]. It can also reduce conflict and
increase compliance [21,33]. Indeed stakeholder participation and
involvement have been widely identified as essential components
of effective ecosystem management [54,55], with differences in the
extent and quality of participation being one of the key factors for
variation in the quality of management approaches [20].
Stakeholder participation can also lead to the generation of
additional data. Whilst undertaking SAPM, it would be relatively
simple to gather other information, such as fishers’ opinions of
management options, or local ecological knowledge, which can
enhance understanding of the ecosystems being managed. Both
can provide highly valuable input to the planning processes.
Inclusion of stakeholder knowledge such as this can also help to
integrate stakeholders into the planning process and to promote a
sense of ownership [56]. Certainly here in Northern Ireland,
fishers were more than happy to contribute, and discussions
indicated that the inclusion of their knowledge and opinions into
the planning process would enhance buy-in.
Stakeholder involvement is not without its opponents, with
counterarguments suggesting that the participatory process may
not in reality lead to better-quality plans, and that the high levels
of participation may actually increase conflict by having disputing
parties at the negotiating table [20]. There are concerns that it will
frustrate the planner by slowing down the process and that the
strength of the final agreement will be diluted to balance
competing interests [20]. Protected area designs that accommo-
date social needs may also result in outcomes that do not
adequately conserve ecosystems [57]. Yet evidence suggests that
this need not be the case. The incorporation of stakeholders during
the planning process can increase the likelihood of plan
implementation and the presence of certain stakeholders, partic-
ularly industry, has been shown to significantly increase the quality
of local ecosystem plans [20]. Likewise, research shows that the use
of fisheries data in MPA selection can reduce the negative impacts
on the industry whilst still meeting conservation goals [58,59], and
that incorporation of socio-economic considerations into system-
atic conservation planning can improve overall cost effectiveness
[60]. It has also been frequently demonstrated that when fishers
are involved in the research and decision-making process,
management guidelines are more likely to be effective [26,61,62].
Another concern might be the credibility of stakeholder
involvement, questioned on the basis that many may not have
sufficient expertise to meaningfully engage in what are often
Figure 10. Spatial overlap of fishers’ access priority areaswithin a given gear-length-port combination. Map of the accesspriority areas chosen by nine Nephrops fishers, from Northern Ireland.The nine fishers’ vessels were within a given port-length combinationand the map shows the spatial overlap in their responses.doi:10.1371/journal.pone.0068424.g010
Spatial Access Priority Mapping with Fishers
PLOS ONE | www.plosone.org 10 July 2013 | Volume 8 | Issue 7 | e68424

technical debates [63]. However, in this case it is actually the
fishers that are the experts, often with decades of fishing
experience. This acumen of fishers is increasingly recognised,
with more and more studies documenting their extensive
ecological knowledge [52,64,65] and surely who better to indicate
which parts of the sea are most important to fishers than the fishers
themselves?
With stakeholder consultation becoming more and more
integrated into governance, the issue of consultation fatigue can
also arise: when stakeholders are asked to take part in multiple or
multi-stage participatory processes in which they perceive their
involvement gains them little reward or capacity to influence the
decisions being made [66]. Use of SAPM can help prevent that. It
collects data in a systematic way, one of the recommendations for
overcoming barriers to stakeholder participation [67]. Participa-
tion in SAPM is also of low cost to fishers and the method is
readily explained. Resultant data are baseline preplanning data, so
they can be used for multiple different planning projects, helping
to avoid excessive or repeated demands on fishers’ time. The maps
generated can easily be used to demonstrate the results of the
research and how that can feed into the planning process. They
can also be readily incorporated into conservation planning
software, such as MARXAN, where their influence on selecting
potential MPA site can be illustrated.
As mentioned earlier, the cost of participation at centrally based
stakeholder events can be a barrier to participation to fishers.
Participation tends to be higher amongst those with more extreme
positions and amongst those who are more dominant, influential
and financially powerful within a community [68], so those fishers
who do attend central events are unlikely to be truly representative
of the fleet as a whole. By actually going to the fishers, SAPM can
help to ensure a more diverse range of fishers is involved in the
planning process. It also allows much larger numbers to partake:
whilst it would be impractical for DOE to have 100 fishers around
a planning table, SAPM allowed those fishers to contribute in a
way that made them feel part of that process.
Other studies have looked at incorporating fishers’ priorities
into marine planning. In particular, a series of studies incorporat-
ing Californian fishers’ knowledge and priorities into MPA
selection has been conducted by Klein [58,69] and Scholz
[31,32,70]. Fishers were asked to map their fishing grounds and
to indicate relative importance [70], in a similar way to SAPM.
The study area was then divided into 1381 planning units and the
fishers data was used to calculate the relative importance of those
planning units, across all fisheries and within a fishery [58].
Surrogate layers for relative fishing effort for each fishery were
produced, and by summing the layers for the different fisheries
they were able to develop an index of relative effort across all
fisheries. In this method, each fishery receives equal weighting,
such that a fishery that supported 10 fishers would have the same
input into the final index as one that supported 1000. No
weighting is applied to the individual fishers’ areas either, so that
results from a skipper whose vessel supported 10 crew would have
Figure 11. Spatial access priority map and VMS effort maps for the over 15 m Nephrops fleet. The spatial access priority map (2012) andthe VMS effort maps (2009 and 2010) for over 15 m Nephrops fleet. VMS maps supplied by Laurence Rooney at AFBI. Processed VMS data were notavailable for all areas delineated by the fishers so this figure compares only main fishing areas where it was.doi:10.1371/journal.pone.0068424.g011
Spatial Access Priority Mapping with Fishers
PLOS ONE | www.plosone.org 11 July 2013 | Volume 8 | Issue 7 | e68424
the same weight as result from a skippers who vessel supported
two.
This approach does increase the likelihood that all fisheries
would be affected equally, which in this instance was a specific goal
of the stakeholders (Klein, pers.comm). However, it is also often
very desirable to minimise total negative impact on the fishing
community and protect the greatest number of livelihoods. In later
studies, Klein et al [69] and Scholz et al [32] incorporated a
weighting system. They weighted the area(s) each fisher indicated
by their vessel’s revenue, which means that those fishers with
vessels that caught more and made more profit had proportionally
more input. This is similar to SAPM, where responses are
weighted by the number of crew, so that those vessels with more
crew have more total priority. Weighting by vessel revenue
enabled Klein et al [69] and Scholz et al [32] to produce layers that
showed the monetary value, in US dollars, of a given planning unit
to an individual fisher. They summed those individual layers to
create cost layers, which they used in Marxan to develop MPA
planning options that minimised the negative impacts of spatial
restrictions on the fishing industry.
The main difference between previous approaches and SAPM is
that SAPM can allow an assessment of both relative and total
access priority, and the production of surrogate cost layers,
without the need for additional fisheries data. This is because
SAPM uses information derived from interview (crew numbers),
rather than revenue or landings, to weight the responses. Like the
cost layer(s) created in both Klein et al [69] and Scholz et al [32],
the SAPM generated surrogate cost layer(s) can be used in Marxan
to minimise total negative impact of MPA designation on the
fishing community. If the goal was to increase the likelihood that
all fisheries are affected equally, like Klein et al [58], SAPM can
also be used to map and assess relative priority, by dividing the
SAP km22 by the total SAP of a fishery and/or a fleet. Moreover,
SAPM can also be used to assess the equality of spatial restrictions
by analysing the SAPs of different port-gear-length combinations
and comparing how much a given restriction or set of restrictions
affects each group. When it is possible to access other data, such as
revenue data, SAPM can be easily modified to incorporate it, see
below for some possible adaptations to the method.
Another major difference is that SAPM specifically takes
account of the different characteristics of the vessels (length/
port/gear) when weighting and scaling responses. This is
important because size of a vessel and the port from which it
operates are both likely to have an impact on its preferred
grounds, even when fishing for the same target species. Further-
more, the previous studies did not ascertain whether their samples
(the fishers they interviewed) were representative of the fleet.
Indeed, Scholz et al [32] state that to reach their sampling goal as
efficiently and cheaply as possible they targeted fishers with the
largest catches [32]. Whilst understandable, this suggests that,
within a given fishery, the fishers with the smallest vessels had a
lower chance of being interviewed. Smaller vessels tend to be more
restricted in terms of fishing grounds and may have totally
different spatial access priorities than larger vessels. By requiring a
representative sample of the fleet SAPM helps to ensure all fishers
are included, essential when aspiring to equitable stakeholder
involvement.
Use of SAPM does not remove the need for subsequent
engagement with the fishing community, nor will it remove all the
potential conflict associated with MSP and MPA designation. It is
a beginning, not an end: providing data to feed into a planning
process and allowing a planner to assess the impact of different
potential plans on fishers. Its use should improve the transparency
of the planning process, enhance buy-in and increase trust.
Possible Adaptations to the MethodThe weighting system used in SAPM is highly flexible, allowing
for the incorporation of livelihoods or economic values beyond the
vessels’ crews. In Northern Ireland, for example, fish processors
employ an estimated 500 full-time staff [43]. To incorporate these
into the analysis, those 500 would be first separated into their
associated fisheries. Then, based on the percentage of fishers
within each length-gear-port combination for that fishery, they
would be divided between each combination and added to the
estimated number of crew. Doing this would proportionally
increase the priority of fisheries with associated local processing,
such as Nephrops, and cause a relative decrease in those without,
reflecting the higher numbers of livelihoods that depend on those
sectors. Similarly, if other data, such as landings, are available, the
weighting system could also be modified accordingly. The total
economic value of landings for a given fishery could be divided by
the number of fishers in that fishery to obtain a value per fisher,
which would then be multiplied by the weighting obtained from
the standard method for each length/gear/port combination.
Future ResearchThis research did not aim to investigate the fishers’ motivations
for selecting different areas or for assigning priorities. Nor were
they restricted to assigning priorities for a specific time span. It
would be informative to expand future SAPM projects to include a
debriefing session, where researchers explore with fishers their
rationale and motivation for selecting areas and assigning
priorities. An improved understanding of what makes areas
important to fishers may help with predicting how they respond
to spatial and temporal restrictions. Future SAPM projects could
also incorporate the gathering of local ecological and historical
knowledge, including: mapping where the fishers historically
accessed resources and how their SAPs have changed over time,
discussing when and why they changed, and comparing answers to
legislative, ecological and climatic trajectories.
ConclusionsSpatial management can have many benefits for conservation
and fisheries alike, but in order to realise them stakeholders need
to be engaged in a strategic manner from an early stage. SAPM
offers a tool that not only gathers quantitative data on fishers’
access priorities, but also facilitates stakeholder engagement and
increases the opportunity for dialogue between fishers and
managers. The resultant maps provide a transparent, easy to
demonstrate way of incorporating fishers’ priorities, especially
when combined with spatial planning software such as MARXAN.
The use of SAPM should facilitate strategic conservation planning,
maximising benefits whilst both minimising negative impacts on
stakeholders and helping to ensure those impacts are spread
equitably. We hope that the inclusive planning that SAPM
encourages will lead to more successful solutions to the inevitable
conflicts of interests that conservation planning encounters.
Supporting Information
File S1 Pre-interview Information sheet. Pre-interview informa-
tion sheet provided to fishers prior to participation in a survey
targeting skippers and owners of commercial fishing vessels
registered in Northern Ireland. After the potential participant
had read the information sheet, the content was discussed to
ensure understanding and obtain verbal consent, before beginning
the interview. Research was completed during 2012.
(PDF)
Spatial Access Priority Mapping with Fishers
PLOS ONE | www.plosone.org 12 July 2013 | Volume 8 | Issue 7 | e68424
File S2 Questionnaire. Questionnaire used to guide semi-
structured interviews of skippers and owners of Northern Ireland
registered commercial fishing vessels. Interviews were preceded
with pre-interview information sheets. 103 interviews were
conducted in total, during 2012. The responses from some of
these questions were used to develop Spatial Access Priority Maps,
this study, whilst others were used to answer research questions
explored in subsequent studies.
(PDF)
Acknowledgments
First and foremost the authors would like to thank all the fishers that
generously gave up their time to make this research possible. Many thanks
to everyone in ANIFPO, NIFPO and the North Coast Lobster Association;
in particular we thank Mr Alan McCulla and Mr David Galbraith. Thanks
also to members of DOE, NIEA, DARD and AFBI for their assistance,
with special thanks to Laurence Rooney, at AFBI, for the provision of the
VMS images. We would like to thank our colleagues Dr Thomas Smyth,
Dr Sara Benettii and Dr Ruth Thurston for reviewing an earlier draft of
the manuscript. We would also like to thank Dr N. Clare Eno and two
other anonymous referees for their comments and suggestions. Input from
all the reviewers greatly added to the final manuscript.
Author Contributions
Conceived and designed the experiments: KLY. Performed the exper-
iments: KLY. Analyzed the data: KLY. Contributed reagents/materials/
analysis tools: KLY. Wrote the paper: KLY. Introduced the first author to
initial key contacts: DS. Provided assistance with the funding proposal that
made this research possible: DS. Provided significant critical feedback on
multiple drafts, improving the argument and the robustness of the
discussion: DS. Corrected grammatical errors and made suggested
improvements to prose: DS. Suggested the development of a flow chart
to make the methods simpler to follow: DS.
References
1. Airoldi L, Beck MW (2007) Loss, status and trends for coastal marine habitats of
Europe. Oceanography and Marine Biology: An Annual Review 45: 345–405.
2. Casey RA, Myers JM (1998) Near Extinction of a Large, Widely Distributed
Fish. Science 281: 690–692. Available: http://www.sciencemag.org/cgi/doi/10.
1126/science.281.5377.690.
3. Pauly D, Watson R, Alder J (2005) Global trends in world fisheries: impacts on
marine ecosystems and food security. Philosophical transactions of the Royal
Society of London Series B, Biological sciences 360: 5–12. Available: http://
w w w . p u b m e d c e n t r a l . n i h . g o v / a r t i c l e r e n d e r .
fcgi?artid = 1636108&tool = pmcentrez&rendertype = abstract.
4. Jackson JB, Kirby MX, Berger WH, Bjorndal KA, Botsford LW, et al. (2001)
Historical overfishing and the recent collapse of coastal ecosystems. Science
(New York, NY) 293: 629–637. Available: http://www.ncbi.nlm.nih.gov/
pubmed/11474098.
5. Halpern BS, Walbridge S, Selkoe KA, Kappel CV, Micheli F, et al. (2008) A
global map of human impact on marine ecosystems. Science (New York, NY)
319: 948–952. Available: http://www.ncbi.nlm.nih.gov/pubmed/18276889.
6. Worm B, Sandow M, Oschlies A, Lotze HK, Myers RA (2005) Global patterns
of predator diversity in the open oceans. Science (New York, NY) 309: 1365–
1369. Available: http://www.ncbi.nlm.nih.gov/pubmed/16051749.
7. Beukers-Stewart B, Vause B, Mosley M, Rossetti H, Brand A (2005) Benefits of
closed area protection for a population of scallops. Marine Ecology Progress
Series 298: 189–204. Available: http://www.int-res.com/abstracts/meps/v298/
p189-204/.
8. Halpern BS, Warner RR (2002) Marine reserves have rapid and lasting effects.
Ecology Letters 5: 361–366. Available: http://doi.wiley.com/10.1046/j.1461-
0248.2002.00326.x.
9. Roberts CM, Hawkins JP (2000) Fully-protected marine reserves: a guide. WWF
Endangered Seas Campaign, Washington, USA and Environment Department,
University of York, UK. Avalible: http://billhutten.s3.amazonaws.com/fw/
docs/345.pdf Accessed 2012 Jan 20.
10. Roberts CM, Bohnsack JA, Gell F, Hawkins JP, Goodridge R (2001) Effects of
marine reserves on adjacent fisheries. Science (New York, NY) 294: 1920–1923.
Available: http://www.ncbi.nlm.nih.gov/pubmed/11729316.
11. Worm B, Hilborn R, Baum JK, Branch TA, Collie JS, et al. (2009) Rebuilding
global fisheries. Science (New York, NY) 325: 578–585. Available: http://www.
ncbi.nlm.nih.gov/pubmed/19644114.
12. Hyrenbach KD, Forney KA, Dayton PK (2000) Marine Protected Areas and
Ocean Basin Management. Aquatic Conservation: Marine and Freshwater
Ecosystems 10: 437.
13. Heupel MR, Simpfendorfer CA (2005) Using Acoustic Monitoring to Evaluate
MPAs for Shark Nursery Areas: The Importance of Long-Term Data. Marine
Technology Society Journal 39: 10.
14. Rudd MA, Tupper MH (2002) The Impact of Nassau Grouper Size and
Abundance on Scuba Diver Site Selection and MPA Economics. Coastal
Management 30: 133.
15. Kelleher G, editor (1999) Guidelines for Marine Protected Areas. Gland,
Switzerland: World Commision on Protected Areas. IUCN - The World
Conservation Union. IUCN website. Avaliable: http://data.iucn.org/dbtw-
wpd/edocs/PAG-003.pdf. Accessed 2012 Oct 10.
16. Jameson SC, Tupper MH, Ridley JM (2002) The three screen doors: Can
marine ‘‘protected’’ areas be effective? Marine pollution bulletin 44: 1177–1183.
17. Hargreaves-Allen V, Mourato S, Milner-Gulland EJ (2011) A global evaluation
of coral reef management performance: are MPAs producing conservation and
socio-economic improvements? Environmental management 47: 684–700.
Available: http://www.ncbi.nlm.nih.gov/pubmed/21365274.
18. Helvey M (2004) Seeking Consensus on Designing Marine Protected Areas:
Keeping the Fishing Community Engaged. Coastal Management 32: 173–190.
A v a i l a b l e : h t t p : / /www . t a n d f o n l i n e . c om/do i / a b s / 1 0 . 1 0 8 0/
08920750490276236.
19. Weible CM (2008) Caught in a Maelstrom: Implementing California Marine
Protected Areas. Coastal Management 36: 350–373. Available: http://www.
tandfonline.com/doi/abs/10.1080/08920750802266387.
20. Brody SD (2003) Measuring the Effects of Stakeholder Participation on the
Quality of Local Plans Based on the Principles of Collaborative Ecosystem
Management. Journal of Planning Education and Research 22: 407–419.
doi:10.1177/0739456X03253022.
21. Innes JE (1996) Planning through consensus building: A new view of the
comprehensive planning ideal. Journal of the American Planning Association 62:
460–472.
22. Reed MS, Dougill AJ, Baker TR (2008) Participatory indicator development:
what can ecologists and local communities learn from each other? Ecological
applications: a publication of the Ecological Society of America 18: 1253–1269.
Available: http://www.ncbi.nlm.nih.gov/pubmed/18686585.
23. Beierle TC (2002) The quality of stakeholder-based decisions. Risk analysis: an
official publication of the Society for Risk Analysis 22: 739–749. Available:
http://www.ncbi.nlm.nih.gov/pubmed/12224747.
24. Koontz TM, Thomas CW (2006) What Do We Know and Need to Know about
the Environmental Outcomes of Collaborative Management? Public Adminis-
tration Review 66: 111–121. Available: http://doi.wiley.com/10.1111/j.1540-
6210.2006.00671.x.
25. Newig J (2007) Does public participation in environmental decisions lead to
improved environmental qulaity? Towards an analytical framework. Research
and Practice for a Sustainable Future 1: 51–71.
26. Moreno-baez M, Orr BJ, Cudney-bueno R, Shaw WW (2010) Using fishers’
local knowledge to aid managment at regional scales: Spatial Distribution of
small-scale Fisheries in the Northern Gulf of California Mexico. Bulletin of
Marine Science 86: 1–16.
27. Maurstad A (2002) Fishing in murky waters: ethics and politics of research on
fisher knowledge. Marine Policy 26: 159–166.
28. Aswani S, Hamilton RJ (2004) Integrating indigenous ecological knowledge and
customary sea tenure with marine and social science for conservation of
bumphead parrotfish (Bolbometopon muricatum) in the Roviana Lagoon,
Solomon Islands. Environmental Conservation 31: 69–83. Available: http://
www.journals.cambridge.org/abstract_S037689290400116X.
29. Aswani S, Lauer M (2006) Incorporating Fishermen’s Local Knowledge and
Behavior into Geographical Information Systems GIS for Designing Marine
Protected Areas in Oceania. Human Organization 65: 81–102.
30. Hall GB, Close CH (2007) Local knowledge assessment for a small-scale fishery
using geographic information systems. Fisheries Research 83: 11–22. Available:
http://linkinghub.elsevier.com/retrieve/pii/S016578360600289X.
31. Scholz A, Bonzon K, Fujita R, Benjamin N, Woodling N, et al. (2004)
Participatory socioeconomic analysis: drawing on fishermen’s knowledge for
marine protected area planning in California. Marine Policy 28: 335–349.
Available: http://linkinghub.elsevier.com/retrieve/pii/S0308597X03001118.
32. Scholz AJ, Steinback C, Kruse S A, Mertens M, Silverman H (2011)
Incorporation of spatial and economic analyses of human-use data in the
design of marine protected areas. Conservation biology: the journal of the
Society for Conservation Biology 25: 485–492. Available: http://www.ncbi.nlm.
nih.gov/pubmed/21175829.
33. Reed MS (2008) Stakeholder participation for environmental management: A
literature review. Biological Conservation 141: 2417–2431. Available: http://
linkinghub.elsevier.com/retrieve/pii/S0006320708002693.
34. Gerhardinger LC, Hostim-Silva M, Medeiros RP, Matarezi J, Bertoncini AA, et
al. (2009) Fishers’ resource mapping and goliath grouper Epinephelus itajara
(Serranidae) conservation in Brazil. Neotropical Ichthyology 7: 93–102.
Spatial Access Priority Mapping with Fishers
PLOS ONE | www.plosone.org 13 July 2013 | Volume 8 | Issue 7 | e68424
Available: http://www.scielo.br/scielo.php?script = sci_arttext&pid = S1679-
62252009000100012&lng = en&nrm= iso&tlng = en.
35. Des Clers S, Lewin S, Edwards D, Searle S, Lieberknecht L & Murphy D (2008)
FisherMap Mapping the Grounds: recording fishermen’s use of the seas. A
report published for the Finding Sanctuary project. Finding Sanctuary website.
Ava i l a b l e : h t t p : // f i nd ing s an c tua r y .ma r i nemapp ing . c om/06_
all%20project%20reports/Fishe rmap%20report%20November%202008.pdf.
Accessed 2012 Aug 11.
36. Wheeler M, Chambers FMJ, Sims-Castley R, Cowling RM, Schoeman D (2008)
From beans to breams: how participatory workshops can contribute to marine
conservation planning. African Journal of Marine Science 30: 475–487.
37. Lee J, South AB, Jennings S (2010) Developing reliable, repeatable, and
accessible methods to provide high-resolution estimates of fishing-effort
distributions from vessel monitoring system (VMS) data. ICES Journal of
Marine Science 67: 1260–1271. Available: http://icesjms.oxfordjournals.org/
cgi/doi/10.1093/icesjms/fsq010.
38. Gerritsen H, Lordan C (2010) Integrating vessel monitoring systems (VMS) data
with daily catch data from logbooks to explore the spatial distribution of catch
and effort at high resolution. ICES Journal of Marine Science 68: 245–252.
Available: http://icesjms.oxfordjournals.org/cgi/doi/10.1093/icesjms/fsq137.
39. Hinz H, Murray LG, Lambert GI, Hiddink JG, Kaiser MJ (2013)
Confidentiality over fishing effort data threatens science and management
progress. Fish and Fisheries 14: 110–117. doi:10.1111/j.1467–
2979.2012.00475.x.
40. DETI (2011) Regional Locational Guidance (RLG ) for Offshore Renewable
Energy Developments in NI Waters. Department of Enterprise, Trade and
Investment. Belfast. Belfast, Northern Ireland. Department of Enterprise, Trade
and Investment website. Available:http://www.detini.gov.uk/regional_
locational_guidance__rlg__for_offshore_renewable_energy_developments_in_
ni_waters. Accessed 2012 Sep 15.
41. DETI (2009) Off shore wind and marine renewable energy in Northern Ireland
strategic environmental assessment (SEA) - Non Technical Summary. Joint
Nature Conservation Committee (JNCC) website. Available: http://jncc.defra.
gov.uk/PDF/0955_Explanatory_Summary.pdf Accessed 2012 Nov 10.
42. The Crown Estate (2012) Successful bidders in Northern Ireland offshore energy
leasing rounds. Crown Estate website. Avaliable: http://www.thecrownestate.co.
uk/news-media/news/2012/northern-ireland-offshore-energy-successful-
bidders/. Accessed 2012 Oct 5.
43. Cappell R, Nimmo F, Rooney L (2012) The value of Irish Sea Conservation
Zones to the Northern Irish Fishing Industry. Report to: Seafish Northern
Ireland Advisory Committee (SNIAC). POSEIDON Aquatic Resource Man-
agement Ltd. Seafish website. Available: http://www.seafish.org/media/
Publications/Poseidon_NI_MCZ_valuation_final_report_August_2012__2_.
pdf Accessed 2012 Oct 5.
44. ICES (2009) Report of the Benchmark Workshop on Nephrops (WKNEPH ).
Aberdeen, UK.
45. AFBI (n.d.) Inshore Fisheries - Scallops. Available: http://www.afbini.gov.uk/
index/services/services-specialist-advice/coastal-science/inshore-fisheries/
services-inshore-fisheries-bivalve-molluscs.htm. Agri-food and Biosciences In-
stiute website. Accessed 2012 Nov 10.
46. ICES (2012) ICES IBTSWG Report 2012 Report of the International Bottom
Trawl Survey Working Group (IBTSWG ): 27–30. March 2012, Lorient,
France. ICES CM 2012/SSGESST: 03. 323 p.
47. Yates KL, Payo Payo A, Schoeman DS (2013) International, regional and
national commitments meet local implementation: A case study of marine
conservation in Northern Ireland. Marine Policy 38: 140–150. Available: http://
linkinghub.elsevier.com/retrieve/pii/S0308597X12001285.
48. Yates K (2012) Mapping the spatial access priorities of the Northern Ireland
Fishing Fleet. The Diverse Seas Project, University of Ulster, Northern Ireland.
University of Ulster, Environmental Science Research Institute website.
Available: http://www.science.ulster.ac.uk/esri/Katherine-Yates.html. Ac-
cessed 2013 Jun 12.
49. Kelley K, Clark B, Brown V, Sitzia J (2003) Good practice in the conduct and
reporting of survey research. International journal for quality in health care:
journal of the International Society for Quality in Health Care/ISQua 15: 261–
266. Available: http://www.ncbi.nlm.nih.gov/pubmed/12803354.
50. Pacific States Marine Fisheries Commission (2002) West Coast Catcher Boat
Survey Summary 1997–1998. Seattle. Pacific States Marine Fisheries Commis-
sion website. Avaliable : http://www.psmfc.org/efin/abstracts-data.html. Ac-
cessed 2013 Jan 20.
51. Close CH, Hall GB (2006) A GIS-based protocol for the collection and use of
local knowledge in fisheries management planning. Journal of environmentalmanagement 78: 341–352. Available: http://www.ncbi.nlm.nih.gov/pubmed/
16115723.
52. Thornton TF, Scheer AM (2012) Collaborative Engagement of Local andTraditional Knowledge and Science in Marine Environments: A Review.
Ecology and Society 17. Available: http://www.ecologyandsociety.org/vol17/iss3/art8/.
53. Stringer LC, Reed MS, Dougill AJ, Seely MK, Rokitzki M (2007) Implementing
the UNCCD: Participatory challenges. Natural Resources Forum 31: 198–211.Available: http://doi.wiley.com/10.1111/j.1477-8947.2007.00154.x.
54. Yaffee SL (1996) Ecosystem management in practice: the importance of humaninstitutions. Ecological Applications 6: 724–727.
55. Duane T (1997) Community Participation in Ecosystem Management. EcologyLaw Quarterly 24: 771–797.
56. Smith AH, Berkes F (1991) Solutions to the ‘‘Tragedy of the Commons’’: Sea-
urchin Management in St Lucia, West Indies. Environmental Conservation 18:131 . Ava i lab le : h t tp ://www. journa l s . cambr idge .org/abs t rac t_
S0376892900021706.57. Roberts CM, Andelman S, Branch G, Bustamante RH, Castilla JC, et al. (2003)
Ecological criteria for evaluating candidate sites for marine reserves. Ecological
ApplicationsVol13, suppl1 13: S199–S214.58. Klein CJ, Chan A, Kircher L, Cundiff AJ, Gardner N, et al. (2008) Striking a
balance between biodiversity conservation and socioeconomic viability in thedesign of marine protected areas. Conservation biology: the journal of the
Society for Conservation Biology 22: 691–700. Available: http://www.ncbi.nlm.nih.gov/pubmed/18325043.
59. Richardson EA, Kaiser MJ, Edwards-Jones G, Possingham HP (2006) Sensitivity
of Marine-Reserve Design to the Spatial Resolution of Socioeconomic Data.Conservation Biology 20: 1191–1202.
60. Moore J, Balmford A, Allnutt T, Burgess N (2004) Integrating costs intoconservation planning across Africa. Biological Conservation 117: 343–350.
Available: http://linkinghub.elsevier.com/retrieve/pii/S0006320704000023.
61. Cudney-Bueno R, Basurto X (2009) Lack of cross-scale linkages reducesrobustness of community-based fisheries management. PloS one 4: e6253.
Ava i l ab l e : h t t p ://www.pubmedcen t ra l . n ih . gov/a r t i c l e r ende r .fcgi?artid = 2705799&tool = pmcentrez&rendertype = abstract.
62. Johannes RE, Freeman MMR, Hamilton RJ (2000) Ignore fishers ’ knowledgeand miss the boat. Fish and Fisheries 1: 257–271.
63. Fischer A, Young JC (2007) Understanding mental constructs of biodiversity:
Implications for biodiversity management and conservation. Biological Conser-vation 136: 271–282. Available: http://linkinghub.elsevier.com/retrieve/pii/
S0006320706005313.64. Silvano RAM, Begossi A (2009) What can be learned from fishers? An integrated
survey of fishers’ local ecological knowledge and bluefish (Pomatomus saltatrix)
biology on the Brazilian coast. Hydrobiologia 637: 3–18. Available: http://www.springerlink.com/index/10.1007/s10750-009-9979-2.
65. Silvano RAM, Valbo-Jørgensen J (2008) Beyond fishermen’s tales: contributionsof fishers’ local ecological knowledge to fish ecology and fisheries management.
Environment, Development and Sustainability 10: 657–675. Available: http://www.springerlink.com/index/10.1007/s10668-008-9149-0.
66. Burton P, Goodlad R, Croft J, Abbott J, Hastings A, et al. (2004) What works in
community involvement in area-based initiatives? A systematic review of theliterature. Available: http://webarchive.nationalarchives.gov.uk/
20110218135832/http://rds.homeoffice.gov.uk/rds/pdfs04/rdsolr5304.pdf.67. National Research Council (2008) Public participation in environmental
assessment and decision making. National Acedemy Press. Washington, D.C.
The National Academies Press Website. Avaliable: http://www.nap.edu/catalog.php?record_id = 12434. Accessed 2012 Sep 12.
68. Turner M, Weninger Q (2005) Meetings with Costly Participation: An EmpiricalAnalysis. Review of Economic Studies 553: 247–268.
69. Klein CJ, Steinback C, Watts M, Scholz AJ, Possingham HP (2010) Spatial
marine zoning for fisheries and conservation. Frontiers in Ecology and theEnvironment 8: 349–353. Available: http://www.esajournals.org/doi/abs/10.
1890/090047.70. Scholz A, Birney K, Bonzon K, Chan C, Hamrin S, et al. (2006) Commercial
fishing grounds and their relative importance off the Central Coast of California.Report to the California Marine Life Protection Act Initiative. Ecotrust.
California Department of Fish and Wildlife website. Available: http://www.dfg.
ca.gov/marine/pdfs/agenda_workshop041807_report.pdf. Accessed 2012 Feb15.
Spatial Access Priority Mapping with Fishers
PLOS ONE | www.plosone.org 14 July 2013 | Volume 8 | Issue 7 | e68424
Recommended