Southern Tasmania
Regional Land Use Strategy
Background Report No.8: The Regional Transport System
September 2010
This document is detailed supporting information for the Regional Land Use Strategy for Southern
Tasmania.
While every responsible effort has been made to ensure that this document is correct at the time of
printing, the State of Tasmania, the Southern Tasmanian Councils Authority, the 12 Southern
Councils and the Sullivans Cove Waterfront Authority, its agents and employees, disclaim any and all
liability to any person in respect of anything or the consequences of anything done or omitted to be
done in reliance or upon the whole or any part of this document.
Please visit www.stca.tas.gov.au or telephone the Southern Tasmanian Councils Authority on
61 3 6270 2242 with any queries.
Acknowledgements
This background report has been produced with the assistance of the Department of Infrastructure
Energy & Resource. Information in this report is strongly derived from the work associated with the
Southern Integrated Transport Plan (a joint initiative of the Southern Tasmanian Councils Authority
and the Department of Infrastructure, Energy & Resources). This report is intended to provide an
overview of the aspects of the regional transport system that are relevant to the preparation of a
regional land use Strategy only.
More detailed information on the regional transport system can be obtained from the Southern Region
Background Report (November 2006).
Contents
1. Introduction 1
1.1 Overview 1
1.2 Transport Planning Responsibilities 1
1.3 The Region’s Transport System 2
1.4 Strategic Planning and Analysis 8
2. Development of the Region’s Transport System 9
3. Integrated Transport and Land Use Planning 11
4. Accessibility 13
5. Passenger Movements 20
5.1 Road Network 20
5.2 Public transport 22
5.3 Walking and cycling 25
5.4 Strategic planning and analysis 26
5.5 Future directions 31
6. Land Transport Freight Network 34
6.1 Major freight routes 34
6.2 Rail 37
6.3 Strategic planning and analysis 38
6.4 Future directions 38
7. Marine and Aviation Transport Systems 39
8. Towards better integration 45
9. References 48
Figure Index
Figure 1: Regional Overview of major passenger patterns 6
Figure 2: Regional Overview: Major Freight patterns and commodities 7
Figure 3: Isolated planning focused on car-based mobility 13
Figure 4: Coordinated metropolitan land use and transport planning, focused on accessibility 14
Figure 5: Existing densities in Greater Hobart, Bridgewater to Lutana 16
Figure 6: Existing densities in Greater Hobart, Lutana to Sandy Bay 17
Figure 7: Existing densities in Greater Hobart, Risdon Vale to Lauderdale 18
Figure 8: Existing densities in Greater Hobart, Sandy Bay to Blackmans Bay 19
Figure 9: Tasmanian State Road Hierarchy 21
Figure 10: Greater Hobart Passenger Transport Overview Map 24
Figure 11: JTW journey source by private motor vehicle 28
Figure 12: Journey to Work changes over time in Greater Hobart 29
Figure 13: JTW Source for Greater Hobart, 2006 30
Figure 14: JTW Source for remainder of Southern Tasmania, 2006 30
Figure 15: Overview of Southern Tasmanian Transport Links 36
Figure 16: Imports and Exports through Tasmania’s Major Ports, mass tonnage 40
Figure 17: Port throughput and relationship to Southern Region 42
Figure 18: Passenger Numbers for Tasmania’s Major Airport 43
Page | 1
Southern Tasmania Regional Land Use Strategy
The Regional Transport System
1. Introduction
1.1 Overview
Transport is an essential part of community life as it enables access to work, schools, shops and health
facilities, to visit friends and to participate in recreational activities. In terms of industry, it facilitates the
movement of goods between resource areas, processing points and markets. The transport system in
Southern Tasmania is highly influenced by geographical considerations.
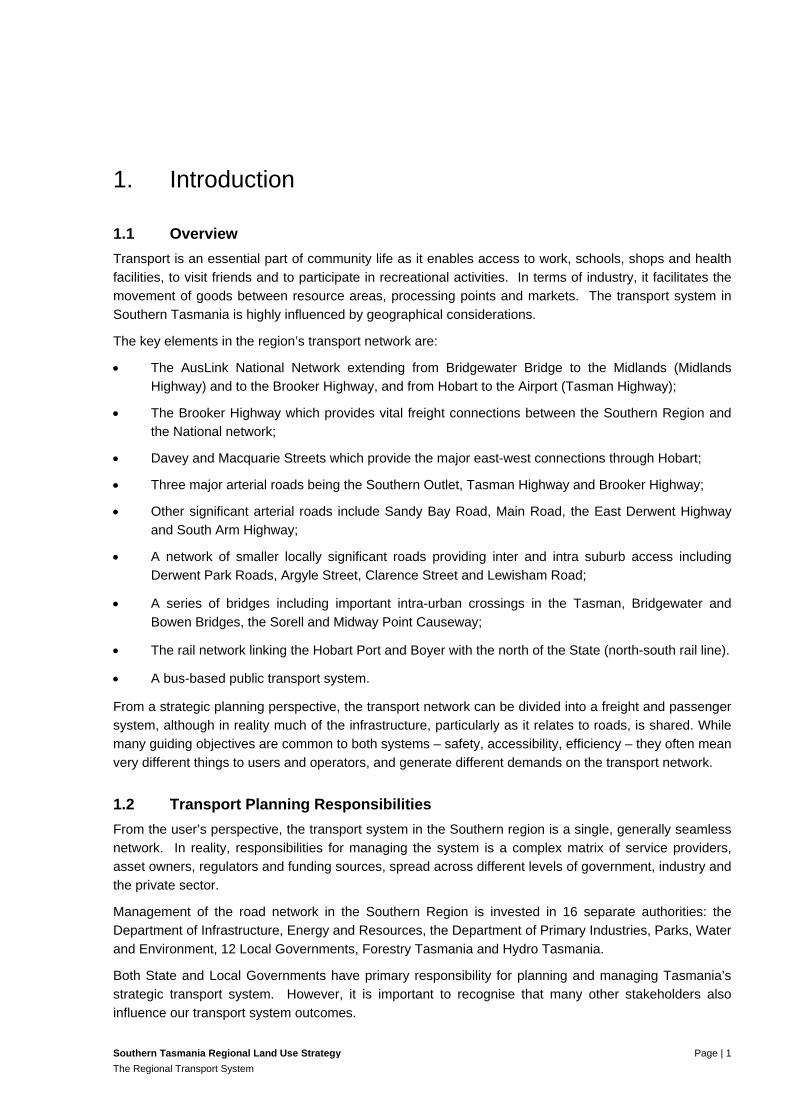
The key elements in the region’s transport network are:
The AusLink National Network extending from Bridgewater Bridge to the Midlands (Midlands
Highway) and to the Brooker Highway, and from Hobart to the Airport (Tasman Highway);
The Brooker Highway which provides vital freight connections between the Southern Region and
the National network;
Davey and Macquarie Streets which provide the major east-west connections through Hobart;
Three major arterial roads being the Southern Outlet, Tasman Highway and Brooker Highway;
Other significant arterial roads include Sandy Bay Road, Main Road, the East Derwent Highway
and South Arm Highway;
A network of smaller locally significant roads providing inter and intra suburb access including
Derwent Park Roads, Argyle Street, Clarence Street and Lewisham Road;
A series of bridges including important intra-urban crossings in the Tasman, Bridgewater and
Bowen Bridges, the Sorell and Midway Point Causeway;
The rail network linking the Hobart Port and Boyer with the north of the State (north-south rail line).
A bus-based public transport system.
From a strategic planning perspective, the transport network can be divided into a freight and passenger
system, although in reality much of the infrastructure, particularly as it relates to roads, is shared. While
many guiding objectives are common to both systems – safety, accessibility, efficiency – they often mean
very different things to users and operators, and generate different demands on the transport network.
1.2 Transport Planning Responsibilities
From the user’s perspective, the transport system in the Southern region is a single, generally seamless
network. In reality, responsibilities for managing the system is a complex matrix of service providers,
asset owners, regulators and funding sources, spread across different levels of government, industry and
the private sector.
Management of the road network in the Southern Region is invested in 16 separate authorities: the
Department of Infrastructure, Energy and Resources, the Department of Primary Industries, Parks, Water
and Environment, 12 Local Governments, Forestry Tasmania and Hydro Tasmania.
Both State and Local Governments have primary responsibility for planning and managing Tasmania’s
strategic transport system. However, it is important to recognise that many other stakeholders also
influence our transport system outcomes.
Page | 2
Southern Tasmania Regional Land Use Strategy
The Regional Transport System
The State Government provides overall direction for the development and management of Tasmania’s
transport system through its strategic transport planning and policy frameworks, including the Tasmanian
Infrastructure Strategy and Tasmanian Urban Passenger Transport Framework. Its primary
responsibilities are:
statewide transport policy for all modes, including safety;
State roads and rail – owner and manager of assets, policy, planning and safety;
public passenger transport (including community transport) – policy, planning, part funding;
statewide climate change and environmental policies.
Local Government is primarily responsible for transport and land use planning at a local level. Its primary
responsibilities are:
land use planning – strategic and statutory planning;
local roads – owner and manager of assets, policy, planning and safety;
local area transport – local cycling and walking connections;
community transport – part funding, provider;
community road safety partnerships; and
local climate change and environmental policies.
The private sector and Government Business Enterprises also play an important role in the transport
system. In the Southern Region, these organisations provide public transport (e.g. Metro Tasmania),
road and rail freight services and own and manage the Hobart air and sea ports.
Decisions by the private sector can have a significant impact on the size and nature of the transport task
such as the mode used to transport freight and the location and size of development. These decisions
are commercial decisions that government at any level cannot always influence.
1.3 The Region’s Transport System
Road-based transport, by car and truck, is the dominant transport mode in the Southern Region. Initial
results from the Greater Hobart Household Travel Survey conducted in 2009 indicate that car-based trips
account for nearly 75% of household trips in Greater Hobart. Generally, car-based trips account for a
greater proportion of trips in outer areas (e.g. Sorell, Derwent Valley and Brighton) than inner areas, such
as Hobart and Glenorchy.
Over the past decade, the number of cars has increased by 14% and total car kilometres travelled has
increased by 17%. Motorcycles represent 4% of passenger vehicles. Vehicle ownership is higher in rural
areas, reflecting limited public transport options and the need to travel greater distances to access key
services.
The Southern Region has an extensive road network, connecting rural and urban areas, and providing
links to Tasmania’s other regions. In terms of road length, the majority of the road network in the
Southern Region is owned by Local Government, but the State Road network carries the most intensive
freight and passenger task and connects all major population centres, export points and major industrial
areas. For example, the State Road network carried 72% of Tasmania’s heavy freight task in tonne-
kilometres in 2005/06.
Page | 3
Southern Tasmania Regional Land Use Strategy
The Regional Transport System
The large extent of the existing road network, combined with high maintenance costs and budgetary
constraints, has seen a shift towards maximising the use of the existing network, over expanding
capacity through new construction.
1.3.1 Key inter-regional links
The Midland Highway is the Southern Region’s major passenger and freight link to northern Tasmania,
supporting the strong import and export reliance of the region on the three northern ports. In 2005/06, the
Highway carried around two million tonnes of freight.
Tasmania’s rail network provides a key inter-regional and intra-state link for heavy freight transport. The
State Government regained ownership of the line and below-rail infrastructure in 2007 and the above-rail
operation reverted to State Ownership in December 2009.
In the Southern Region, the rail system is primarily used to move containers and bulk import/export
commodities between Hobart and the northern ports. In 2005/06, rail carried over 350,000 tonnes of
containers and 660,000 tonnes of bulk freight between Hobart and Launceston. Rail remains a key
modal alternative for inter-regional freight movements from the Southern Region.
1.3.2 Key regional links
Regional roads play an important role in moving freight from resource and industrial areas to export and
processing points. In the Southern Region, regional roads move predominantly forestry,
agriculture/aquaculture and local construction materials. Strategic regional roads in the region include:
Tea Tree-Fingerpost Roads (high-productivity route, Brighton to Triabunna);
Tasman Highway (to Hobart Airport and Triabunna port);
Huon Highway, Geeveston to the Southern Outlet; and
Lyell Highway, New Norfolk to Granton.
1.3.3 Key metropolitan links
There are four key metropolitan links in the Greater Hobart area:
Brooker Highway;
Tasman Highway;
Southern Outlet; and
Macquarie Street - Davey Street couplet.
The Brooker Highway carries a high freight and passenger task, with sections of the Highway carrying up
to 50,000 vehicles a day, and moving over two million tonnes of freight at a value of $2.5 billion per
annum. The Highway is the major urban network in the broader north-south freight and passenger link
that connects southern distribution centres to the northern ports.
The Tasman Highway runs from Hobart to Launceston via the East Coast, but the key section of the
Tasman Highway for metropolitan Hobart is between the Hobart CBD and Hobart International Airport.
This section is a strategic passenger route for the Hobart metropolitan area, with daily vehicle numbers
approaching 65 000 over the Tasman Bridge. The Tasman Highway provides access to eastern Hobart,
Page | 4
Southern Tasmania Regional Land Use Strategy
The Regional Transport System
including existing and expanding industrial and commercial areas at Rosny, Mornington, Cambridge and
Hobart International Airport, and expanding residential areas.
The Macquarie/Davey Streets Couplet is the key link through central Hobart, linking southern
municipalities to the Brooker and Tasman Highways.
The Southern Outlet carries just over 30,000 vehicles per day, much less than the Brooker and Tasman
Highways, but it provides a key link for the Kingborough and Huon Valley areas to the Hobart CBD and
areas to the north.
1.3.4 Key sea ports
The role of Hobart Port in Tasmania’s bulk freight and container market has declined over the past
decade, with 86% of the exports and 99% of imports from the Southern Region moved via the northern
ports in 2005/06. Macquarie Point’s task is generally less than 100,000 tonnes per year. This trend is
expected to continue over the long term, reflecting international shipping trends such as the consolidation
of services on major international routes and the additional cost of travel to Hobart. Other major exports
via ports from the Southern Region move predominantly via the Triabunna port (woodchips) and
Nyrstar’s port facility. Around 400,000 tonnes of fuel is imported each year through Selfs Point.
1.3.5 Key airports
Hobart International Airport is Tasmania’s major passenger airport, catering for over half of all passenger
arrivals in the State. As such, the Airport is key to the region’s tourism industry, along with other
businesses in the Southern Region.
Although only about 1% of Tasmania’s freight (by mass) is carried by air, it is a critical mode for high
value, time sensitive freight.
1.3.6 Public transport
The public transport system in the Southern Region is bus-based. Metro Tasmania provides the majority
of bus services within metropolitan Hobart, with bus services to urban fringe areas and regional
communities from private providers. These core services are supplemented by school-bus services and
community transport in rural and regional areas. Taxi services provide additional flexibility to the system,
by providing services when scheduled public transport services are not available.
Metro Tasmania experienced small but progressive declines in patronage from the 1990s. Patronage
stabilised from 2000 onwards, with recent increases over the last year. As late as the mid-1980s, over
10% of people travelled to work on public transport; by 2006, that number had fallen to 6.3% in Hobart.
This is different to the experience in other Australian cities, which have had significant growth in
patronage over the last few years.
The existing bus networks in the Southern Region provide a service coverage and frequency
commensurate with existing funding, with some higher frequency routes in major urban areas. However,
the Tasmanian Government has developed the Tasmanian Urban Passenger Transport Framework to
set a future direction for passenger transport in Tasmania's urban areas.
Consistent with the directions in the Framework, Metro Tasmania has recently undertaken a detailed
review of services to southern and eastern Hobart, which has resulted in the development of higher
frequency trunk corridors and a more consistent spread of services across different areas.
Page | 5
Southern Tasmania Regional Land Use Strategy
The Regional Transport System
Services to urban fringe communities have also been reassessed as a result of the Core Passenger
Services Review. Operators are investing in new vehicles, and a standard fare structure is being
introduced on the different urban fringe services, removing earlier inconsistencies. New contracts also
provide a greater role for community consultation, and require operators to articulate their future service
development plans.
1.3.7 Active transport
Many of our daily trips are under 2km, making walking and cycling a viable transport mode for most
people. Walking and cycling can also complement other modes, such as walking or cycling to the bus
stop, or combining walking or cycling with a car trip.
Toward increasing use of active transport, the Tasmanian Government has developed the Tasmanian
Walking and Cycling for Active Transport Strategy, to develop our transport and land use systems to
create a more supportive and encouraging environment for pedestrians and cyclists.
Hobart already has the highest proportion of people walking to work of Australia’s capital cities.
Preliminary results from the Greater Hobart Household Travel Surveys show walking is a major transport
mode for many people in undertaking their daily trips, comprising nearly 20% of trips across Greater
Hobart.
Cycling is also an important active transport mode, comprising nearly 1% of trips across Greater Hobart,
and Journey to Work data from the Australian Census indicates that use of cycling as a transport mode
to work in Greater Hobart has been increasing over the last 10 years.
Page | 6
Southern Tasmania Regional Land Use Strategy
The Regional Transport System
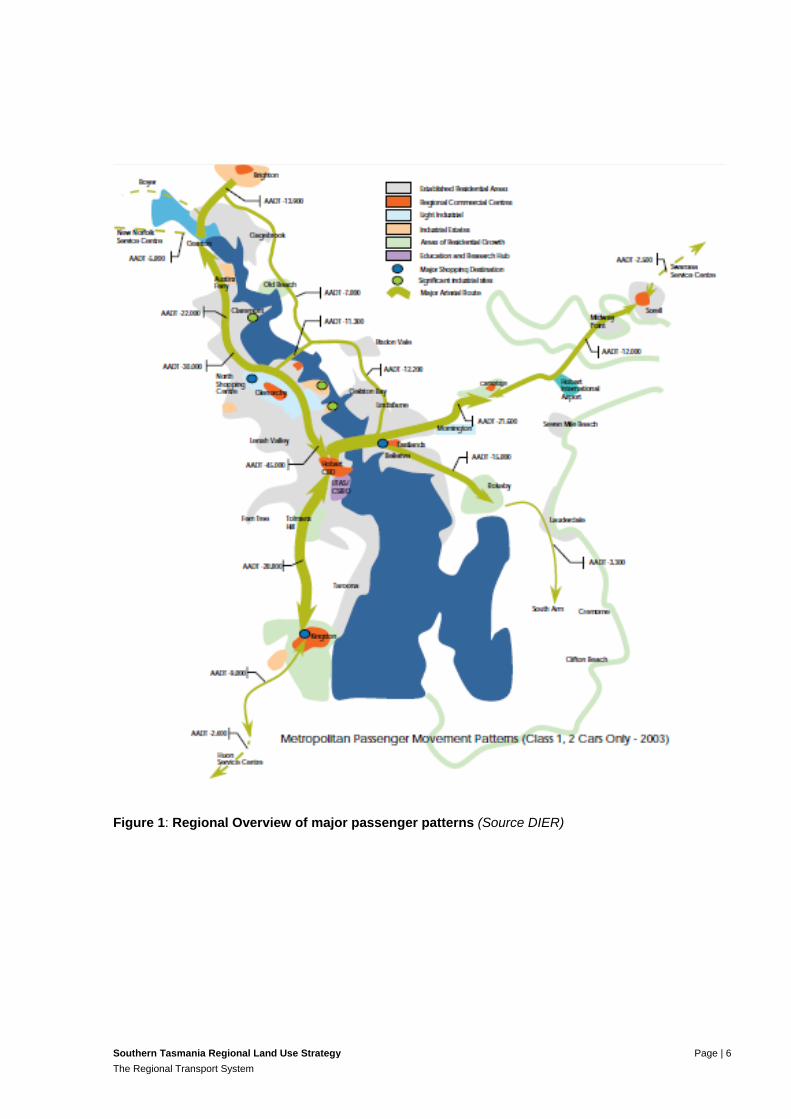
Figure 1: Regional Overview of major passenger patterns (Source DIER)
Page | 7
Southern Tasmania Regional Land Use Strategy
The Regional Transport System
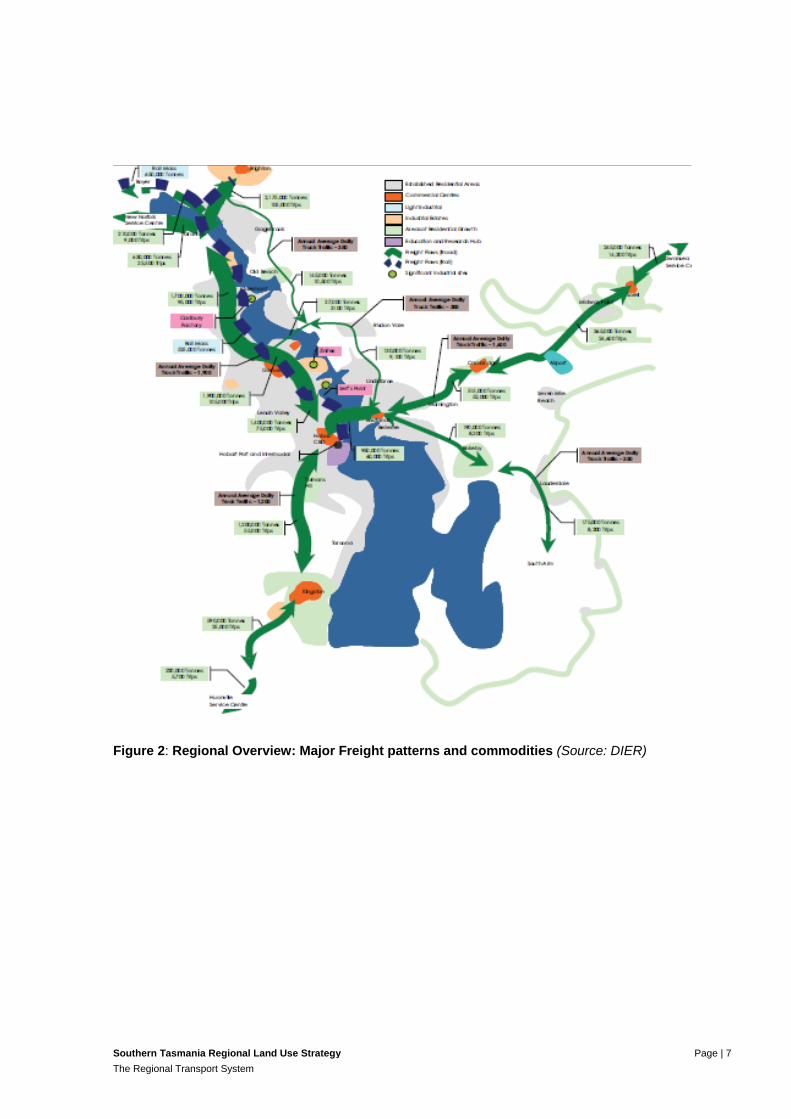
Figure 2: Regional Overview: Major Freight patterns and commodities (Source: DIER)
Page | 8
Southern Tasmania Regional Land Use Strategy
The Regional Transport System
1.4 Strategic Planning and Analysis
Evidence-based planning describes the use of data and analysis to better understand strategic planning
issues and develop workable responses. The Tasmanian Government has invested significant resources
in developing its data and analytical planning capabilities to better understand the Tasmanian transport
system and inform transport planning. This includes:
major freight and passenger travel surveys, which provide real information on where people and
freight are travelling, how and why;
the State Infrastructure Planning System (SIPS), a GIS based system that integrates data across
key infrastructure sectors and supports the spatial representation of information;
traffic counts and micro-simulation to model localised impacts and responses.
Access to good data is critical for all transport planning organisations.
Page | 9
Southern Tasmania Regional Land Use Strategy
The Regional Transport System
2. Development of the Region’s Transport System
Changes in transport technology have strongly influenced the pattern of urban growth in Tasmania.
Early last century, most activities in towns and cities occurred within a short distance of each other, with
a greater mixing of different types of land use within relatively short distances. The compact nature of our
early settlements was shaped by the transport options available then - people walked, rode horses, or
used horse drawn vehicles to travel to work, obtain goods and services and socialise. Cities were
compact because people had to be close to their working environment.
Between 1920 and 1940, the expansion of rail and tram networks around the Hobart CBD meant that
people could live further away from where they worked and visit places further afield for shopping and
socialising. Manufacturing and industrial uses moved to outer urban areas with the development of retail
and service functions in subregional centres such as Rosny and Glenorchy with rural land on the fringe
being converted to residential developments.
Evolution of Hobart’s urban passenger transport system
Hobart’s first public transport system, providing enhanced mobility for the majority of the population living
within densely populated inner suburbs was provided by dedicated tram networks, opened in 1893. By
the 1920s, Hobart had a rail system that supplemented the tram system and provided limited services to
more isolated communities. The high patronage for public transport during these times was due to the
relatively low level of car ownership, and compact urban development patterns.
After WWII, there was a significant increase in car ownership, supported by a housing boom, which saw
major growth in housing estates on the urban fringe, away from existing public road and rail transport
infrastructure. In the south of Tasmania, construction of the Tasman Bridge and Southern Outlet led to
significant residential development by reducing travel times to outlying areas for car owners and
improving access to services.
With increased car use and investment in the road network, public transport patronage declined and tram
services ceased in 1960. In some cases, trams were replaced by trolley bus services, with services
ultimately being replaced by motorised buses.
Further changes in work patterns and urban settlement also saw the demise of specialised, high capacity
rail services. Workers’ trains for Cadburys and the Zinc Works in Hobart had carried upwards of 400-600
passengers during peak demand. As car use increased, patronage on Hobart’s suburban rail line
experienced a steady decline from the 1950s, with services ceasing in 1974.
In contrast to rail, bus services were seen as flexible, able to be quickly introduced into new suburbs and
capable of accessing a higher proportion of the population compared to trams or heavy rail. Major bus
routes continued to operate on the same corridors as the trams they replaced, even using the same
stops. However, routes could be altered throughout the day in response to demand, and could expand
into areas not accessible by rail services.
As Hobart’s footprint has grown, its bus system has developed to operate a ‘high density, low frequency’
network. This development has enabled bus services to extend outwards with new suburbs, but at the
cost of providing low frequency services. The pattern of development over the last 60 years has seen the
development of land first, with transport services reacting later.
Page | 10
Southern Tasmania Regional Land Use Strategy
The Regional Transport System
The physical geography of Hobart has had a profound influence on the city’s urban form. Unlike other
cities with access to flat and accessible areas of adjacent land, Hobart is limited by hilly terrain – Mount
Wellington, Meehan Range – and river crossings – Derwent River, Pittwater Lagoon. These constraints
have had a major influence on urban form, including the use, development and rate of conversion of
land.
From the 1960’s onward, cars have become the dominant mode of transport, due to increasing levels of
both affordability and ownership. The significant personal travel flexibility and mobility provided by the
private car resulted in the expansion of previously compact settlement patterns, into less dense, car-
oriented patterns. Urban expansion in the region has been facilitated by the construction of major arterial
roads, including the Southern Outlet, which led to rapid growth in Kingston and Blackmans Bay.
This focus on car-based transport has led to dispersed and often low-density suburbs, although some
consolidation has now occurred around sub-regional centres. This pattern of development has made the
provision of public transport services increasingly difficult, with low frequency services spread over many
lower-density suburbs. This is not helped by cul-de-sac style subdivisions, which necessitate slower,
more circuitous bus routes, and often mean buses cannot access individual streets or parts of suburbs.
Over the past few decades, the population of Hobart’s outer urban fringe areas has increased in
response to a range of factors, including new and upgraded road networks which reduced travel times,
housing affordability and more recently, lifestyle choices to live in coastal or rural areas. These choices
have been made possible through the increased affordability of private motor vehicles, but the social and
accessibility impacts for some have been significant.
From the 1960s onwards, large areas of affordable fringe urban land was converted to large scale public
housing estates in areas such as Bridgewater/Gagebrook, Clarendon Vale and Risdon Vale. Transport
costs generally represent a higher proportion of household expenditure in these areas, due to higher
running costs of vehicles and lack of viable alternatives to car-based transport. Coordination with the
existing public transport network, access to essential services and the adequacy of local shops or
schools were also poorly considered, with the outcome that locational disadvantage has compounded
existing social disadvantage (Forster 1999).
Recent increased housing costs have resulted in spatial polarisation with inner suburbs representing
higher housing prices and generally lower prices on the outskirts. The recent increases in house prices
have increased the value of both central and fringe property. Housing costs have always been higher in
more desirable locations, and these locations are often in the inner suburbs. Furthermore, large tracts of
vacant land on the fringes of Hobart are drawing people out onto the fringes. Increases in population
growth in areas that do not allow for controls on subdivision to increase density in core areas will only
allow the market to continue to deliver land at the fringes. The housing affordability crisis has pushed
people out to the fringes where land is cheaper (partly due to the subsidisation of physical infrastructure
provision such as water and sewerage).
Page | 11
Southern Tasmania Regional Land Use Strategy
The Regional Transport System
3. Integrated Transport and Land Use Planning
The major elements influencing the region’s transport system into the future include:
highly dispersed settlements,
an increasing freight task (heavy and light commercial),
limited capacity to expand the current road system
ageing transport infrastructure,
rising private car dependence,
complex trip patterns, low use of public transport and
demographic changes, including an ageing population.
To date, the lack of regional and state strategic land use planning has resulted in poorly integrated land
use and transport planning frameworks. Many past transport infrastructure projects within the region
have supported significant expansion of outer urban areas, including the development of sub-regional
centres. For example, duplication of the Southern Outlet led to significant expansion of Kingston and
Blackmans Bay, and the Tasman Highway (Warrane to Hobart Airport) led to significant growth in Sorell,
Acton and Seven Mile Beach.
By shaping the pattern of development and influencing the location, scale, density, design and mix of
land uses, land use planning influences where we need to travel, total distances and choice of transport
modes. Better integration of transport and land use planning can reduce travel demand by locating
people and activities closer together, reducing both the need to travel and overall trip lengths, as well as
improving the viability and therefore attractiveness of non-car transport modes for households. Other
benefits include:
reduce dependency on car-based travel,
provide a choice of sustainable travel modes including walking and cycling,
reduce travel distances,
reduce the pressure on valuable open space and industrial land
improve freight access to key freight terminals and industrial centres; and
protect major infrastructure from inappropriate adjacent land uses.
Greater integration between land use planning and transport should focus on the movement of goods
and people rather than the dependency on cars. Land use planning strategies should encourage urban
consolidation and development in locations that are based on existing social and physical infrastructure,
such as high frequency public transport routes. Land use should also consider the safety and efficiency
of transport networks and the impact inappropriate adjacent land uses can have on these networks – for
example, excessive property access, residential subdivisions adjacent to major freight routes or rail lines.
This can be done through a number of means including:
Ensuring new residential developments are located with access to established and proposed
transport networks including public transport, walking and cycling paths;
Page | 12
Southern Tasmania Regional Land Use Strategy
The Regional Transport System
Supporting high-frequency public transport corridors, providing direct access to key activity centres
and destinations
Encouraging activity intensive, transport oriented development, including high employment
generating developments, shopping centres, schools and health facilities in locations that are
accessible to public transport, walking and cycling networks; and
Ensuring that planned transport routes accommodate other transport modes.
Ensuring that the design of subdivisions supports public transport access and includes good
standard walking and cycling linkages
Promoting appropriate development adjacent to major transport routes and hubs.
Page | 13
Southern Tasmania Regional Land Use Strategy
The Regional Transport System
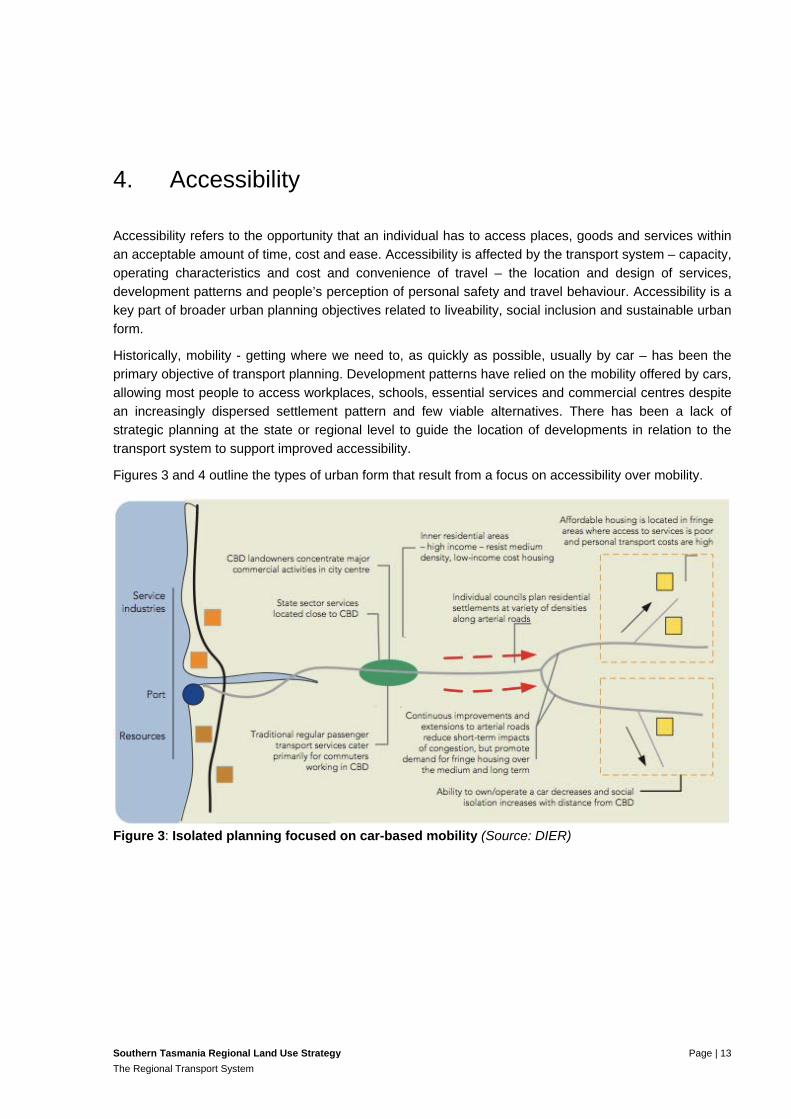
4. Accessibility
Accessibility refers to the opportunity that an individual has to access places, goods and services within
an acceptable amount of time, cost and ease. Accessibility is affected by the transport system – capacity,
operating characteristics and cost and convenience of travel – the location and design of services,
development patterns and people’s perception of personal safety and travel behaviour. Accessibility is a
key part of broader urban planning objectives related to liveability, social inclusion and sustainable urban
form.
Historically, mobility - getting where we need to, as quickly as possible, usually by car – has been the
primary objective of transport planning. Development patterns have relied on the mobility offered by cars,
allowing most people to access workplaces, schools, essential services and commercial centres despite
an increasingly dispersed settlement pattern and few viable alternatives. There has been a lack of
strategic planning at the state or regional level to guide the location of developments in relation to the
transport system to support improved accessibility.
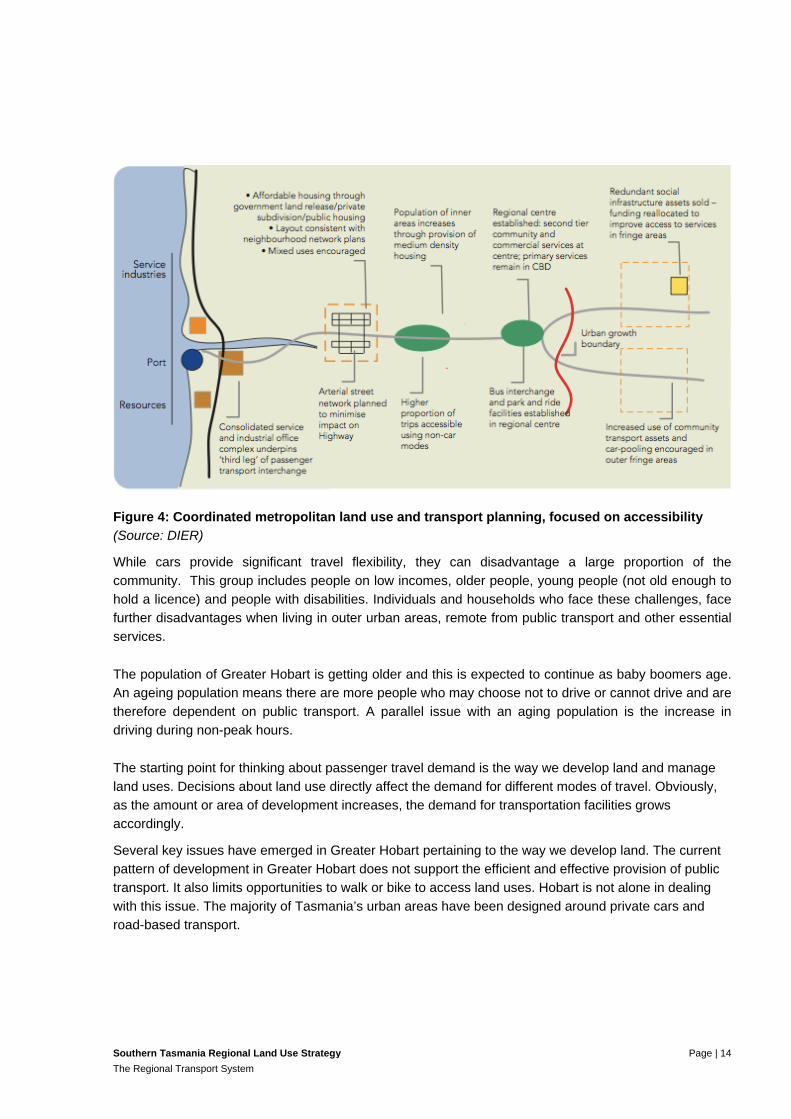
Figures 3 and 4 outline the types of urban form that result from a focus on accessibility over mobility.
Figure 3: Isolated planning focused on car-based mobility (Source: DIER)
Page | 14
Southern Tasmania Regional Land Use Strategy
The Regional Transport System
Figure 4: Coordinated metropolitan land use and transport planning, focused on accessibility
(Source: DIER)
While cars provide significant travel flexibility, they can disadvantage a large proportion of the
community. This group includes people on low incomes, older people, young people (not old enough to
hold a licence) and people with disabilities. Individuals and households who face these challenges, face
further disadvantages when living in outer urban areas, remote from public transport and other essential
services.
The population of Greater Hobart is getting older and this is expected to continue as baby boomers age.
An ageing population means there are more people who may choose not to drive or cannot drive and are
therefore dependent on public transport. A parallel issue with an aging population is the increase in
driving during non-peak hours.
The starting point for thinking about passenger travel demand is the way we develop land and manage
land uses. Decisions about land use directly affect the demand for different modes of travel. Obviously,
as the amount or area of development increases, the demand for transportation facilities grows
accordingly.
Several key issues have emerged in Greater Hobart pertaining to the way we develop land. The current
pattern of development in Greater Hobart does not support the efficient and effective provision of public
transport. It also limits opportunities to walk or bike to access land uses. Hobart is not alone in dealing
with this issue. The majority of Tasmania’s urban areas have been designed around private cars and
road-based transport.
Page | 15
Southern Tasmania Regional Land Use Strategy
The Regional Transport System
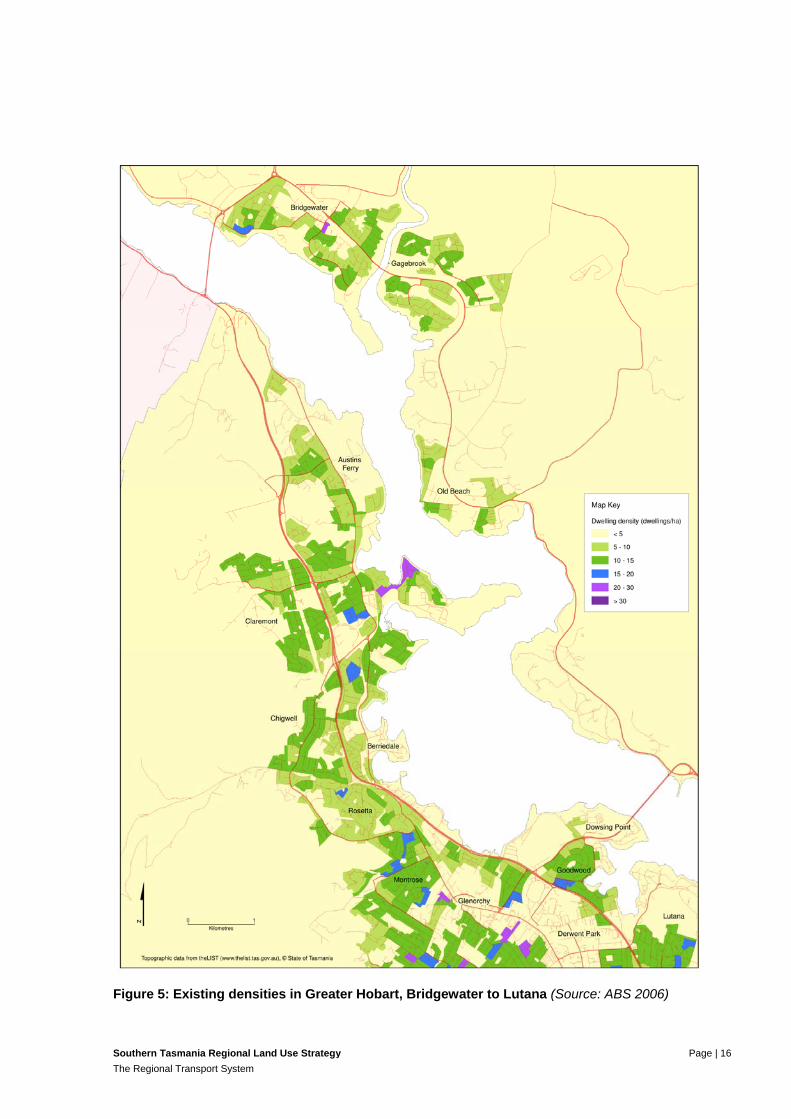
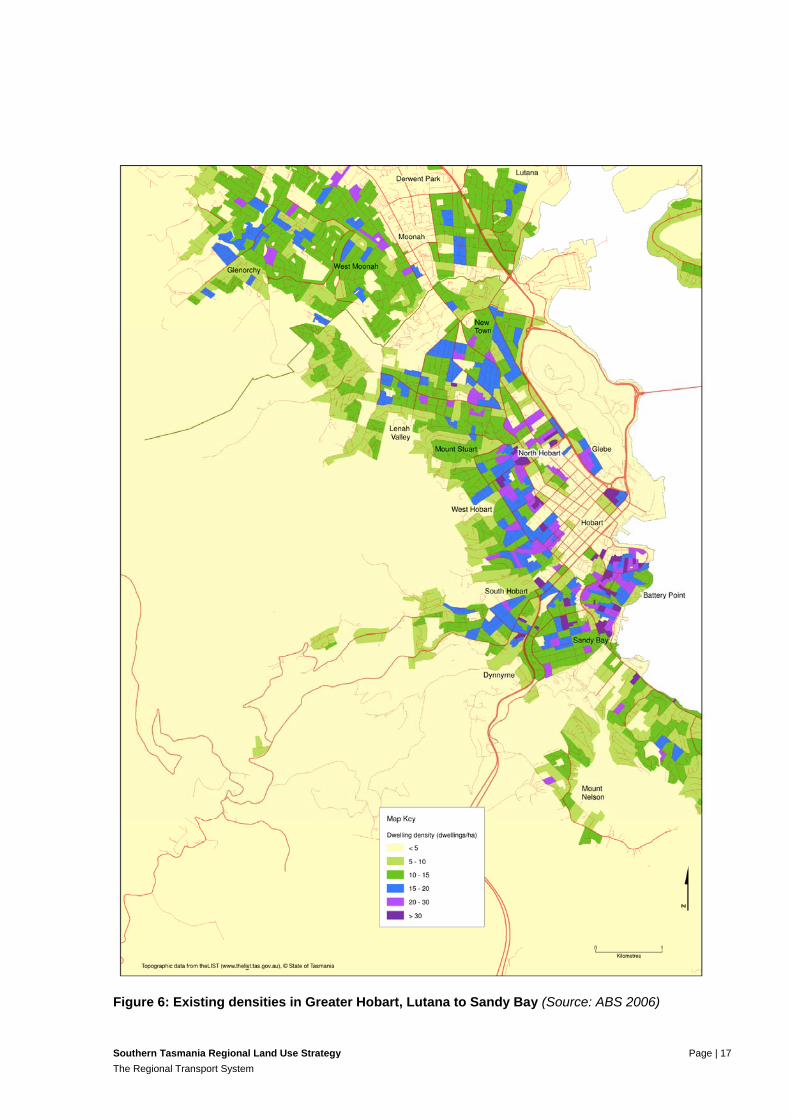
In Greater Hobart, four major development trends affect travel demand, including:
a dispersed settlement pattern
segregation of land use types
emphasis on car-based development approvals, including carparking; and
the location of affordable housing in urban fringe areas.
Across Australia, through land use and transport integration policies at the State level, it has been
accepted that a minimum density of 15 dwellings per hectare is required to support efficient and viable
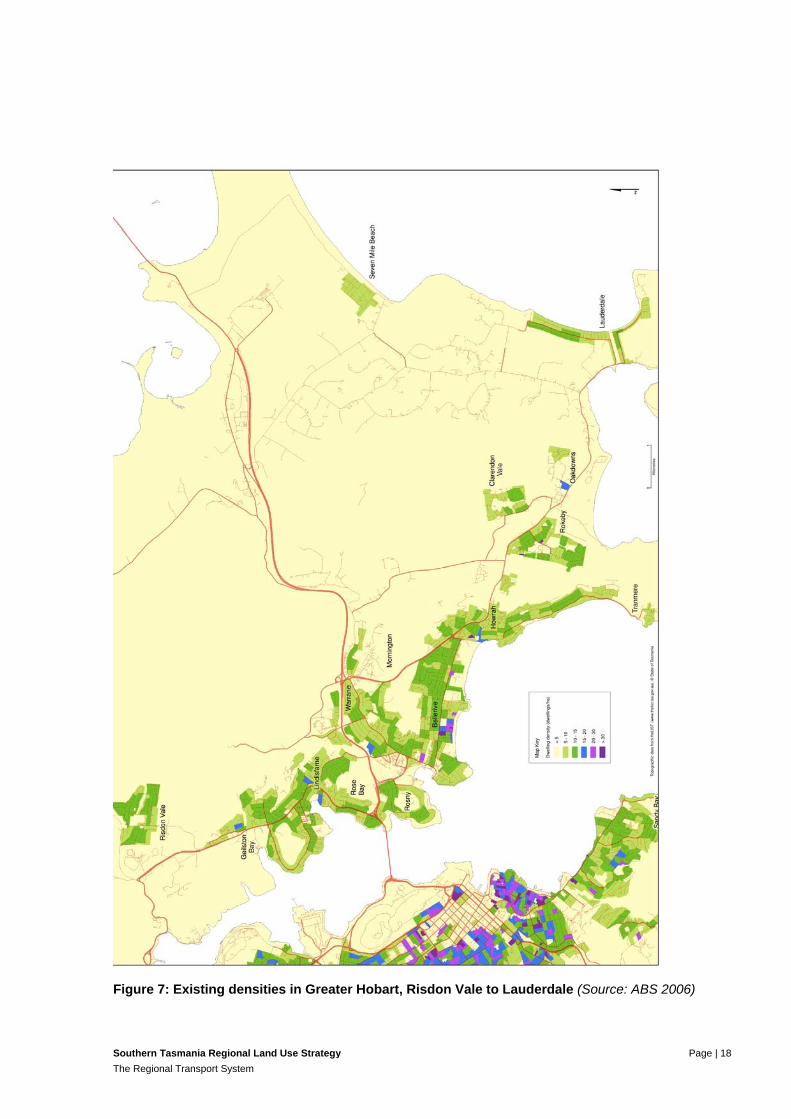
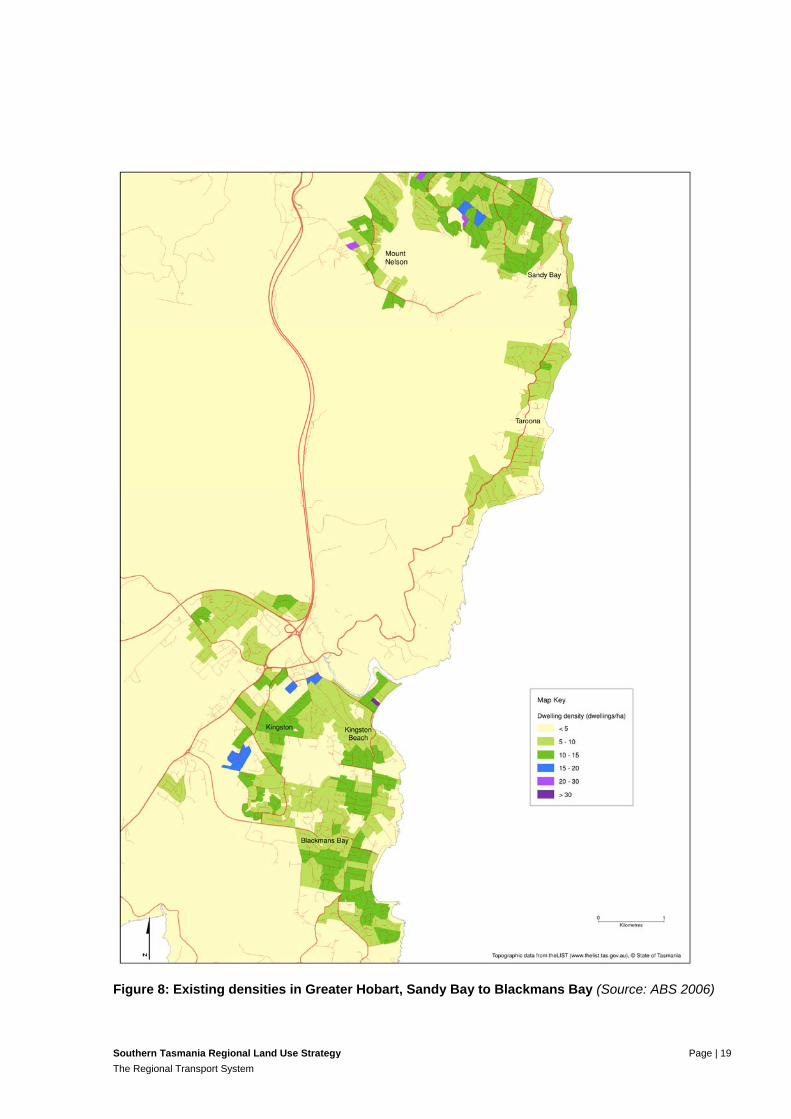
public transport. As evident from Figures 5 to 8 below, very few areas in main urban areas of Greater
Hobart have actually developed at these densities.
N.B: All maps in Figures 5 to 8 are available separately in A3 size.
Page | 16
Southern Tasmania Regional Land Use Strategy
The Regional Transport System
Figure 5: Existing densities in Greater Hobart, Bridgewater to Lutana (Source: ABS 2006)
Page | 17
Southern Tasmania Regional Land Use Strategy
The Regional Transport System
Figure 6: Existing densities in Greater Hobart, Lutana to Sandy Bay (Source: ABS 2006)
Page | 18
Southern Tasmania Regional Land Use Strategy
The Regional Transport System
Figure 7: Existing densities in Greater Hobart, Risdon Vale to Lauderdale (Source: ABS 2006)
Page | 19
Southern Tasmania Regional Land Use Strategy
The Regional Transport System
Figure 8: Existing densities in Greater Hobart, Sandy Bay to Blackmans Bay (Source: ABS 2006)
Page | 20
Southern Tasmania Regional Land Use Strategy
The Regional Transport System
5. Passenger Movements
Tasmania is highly dependent on private motor vehicles for passenger movement. Tasmania has the
second highest vehicle ownership (per head of population) representing 2.6% of Australia’s vehicle fleet
(Department of Infrastructure, Energy & Resources 2006). Car ownership is expected to increase over
the next decade. Within the south, private vehicle passenger transport kilometres travelled in Greater
Hobart are increasing. In 2006, an estimated 1.47 billon vehicle kilometres were travelled by car
compared to 0.025 billion vehicle kilometres by bus. Projections for Greater Hobart’s passenger
transport task indicate that this trend will continue, with vehicle kilometres travelled by car rising to 1.54
billon vehicle kilometres by 2020 (Department of Infrastructure, Energy & Resources 2009b).
5.1 Road Network
Roads and road transport are the major conduits for the delivery of goods and services throughout the
region. While road infrastructure is only one component of a multi-faceted transport system, they carry
the majority of passenger and freight travel within Tasmania. Consequently road infrastructure is critical
to the effective economic and social functioning of the community. Tasmania has approximately
23,000km of improved roads. A range of organisations own, plan, maintain and construct roads in the
Southern Region including local governments, DIER, Forestry Tasmania, DPIPWE and Hydro. The
primary role of the local government network is to facilitate local access needs. The State road network
encompasses Tasmania’s major state and regional arterial roads and provides key inter-regional
connections to major population centres, air and sea ports and to major industry locations.
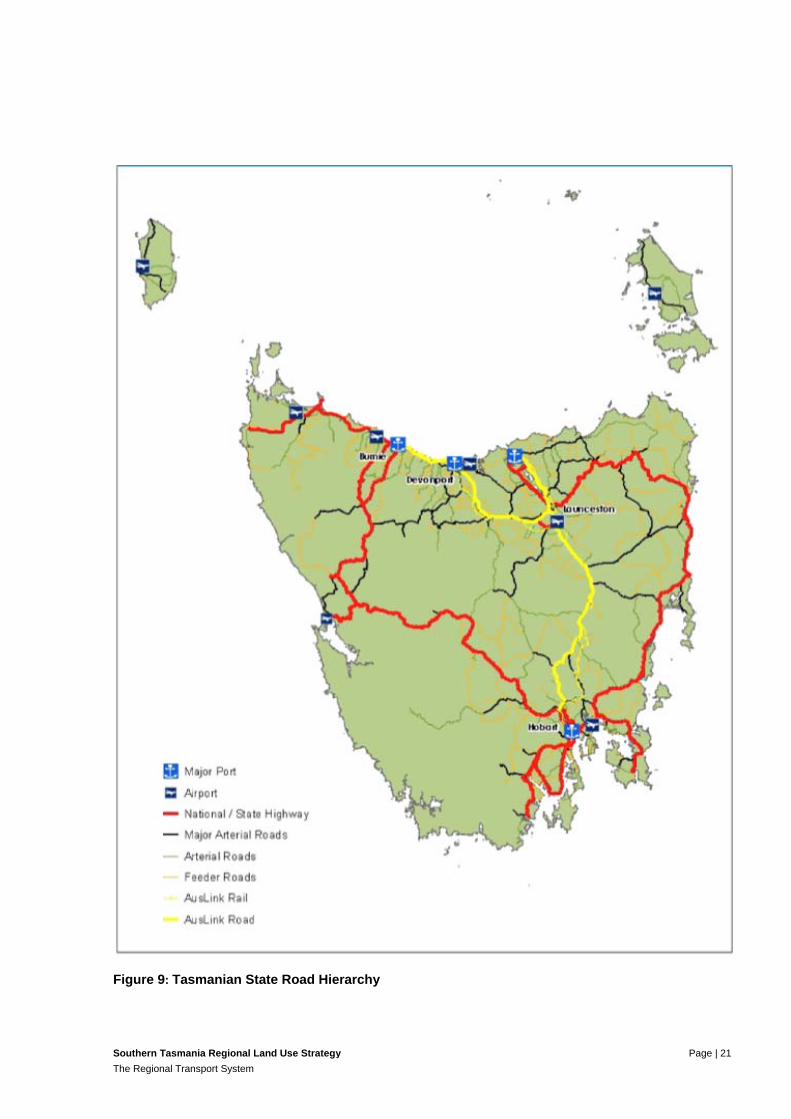
Tasmania’s State Road network is strategically planned and managed via a road hierarchy system (see
Figure 9). This system is only applicable to State Roads and consists of five categories:
Category 1: Trunk Roads
Category 2: Regional Freight Roads
Category 3: Regional Access Roads
Category 4: Feeder Roads
Category 5: Other Roads
The Tasmanian State Road Hierarchy reflects the function of individual roads within the network, and
supports planning of the strategic road network by clearly articulating the function of individual roads and
network relationships.
Below the State Road Hierarchy are local roads which are owned and primarily managed by Local
Government. Some Councils have their own local road hierarchy, particularly those in the Greater Hobart
area, in order to recognise the different functions of individual roads. For example, some local roads are
important arterial roads carrying a significant intra regional traffic volume (for example Main Road,
Moonah and Sandy Bay Road), while others are less important in the overall road network carrying only
local traffic.
Page | 21
Southern Tasmania Regional Land Use Strategy
The Regional Transport System
Figure 9: Tasmanian State Road Hierarchy
Page | 22
Southern Tasmania Regional Land Use Strategy
The Regional Transport System
Greater Hobart has an extensive road network, connecting inner urban areas, urban fringe and the major
activity centres. Three major arterial outlet roads provide transport links through and between the CBD
area and major outer urban population centres: the Southern Outlet, the Tasman Highway and the
Brooker Highway. The Tasman Highway or eastern outlet has varied freight movements due to
commercial vehicles serving the light industrial areas at Cambridge and Mornington and general freight
movements between Sorell and Hobart. The Brooker Highway is the main north-south linkage and also
the region’s major freight route, linking key freight distribution and warehousing areas. It provides an
important urban arterial and local commuter road; it is the major passenger route by volume and carries
higher daily volumes than the Southern Outlet.
Many intra-regional and intra-state movements occur east-west through central Hobart area making use
of the one-way pair of Davey and Macquarie Streets. Other significant arterial roads in metropolitan
Hobart include the East Derwent Highway (Lindisfarne to Bridgewater), South Arm Highway (Mornington
to South Arm). A network of locally significant roads providing inter- and intra-suburb access for
residential, commercial and industrial uses, include Main Road and Derwent Park Roads (Glenorchy),
Argyle Street (Hobart), Clarence Street (Clarence) and Lewisham and Old Forcett Roads (Sorell). Road
crossings of the Derwent River include the Bridgewater Bridge, Bowen Bridge, and Tasman Bridge. The
Bridgewater and Tasman Bridges carry a high freight task. The Sorell Causeway and McGees Bridge link
Sorell with Hobart.
Greater Hobart has an increasing trend in private vehicle passenger transport kilometres travelled each
year. In 2006, it was estimated that there were 1.47 billion vehicle kilometres travelled by car. By
comparison, passenger kilometres travelled by bus have remained relatively stable, and in 2006 were
estimated at 0.025 billion vehicle kilometres. Future projections for Greater Hobart’s passenger transport
task show that this trend will continue, with the majority of vehicle kilometres being travelled by car, rising
to 1.54 billion vehicle kilometres by the year 2020.
Traffic forecasting undertaken by DIER indicates the Brooker and Tasman Highways are the most
significant roads in terms of current and future forecast traffic. The Tasman Bridge, Brooker Highway
south of Risdon Road (New Town) and the Tasman Highway west of the Mornington interchange are the
highest volume sections. Traffic volumes increase with proximity to central Hobart. All roads increase in
traffic density with proximity to central Hobart.
The majority of trips from home to work are made to destinations in the Hobart, Glenorchy and Clarence
municipalities. Car ownership is increasing in Greater Hobart as vehicles become more affordable and
there is an increased propensity and mobility for personal travel. The car remains the dominant mode of
transport for commuters across Greater Hobart, at over 71% of trips.
5.2 Public transport
Buses are the principal mode of public transport in Hobart. Existing public transport usage in Greater
Hobart – and Tasmania – is low, at around 6% during AM peak period and 3% during remaining times.
This reflects a range of factors, including a dispersed settlement pattern, absence of a strong public
transport culture, increasingly complex personal trips which require flexible transport modes, and a
perception of public transport as a social good.
Page | 23
Southern Tasmania Regional Land Use Strategy
The Regional Transport System
Hobart’s urban bus network has a good geographical coverage, but relatively low service frequencies.
This service pattern is a direct reflection of Hobart’s dispersed land use, with bus services having to
respond to the service demands of new suburbs and major activity centres rather than a more strategic
approach that considers how land use can support or capitalise on existing passenger transport services.
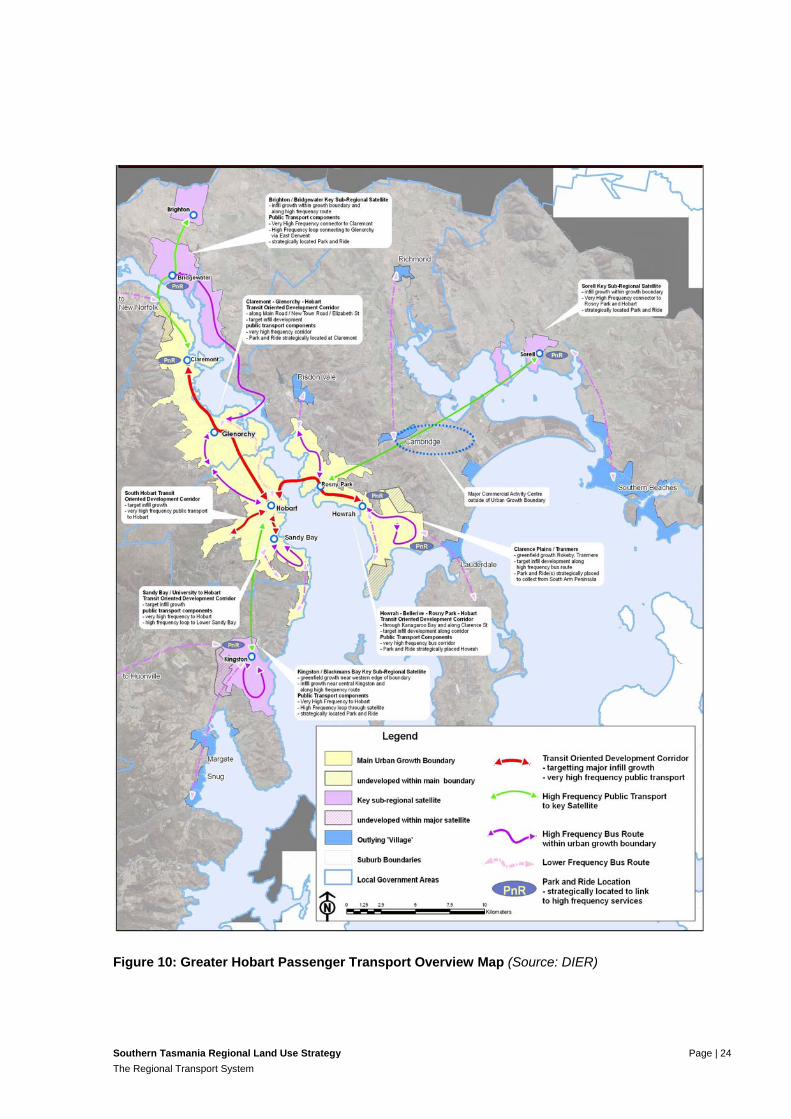
The Tasmanian Government has signalled a far broader role for public transport as part of the
Tasmanian Urban Passenger Transport Framework, focusing on creating a public transport system that
offers greater choice and flexibility. The Framework identifies the development of high-frequency bus
services linking major activity centres and along key corridors (see Figure 10).
The Government has committed recurrent funding of $3.25m to Metro Tasmania to improve urban
services, and $750 000 each year for four years to develop urban park and ride facilities and supporting
bus services. The first park and ride site in Denison Street, Kingston is due to be operational by July.
Page | 24
Southern Tasmania Regional Land Use Strategy
The Regional Transport System
Figure 10: Greater Hobart Passenger Transport Overview Map (Source: DIER)
Page | 25
Southern Tasmania Regional Land Use Strategy
The Regional Transport System
Core passenger services for the urban areas of Greater Hobart are provided by Metro Tasmania, a state
owned company. The Tasmanian Government provides funding to Metro Tasmania to provide urban
public transport services on the behalf of Government. Metro is the largest passenger transport company
in Tasmania, operating services in Hobart, Launceston and Burnie. Metro also operates a small number
of regional services, under the trading name of Hobart Coaches, including services to Kingston and
Blackmans Bay.
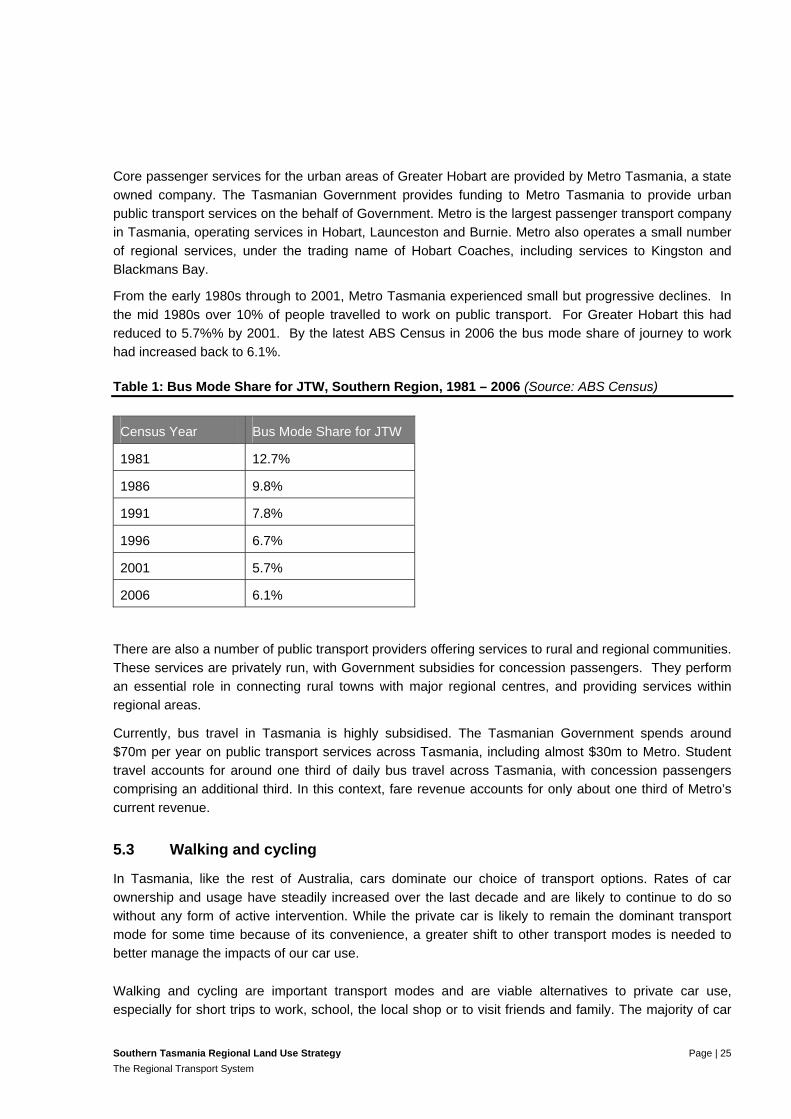
From the early 1980s through to 2001, Metro Tasmania experienced small but progressive declines. In
the mid 1980s over 10% of people travelled to work on public transport. For Greater Hobart this had
reduced to 5.7%% by 2001. By the latest ABS Census in 2006 the bus mode share of journey to work
had increased back to 6.1%.
Table 1: Bus Mode Share for JTW, Southern Region, 1981 – 2006 (Source: ABS Census)
Census Year Bus Mode Share for JTW
1981 12.7%
1986 9.8%
1991 7.8%
1996 6.7%
2001 5.7%
2006 6.1%
There are also a number of public transport providers offering services to rural and regional communities.
These services are privately run, with Government subsidies for concession passengers. They perform
an essential role in connecting rural towns with major regional centres, and providing services within
regional areas.
Currently, bus travel in Tasmania is highly subsidised. The Tasmanian Government spends around
$70m per year on public transport services across Tasmania, including almost $30m to Metro. Student
travel accounts for around one third of daily bus travel across Tasmania, with concession passengers
comprising an additional third. In this context, fare revenue accounts for only about one third of Metro’s
current revenue.
5.3 Walking and cycling
In Tasmania, like the rest of Australia, cars dominate our choice of transport options. Rates of car
ownership and usage have steadily increased over the last decade and are likely to continue to do so
without any form of active intervention. While the private car is likely to remain the dominant transport
mode for some time because of its convenience, a greater shift to other transport modes is needed to
better manage the impacts of our car use.
Walking and cycling are important transport modes and are viable alternatives to private car use,
especially for short trips to work, school, the local shop or to visit friends and family. The majority of car
Page | 26
Southern Tasmania Regional Land Use Strategy
The Regional Transport System
trips that Tasmanians make are short trips – under 2km. Hobart already has the highest proportion of
people walking to work in Australia, and preliminary results from the Greater Hobart Household Travel
Survey show walking is a major transport mode for many people in undertaking their daily trips.
Walking and cycling can also complement other modes, such as walking or cycling to the bus stop, or
combining walking or cycling with a car trip.
Generally, the development of our urban areas has not catered well for walking and cycling. Older
suburbs such as Bellerive or West Hobart have a mix of residential areas, local shops and schools,
making walking and cycling highly accessible transport modes and likely preferable to a car for many
shorter trips. In newer subdivisions, however, such as Acton or Old Beach, the tendency towards cul-de-
sacs and residential development over mixed use, increases the distances between key locations and
makes the provision of safe, good quality, and direct walking and cycling paths difficult. Considerable
scope remains to improve local transport and connectivity in many of our new subdivisions.
The Tasmanian Government recently released the Tasmanian Walking and Cycling for Active Transport
Strategy to address some of these issues and raise the profile of walking and cycling as viable transport
modes for all Tasmanians. The Strategy focuses on creating a safe, accessible and well connected
transport system that encourages more people to walk and cycle as part of their everyday journeys.
Many of Tasmania’s large, urban Councils have developed local bicycle plans or otherwise support local
bicycle user groups, which provide an important means for cyclists to collectively provide input into the
identification of local cycling needs.
Some of Greater Hobart’s metropolitan Councils have also undertaken to develop more pedestrian
friendly environments. For example, Hobart City Council has developed a mobility map which provides a
guide to accessing facilities for those with limited mobility.
5.4 Strategic planning and analysis
5.4.1 Greater Hobart Household Travel Survey
The Survey is the first of its kind in Tasmania. It captures real information on how, where and why people
are travelling across Greater Hobart, making a significant contribution to better understanding our urban
passenger transport patterns, and developing responses that meet our actual travel needs. Over 2,400
households were interviewed across Greater Hobart between July 2008 and July 2009.
Data from the Survey was used as part of the travel demand model under the Tasmanian Urban
Passenger Transport Framework, and in the identification of park and ride sites across metropolitan
Hobart.
5.4.2 Journey to Work
The journey to and from our workplace forms the backbone of a proportion of other journeys, such as
shopping and picking up children from school. Statistics show that over 80% of the Journey to Work
(JTW) movements across the region occur by private car, although people living and working within the
metropolitan area of Hobart are more likely to use alternatives to car-based transport such as public
transport, walking and cycling.
Page | 27
Southern Tasmania Regional Land Use Strategy
The Regional Transport System
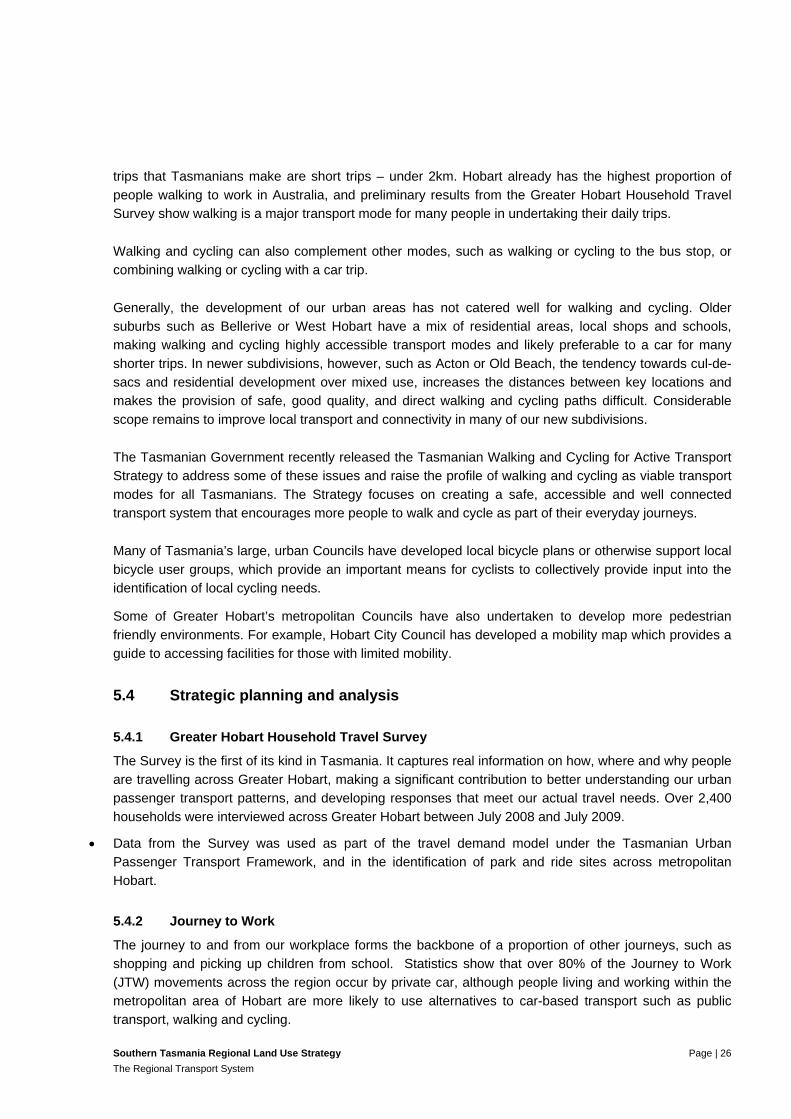
Table 2: Southern Tasmania JTW Origin and Destination (Source: ABS Census)
W D
ES
TIN
AT
ION
S 2
006
JTW ORIGINS 2006
Bri
gh
ton
Cen
tral
Hig
hla
nd
s
Cla
ren
ce
Der
wen
t V
alle
y
Gla
m/S
pri
ng
Bay
Gle
no
rch
y
Ho
bar
t
Hu
on
Val
ley
Kin
gb
oro
ug
h
So
rell
So
uth
ern
Mid
lan
ds
Tas
man
Brighton 572 17 159 117 - 282 118 6 39 37 115 -
Central Highlands
9 361 11 33 - 15 7 - 12 - 20 -
Clarence 372 9 5283 102 30 945 1031 90 507 729 149 16
Derwent Valley 105 65 85 1108 3 203 120 6 28 9 27 -
Glam/Spring Bay 5 - 30 - 960 6 10 3 14 15 16 -
Glenorchy 1429 51 2611 673 17 5909 2129 224 1067 563 383 8
Hobart 1250 32 7989 541 43 5949 14310 796 5366 1234 288 42
Huon Valley 9 - 29 1 - 37 84 2398 258 8 - 3
Kingborough 72 3 349 13 3 286 696 324 3363 67 12 -
Sorell 26 - 257 10 16 48 79 3 18 1064 33 29
Southern Midlands
30 14 36 6 4 15 18 3 6 19 537 -
Tasman - - 12 - - 6 6 - - 34 4 379
Page | 28
Southern Tasmania Regional Land Use Strategy
The Regional Transport System
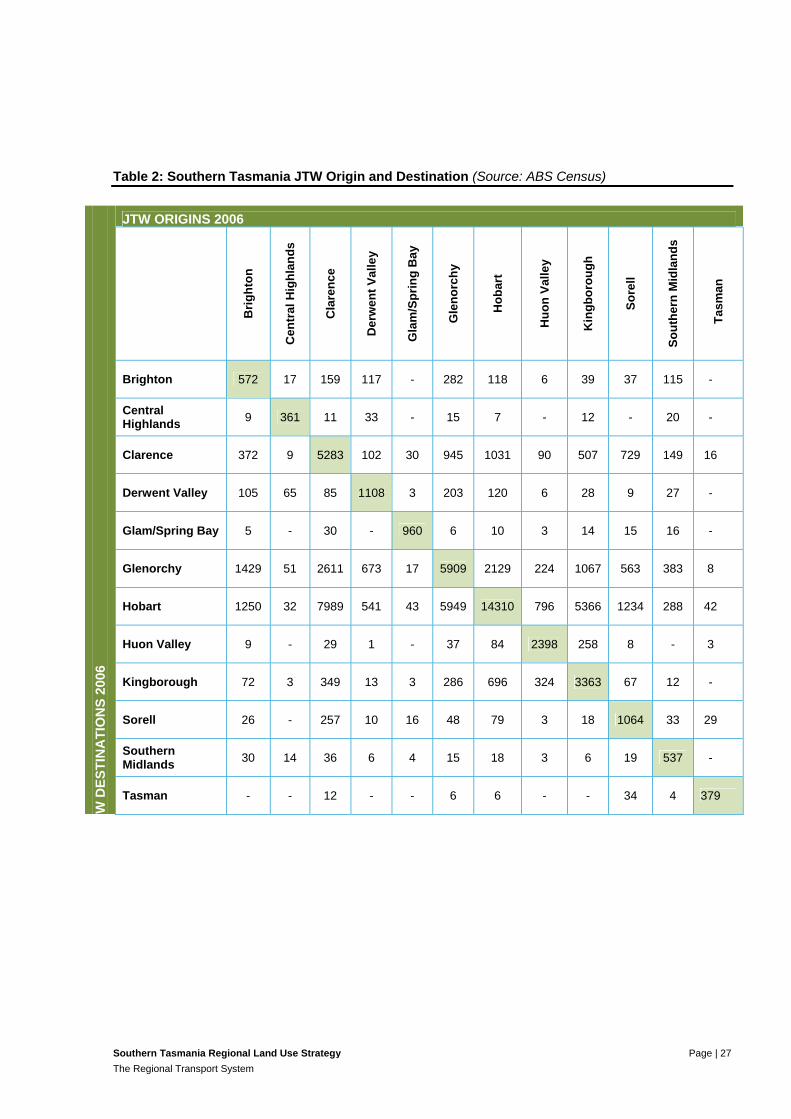
Figure 11: JTW journey source by private motor vehicle (Source: ABS Census)
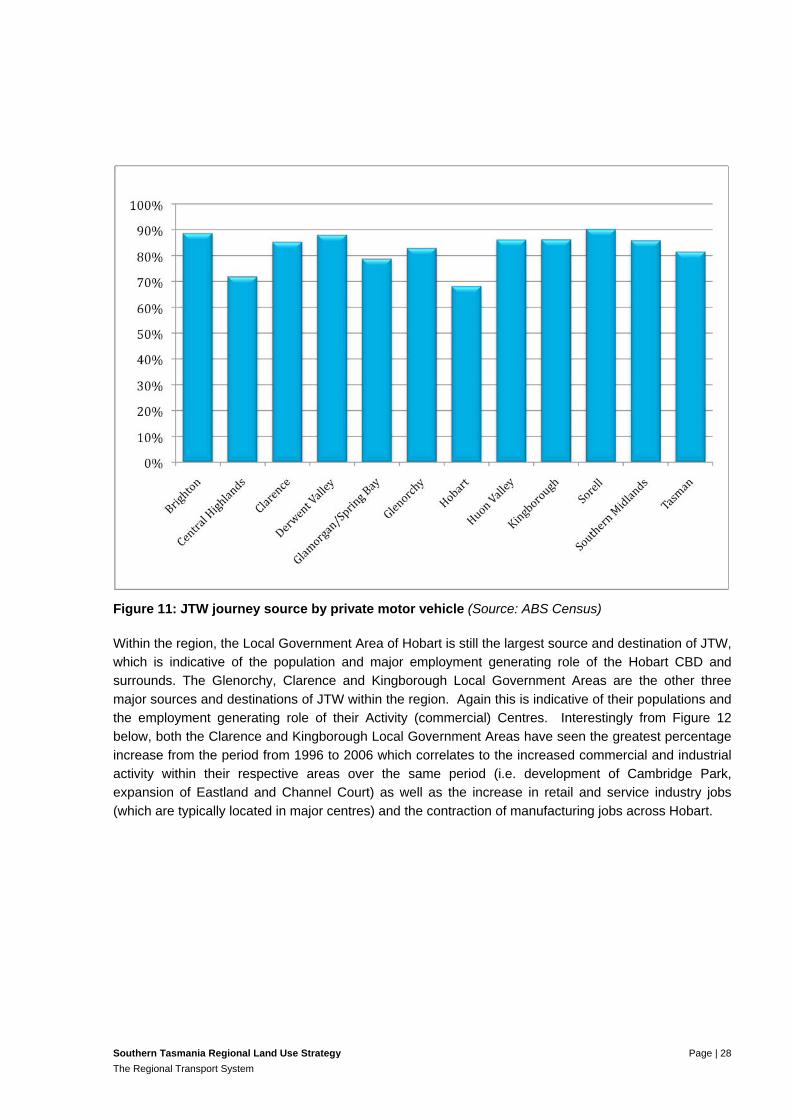
Within the region, the Local Government Area of Hobart is still the largest source and destination of JTW,
which is indicative of the population and major employment generating role of the Hobart CBD and
surrounds. The Glenorchy, Clarence and Kingborough Local Government Areas are the other three
major sources and destinations of JTW within the region. Again this is indicative of their populations and
the employment generating role of their Activity (commercial) Centres. Interestingly from Figure 12
below, both the Clarence and Kingborough Local Government Areas have seen the greatest percentage
increase from the period from 1996 to 2006 which correlates to the increased commercial and industrial
activity within their respective areas over the same period (i.e. development of Cambridge Park,
expansion of Eastland and Channel Court) as well as the increase in retail and service industry jobs
(which are typically located in major centres) and the contraction of manufacturing jobs across Hobart.
Page | 29
Southern Tasmania Regional Land Use Strategy
The Regional Transport System
Figure 12: Journey to Work changes over time in Greater Hobart (Source: ABS Census)
The statistics also show that:
For Greater Hobart the outer urban areas such as Brighton and Sorell have significantly less
people working within their home LGA compared to inner urban LGAs (e.g. Hobart, Glenorchy and
Clarence);
There is noticeable movement of people across the Hobart LGA to destinations to the north and
south of the CBD. For example nearly 12% of people in Kingborough travel through Hobart to
employment in Clarence or Glenorchy;
Page | 30
Southern Tasmania Regional Land Use Strategy
The Regional Transport System
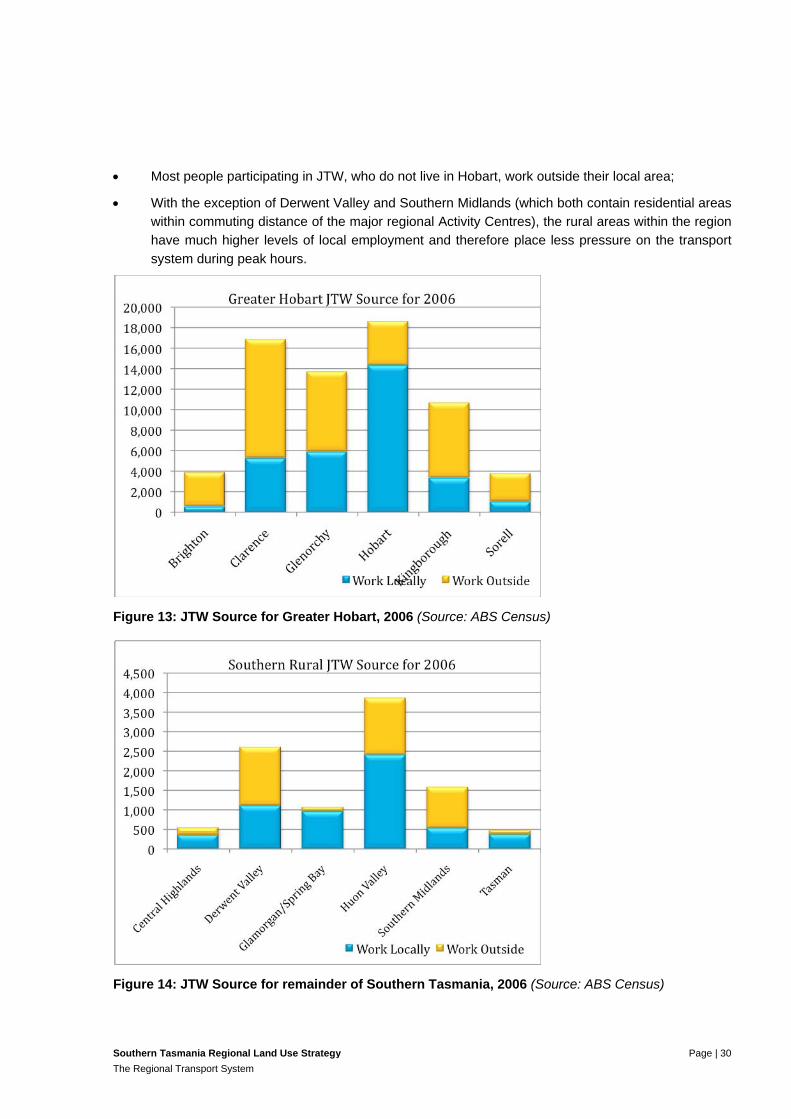
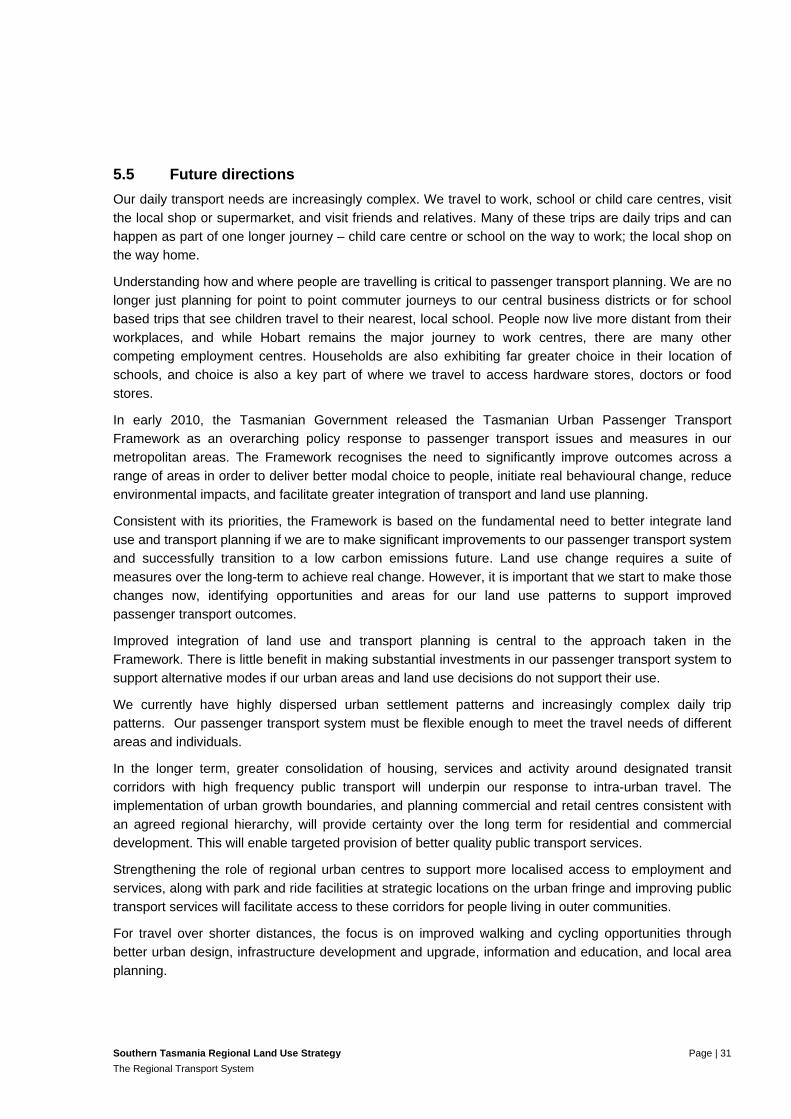
Most people participating in JTW, who do not live in Hobart, work outside their local area;
With the exception of Derwent Valley and Southern Midlands (which both contain residential areas
within commuting distance of the major regional Activity Centres), the rural areas within the region
have much higher levels of local employment and therefore place less pressure on the transport
system during peak hours.
Figure 13: JTW Source for Greater Hobart, 2006 (Source: ABS Census)
Figure 14: JTW Source for remainder of Southern Tasmania, 2006 (Source: ABS Census)
Page | 31
Southern Tasmania Regional Land Use Strategy
The Regional Transport System
5.5 Future directions
Our daily transport needs are increasingly complex. We travel to work, school or child care centres, visit
the local shop or supermarket, and visit friends and relatives. Many of these trips are daily trips and can
happen as part of one longer journey – child care centre or school on the way to work; the local shop on
the way home.
Understanding how and where people are travelling is critical to passenger transport planning. We are no
longer just planning for point to point commuter journeys to our central business districts or for school
based trips that see children travel to their nearest, local school. People now live more distant from their
workplaces, and while Hobart remains the major journey to work centres, there are many other
competing employment centres. Households are also exhibiting far greater choice in their location of
schools, and choice is also a key part of where we travel to access hardware stores, doctors or food
stores.
In early 2010, the Tasmanian Government released the Tasmanian Urban Passenger Transport
Framework as an overarching policy response to passenger transport issues and measures in our
metropolitan areas. The Framework recognises the need to significantly improve outcomes across a
range of areas in order to deliver better modal choice to people, initiate real behavioural change, reduce
environmental impacts, and facilitate greater integration of transport and land use planning.
Consistent with its priorities, the Framework is based on the fundamental need to better integrate land
use and transport planning if we are to make significant improvements to our passenger transport system
and successfully transition to a low carbon emissions future. Land use change requires a suite of
measures over the long-term to achieve real change. However, it is important that we start to make those
changes now, identifying opportunities and areas for our land use patterns to support improved
passenger transport outcomes.
Improved integration of land use and transport planning is central to the approach taken in the
Framework. There is little benefit in making substantial investments in our passenger transport system to
support alternative modes if our urban areas and land use decisions do not support their use.
We currently have highly dispersed urban settlement patterns and increasingly complex daily trip
patterns. Our passenger transport system must be flexible enough to meet the travel needs of different
areas and individuals.
In the longer term, greater consolidation of housing, services and activity around designated transit
corridors with high frequency public transport will underpin our response to intra-urban travel. The
implementation of urban growth boundaries, and planning commercial and retail centres consistent with
an agreed regional hierarchy, will provide certainty over the long term for residential and commercial
development. This will enable targeted provision of better quality public transport services.
Strengthening the role of regional urban centres to support more localised access to employment and
services, along with park and ride facilities at strategic locations on the urban fringe and improving public
transport services will facilitate access to these corridors for people living in outer communities.
For travel over shorter distances, the focus is on improved walking and cycling opportunities through
better urban design, infrastructure development and upgrade, information and education, and local area
planning.
Page | 32
Southern Tasmania Regional Land Use Strategy
The Regional Transport System
Tasmanian Urban Passenger Transport Framework and Hobart Passenger Transport Case Study
In 2009 the Department of Infrastructure, Energy and Resources commissioned the Hobart Passenger
Transport Case Study to better understand the issues facing the urban passenger transport system in
Greater Hobart. The Study formed the basis of the Tasmanian Urban Passenger Transport Framework,
the Government’s framework for managing passenger transport over the long term and a key output of
the Tasmanian Infrastructure Strategy. The study comprised of five individual projects:
1. Comprehensive review of travel demand measures.
2. Development of a travel demand model for Hobart’s major arterial roads. This model enables us to understand the actual impact of different measures and scenarios on the transport network.
3. Alternative uses for Hobart’s existing urban freight rail corridor, including light rail and bus rapid transit.
4. Investigation of the viability of passenger ferry services on the Derwent River.
5. Development of a walking and cycling strategy, to address local area transport.
Travel Demand Measures
The Measures project formed the major component of the Study, examining the specific transport and
land use planning characteristics of Greater Hobart; best practice examples from similar jurisdictions
(Canada and New Zealand); and review of individual measures, and a final package of recommendations
appropriate to Tasmania’s urban areas. The major outputs from this consultancy formed the basis of the
Government’s Framework.
Travel Demand Model
A targeted travel demand model was developed to examine the impacts of key measures on passenger
transport outcomes. The measures modelled were: land use planning, car parking, and public transport
improvements. A doubling of public transport frequencies and an increase in carparking costs had the
most significant impact in reducing car vehicle kilometres travelled and facilitating a greater modal shift in
public transport usage.
Alternative modal options: rail and ferries
The Study examined the infrastructure and service delivery costs associated with establishing an
expanded commuter ferry service on the Derwent River. Four routes were considered most feasible,
providing linkages between 5 locations - Bellerive Village, Lindisfarne, Montagu Bay, Howrah Point and
Waterman’s Dock in Hobart.
Existing berthing facilities at all the key locations required significant upgrade to support commuter
ferries, at an estimated total cost of around $2.5 million, and an indicative capital cost of $900,000 to
purchase two vessels to operate a limited service between the five locations.
The Study found that ferries are likely to have a competitive advantage over private cars and existing bus
services between Bellerive and Montagu Bay on direct services, and a competitive advantage over
buses from Howrah and Lindisfarne. However, significant subsidies would be required to operate the
service. The current low number of people living within a reasonable walking distance of potential
terminals indicated a low level of potential ‘walk and ride’ passengers, with users of the service relying on
a two stage modal journey. This would reduce both the time advantage otherwise offered and overall
attractiveness.
Page | 33
Southern Tasmania Regional Land Use Strategy
The Regional Transport System
This Study also examined the capital and operating costs of a light rail system between Bridgewater and
the University of Tasmania campus in Sandy Bay. While not all potential re-uses of the rail line were
examined in detail, the underlying factors which might support investment in the rail line – population
catchment, distance from existing residential areas to stations (ease of access), passenger demand and
the preferred alignment – were assessed.
The Study identified an alternative rail corridor between Moonah and the Hobart CBD to maximise the
population catchment of the line. This new route, which bypasses the Domain, increased the population
within 800 metres of the corridor by around 80 per cent, in comparison to the existing rail corridor which
provides walk and ride access to no more than 10 per cent of Hobart’s population. Generally, the Study
found the proposal to be high cost and high risk in the context of forecast low patronage (a reflection of
low adjacent population densities and the actual travel patterns and needs of households served by the
rail line). Over the long term, the Study identified light rail and bus rapid transit as potential options if
demand for public transport increases and land use changes see greater densification of population
around major corridors. The importance of first restructuring residential and commercial activities around
public transport corridors if dedicated mass transit services are to be viable in the longer term was a key
conclusion of the Study.
More information on the outcomes of this Study, its supporting reports and the Government’s Tasmanian
Urban Passenger Transport Framework, can be accessed via the Department of Infrastructure, Energy &
Resources website at www.dier.tas.gov.au
Page | 34
Southern Tasmania Regional Land Use Strategy
The Regional Transport System
6. Land Transport Freight Network
Tasmania has an export-oriented economy that is dependent on the movement of goods by sea and air
to interstate and overseas markets. The Tasmanian economy is driven by value added and bulk
commodity markets. It is heavily dependent on an efficient and cost effective freight transport system,
where cost savings in the transport of goods increase the scope for competitive pricing. Industry is a key
driver behind the functioning of transport systems. Industry generates high volumes of light commercial
and heavy freight vehicle movements, requires the utilisation of rail for part or all of the movement of
goods, and uses air or sea transport for the interstate movement of goods.
Tasmanian’s freight transport system is heavily focused on the State’s extensive road network. The rail
network is essentially a bulk and containerised goods carrier, moving product inter-regionally between
the northern ports and southern region. It faces significant infrastructure and financial constraints in its
attempts to compete with the road based network. There is a predicted increase in the freight task over
the medium term, which will be a significant factor in the planning and management of linear transport
infrastructure.
The southern region is highly reliant on the northern ports for the movement of goods to and from the
region, with 86% of imports and over 99 of exports moving through one of the three northern ports. The
region generates the lowest freight tonnages of Tasmania’s three regions, with an estimated one quarter
of Tasmania’s $4 billion freight task generated in the Region. The region imports 26 percent of
Tasmania’s imports and exports 14 percent of statewide exports. Major freight generators include:
Stone, Sand and Clay - 1.9 million tonnes
Forestry freight (logs) - 1.67 million tonnes
Basic Chemicals - 0.5 million tonnes
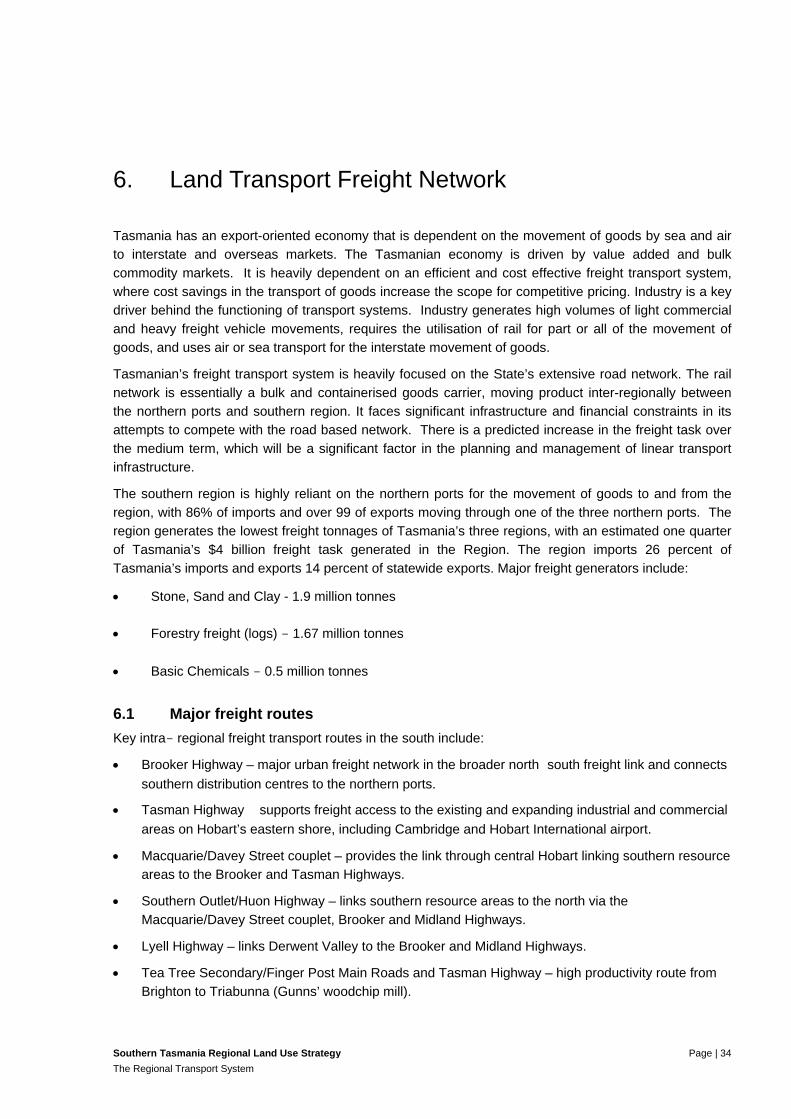
6.1 Major freight routes
Key intra- regional freight transport routes in the south include:
Brooker Highway – major urban freight network in the broader north�south freight link and connects
southern distribution centres to the northern ports.
Tasman Highway � supports freight access to the existing and expanding industrial and commercial
areas on Hobart’s eastern shore, including Cambridge and Hobart International airport.
Macquarie/Davey Street couplet – provides the link through central Hobart linking southern resource
areas to the Brooker and Tasman Highways.
Southern Outlet/Huon Highway – links southern resource areas to the north via the
Macquarie/Davey Street couplet, Brooker and Midland Highways.
Lyell Highway – links Derwent Valley to the Brooker and Midland Highways.
Tea Tree Secondary/Finger Post Main Roads and Tasman Highway – high productivity route from
Brighton to Triabunna (Gunns’ woodchip mill).
Page | 35
Southern Tasmania Regional Land Use Strategy
The Regional Transport System
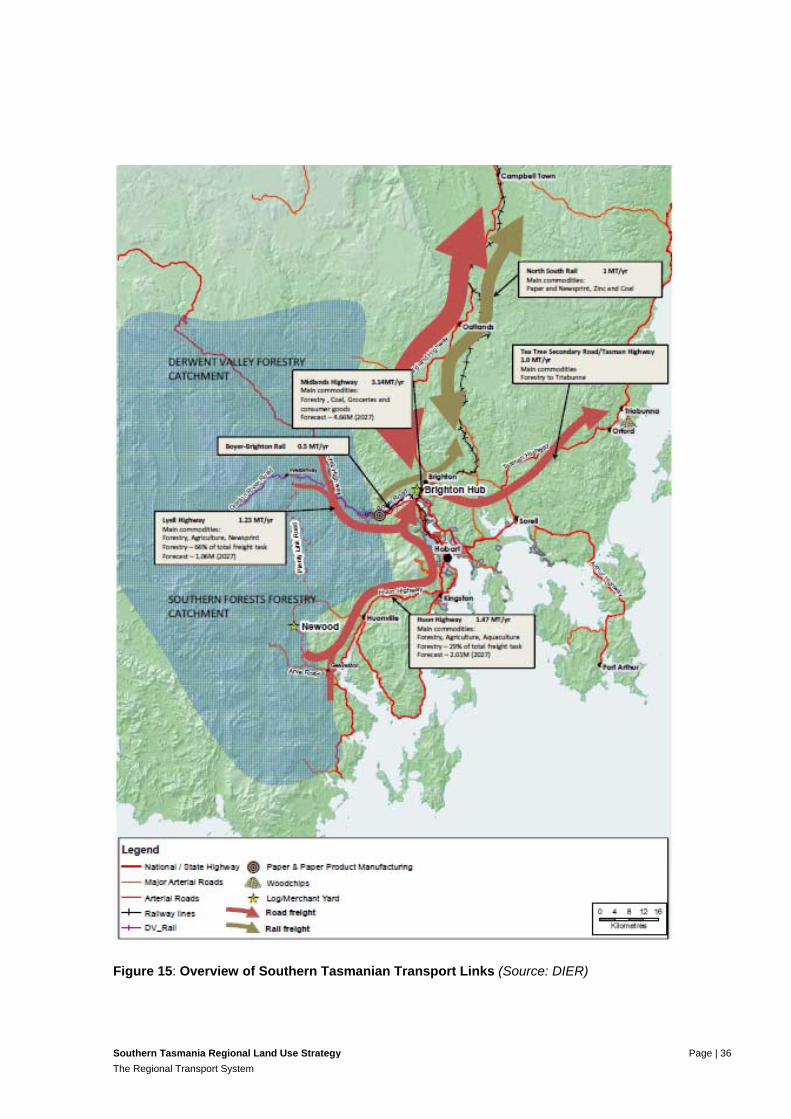
The Midland Highway is the major inter�regional, north�south freight route. A total of $190 million is
being invested in upgrading the Midland Highway over the next four years to improve safety and efficiency focusing on the Brighton to Bagdad section. The north�south rail line also provides an
important transport link, moving containers and bulk product between the south and the northern ports. In
2005/06, the rail line carried over 0.35 million tonnes of containers and 0.06 million tonnes of bulk freight
between Hobart and Launceston.
The Brighton Transport Hub is a new purpose-built road and rail hub located south of Brighton on the
north-south rail line and adjacent to the Midland Highway. The Hub replaces the existing, highly
constrained Macquarie Point terminal with an efficient, modern freight hub. The Hub will be a key staging
point for the consolidation of freight for intrastate movement on larger, heavy vehicles and rail, as well as
the breaking down of intrastate freight for redistribution within metropolitan Hobart. While the exact
nature of the future industrial uses at the site is unclear, it is likely the site will attract uses requiring larger
sites, more direct road and rail access, and/or of a heavy industrial nature. Given the significant lack of
industrial land in the region, the relationship of the Hub to the Glenorchy-Moonah industrial area is
expected to strengthen over time.
The Brooker and southern section of the Midland Highway carry the highest volumes of freight in the
Region. Together the two are the major regional and metropolitan freight links, carrying high freight
volumes and connecting major industrial centres and processing points at Glenorchy to the Brighton
Transport Hub.
The Midland Highway between the Brooker Highway and Brighton carries the highest freight volumes, at
an estimated 3.14 million tonnes per annum in 2009. This largely reflects the forestry freight task
associated with Gunn’s Triabunna woodchip mill.
In 2009, the Brooker Highway (at Derwent Park) carried an estimated 2.58 million tonnes. The Highway
connects major warehousing and freight distribution centres in Glenorchy with intra-state road and rail
connections and intra-urban freight distribution links. The Highway includes linkages to key local
government freight routes, including Risdon Road, Derwent Park Road and Lampton Avenue.
Freight growth on both the Midland and the Brooker Highway is forecast to be driven by the general
freight task with the Brooker Highway forecast to have the highest growth in tonnes, increasing 2.86
percent per annum to 4.45 million tonnes by 2027 – this growth can be partly attributed to the
development of the Brighton Transport Hub. By 2027, the Midland Highway is forecast to still carry the
highest tonnage at 4.66 million tonnes per annum.
The primary urban route for High Productivity Vehicles (e.g. B-Doubles) is the Brooker and Tasman
Highways (to Hobart Airport), providing relatively good access for these vehicles for most of the urban
areas across Hobart. For other higher mass limit vehicles, the East Derwent Highway may be utilised
provided that they meet specified vehicle standards. Notwithstanding these two freight route options
there is already some evidence that due to the shorter distances, freight vehicles may be utilising Back
Tea Tree Road.
Page | 36
Southern Tasmania Regional Land Use Strategy
The Regional Transport System
Figure 15: Overview of Southern Tasmanian Transport Links (Source: DIER)
Page | 37
Southern Tasmania Regional Land Use Strategy
The Regional Transport System
The forest industry generates significant freight movement within the southern region and is the Region’s
largest freight task. Details on the production and value of forestry are provided for in Section 7.3. In
terms of transport, the movement of timber is primarily west to east from forest harvesting areas to
Gunns’ Triabunna woodchip mill. The mill exports around 800,000 tonnes per annum, but is currently
operating below capacity due to low global demand.
The other major forest based industries in Southern Tasmania primarily source their resources from
areas close to their physical location. Norske Skog at Boyer represents around 20% of the forestry
freight task in the south; however 75% of logs used at Boyer are sourced within a 100km radius
predominantly from the Derwent Forests.
The Ta Ann rotary mill at Southwood sources majority of its resource from the Southern Forests, in which
it is located, however some of its resource comes from the Derwent Forests to the north via the Plenty
Link Road.
Log trucks on the road network have been significant issue for the community in the region.
6.2 Rail
The Tasmanian Rail Network was designed in the late 1800s and has changed little since. The Network
is a single line, narrow gauge freight transport system and consists of approximately 835 km of railway
track, of which approximately 626 km are currently open for traffic. The Network extends from Hobart to
Western Junction and from Western Junction to Burnie in the west and Bell Bay in the east. Connections
are also provided to Fingal in the east, Melba Flats in the west and Boyer in the Derwent Valley.
On 1 December 2010 the Tasmanian Government acquired the business of Pacific National Tasmania
and consolidated its existing assets into Tasmanian Railway Company Pty Ltd (TasRail). TasRail is a
state-owned company responsible for managing and maintaining the rail network and providing train
services to existing and new customers on a commercial basis.
Tasmania has been allocated $209.2 million for rail projects from the Australian Government as part of
the AusLink and Nation Building Programs. This includes the $78 million Rail Rescue Package, $55.6
million for capacity improvements, $71.7 million for capital upgrades to various specific segments of the
operational rail network and $3.9 million for rail crossing safety improvements.
In the southern region, major rail projects include:
Main North-South Line Rail Capacity Improvements ($31.6 million) – a combination of curve and
grade easing along a 3km section of track on the main north south line, focusing on the curves
around Coal Mine Bend and the Campania areas.
Rail Capacity Improvements at Rhyndaston ($24 million) – involves the easing of tight curves on
the steep grades approaching the Rhyndaston tunnel, as well as improving air flow through the
tunnel itself.
Upgrade of the Boyer Line ($1.1 million) – proposed works include sleeper replacement, re-railing,
replacing ballast and tamping, and earthworks and drainage over a 14 km length of track.
Page | 38
Southern Tasmania Regional Land Use Strategy
The Regional Transport System
6.3 Strategic planning and analysis
The Tasmanian Government undertakes a triennial statewide freight survey – the Tasmanian Freight
Survey. The Survey involves interviews with Tasmania’s largest 150 companies, and captures around 95
per cent of freight moving through Tasmania’s ports. It provides real data on freight movements across
Tasmania and is one of the largest surveys of its kind in Australia. Information collected includes:
origins and destinations of commodities;
type of commodities;
type of road vehicles;
number of road trips;
use of road or rail;
pack type; and
estimated growth rates for commodities.
Data from the Survey is used for a range of purposes including analysis and modelling of freight
movements at a statewide, regional or major corridor (road/rail) level; support to major infrastructure
strategies (Tasmanian AusLink Corridor Strategy, Infrastructure Australia Audit); and assessment of
proposals or future changes.
6.4 Future directions
A higher freight task in the future means Tasmania will need to cater for greater convergence on key
modal points, such as major sea and air ports. There is a need to optimise the road and rail linkages to
and from these key locations to ensure the efficient and cost-effective movement of freight and transport.
Intermodal transport facilities describe the interface between two or more transport modes. Intermodal
facilities of varying efficiencies are located at these interchange points and are critical components of a
seamless, integrated transport system, that can link all modes coherently.
Key intermodal facilities in the southern region include Hobart International Airport – important for high
value, low volume freight – and ports at both Macquarie Point (Antarctic and Southern Ocean vessels
plus cruising ships) and Triabunna (Gunns’ private woodchip port). Additional ports at Self’s Point and
Nyrstar are important for fuel imports and zinc exports respectively.
The new Brighton Transport Hub will see a shift in focus from Macquarie Point to Brighton. Despite
community perceptions, the relationship between the port and the inter-modal facility at Macquarie Point
is not significant, with the majority of freight through Macquarie Point originating through the northern
ports for redistribution within Greater Hobart.
Page | 39
Southern Tasmania Regional Land Use Strategy
The Regional Transport System
7. Marine and Aviation Transport Systems
As an island, Tasmania is entirely dependent on sea and air services for interstate and international
freight and passenger movements. Sea ports are particularly important with over 99% of Tasmania’s
total export freight task by volume being moved by sea, making the reliability, capacity, efficiency and
frequency of shipping services and the efficiency of port infrastructure and operations a significant factor
in industry competitiveness in mainland and international markets.
Tasmania is however a small player in both national and global transport systems and is principally an
origin/destination port in the logistics chain, not being part of a larger sea based transport chain. There is
a lack of direct international sea freight services for specific bulk trades as well as general cargo. This is
a result of the small scale nature of the State which reduces the scope to expand services to any
significant degree. In 2006, Tasmania’s international exports totalled $2.63 billion with imports totalling
600 million. Major products by value include zinc, aluminium, copper ore and meat products.
Asia is Tasmania’s major export destination, with key markets including Japan and China. The overall
trend in Tasmania’s trade has been towards an increase in total volumes. The port of Bell Bay is the
most significant in terms of tonnage, with a total throughput of around 6.1 million tonnes in 2004/2005.
Tasmania’s sea freight task has grown strongly over the last five years, with four shipping lines providing
regular services between Tasmania and Melbourne. Toll shipping operates between Port Melbourne and
Burnie with two cargo vessels of 520TEU capacity, the Tasmanian Achiever and the Victorian Reliance.
These sail seven days a week each in alternate directions. Patrick shipping operates two vessels, the
Searoad Mersey and the Searoad Tamar between Port Melbourne and Devonport six days a week. The
Government owned TT-Line operates two passenger vessels including the Spirit of Tasmania - I and II
which link Devonport to Melbourne, although as discussed below these passenger services carry only a
proportion of the passenger movement in Tasmania.
Direct international shipping services are currently provided through Bell Bay (to Singapore and Malaysia
via Fremantle), which is serviced on a weekly basis. Other international freight is transhipped via
Melbourne, for either on-carriage from there or another Australian port. International shipping services
are in an evolving process with expansion occurring on a gradual scale. Competitive forces heavily
influence Service provision and changing market needs, with efficiencies of scale a key issue for both
shipping lines and ports.
Visits to Tasmania made by international shipping lines are dependent on sufficient trade volumes being
available to make the services offered feasible, an example being wood veneer exports by Ta Ann. A
major consideration for international shipping is the additional costs associated with including Tasmania
in regularly scheduled services, versus the relatively small trade volumes available, dispersed across
many international destinations and origins. An increase in direct international services is therefore
unlikely unless there is significant growth in the available international trade to and from Tasmania.
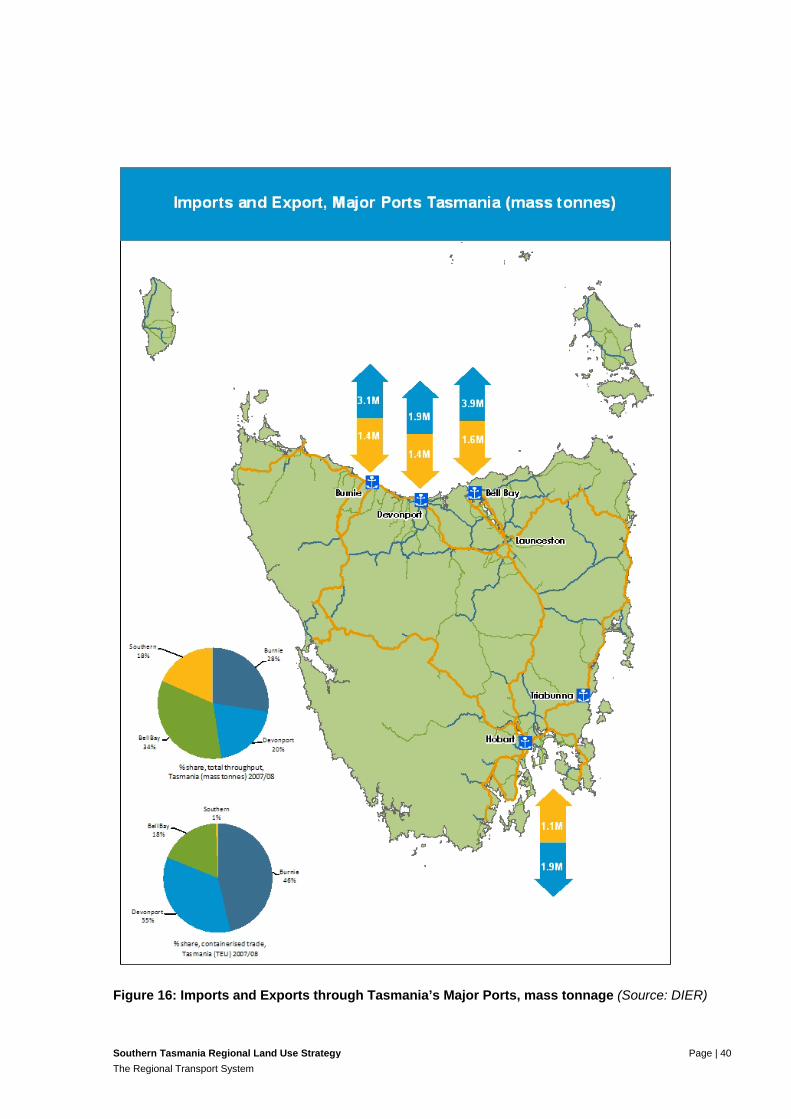
Page | 40
Southern Tasmania Regional Land Use Strategy
The Regional Transport System
Figure 16: Imports and Exports through Tasmania’s Major Ports, mass tonnage (Source: DIER)
Page | 41
Southern Tasmania Regional Land Use Strategy
The Regional Transport System
Tasmania’s port system evolved over two centuries with four major ports located at Burnie, Devonport,
Bell Bay and Hobart, all of which are now managed by Tasports, with only the Hobart port being located
within the southern region. However the role and importance of the Hobart port at Macquarie Point in
terms of its State significance to freight movement, has declined, with freight now moving mainly through
the northern ports due to the efficiencies and economies of scale that have been pursued by commercial
freight operators, and the distance of Hobart Port from major shipping routes. It is now easier and
cheaper to move product through the northern ports and then overland by road or rail within Tasmania.
The Hobart port has the lowest throughput in terms of mass tonnage and container numbers, although
the composition of freight going over the berths is broad and includes the import of caustic soda (for
paper production at Boyer), timber product (most notably export veneers from Southwood) and metal
products.
Despite the decreasing importance of the Hobart Port (Macquarie Wharf in particular) in the State’s
freight task, the port is still an important asset for Tasmania and represents a unique competitive
advantage for Southern Tasmania. Most importantly the port has the geographical advantage of being a
gateway to Antarctica and Southern Ocean shipping services and research vessels, not only for
Tasmania but importantly on a national basis for Australia (Merrick 2008: 3). This has been recognised in
the recent Master Plan for the Hobart Waterfront. The port also plays a number of other roles critical to
the state:
It is a natural gateway for tourist’s arriving in Hobart by cruise ship. The 2007-08 financial year
saw an increase from just under 24,000 passenger days in Hobart to in excess of 43,000, with
passengers and crew spending an estimated $9.2 million in Tasmania (Merrick 2008: 17).
It has a long history of supporting local industries such as fishing and fish processing, and local
cruising;
It handles visiting domestic and foreign naval shops;
It provides quarantine services to support local industries and Antarctic trade and research; and
It has a state/national and international emergency response role for Tasmania, the Southern
Waters and Antarctica respectively. (Merrick 2008).
The last role also relates to the ability of the port to respond to the sudden closure of road, rail, bridge
and other port state infrastructure, should freight need to be diverted from one of the northern ports to
Hobart.
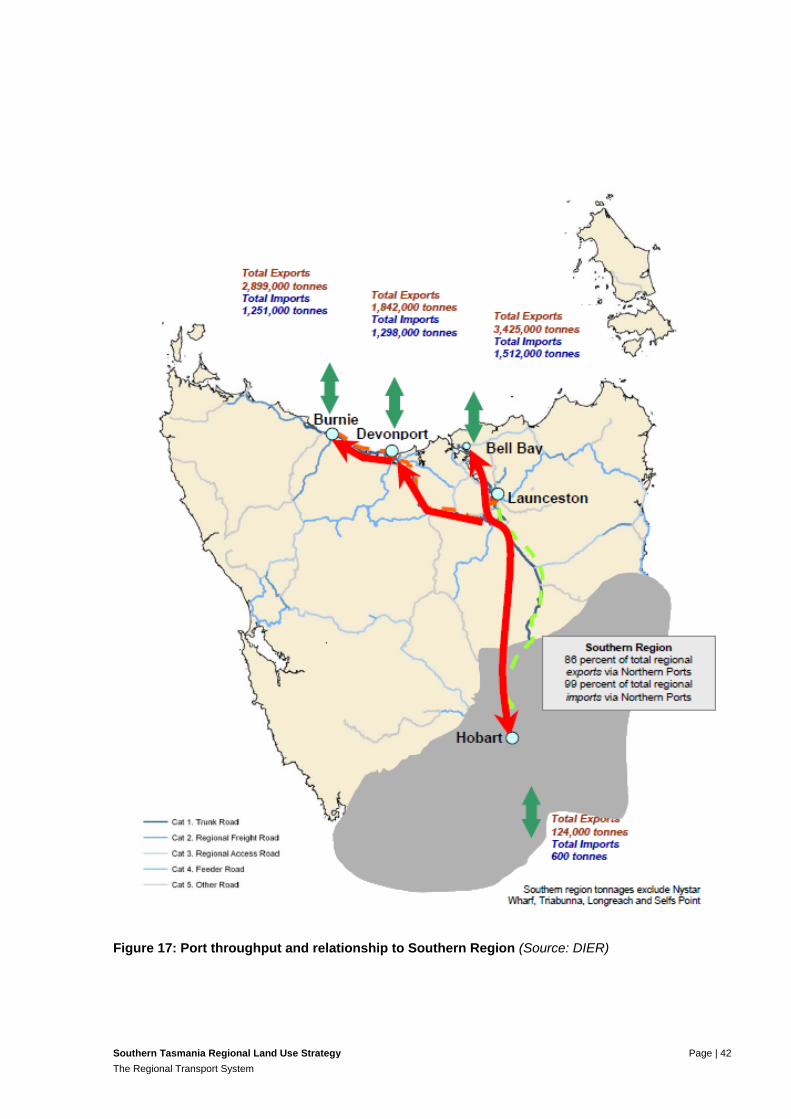
Page | 42
Southern Tasmania Regional Land Use Strategy
The Regional Transport System
Figure 17: Port throughput and relationship to Southern Region (Source: DIER)
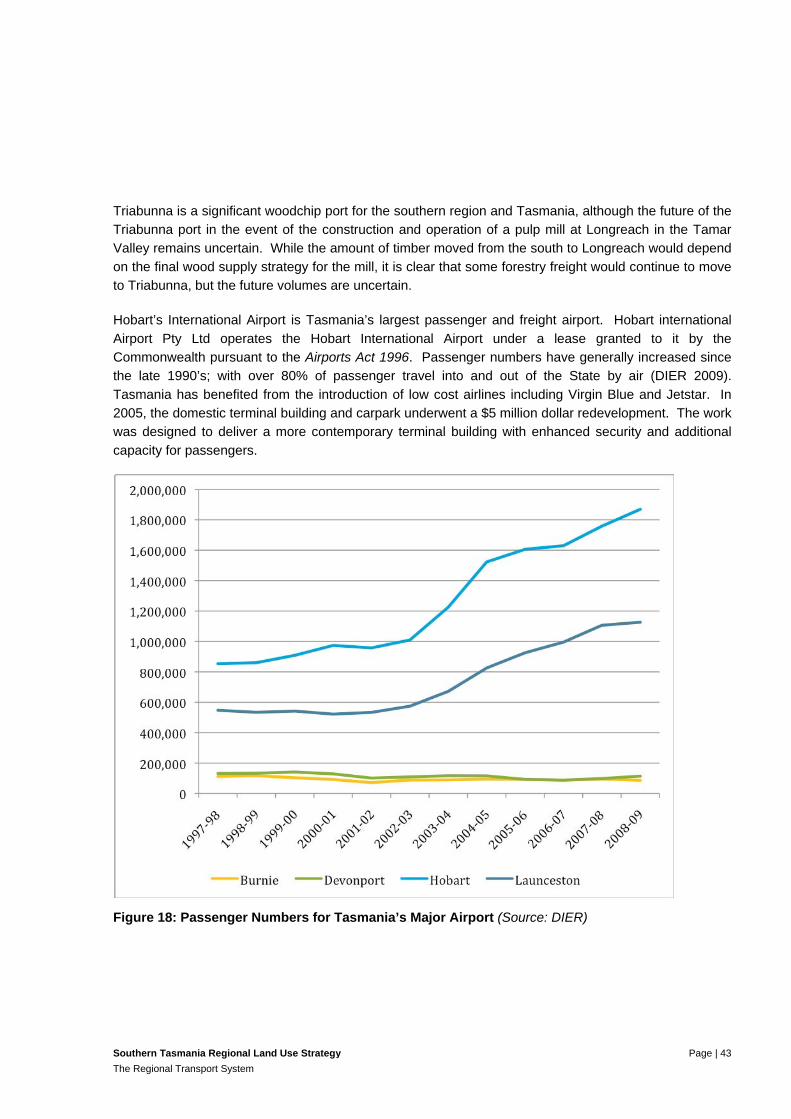
Page | 43
Southern Tasmania Regional Land Use Strategy
The Regional Transport System
Triabunna is a significant woodchip port for the southern region and Tasmania, although the future of the
Triabunna port in the event of the construction and operation of a pulp mill at Longreach in the Tamar
Valley remains uncertain. While the amount of timber moved from the south to Longreach would depend
on the final wood supply strategy for the mill, it is clear that some forestry freight would continue to move
to Triabunna, but the future volumes are uncertain.
Hobart’s International Airport is Tasmania’s largest passenger and freight airport. Hobart international
Airport Pty Ltd operates the Hobart International Airport under a lease granted to it by the
Commonwealth pursuant to the Airports Act 1996. Passenger numbers have generally increased since
the late 1990’s; with over 80% of passenger travel into and out of the State by air (DIER 2009).
Tasmania has benefited from the introduction of low cost airlines including Virgin Blue and Jetstar. In
2005, the domestic terminal building and carpark underwent a $5 million dollar redevelopment. The work
was designed to deliver a more contemporary terminal building with enhanced security and additional
capacity for passengers.
Figure 18: Passenger Numbers for Tasmania’s Major Airport (Source: DIER)
Page | 44
Southern Tasmania Regional Land Use Strategy
The Regional Transport System
With regards to freight, the Hobart airport has a limited task in terms of the overall freight task for the
region and State, as only 1% of Tasmania’s total freight is carried by air (Department of Infrastructure,
Energy & Resources 2006: 153). While details on the specific air freight task of Hobart airport is not
collated, its role is however critical as high value and time dependent industries, such as fish and fresh
flowers, are absolutely dependent upon air movement. In addition other small freight transported through
postal services is dependent upon the Hobart airport. The value and extent of this freight has not been
analysed.
There is also a smaller intrastate airport located at Cambridge.
Page | 45
Southern Tasmania Regional Land Use Strategy
The Regional Transport System
8. Towards better integration
The major elements influencing Tasmania’s transport system into the future include:
highly dispersed settlements,
an increasing freight task,
limited capacity to expand the current road system
ageing transport infrastructure,
rising private car dependence,
a high spatial coverage but low temporal coverage public transport system and
demographic changes.
To date, the lack of regional and state strategic land use planning has resulted in poorly integrated land
use and transport planning frameworks. Further, many past transport infrastructure projects within the
region have resulted in a significant expansion in the outer urban area’s distance from major Activity
Centres, for example duplication of the Southern Outlet, Tasman Highway (Warrane to Hobart Airport)
and Brooker Highway (Claremont to Granton).
In defining the location of different uses of transport, land use planning processes influence where we
travel, our travel distances and times and modes. The integration of land use and transport planning can
reduce costs in providing and maintaining infrastructure and reduce environmental impacts and
greenhouse gas emissions.
Greater integration will also help to increase accessibility by widening choice in transport modes and
reducing travel demand through lessening the need to travel and shorter trips. By shaping the pattern of
development and influencing the location, scale, density, design and mix of land uses, planning can
provide for a number of efficiencies in transport land use systems including:
reducing the need for car dependent travel,
provide a choice of sustainable travel modes including walking and cycling,
reducing travel distances,
reducing the pressure on valuable open space and industrial land
improving freight access to key terminals and
reducing the negative impacts of freight transport on the community
Page | 46
Southern Tasmania Regional Land Use Strategy
The Regional Transport System
Integrated land use and transport planning encourages urban consolidation and development in locations
which are based on existing social and physical infrastructure, such as public transport routes. Greater
integration between land use planning and transport should focus on the movement of goods and people
rather than the dependency on cars. This can be done through a number of means including:
Ensuring new residential developments are located with access to established and proposed
transport networks including public transport, walking and cycling paths;
Improving public transport and walking and cycling networks;
Encouraging activity intensive, transport oriented development, including high employment
generating developments, shopping centres, schools and health facilities in locations that are
accessible to public transport, walking and cycling networks; and
Ensuring that planned transport routes accommodate other transport modes.
Ensuring that the design of subdivisions have regard to the above.
As an island state with an export-oriented economy, Tasmania depends on shipping and air services for
the interstate and overseas movement of goods and passengers. Tasmania’s economy is primarily
based upon freight-intensive bulk commodities and agricultural products. High-value industries such as
seafood and fresh flowers rely on timely market access. Efficient and cost-effective intrastate road and
rail linkages both to and from air and sea ports are therefore vitally important, not only for time dependent
freight by most Tasmanian products (as their economic viability is highly dependent upon successful
export because of limited local market opportunities).
To remain competitive the demands of industry often requires the movement of freight on a 24 hour,
seven days a week basis, which has the potential to significantly impact amenity, particularly through
town centres and on arterial links in proximity to residential areas (GHD Pty Ltd 2007: 60). Ensuring that
the transport system can efficiently and safely meet these demands while minimising land use conflicts
require long term development, planning and management of the transport system.
Future land use planning need not only to take into account the need to ensure that industrial land and
key primary industry and manufacturing areas are either closely located or have efficient access to
strategic transport infrastructure, but also ensure that strategic road and rail assets are protected from
land use conflicts (for example amenity expectations from encroaching residential development). As a
regionally significant road, the management of these land use conflicts along the Brooker Highway is a
prime example, as its role in regional freight movements and distribution to the north of the state from
adjacent industrial areas is crucial.
In addition, the combined use of the road network by freight vehicles, commuters and tourists has the
potential to reduce safety for all users of the network. Planning for future urban areas and tourism
opportunities need to carefully consider such user conflicts.
The future relocation of the intermodal facility from Macquarie Point to Brighton also poses a number of
challenges and opportunities for land use planning. The relocation will create new untested physical
relationships between the major industrial areas within the region of Brighton, Derwent Park and
Page | 47
Southern Tasmania Regional Land Use Strategy
The Regional Transport System
Cambridge. It will however also address some of the concerns associated with heavy vehicle movement
around the Hobart CBD as well as open up potential for the rail corridor from Brighton to Macquarie Point
to be utilised for passenger transport. While there are a number of options in terms of the transport
mode along this corridor, it is clear that land use changes to provide for more transport orientated
development and high densities adjacent to the corridor will be required to make it an effective public
transport corridor. These land use changes in turn will then have wider implications on surrounding land
use and growth within the metropolitan area which will need to be carefully considered in any settlement
strategy.
With regard to port assets in the region, it is recognised that the reservation of, land corridors and surplus
port land for future use, and buffer zoning of land to mitigate external effects of port operations, is
fundamental to provide efficient, cost-effective logistics interfaces to serve the future demand (Merrick
2008: 6). While the role of the Hobart Port at Macquarie Point in particular, has noticeably changed over
the last 50 years, the maintenance of the Hobart port as a small but vital working port to support the
growth and development of Antarctic and Southern Ocean Shipping and marine protection operations is
a critical policy consideration.
Page | 48
Southern Tasmania Regional Land Use Strategy
The Regional Transport System
9. References
Department of Infrastructure, Energy & Resource (2006), Region Background Report – Southern
Integrated Transport Plan, State of Tasmania & Southern Tasmanian Councils Authority
Department of Infrastructure, Energy & Resource (2007), Southern Region Overview Report: A report
informing development of the Southern Integrated Transport Plan, State of Tasmania & Southern
Tasmanian Councils Authority
Department of Infrastructure, Energy & Resource (2009a), Draft Southern Integrated Transport Plan,
State of Tasmania & Southern Tasmanian Councils Authority
Department of Infrastructure, Energy & Resource (2009b), Tasmanian Urban Passenger Transport
Framework: Future Directions for passenger transport in Tasmania’s urban areas, State of Tasmania
Forster, Clive (1999) Australian Cities: Continuity and Change, Oxford University Press, 2nd Edition.
Glenorchy City Council (2008), Planning Scheme Review Project: Topic Papers – Integrated Land Use
and Transport, Draft
Merrick & Associates (2008), Review of the Working Port of Hobart, Tasports Pty Ltd
The Southern Tasmania Regional Planning Project
is a joint initiative of the State of Tasmania, the Southern Tasmanian Councils Authority,
the 12 Southern Councils and the Sullivans Cove Waterfront Authority
Recommended