Cherw
ell D
istr
ict
Sum
mary
South Oxfordshire
District Summary
2020
Published July 2020
South
Oxfo
rdsh
ire D
istr
ict
Sum
mary
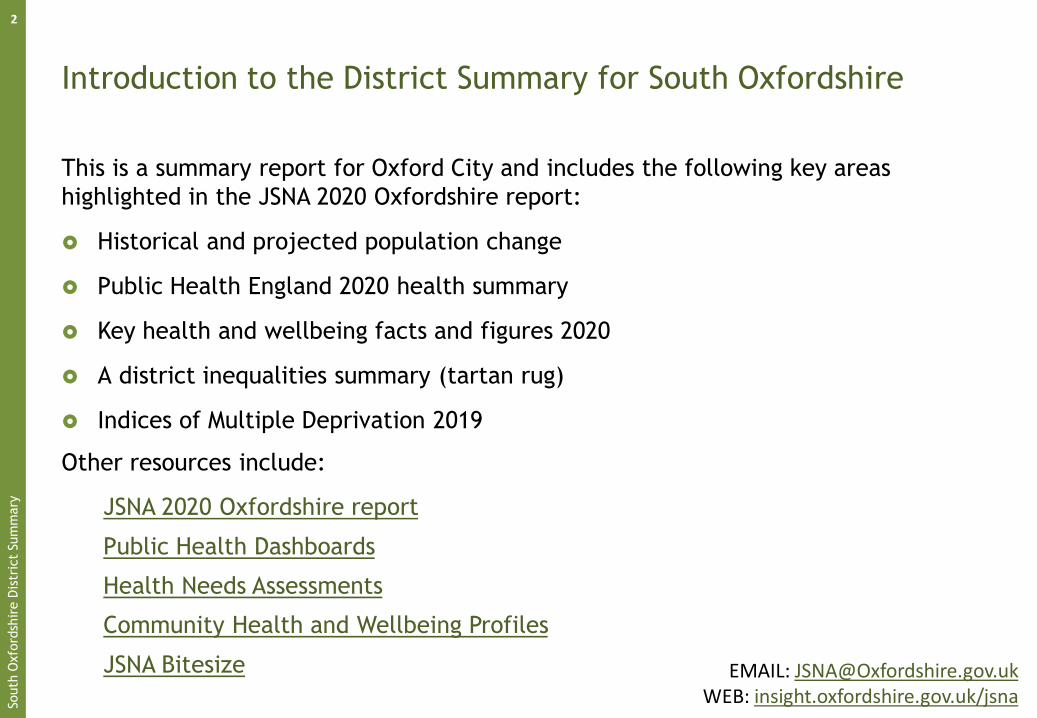
Introduction to the District Summary for South Oxfordshire
This is a summary report for Oxford City and includes the following key areas
highlighted in the JSNA 2020 Oxfordshire report:
Historical and projected population change
Public Health England 2020 health summary
Key health and wellbeing facts and figures 2020
A district inequalities summary (tartan rug)
Indices of Multiple Deprivation 2019
2
EMAIL: [email protected]: insight.oxfordshire.gov.uk/jsna
Other resources include:
JSNA 2020 Oxfordshire report
Public Health Dashboards
Health Needs Assessments
Community Health and Wellbeing Profiles
JSNA Bitesize

South
Oxfo
rdsh
ire D
istr
ict
Sum
mary
South Oxfordshire District Population
In mid-2018 there were 140,500 residents in South Oxfordshire.
There were 4,100 people aged 85+ in South Oxfordshire district.
Between 2008 and 2018 the population of South Oxfordshire increased by +6%,just below Oxfordshire (+8%) and England (+8%).
The population pyramid shows females and males by 5-year age and an increase in the older segment of the working age population aged 50-59 and in older people aged 65+.
3
Historical population change 2008 to 2018
10,000 5,000 0 5,000 10,000
0 - 45-9
10-1415-1920-2425-2930-3435-3940-4445-4950-5455-5960-6465-6970-7475-7980-84
85+
Female 2018 Male 2018
Female 2008 Male 2008
Source: ONS mid-2018 population estimates released June
2019

South
Oxfo
rdsh
ire D
istr
ict
Sum
mary
Population Forecast
The housing-led forecasts show the population of South Oxfordshire increasing from 139,800 in 2017 to 164,700 by 2027 (+24,900, +18%).
There is expected to be a significant increase in the population of the Didcot area with major developments in Great Western Park and east of Didcot.
The population of Didcot and the surrounding area is expected to grow from 36,400 to 51,400 (+41%).
Note that Didcot-related developments to the west of the town, based in Vale of White Horse district, are included in the forecasts for Vale of White Horse.
4
-
50,000
100,000
150,000
200,000South Oxfordshire by broad age
age 65+
age 18-64
age 0-17
-
20,000
40,000
60,000
80,000
100,000
South Oxfordshire - settlements
other areas
Didcot
Henley
Wallingford
Source: JSNA Bitesize Oxfordshire’s Population Forecasts

South
Oxfo
rdsh
ire D
istr
ict
Sum
mary
Health Summary for
South Oxfordshire
The Public Health
England local
health profile for
South Oxfordshire
shows that, for
the majority of
indicators, South
Oxfordshire is
better than or
similar to the
national average
Indicators that are
worse than
average are killed
and seriously
injured on roads
and estimated
diabetes diagnosis
rate
5
Source: PHE, Local
Health – Public
Health England

South
Oxfo
rdsh
ire D
istr
ict
Sum
mary
6
Not in education, employment or
training
Homeless households in priority need
Adults overweight
or obese
Deaths from drug misuse
(3 years)
New Sexually Transmitted Infections
Mothers smoking at birth
Babies born
South Oxon population
Year 6 children overweight or obese
Apprentice-ships started
Reception children overweight or obese
Under 18 conceptions
Average female salary
Average male salary
Adults are physically
active
Adults have chronic obstructive pulmonary
disease
Adults diagnosed with
depression
Adults with coronary heart
disease
Adults with long-term illness or
disability
Deaths from cancer
Deaths from suicide (3 years)
Occurrences of domestic
abuse
Households in fuel poverty
Adults with diabetes
Average female life expectancy
Adults with dementia
People had a stroke
Hospital admissions due
to falls
Unpaid carers
Average male life
expectancy
Under 18s hospital admissions for
alcohol (3 years)
Average house price
%PRE-BIRTH BIRTHEARLY YEARS
OLDER PEOPLE
END OF LIFE
WORKING AGE
SECONDARY SCHOOL
PRIMARY SCHOOL
Adults smoke
Children living in low income families
Adults are unemployed
http://insight.oxfordshire.gov.uk/cms/joint-strategic-needs-assessment Updated June 2020Icons designed by Freepik from Flaticon
Died at home
7.5 %
South Oxfordshire District health & wellbeing facts and figures 2020
1,483 140,500 7.6%
2743533230179
1,380 £479,557 £34,469 £40,472 1,800 54
7814,77158.6%2,13277.3%14,1053,743
27
307
29 985 18,500 3 411 2,160 4,449 6,059
13,25659582.285.562.9% 2,7011,297
15-24s diagnosed with Chlamydia
Killed or seriously injured on roads
Alcohol hospital admissions aged 40-64

South
Oxfo
rdsh
ire D
istr
ict
Sum
mary
South Oxfordshire
inequalities summary
In South Oxfordshire,
eleven out of twenty-one
wards have no indicators
worse than average
Wards with the most
indicators significantly
worse than average are
Didcot South, Didcot
West, and Sandford & the
Wittenhams
Berinsfield has the fewest
indicators significantly
better than average
7
1 2 2 2 1 2 2 2 1 2 2 1 2 2 3 2 2 2 2 2 2
1 2 1 2 2 2 2 3 2 1 2 2 1 1 3 2 1 2 2 1 1
2 2 2 1 1 2 2 3 2 3 1 2 1 1 3 1 2 2 2 2 2
2 2 2 2 2 2 3 3 1 2 1 1 1 2 3 1 1 2 1 2 1
2 2 2 1 2 2 3 3 2 2 1 2 1 1 3 2 2 2 2 2 1
2 2 2 1 2 2 3 3 1 1 2 1 1 2 3 1 1 2 1 2 2
1 3 1 1 1 1 3 3 1 1 1 2 1 1 1 1 1 1 1 1 1
1 3 1 1 1 1 3 3 1 1 1 2 1 1 1 1 1 3 1 1 1
1 2 2 1 2 2 2 2 2 2 2 2 2 2 2 2 1 2 2 2 2
2 2 2 2 2 2 2 2 2 2 2 2 1 2 2 2 2 2 2 2 2
2 2 2 3 2 1 2 2 2 2 2 2 1 2 2 2 2 1 1 2 2
2 3 2 2 2 2 2 2 2 2 2 2 2 2 2 2 2 2 2 2 2
2 2 2 2 2 2 2 2 2 2 2 2 1 2 2 1 1 2 1 2 1
2 2 2 2 1 2 2 2 2 2 2 2 1 2 2 2 1 2 2 2 2
2 2 3 2 2 2 2 2 2 2 2 2 1 2 2 1 3 2 2 2 2
2 2 3 1 2 2 2 2 2 2 2 2 1 1 2 1 2 2 2 2 1
1 1 1 1 1 1 1 1 1 1 1 1 1 1 1 1 1 1 1 1 1
1 2 1 1 1 1 1 1 2 2 1 1 1 1 2 1 1 1 1 1 1
1 2 1 1 1 1 1 1 1 1 1 1 1 1 2 1 1 1 1 1 1
2 2 2 1 2 2 2 2 2 2 2 2 2 2 2 2 1 2 1 2 1
1 2 2 1 2 1 2 1 2 2 1 2 1 1 2 1 1 2 2 1 1
2 2 2 2 2 0 2 2 2 2 2 2 2 2 2 2 2 2 2 2 2
2 2 2 2 2 2 2 2 2 2 2 2 2 2 2 2 2 2 2 1 2
1 2 2 1 1 2 2 2 2 2 2 1 1 2 1 2 2 2 2 1 1
1 2 2 1 2 1 2 2 1 1 2 2 2 2 2 1 1 2 2 2 1
2 1 1 1 2 2 1 1 1 1 2 1 2 1 3 1 2 1 1 1 2
1 2 2 2 2 2 2 3 2 2 3 2 2 1 2 2 1 2 2 2 2
1 2 1 1 1 1 2 2 1 2 1 1 1 2 1 1 1 2 1 1 1
Deaths from circulatory disease, age under 75 years
Deaths from respiratory diseases
Deaths from stroke
Preventable mortality
Emergency hospital admissions, ages 0-4 years
Obesity: Reception year
Obesity: Year 6
Hospital admissions for injury, ages 0-14 years
Hospital admissions for injury, ages 15-24 years
Hospital admissions for self-harm
Hospital admissions for alcohol-attributable conditions
Life expectancy at birth (Males)
Life expectancy at birth (Females)
Healthy life expectancy at birth (Males)
Healthy life expectancy at birth (Females)
Disability-free life expectancy at birth (Males)
Gars
ingto
n &
Hors
path
Gori
ng
Chin
nor
Benso
n &
Cro
wm
ars
h
Beri
nsf
ield
Chalg
rove
Chols
ey
Did
cot
Nort
h E
ast
Did
cot
South
Did
cot
West
Fore
st H
ill
& H
olt
on
Wall
ingfo
rd
Watl
ingto
n
Wheatl
ey
Woodcote
& R
oth
erf
ield
Hase
ley B
rook
Henle
y-O
n-T
ham
es
Kid
more
End &
Whit
churc
h
Sandfo
rd &
the W
itte
nham
s
Tham
e
Sonnin
g C
om
mon
Disability-free life expectancy at birth (Females)
Income deprivation affecting children
Income deprivation
Child development at age 5 years
Hospital admissions for injury, ages 0-4 years
All cancer incidence (new cases of cancer)
Deaths from all cancers, age under 75 years
Emergency hospital admissions for COPD
Emergency hospital admissions for CHD
Emergency hospital admissions for Stroke
Emergency hospital admissions for heart attack (MI)
Emergency hospital admissions for hip fracture, over 65s
Significantly worse than
Oxfordshire or England
Statistically similar to
Oxfordshire or England
Significantly better than
Oxfordshire or England
For more information, see the Inequalities Indicators Excel Pack
Data are shown at ward level for ward boundaries in place in 2016. Health state life expectancy indicators use ward boundaries in place prior to 2016 which may be different from current boundaries and cause discrepancies in the tartan rug. These indicators are shown in a paler colour scheme.

South
Oxfo
rdsh
ire D
istr
ict
Sum
mary
Index of Multiple Deprivation 2019 at national level
The map shows that 64% (57) of the LSOAs (Lower Layer Super Output Areas) in South Oxfordshire are within the 20% least deprived areas nationally.
Parts of Berinsfield and Didcot West are amongst the 40% most deprived areas nationally.
Least deprived areas in South Oxfordshire are located in parts of Didcot, Thame, Henley-on-Thames, Wallingford and Wheatley all within the 10% least deprived areas nationally.
Overall South Oxfordshire is relatively less deprived as it has moved up from place 200 in 2015 to 202 in 2019 out of 317 Local authorities where 1 most deprived and 317 is least deprived.
8
Source: Indices of Multiple Deprivation 2019
Mapped by District Data Analysis service
The decile bar above shows LSOAs grouped according to how deprived they are , where 1 is most deprived and 10 is least deprived.
EXPLORE the data for districts and small areas with our interactive deprivation dashboard

South
Oxfo
rdsh
ire D
istr
ict
Sum
mary
IMD Ranking within South Oxfordshire
This map shows how all the LSOAs within South Oxfordshire compare to each other.
Areas that score within the 10% most deprived within South Oxfordshire are in parts of Berinsfield, Didcot South, Didcot West and Haseley Brook.
Parts of Chinnor, Forest Hill & Holton, Henley-on-Thames, Sandford & the Wittenhams, Wallingford, Watlington, and Woodcote & Rotherfield are within the 20% most deprived areas in the district.
9
Source: Indices of Multiple Deprivation 2019
Mapped by District Data Analysis service
The decile bar above shows LSOAs grouped according to how deprived they are , where 1 is most deprived and 10 is least deprived.
EXPLORE the data for districts and small areas with our interactive deprivation dashboard

South
Oxfo
rdsh
ire D
istr
ict
Sum
mary
Income Deprivation Affecting Children Index 2019
The Income Deprivation Affecting Children Index (IDACI) is the proportion of children age 0-15 living in income deprived families.
The most deprived areas in the IDACI are in parts of Berinsfield and Wallingford in the 30% most deprived LSOAs nationally.
The least deprived areas are in Woodcote & Rotherfield, Sonning Common, Thame, Didcot and Cholsey all in the 10% least deprived LSOAs nationally.
10
Sources: Indices of Multiple Deprivation 2019 Explorer/
Joint Strategic Needs Assessment 2020
The decile bar above shows LSOAs grouped according to how deprived they are , where 1 is most deprived and 10 is least deprived.
EXPLORE the data for districts and small areas with our interactive deprivation dashboard

South
Oxfo
rdsh
ire D
istr
ict
Sum
mary
Income Deprivation Affecting Older People Index 2019
The Income Deprivation Affecting Older People Index (IDAOPI) is the proportion of those age 60 or over who experience income deprivation.
The most deprived areas in the IDAOPI in South Oxfordshire are located in parts of Didcot South and Henley-on-Thames in the 40% most deprived LSOAs nationally.
The least deprived areas are located in parts of Goring, Woodcote & Rotherfield, Wallingford and Wheatley all in the 10% least deprived LSOAs nationally.
11
Sources: Indices of Multiple Deprivation 2019 Explorer/
Joint Strategic Needs Assessment 2020
The decile bar above shows LSOAs grouped according to how deprived they are , where 1 is most deprived and 10 is least deprived.
EXPLORE the data for districts and small areas with our interactive deprivation dashboard
South
Oxfo
rdsh
ire D
istr
ict
Sum
mary
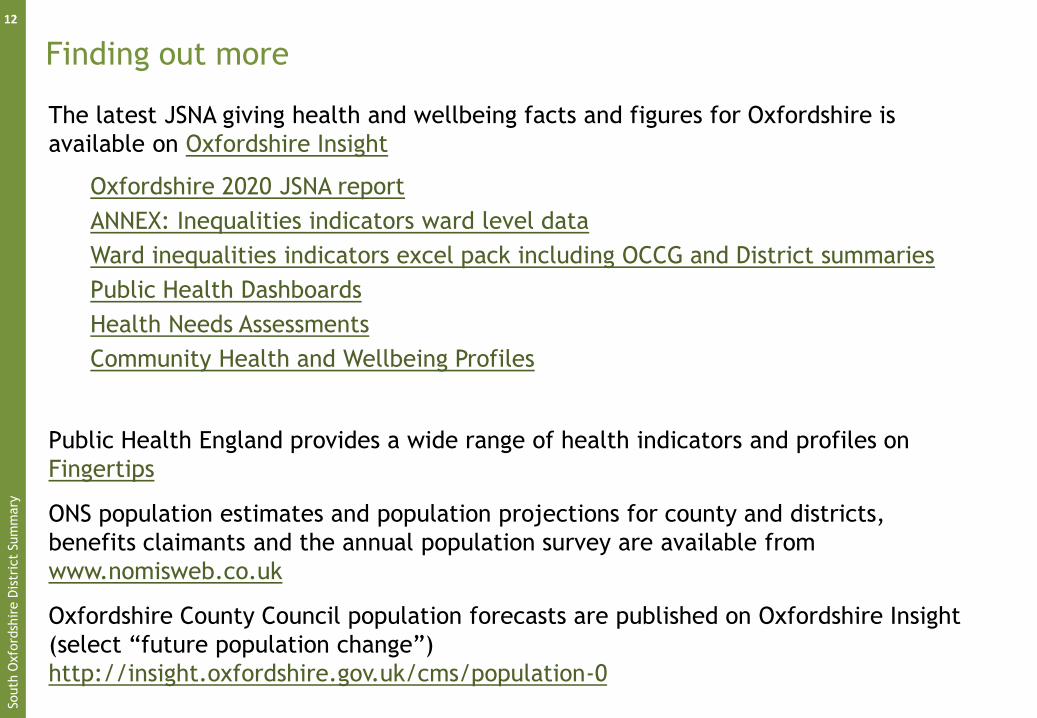
Finding out more
12
The latest JSNA giving health and wellbeing facts and figures for Oxfordshire is
available on Oxfordshire Insight
Oxfordshire 2020 JSNA report
ANNEX: Inequalities indicators ward level data
Ward inequalities indicators excel pack including OCCG and District summaries
Public Health Dashboards
Health Needs Assessments
Community Health and Wellbeing Profiles
Public Health England provides a wide range of health indicators and profiles on
Fingertips
ONS population estimates and population projections for county and districts,
benefits claimants and the annual population survey are available from
www.nomisweb.co.uk
Oxfordshire County Council population forecasts are published on Oxfordshire Insight
(select “future population change”)
http://insight.oxfordshire.gov.uk/cms/population-0
Recommended