THIS REPORT CONTAINS ASSESSMENTS OF COMMODITY AND TRADE ISSUES MADE BY
USDA STAFF AND NOT NECESSARILY STATEMENTS OF OFFICIAL U.S. GOVERNMENT
POLICY
Date:
GAIN Report Number:
Approved By:
Prepared By:
Report Highlights:
The South African retail food sector is sophisticated and well developed relative to other markets on the
African continent. In 2016, the retail sector contributed 9 percent to overall GDP, reaching R491.60
billion (USD $38 billion) in sales. Local retailer are aggressively expanding their footprints into other
African countries giving United States' companies that do business with South African retailers a
gateway to the rest of Sub-Saharan Africa.
Post:
Pretoria
Margaret Ntloedibe,
Agricultural Marketing
Specialist
Laura Geller, Senior
Agricultural Attaché
South Africa Retail Food Industry
Retail Foods
South Africa - Republic of
12/14/2017
Required Report - public distribution
Section I: Market Summary
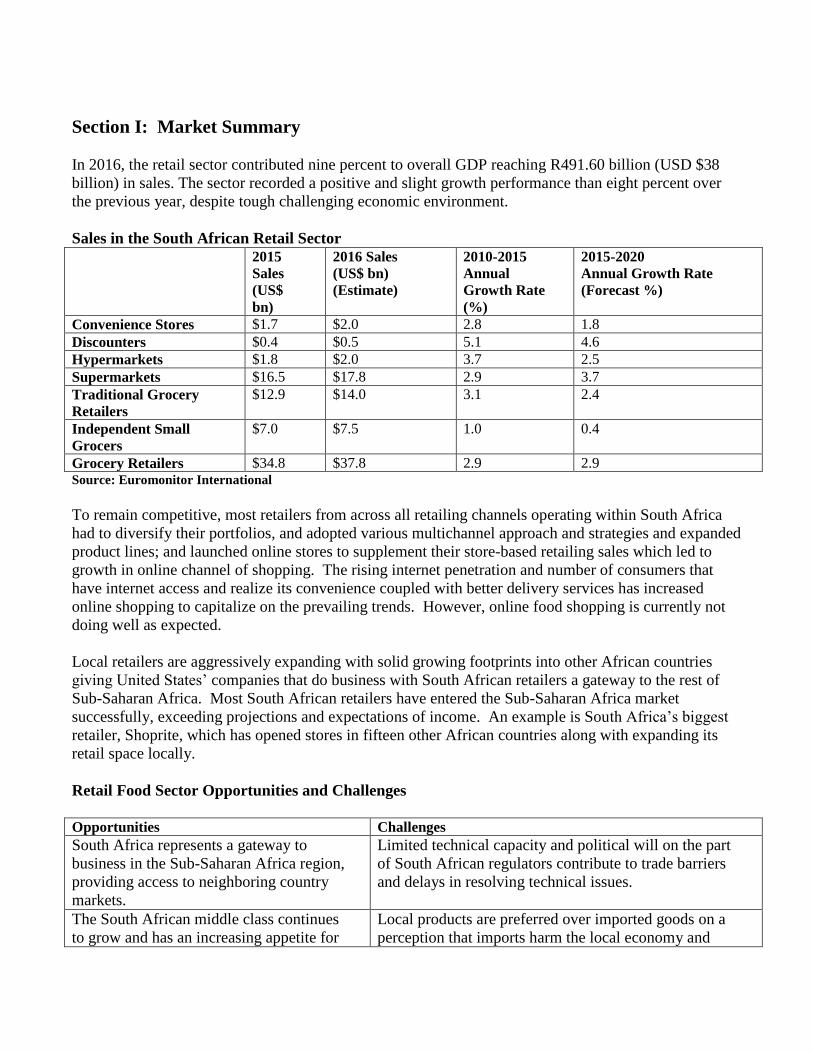
In 2016, the retail sector contributed nine percent to overall GDP reaching R491.60 billion (USD $38
billion) in sales. The sector recorded a positive and slight growth performance than eight percent over
the previous year, despite tough challenging economic environment.
Sales in the South African Retail Sector 2015
Sales
(US$
bn)
2016 Sales
(US$ bn)
(Estimate)
2010-2015
Annual
Growth Rate
(%)
2015-2020
Annual Growth Rate
(Forecast %)
Convenience Stores $1.7 $2.0 2.8 1.8
Discounters $0.4 $0.5 5.1 4.6
Hypermarkets $1.8 $2.0 3.7 2.5
Supermarkets $16.5 $17.8 2.9 3.7
Traditional Grocery
Retailers
$12.9 $14.0 3.1 2.4
Independent Small
Grocers
$7.0 $7.5 1.0 0.4
Grocery Retailers $34.8 $37.8 2.9 2.9 Source: Euromonitor International
To remain competitive, most retailers from across all retailing channels operating within South Africa
had to diversify their portfolios, and adopted various multichannel approach and strategies and expanded
product lines; and launched online stores to supplement their store-based retailing sales which led to
growth in online channel of shopping. The rising internet penetration and number of consumers that
have internet access and realize its convenience coupled with better delivery services has increased
online shopping to capitalize on the prevailing trends. However, online food shopping is currently not
doing well as expected.
Local retailers are aggressively expanding with solid growing footprints into other African countries
giving United States’ companies that do business with South African retailers a gateway to the rest of
Sub-Saharan Africa. Most South African retailers have entered the Sub-Saharan Africa market
successfully, exceeding projections and expectations of income. An example is South Africa’s biggest
retailer, Shoprite, which has opened stores in fifteen other African countries along with expanding its
retail space locally.
Retail Food Sector Opportunities and Challenges
Opportunities Challenges
South Africa represents a gateway to
business in the Sub-Saharan Africa region,
providing access to neighboring country
markets.
Limited technical capacity and political will on the part
of South African regulators contribute to trade barriers
and delays in resolving technical issues.
The South African middle class continues
to grow and has an increasing appetite for
Local products are preferred over imported goods on a
perception that imports harm the local economy and
high value consumer goods. jobs.
Consumers place an increasingly high
value on choice, and U.S. products are
regarded as adding variety to the retail
landscape.
European products are regarded as high quality and have
greater market access due to the Trade, Development
and Cooperation Agreement (TDCA) and the South
Africa-EU Free Trade Agreement.
Some parts of the South African
government and industry are interested in
strengthening the U.S.-South Africa trade
relationship.
Protectionist policies on livestock products continue to
undermine the bilateral trade relationship.
South Africa importers and distributors
actively market brand name consumer
goods, including U.S. products.
Lower-income consumers do not exhibit brand loyalty.
Consumers in general are price-conscious so product
promotion must be ongoing.
A growing young population which tends
to prefer processed, easily-available foods
and are active users of the internet and
mobile devices.
Differences in consumer classes and regions are distinct.
Section II: Road Map for Market Entry
Entry Strategy
The South African retail market could be very sophisticated and complex. In South Africa’s very
competitive marketplace it is essential that U.S. exporters choose the correct agent or distributor.
Exporting through agents or representatives would give a new-to-market entry advantages and is the
safest way to enter the South African retail food market. In addition to their role as local representatives
of U.S. exporters, agents should be able to handle the necessary customs clearance, regulatory
requirements, port and rail charges, documentation, warehousing, and financing arrangements.
The agent or representatives are also fully liable under the South African Import Control Law for all
regulations and control imposed on imported products. Agents are required to register with the Director
of Import and Export Control of the Department of Trade and Industry. Evidence shows that the most
successful U.S. company ventures are those that have researched their market thoroughly before
engaging in a search for agents and distributors. Once contacts are established, it is advisable to visit the
country, since firsthand knowledge of the market is highly useful. It is important for a U.S. exporter to
maintain close contact with the local agent to track changes in importing procedures and to ensure that
the agent is effectively representing the sales interest of the exporter.
Distributors buy and hold stock of products, and can be granted exclusive rights to sell the product in a
particular area or to a particular type of customer. An agreement with a distributor is similar to an
agreement with an agent, except that the price and delivery terms will differ because the distributor is
the principal. When appointing a distributor in South Africa, the same considerations apply as and when
appointing an agent.
To help U.S. agricultural exporters meet credible agents, FAS organizes many market development
activities, including exhibitions promoting U.S. food and agricultural products. U.S. exporters can
participate in these large, multinational exhibitions that draw tens of thousands of buyers and
distributors. FAS also organize buying teams of foreign importers and buyers to visit U.S. food
exhibitions to meet with potential U.S. suppliers. At the exhibitions, FAS provides one-stop service to
potential customers, providing information to buyers, facilitating trade contacts, answering inquiries,
and maintaining a buyer-seller database.
Market Structure
The retail supermarket market structure is somewhat complicated. The supermarket chains maintain
their own distribution systems using modern warehouses to allocate goods to supermarket branches.
Depending on the size of the supermarket chain, imports can be handled by the head office, their
importer or by branches themselves.
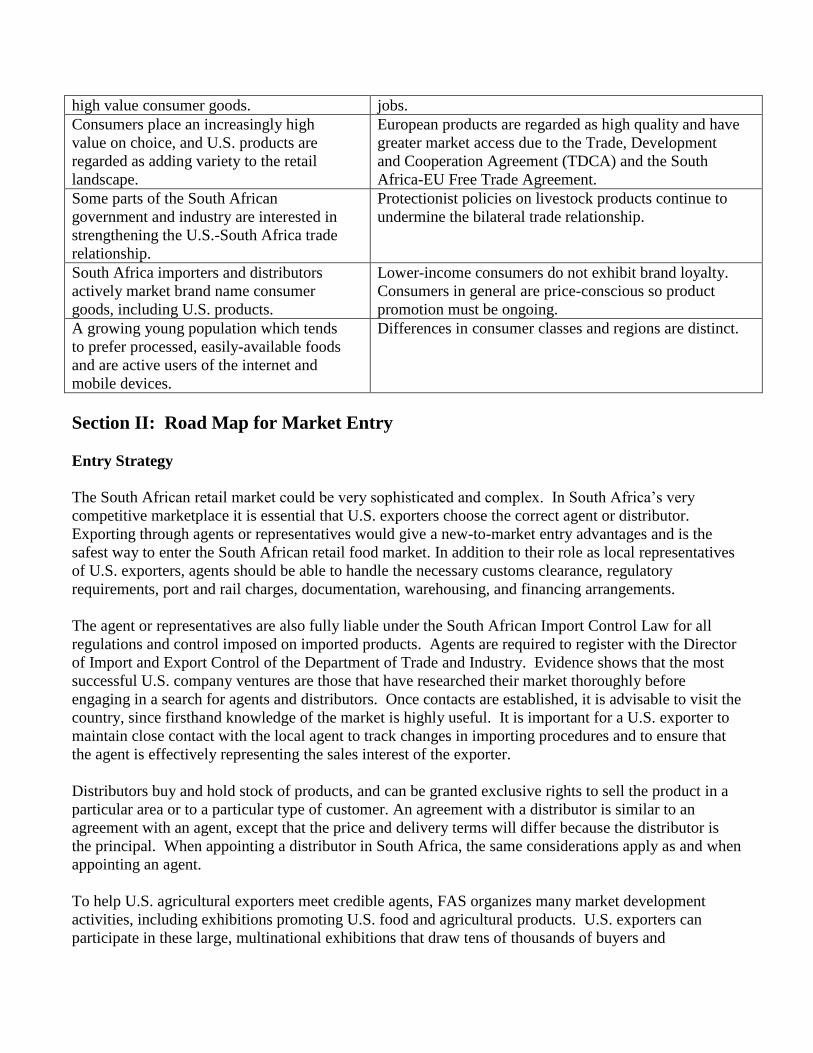
This structure for big supermarkets allows U.S. exporters to make agreements of trade directly with the
buyers of retail stores at the head office level, who will turn to their importers to purchase the products
on their behalf for direct distribution to the consumer. This is a trend in the distribution channel, where
supermarkets are moving towards outsourcing the services of importation, warehousing and
transportation. The small supermarkets on the other hand, do not import directly but source imported
products directly from the importers.
Another strategy in the South African market is through franchising which also provides a good market
entry. According to the Franchise Association of South Africa (FASA), there are 625 franchised
systems, over 39,000 franchise outlets and 17 franchise business sectors. Franchise sector contributes
U.S. Exporter
Importer, Agent,
Distributor
Wholesaler
Retailers
Consumers

around 12.5 percent to South Africa’s gross domestic product (GDP), is an important driver in the
country’s economy, in addition to having one of the highest business success rates. Food franchises
make up about 25 percent of total franchises, with some segments that are considered saturated such as
pizza and burgers. Several U.S, brands have made their entry in the last few years, namely Burger King,
Pizza Hut, Krispy Kreme, Domino’s and most recently, Starbucks.
The following are some of South Africa Organized Agriculture structures that might be of interest
to note:
The Consumer Goods Council of South Arica (CGCSA) - www.cgcsa.co.za
The Agricultural Business Chamber (ABC) – www.agbiz.c.za
The Association of Meat Importers and Exporters of SA (AMIESA) – www.amiesa.co.za
Animal Feed Manufactures Association (AFMA) – www.afma.co.za
Wines of South Africa (WOSA) – www.wosa.co.za
Super Stores, Supermarkets, Hyper Markets or Super Centers, Club and Warehouse Outlets
The South African retail food sector is sophisticated and developed relative to other markets on the
African continent. Five major locally owned corporations dominate the industry, operating warehouses,
wholesale outlets, hypermarkets, supermarkets, and convenient stores throughout South Africa. These
local chains have also successfully expanded with solid growing footprints into other countries in the
Sub-Saharan Africa and the Asia-Pacific regions. Shoprite has 316 stores in nine countries (Angola,
Botswana, Lesotho, Madagascar, Mauritius, Mozambique, Namibia, Swaziland, and Zambia); Pick n
Pay has 73 stores in five countries (Botswana, Lesotho, Namibia, Swaziland, and Zambia); Massmart
operates stores in eleven countries (Botswana, Kenya, Lesotho, Malawi, Mozambique, Namibia,
Nigeria, Swaziland, Tanzania, Uganda, and Zambia); The Spar has 123 stores in four countries
(Botswana, Mozambique, Namibia, and Swaziland); Woolworths has 21 stores in five countries
(Botswana, Lesotho, Mozambique, Namibia, and Zambia); and Fruit & Veg City operates stores in
seven countries of (Botswana, Lesotho, Mauritius, Namibia, Reunion, Zambia, and Zimbabwe. The
value of South Africa grocery retail sales was nearly R491.6 billion in 2016 and is expected to grow due
to retailers having diversified geographic earnings.
South African retailers are stocked with different brands of products appealing to all. Consumers are
learning more about Western foods and food preparations and are interested in a greater variety of
products and brands, including U.S. products. There is also growing demand for healthy and ready-to-
eat products. Stores are looking to provide the consumer with a simplified shopping experience that
saves time. Internet sales are also increasing, albeit slowly for food products.
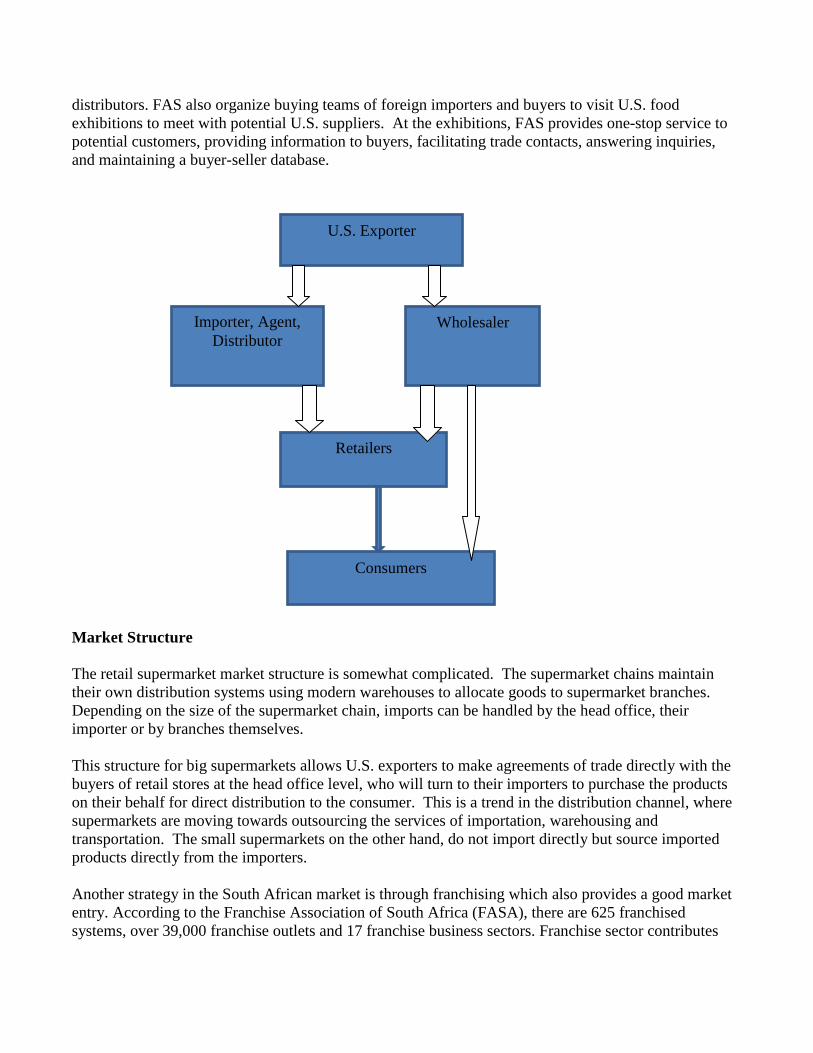
The following table provides an illustration of the significant retail outlets:
Retailer
Name
Ownership 2016 Sales
(USD/Year in
Mil)
No. of
Outlets
Locations
(city/region)
Purchasing
Agent
Type
Shoprite Local N/A 2,276 Sub-Saharan Africa Agent/Importer
Pick n Pay Local N/A 1,700 Sub- Saharan Africa Agent/
Importer
Massmart Local/U.S. $7,019 412 Sub-Saharan Africa Agent/
Importer
The Spar Local/Dutch N/A 821 Sub-Saharan Africa Agent/Importers
Woolworths Local $2,907 940 Sub-Sahara
Africa/Asia-Pacific
Agent/
importer
Fruit & Veg
City
Local $1,071 350 South Africa Africa Agent/Importer
Choppies Botswana N/A 217 Sub-Saharan Africa Agent/Importer
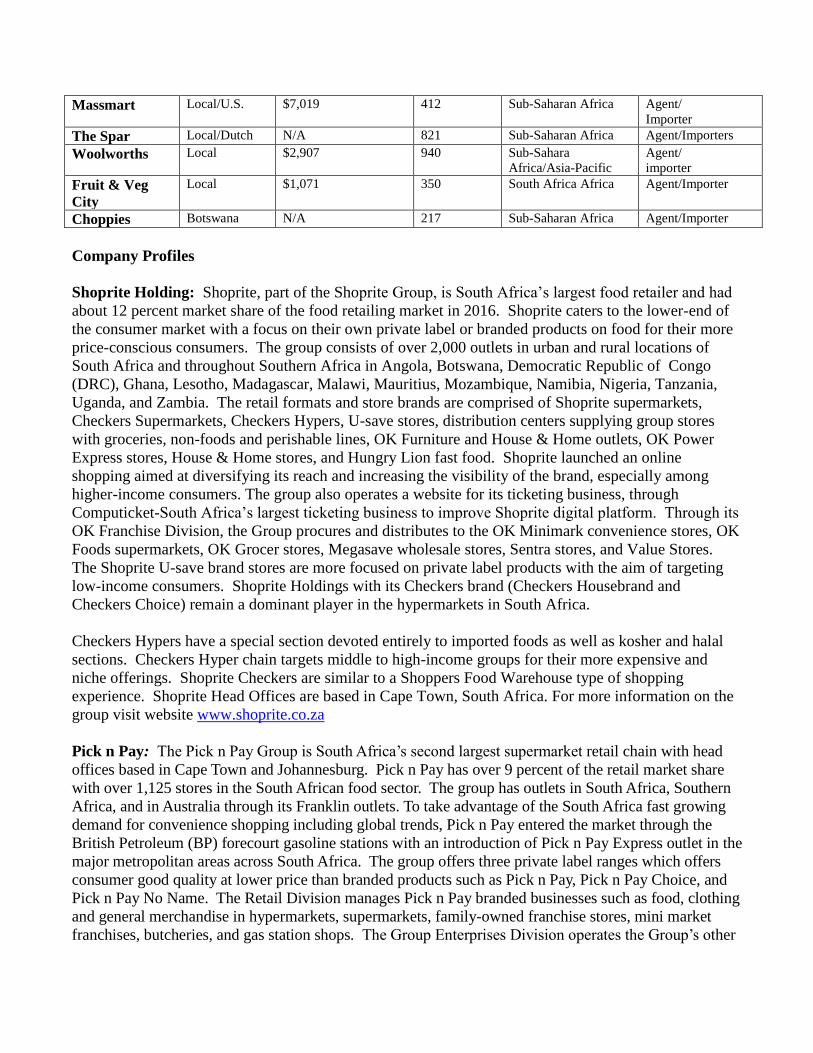
Company Profiles
Shoprite Holding: Shoprite, part of the Shoprite Group, is South Africa’s largest food retailer and had
about 12 percent market share of the food retailing market in 2016. Shoprite caters to the lower-end of
the consumer market with a focus on their own private label or branded products on food for their more
price-conscious consumers. The group consists of over 2,000 outlets in urban and rural locations of
South Africa and throughout Southern Africa in Angola, Botswana, Democratic Republic of Congo
(DRC), Ghana, Lesotho, Madagascar, Malawi, Mauritius, Mozambique, Namibia, Nigeria, Tanzania,
Uganda, and Zambia. The retail formats and store brands are comprised of Shoprite supermarkets,
Checkers Supermarkets, Checkers Hypers, U-save stores, distribution centers supplying group stores
with groceries, non-foods and perishable lines, OK Furniture and House & Home outlets, OK Power
Express stores, House & Home stores, and Hungry Lion fast food. Shoprite launched an online
shopping aimed at diversifying its reach and increasing the visibility of the brand, especially among
higher-income consumers. The group also operates a website for its ticketing business, through
Computicket-South Africa’s largest ticketing business to improve Shoprite digital platform. Through its
OK Franchise Division, the Group procures and distributes to the OK Minimark convenience stores, OK
Foods supermarkets, OK Grocer stores, Megasave wholesale stores, Sentra stores, and Value Stores.
The Shoprite U-save brand stores are more focused on private label products with the aim of targeting
low-income consumers. Shoprite Holdings with its Checkers brand (Checkers Housebrand and
Checkers Choice) remain a dominant player in the hypermarkets in South Africa.
Checkers Hypers have a special section devoted entirely to imported foods as well as kosher and halal
sections. Checkers Hyper chain targets middle to high-income groups for their more expensive and
niche offerings. Shoprite Checkers are similar to a Shoppers Food Warehouse type of shopping
experience. Shoprite Head Offices are based in Cape Town, South Africa. For more information on the
group visit website www.shoprite.co.za
Pick n Pay: The Pick n Pay Group is South Africa’s second largest supermarket retail chain with head
offices based in Cape Town and Johannesburg. Pick n Pay has over 9 percent of the retail market share
with over 1,125 stores in the South African food sector. The group has outlets in South Africa, Southern
Africa, and in Australia through its Franklin outlets. To take advantage of the South Africa fast growing
demand for convenience shopping including global trends, Pick n Pay entered the market through the
British Petroleum (BP) forecourt gasoline stations with an introduction of Pick n Pay Express outlet in the
major metropolitan areas across South Africa. The group offers three private label ranges which offers
consumer good quality at lower price than branded products such as Pick n Pay, Pick n Pay Choice, and
Pick n Pay No Name. The Retail Division manages Pick n Pay branded businesses such as food, clothing
and general merchandise in hypermarkets, supermarkets, family-owned franchise stores, mini market
franchises, butcheries, and gas station shops. The Group Enterprises Division operates the Group’s other
non-Pick n Pay branded group activities including Score Supermarkets, TM Supermarkets, property
franchises, and Go Banking, as well as finding new investment opportunities for the group worldwide.
The emphasis of the supermarket division is on total convenience and freshness, with stores trying to
add value through the fresh food supply chain. Traditionally, Pick n Pay Score supermarkets have had a
presence in townships when other retailers have stayed away, and have now opened its first spaza micro
retail outlet. Pick n Pay is the most modest of the high-end super market chains which focus on low-
priced stapled products for low-income consumers. For more information visit the group website at
www.picknpay.co.za
Massmart Holdings: Massmart is a South Africa based wholesale/retail company, and had a leading
position as a mixed retailer in 2016. The US retailer Walmart purchased Massmart in 2011, and has
grown its footprint since then. Massmart operates stores in eleven countries of Botswana, Kenya,
Lesotho, Malawi, Mozambique, Namibia, Nigeria, Swaziland, Tanzania, Uganda, and Zambia. In South
Africa the retailer operates mass merchandisers, and warehouse clubs outlets. Its wholesale division
Makro, is a leading wholesaler of general merchandise, home improvement equipment and supplies, and
the leading wholesaler of basic foods each focused on high volume, low margin, low-cost distribution of
mainly branded consumer goods. The company invested in food retailing with the addition of the
Foodco brand outlets operated under Game and Makro. In 2016, Massmart introduced hot prepared
food in some of its Game outlets, allowing customers to purchase ready-made food. On the other hand,
products purchased in bulk discount outlets such as CBW and Jumbo Cash & Carry are then resold
through small neighborhood stores, kiosks, and informal traders. Visit the group website
www.massmart.co.za for more information.
Spar Group Ltd: Spar Group Ltd, a subsidiary of Dutch retailer Spar is a wholesaler and distributor of
grocery and non-grocery items to independent stores that operate under Spar brand. The Spar
organization consists of two types of members: Spar Retailers, who are independent store owners, and
Spar Distribution Centers, which provide leadership and services to the Spar Retail members. Both
members belong to the Spar Guild of Southern Africa, a non-profit company set up to coordinate and
develop Spar in Southern Africa. The members pay subscriptions to the Guild, which uses these monies
to advertise and promote Spar. The Spar grocery chain emerged in 1963 when a group of eight
wholesalers were granted exclusive rights to the Spar name in South Africa to service 500 small
retailers. A number of mergers and take-overs followed, and today all but one of the wholesalers are
owned by the Spar Group Limited, which operates six distribution centers that supply goods and
services to over 800 Spar outlets in South Africa, and other countries of Botswana, Mozambique,
Namibia, and Swaziland. Retail formats and brands are comprised of Super Spar (hypermarkets), Spar
and Kwik Spar (supermarkets), and TOPS (Spar liquor stores). TOPs is the largest liquor store chain in
South Africa, mostly located next to Spar brand stores to provide convenience for consumers to
purchase both grocery items and alcoholic beverages.
All SPAR stores are independently owned, and many of the purchasing decisions are made at the
individual store level. Spar targets high-income consumers and locates its stores in more up-market
neighborhoods. Shopping at a Spar can be similar to shopping at an upmarket Giant or Shaw’s in an up-
market neighborhood in the United States. For more information on the group visit www.spar.co.za
Woolworths: Woolworths Holdings Ltd South Africa is a South Africa-based retail group chain that
operates locally and internationally through two subsidiaries, Woolworths Proprietary Limited and
Country Road. Woolworths Proprietary operates and franchises stores in Africa and the Middle East,
while Country Road Limited, listed on the Australian Stock Exchange, operates in Australia, New
Zealand and Singapore. Woolworths offers select ranges of apparel, clothing, cosmetics, toiletries,
footwear, jewelry and food and beverage mostly under its own brand name. There are about 900
Woolworths outlets stores. Woolworths stores are mainly in shopping malls or shopping centers, and
currently are opening food stand-alone stores in convenient suburban locations, including Owned
Woolworths, Franchised Woolworths, and Owned and Franchised Country Road outlets.
Woolworths caters to the wealthiest South African consumers with a strong organic food focus and is
currently expanding long life and grocery sections to achieve higher basket sizes. In focusing on
quality, Woolworths utilizes a high degree of contract farming to supply fresh produce and prepared
convenience foods. Contract farming has enabled Woolworths to carry a wider range of gourmet items,
but often faces supply issues due to compliance issues with contract terms.
The “Woolies” shopping experience is comparable to the Whole Foods or Trader Joe’s shopping
experience in the United States. They carry a relatively small number of branded products, instead
promoting their own Woolworths branded private label products. Price points are slightly higher than
Checkers and Pick n Pay, comparable to similar retail markets in the United States. Woolworths
operates in other African countries including Botswana, Lesotho, Mozambique, Namibia, and Zambia,
with plans underway to expand to Angola, and Uganda. For more information visit the group website at
www.woolworths.co.za
Fruit & Veg City: The Fruit & Veg City is a private South African-based family business. It is South
Africa largest specialist retailer of fruits, and vegetables fresh produce. The Food Lover’s Market chain
food emporium stores are part of the Fruit & Veg City which caters for its discerning customer offers a
range of fresh and gourmet foods. There are over 129 Food Lover’ market stores across South Africa.
The chain has stores throughout Southern Africa in Botswana, Lesotho, Mauritius, Namibia, Reunion,
Zambia, and Zimbabwe, and even in Australia. It also has over 200 FreshStop forecourt stores at Caltex
gas stores. These are one-stop stores for fruit and vegetables, snacks and takeaways (eat-on-the-go). The
chain acquired Market Liquors stores in 2012 to retail and wholesale both liquor and soft drinks. The
Coffee Franchise, Seattle Coffee is part of the chain.
The Choppies Group: Choppies is a food and general merchandise retailer managed through
Botswana, selling a range of products at affordable cost. The group commenced operations in Botswana
in 1986, with a single store under the name “Wayside Supermarket”. The retail group was listed on both
Botswana Stock Exchange in 2012 and the Johannesburg Stock Exchange in 2014. The group has grown
over the past thirty one years as a home brand in Botswana with 217 stores in seven countries: South
Africa, Kenya, Mozambique, Namibia, Tanzania, Zambia, and Zimbabwe. Over 133 stores are outside
Botswana whereby 74 are in the seven provinces (Eastern Cape, Free State, Gauteng, Kwazulu-Natal,
Limpopo, Mpumalanga, and Northwest) of South Africa. The group employs over 16,000 people, 7,000
in Botswana, from its 217 stores. The group has developed Centralized Distribution Centers in
Botswana, South Africa, and Zimbabwe. Currently, the supply in Botswana is 60 percent centralized,
while South Africa and Zimbabwe is at 80 percent and 50 percent respectively. For more information
visit the group website at www.choppies.co.za
Convenience Stores, Gas Marts, Kiosks
Convenience is a trend in South Africa’s fast moving consumer goods (fmcg) market and continues to
be a key growth factor of the South African retail market, due to a growing working middle class
demand for convenience purchases. Around 600 convenience outlets are open throughout the country
and the major retailers and wholesalers own most of them. Woolworths Holdings remains the leader in
convenience stores with Woolworths Food outlets and Woolworths co-located at Engen Forecourts
Quickshops, a national gasoline chain. Pick n Pay Express has also partnered with major gasoline chain
British Petroleum (BP). Sentra Value stores are owned by Shoprite Holdings and Sasol Forecourts joint
ventures focus more in restaurant chains. It is common for convenience stores owned by the same major
retailers to be located at key airports and shopping centers.
Convenience stores operate on extended hours or in some instances are open 24 hours, 7 days a week.
South Africans shop at convenience outlets because it is time saving and easily accessible. Trends in the
food sector confirm increasing demand in the extended choices of food and drink that includes pre-
packed fresh produce and meals, fresh meat, baked goods, home replacement hot meals, soft drinks, and
alcoholic beverages.
Traditional Markets – “Mom and Pop” Small Independent Grocery Stores and Wet Markets
South Africa’s townships and rural areas continue to be seen as key growth areas for retail and it is
increasingly recognized by manufacturers and wholesalers as an important deliver channel of foods to
consumers in the townships. This has promoted the expansion and development of malls in townships
to target on the aspirations of emerging consumers, and major retailers have also extended their services
to these townships.
Although the expansion of malls to townships has been seen as a threat to local micro-enterprises, the
spaza shop remains a strong competitor within South Africa’s retail market. The spaza shop is a small
informal convenience store that traditionally stocked small household items such as bread, maize meal,
cooking oil, sugar and cigarettes, family-owned/run, and ran from one of the rooms in a house or an
outbuilding in the yard. More than 20 percent of spaza owners report that products are now delivered to
their shops. The most serious problems encountered by spaza owners are inventory shortages, access to
loans for finance, high levels of crime (robbery), severe competition, expensive transport due to distance
from the source, and bad debt or the granting of too much credit. Currently, Somali, and Pakistan
dominate the spaza sector in the township due to their strategy of group buying from wholesalers,
enabling them to offer lower prices to customers than their local competitors. Somali-owned stores are
common features in both the cities and townships throughout the country.
Today, with an estimated annual revenue of R7 billion (USD 660 million), South Africa’s spaza shops
continue to be a significant retail channel, especially in townships and informal settlements. Small
grocers such as cafes, street vendors and kiosks also comprise an important part of the independent retail
market.

Despite the significance of the information retail market, imported product is rarely featured at these
outlets other than offal and poultry products. Informal retailers do not have the capacity to buy imported
goods directly and rely mostly on sourcing their products from local wholesale markets.
Independent small grocers presented a value growth of 11 percent in 2016. The government
organization Small Enterprise Development Agency (SEDA) aided small businesses with funding and
advice enabling the increase in number of outlets of traditional small grocers.
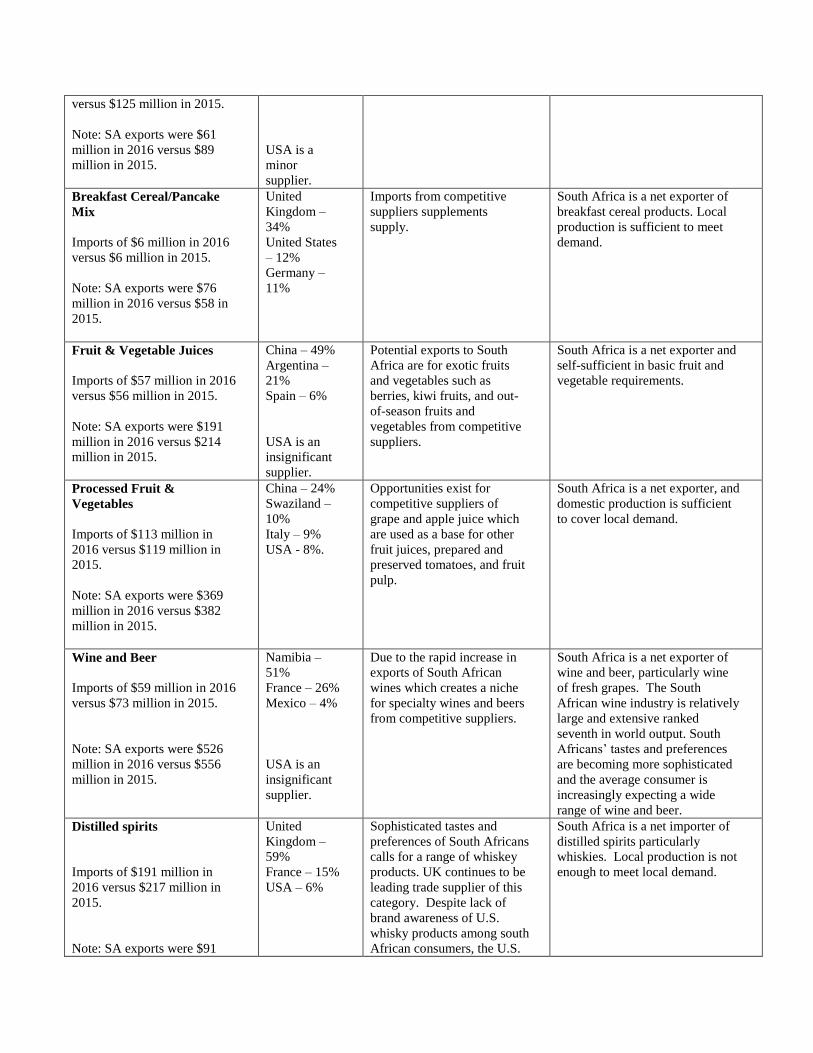
Section III: Competition
South Africa is a member of the World Trade Organization and holds multilateral and bilateral trade
agreements with several other nations. U.S. suppliers mostly face competition from exporter members
of the European Union (EU) and the European Free Trade Association (EFTA) because of the
established free trade agreement with South Africa, including a preferential trade agreement (PTA) with
MERCOSUR.
Product Category Major
Supply
Sources
(2016)
Strengths of key Supply
Countries
Advantages and Disadvantages
of Local Suppliers
Red Meats
Fresh/Chilled/Frozen
Imports from the world of
$124 million in 2016 versus
$152 million in 2015.
Note: SA exports were $134
million in 2016 versus $134 in
2015.
Botswana –
19%
Namibia –
19%
Spain - 14%
USA is an
insignificant
supplier.
The pattern of imports in this
category is variable and
depends largely on local
conditions, including quality
and competitive pricing by
the suppliers. Germany a
leading supplier due to Free
Trade Agreement (FTA) with
South Africa as a member of
the European Union.
South Africa produces very high
quality beef.
Poultry Meat
Imports of $277 million in
2016 versus $281 million in
2015.
Note: SA exports were $61
million in 2016 versus $70
million in 2015.
Brazil – 29%
Netherlands –
27%
United
Kingdom –
11%
USA is a
minor
supplier with
a 5% market
share.
Brazil and EU countries
remain leading trading
partner for South Africa in
terms of poultry due to the
EU’s FTA with South Africa.
Domestic demand for poultry
meat is growing and outpaces the
performance of any other proteins
on the market. Domestic
producers are unable to meet
consumption needs. South
Africa’s major chicken producers
are Astral foods, Rainbow
Chickens, Pioneer Foods,
Sovereign and Dagbreek.
Turkey Meat
Imports of $21 million in 2016
versus $20 million in 2015.
Note: SA exports were $2
million in 2016 versus $3
Brazil –55%
Canada –
18%
United
Kingdom –
11%
Competition, price and
quality are the key strengths
of these suppliers. With the
growing trend towards
healthier lifestyles, turkey
products are becoming
popular.
South Africa is a net importer of
turkey meat products. Local
production is inadequate since
turkey meat is not a South African
favorite, and is not commonly
consumed except during
Christmas time. However, the
million in 2015.
USA is a
minor
supplier with
a 5% market
share.
trend is changing, as turkey is
starting to appear more on
restaurant menus.
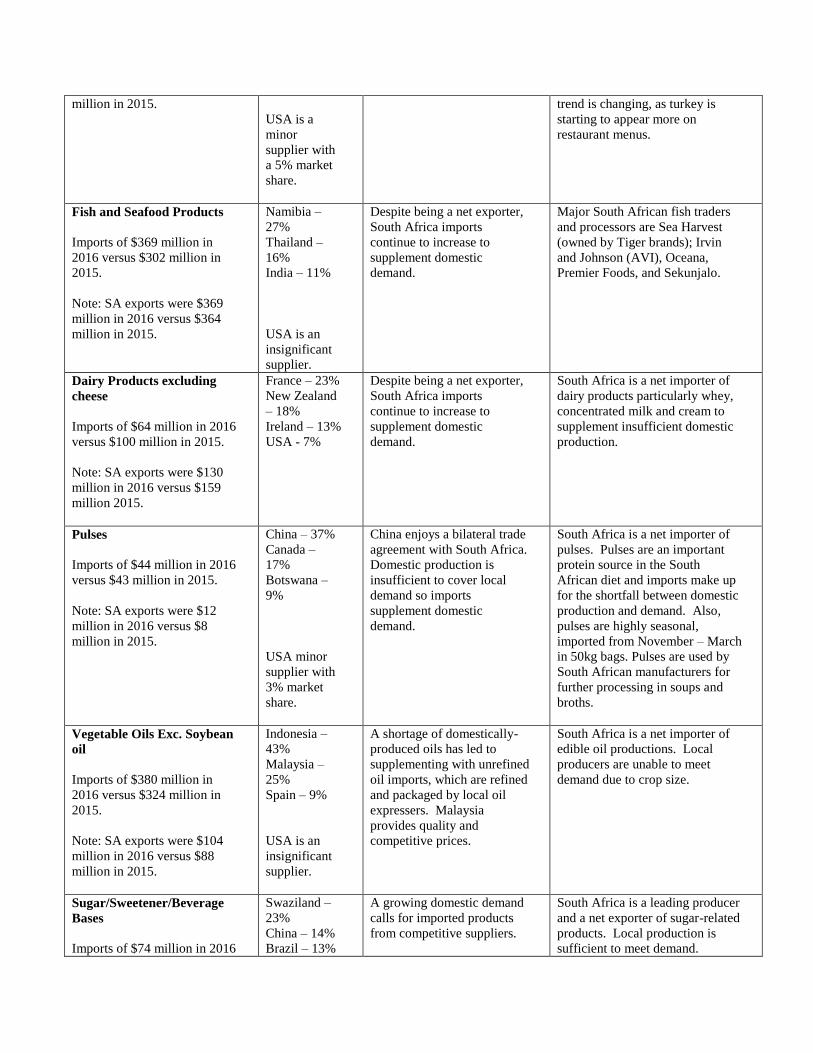
Fish and Seafood Products
Imports of $369 million in
2016 versus $302 million in
2015.
Note: SA exports were $369
million in 2016 versus $364
million in 2015.
Namibia –
27%
Thailand –
16%
India – 11%
USA is an
insignificant
supplier.
Despite being a net exporter,
South Africa imports
continue to increase to
supplement domestic
demand.
Major South African fish traders
and processors are Sea Harvest
(owned by Tiger brands); Irvin
and Johnson (AVI), Oceana,
Premier Foods, and Sekunjalo.
Dairy Products excluding
cheese
Imports of $64 million in 2016
versus $100 million in 2015.
Note: SA exports were $130
million in 2016 versus $159
million 2015.
France – 23%
New Zealand
– 18%
Ireland – 13%
USA - 7%
Despite being a net exporter,
South Africa imports
continue to increase to
supplement domestic
demand.
South Africa is a net importer of
dairy products particularly whey,
concentrated milk and cream to
supplement insufficient domestic
production.
Pulses
Imports of $44 million in 2016
versus $43 million in 2015.
Note: SA exports were $12
million in 2016 versus $8
million in 2015.
China – 37%
Canada –
17%
Botswana –
9%
USA minor
supplier with
3% market
share.
China enjoys a bilateral trade
agreement with South Africa.
Domestic production is
insufficient to cover local
demand so imports
supplement domestic
demand.
South Africa is a net importer of
pulses. Pulses are an important
protein source in the South
African diet and imports make up
for the shortfall between domestic
production and demand. Also,
pulses are highly seasonal,
imported from November – March
in 50kg bags. Pulses are used by
South African manufacturers for
further processing in soups and
broths.
Vegetable Oils Exc. Soybean
oil
Imports of $380 million in
2016 versus $324 million in
2015.
Note: SA exports were $104
million in 2016 versus $88
million in 2015.
Indonesia –
43%
Malaysia –
25%
Spain – 9%
USA is an
insignificant
supplier.
A shortage of domestically-
produced oils has led to
supplementing with unrefined
oil imports, which are refined
and packaged by local oil
expressers. Malaysia
provides quality and
competitive prices.
South Africa is a net importer of
edible oil productions. Local
producers are unable to meet
demand due to crop size.
Sugar/Sweetener/Beverage
Bases
Imports of $74 million in 2016
Swaziland –
23%
China – 14%
Brazil – 13%
A growing domestic demand
calls for imported products
from competitive suppliers.
South Africa is a leading producer
and a net exporter of sugar-related
products. Local production is
sufficient to meet demand.
versus $125 million in 2015.
Note: SA exports were $61
million in 2016 versus $89
million in 2015.
USA is a
minor
supplier.
Breakfast Cereal/Pancake
Mix
Imports of $6 million in 2016
versus $6 million in 2015.
Note: SA exports were $76
million in 2016 versus $58 in
2015.
United
Kingdom –
34%
United States
– 12%
Germany –
11%
Imports from competitive
suppliers supplements
supply.
South Africa is a net exporter of
breakfast cereal products. Local
production is sufficient to meet
demand.
Fruit & Vegetable Juices
Imports of $57 million in 2016
versus $56 million in 2015.
Note: SA exports were $191
million in 2016 versus $214
million in 2015.
China – 49%
Argentina –
21%
Spain – 6%
USA is an
insignificant
supplier.
Potential exports to South
Africa are for exotic fruits
and vegetables such as
berries, kiwi fruits, and out-
of-season fruits and
vegetables from competitive
suppliers.
South Africa is a net exporter and
self-sufficient in basic fruit and
vegetable requirements.
Processed Fruit &
Vegetables
Imports of $113 million in
2016 versus $119 million in
2015.
Note: SA exports were $369
million in 2016 versus $382
million in 2015.
China – 24%
Swaziland –
10%
Italy – 9%
USA - 8%.
Opportunities exist for
competitive suppliers of
grape and apple juice which
are used as a base for other
fruit juices, prepared and
preserved tomatoes, and fruit
pulp.
South Africa is a net exporter, and
domestic production is sufficient
to cover local demand.
Wine and Beer
Imports of $59 million in 2016
versus $73 million in 2015.
Note: SA exports were $526
million in 2016 versus $556
million in 2015.
Namibia –
51%
France – 26%
Mexico – 4%
USA is an
insignificant
supplier.
Due to the rapid increase in
exports of South African
wines which creates a niche
for specialty wines and beers
from competitive suppliers.
South Africa is a net exporter of
wine and beer, particularly wine
of fresh grapes. The South
African wine industry is relatively
large and extensive ranked
seventh in world output. South
Africans’ tastes and preferences
are becoming more sophisticated
and the average consumer is
increasingly expecting a wide
range of wine and beer.
Distilled spirits
Imports of $191 million in
2016 versus $217 million in
2015.
Note: SA exports were $91
United
Kingdom –
59%
France – 15%
USA – 6%
Sophisticated tastes and
preferences of South Africans
calls for a range of whiskey
products. UK continues to be
leading trade supplier of this
category. Despite lack of
brand awareness of U.S.
whisky products among south
African consumers, the U.S.
South Africa is a net importer of
distilled spirits particularly
whiskies. Local production is not
enough to meet local demand.
million in 2016 versus $110
million in 2015.
saw an increase in whisky
exports.
Source: GTA
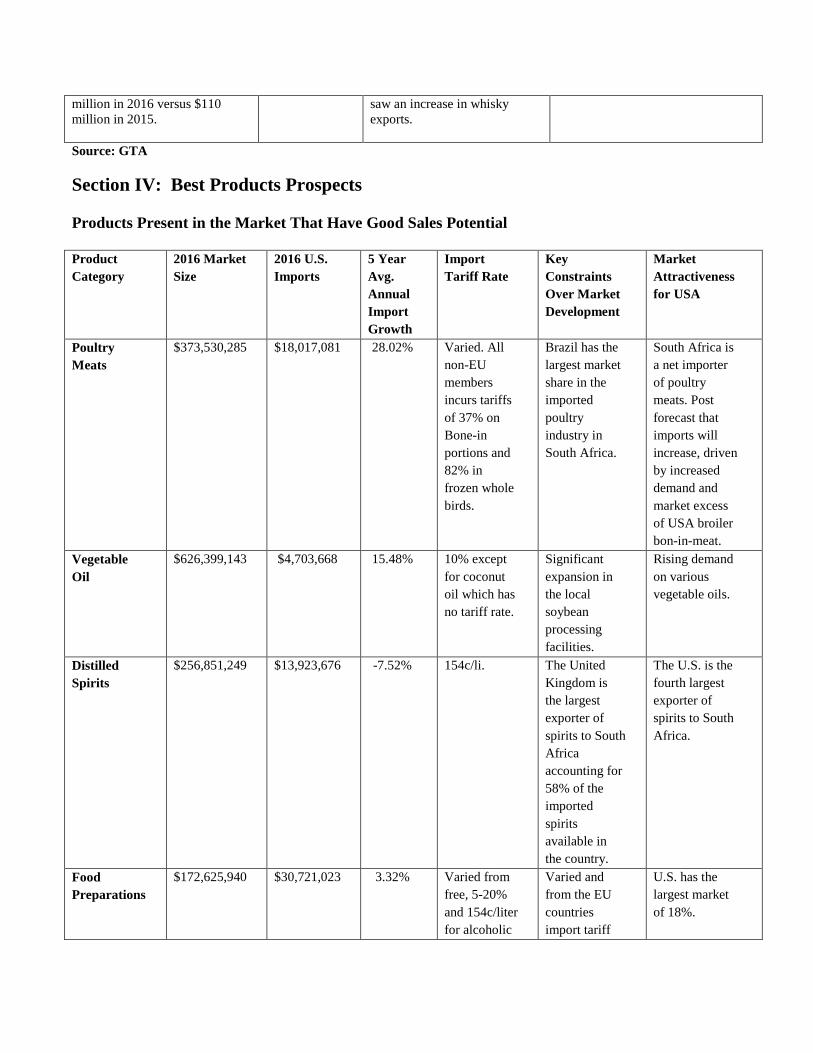
Section IV: Best Products Prospects
Products Present in the Market That Have Good Sales Potential
Product
Category
2016 Market
Size
2016 U.S.
Imports
5 Year
Avg.
Annual
Import
Growth
Import
Tariff Rate
Key
Constraints
Over Market
Development
Market
Attractiveness
for USA
Poultry
Meats
$373,530,285 $18,017,081 28.02% Varied. All
non-EU
members
incurs tariffs
of 37% on
Bone-in
portions and
82% in
frozen whole
birds.
Brazil has the
largest market
share in the
imported
poultry
industry in
South Africa.
South Africa is
a net importer
of poultry
meats. Post
forecast that
imports will
increase, driven
by increased
demand and
market excess
of USA broiler
bon-in-meat.
Vegetable
Oil
$626,399,143 $4,703,668 15.48% 10% except
for coconut
oil which has
no tariff rate.
Significant
expansion in
the local
soybean
processing
facilities.
Rising demand
on various
vegetable oils.
Distilled
Spirits
$256,851,249 $13,923,676 -7.52% 154c/li. The United
Kingdom is
the largest
exporter of
spirits to South
Africa
accounting for
58% of the
imported
spirits
available in
the country.
The U.S. is the
fourth largest
exporter of
spirits to South
Africa.
Food
Preparations
$172,625,940 $30,721,023 3.32% Varied from
free, 5-20%
and 154c/liter
for alcoholic
Varied and
from the EU
countries
import tariff
U.S. has the
largest market
of 18%.
preparations. rate is free to
2.6%.
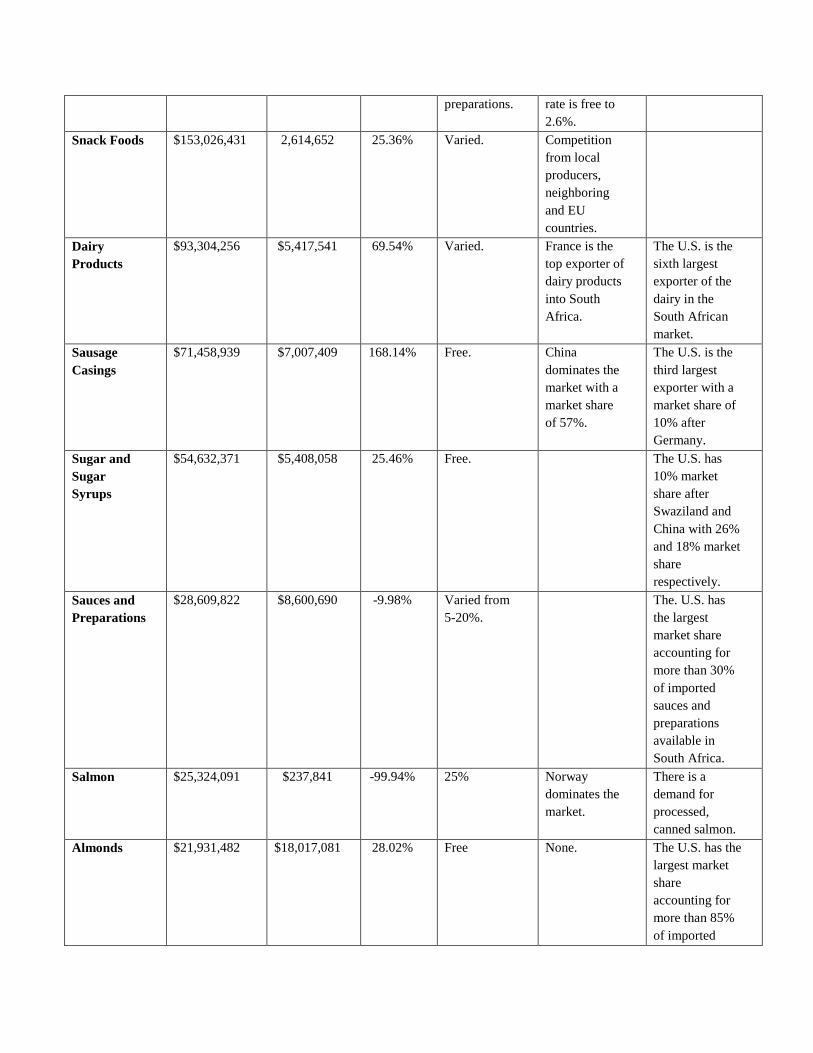
Snack Foods $153,026,431 2,614,652 25.36% Varied. Competition
from local
producers,
neighboring
and EU
countries.
Dairy
Products
$93,304,256 $5,417,541 69.54% Varied. France is the
top exporter of
dairy products
into South
Africa.
The U.S. is the
sixth largest
exporter of the
dairy in the
South African
market.
Sausage
Casings
$71,458,939 $7,007,409 168.14% Free. China
dominates the
market with a
market share
of 57%.
The U.S. is the
third largest
exporter with a
market share of
10% after
Germany.
Sugar and
Sugar
Syrups
$54,632,371 $5,408,058 25.46% Free. The U.S. has
10% market
share after
Swaziland and
China with 26%
and 18% market
share
respectively.
Sauces and
Preparations
$28,609,822 $8,600,690 -9.98% Varied from
5-20%.
The. U.S. has
the largest
market share
accounting for
more than 30%
of imported
sauces and
preparations
available in
South Africa.
Salmon $25,324,091 $237,841 -99.94% 25% Norway
dominates the
market.
There is a
demand for
processed,
canned salmon.
Almonds $21,931,482 $18,017,081 28.02% Free None. The U.S. has the
largest market
share
accounting for
more than 85%
of imported
almonds
available in
South Africa.
Source: Global Trade Atlas
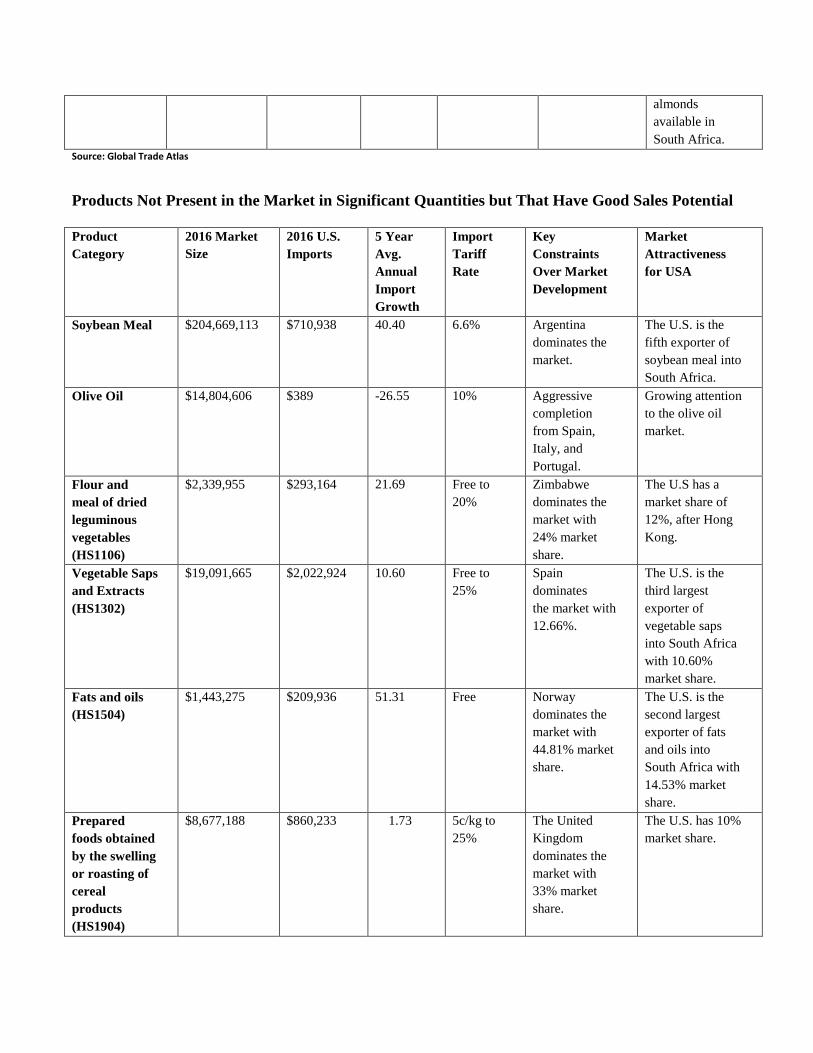
Products Not Present in the Market in Significant Quantities but That Have Good Sales Potential
Product
Category
2016 Market
Size
2016 U.S.
Imports
5 Year
Avg.
Annual
Import
Growth
Import
Tariff
Rate
Key
Constraints
Over Market
Development
Market
Attractiveness
for USA
Soybean Meal $204,669,113 $710,938 40.40 6.6% Argentina
dominates the
market.
The U.S. is the
fifth exporter of
soybean meal into
South Africa.
Olive Oil $14,804,606 $389 -26.55 10% Aggressive
completion
from Spain,
Italy, and
Portugal.
Growing attention
to the olive oil
market.
Flour and
meal of dried
leguminous
vegetables
(HS1106)
$2,339,955 $293,164 21.69
Free to
20%
Zimbabwe
dominates the
market with
24% market
share.
The U.S has a
market share of
12%, after Hong
Kong.
Vegetable Saps
and Extracts
(HS1302)
$19,091,665 $2,022,924 10.60 Free to
25%
Spain
dominates
the market with
12.66%.
The U.S. is the
third largest
exporter of
vegetable saps
into South Africa
with 10.60%
market share.
Fats and oils
(HS1504)
$1,443,275 $209,936 51.31 Free Norway
dominates the
market with
44.81% market
share.
The U.S. is the
second largest
exporter of fats
and oils into
South Africa with
14.53% market
share.
Prepared
foods obtained
by the swelling
or roasting of
cereal
products
(HS1904)
$8,677,188 $860,233 1.73 5c/kg to
25%
The United
Kingdom
dominates the
market with
33% market
share.
The U.S. has 10%
market share.
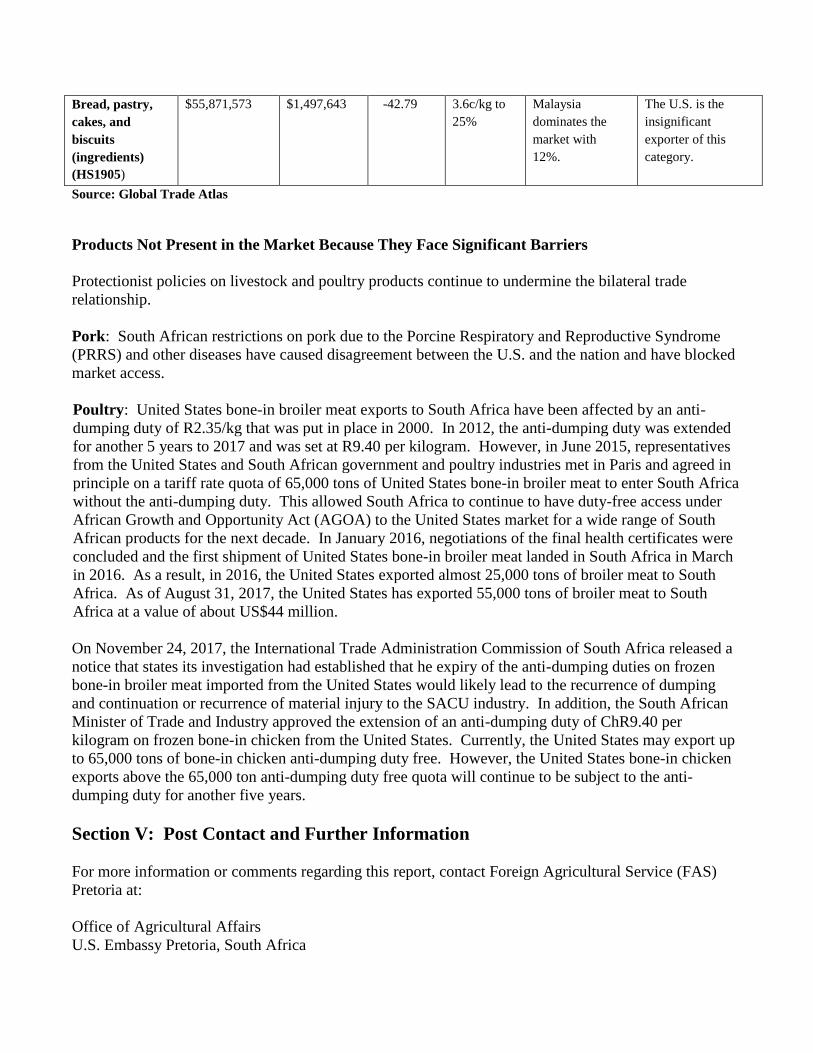
Bread, pastry,
cakes, and
biscuits
(ingredients)
(HS1905)
$55,871,573 $1,497,643 -42.79 3.6c/kg to
25%
Malaysia
dominates the
market with
12%.
The U.S. is the
insignificant
exporter of this
category.
Source: Global Trade Atlas
Products Not Present in the Market Because They Face Significant Barriers
Protectionist policies on livestock and poultry products continue to undermine the bilateral trade
relationship.
Pork: South African restrictions on pork due to the Porcine Respiratory and Reproductive Syndrome
(PRRS) and other diseases have caused disagreement between the U.S. and the nation and have blocked
market access.
Poultry: United States bone-in broiler meat exports to South Africa have been affected by an anti-
dumping duty of R2.35/kg that was put in place in 2000. In 2012, the anti-dumping duty was extended
for another 5 years to 2017 and was set at R9.40 per kilogram. However, in June 2015, representatives
from the United States and South African government and poultry industries met in Paris and agreed in
principle on a tariff rate quota of 65,000 tons of United States bone-in broiler meat to enter South Africa
without the anti-dumping duty. This allowed South Africa to continue to have duty-free access under
African Growth and Opportunity Act (AGOA) to the United States market for a wide range of South
African products for the next decade. In January 2016, negotiations of the final health certificates were
concluded and the first shipment of United States bone-in broiler meat landed in South Africa in March
in 2016. As a result, in 2016, the United States exported almost 25,000 tons of broiler meat to South
Africa. As of August 31, 2017, the United States has exported 55,000 tons of broiler meat to South
Africa at a value of about US$44 million.
On November 24, 2017, the International Trade Administration Commission of South Africa released a
notice that states its investigation had established that he expiry of the anti-dumping duties on frozen
bone-in broiler meat imported from the United States would likely lead to the recurrence of dumping
and continuation or recurrence of material injury to the SACU industry. In addition, the South African
Minister of Trade and Industry approved the extension of an anti-dumping duty of ChR9.40 per
kilogram on frozen bone-in chicken from the United States. Currently, the United States may export up
to 65,000 tons of bone-in chicken anti-dumping duty free. However, the United States bone-in chicken
exports above the 65,000 ton anti-dumping duty free quota will continue to be subject to the anti-
dumping duty for another five years.
Section V: Post Contact and Further Information
For more information or comments regarding this report, contact Foreign Agricultural Service (FAS)
Pretoria at:
Office of Agricultural Affairs
U.S. Embassy Pretoria, South Africa
877 Pretorius Street, Arcadia, Pretoria, 0083
P.O. Box 9536, Pretoria, 0001
Tel: +27-12-431 4235
Fax: +27-12-342 2264
Email: [email protected]
For more information on exporting U.S. agricultural products to other countries, please visit the Foreign
Agricultural Service’s website at: http://www.fas.usda.gov
Post acknowledges the following Sources: The Euromonitor International, the National Statistics of
South Africa, Global Trade Atlas, the retail industry publications and websites, trade press, and trade
industry interviews.
Recommended