Sorting of Motivated Agents: Evidence from Applicants to the German Police
Guido Friebel (Frankfurt, CEPR, IZA)
Wiebke Homann (Frankfurt)
Michael Kosfeld (Frankfurt, CEPR, IZA)
Bernard Richter (Frankfurt)
Gerd Thielmann (Federal Police University)
20 Years of NES,
Moscow, December 2012
Guido Friebel 1 16.01.2013

SORTING AND MOTIVATION
16.01.2013 Guido Friebel 2
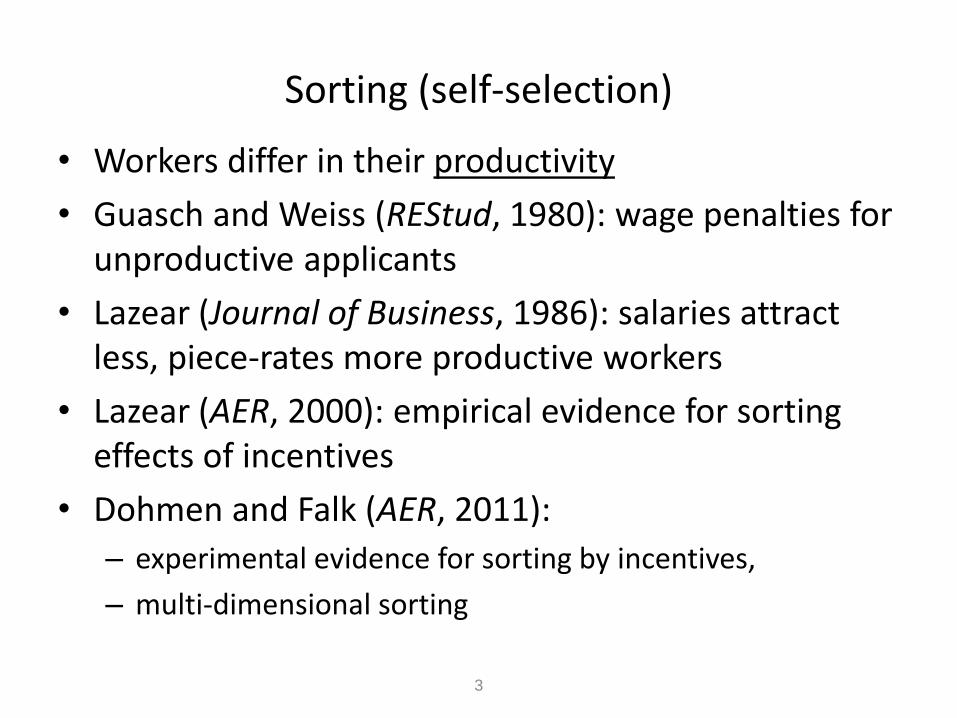
Sorting (self-selection)
• Workers differ in their productivity
• Guasch and Weiss (REStud, 1980): wage penalties for unproductive applicants
• Lazear (Journal of Business, 1986): salaries attract less, piece-rates more productive workers
• Lazear (AER, 2000): empirical evidence for sorting effects of incentives
• Dohmen and Falk (AER, 2011):
– experimental evidence for sorting by incentives,
– multi-dimensional sorting
3
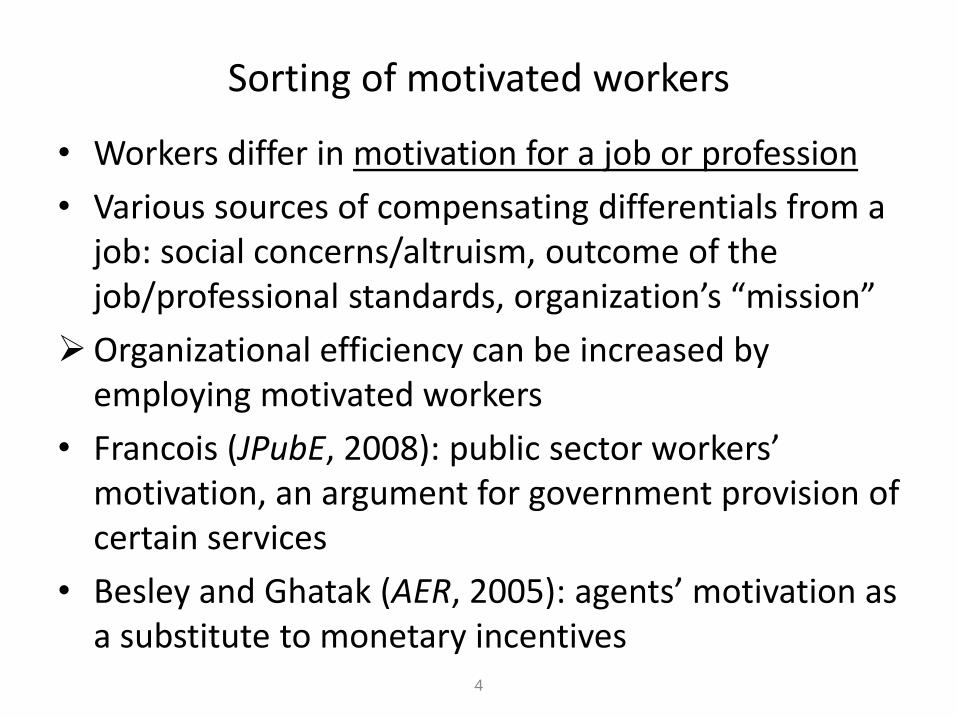
Sorting of motivated workers
• Workers differ in motivation for a job or profession
• Various sources of compensating differentials from a job: social concerns/altruism, outcome of the job/professional standards, organization’s “mission”
Organizational efficiency can be increased by employing motivated workers
• Francois (JPubE, 2008): public sector workers’ motivation, an argument for government provision of certain services
• Besley and Ghatak (AER, 2005): agents’ motivation as a substitute to monetary incentives
4
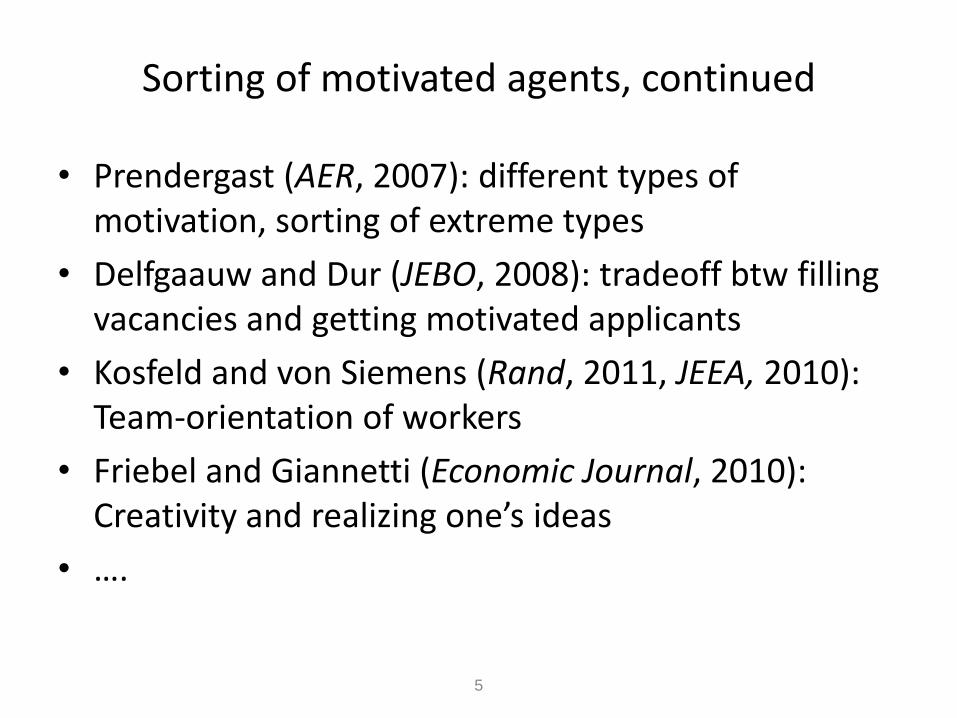
Sorting of motivated agents, continued
• Prendergast (AER, 2007): different types of motivation, sorting of extreme types
• Delfgaauw and Dur (JEBO, 2008): tradeoff btw filling vacancies and getting motivated applicants
• Kosfeld and von Siemens (Rand, 2011, JEEA, 2010): Team-orientation of workers
• Friebel and Giannetti (Economic Journal, 2010): Creativity and realizing one’s ideas
• ….
5
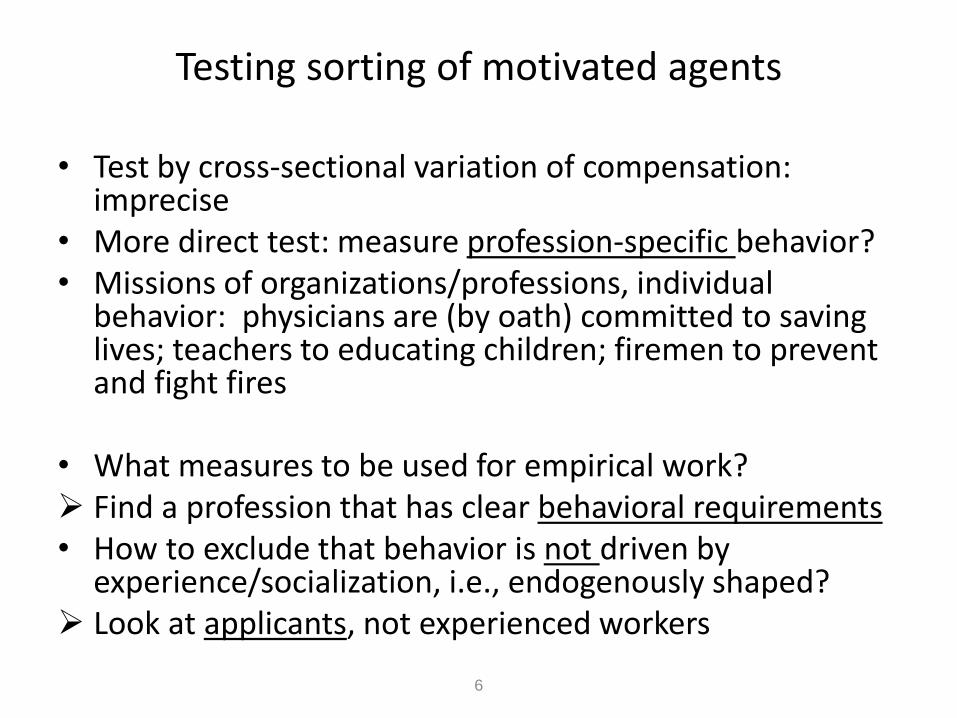
Testing sorting of motivated agents
• Test by cross-sectional variation of compensation: imprecise
• More direct test: measure profession-specific behavior? • Missions of organizations/professions, individual
behavior: physicians are (by oath) committed to saving lives; teachers to educating children; firemen to prevent and fight fires
• What measures to be used for empirical work? Find a profession that has clear behavioral requirements • How to exclude that behavior is not driven by
experience/socialization, i.e., endogenously shaped? Look at applicants, not experienced workers
6
OUR STUDY: POLICE APPLICANTS
16.01.2013 Guido Friebel 7
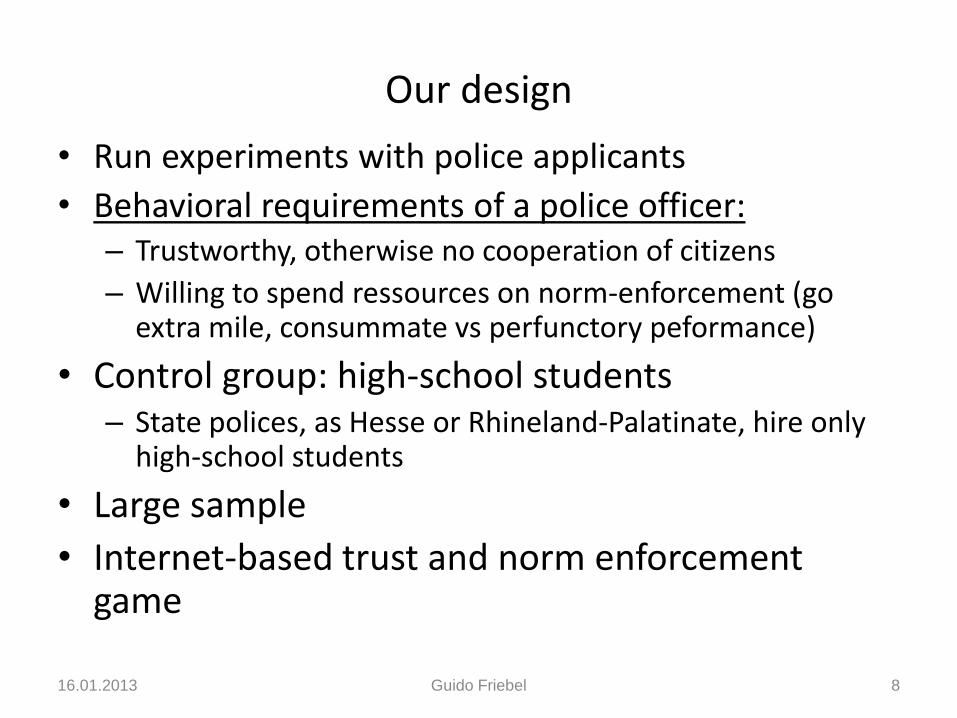
Our design
• Run experiments with police applicants
• Behavioral requirements of a police officer: – Trustworthy, otherwise no cooperation of citizens
– Willing to spend ressources on norm-enforcement (go extra mile, consummate vs perfunctory peformance)
• Control group: high-school students – State polices, as Hesse or Rhineland-Palatinate, hire only
high-school students
• Large sample
• Internet-based trust and norm enforcement game
16.01.2013 Guido Friebel 8
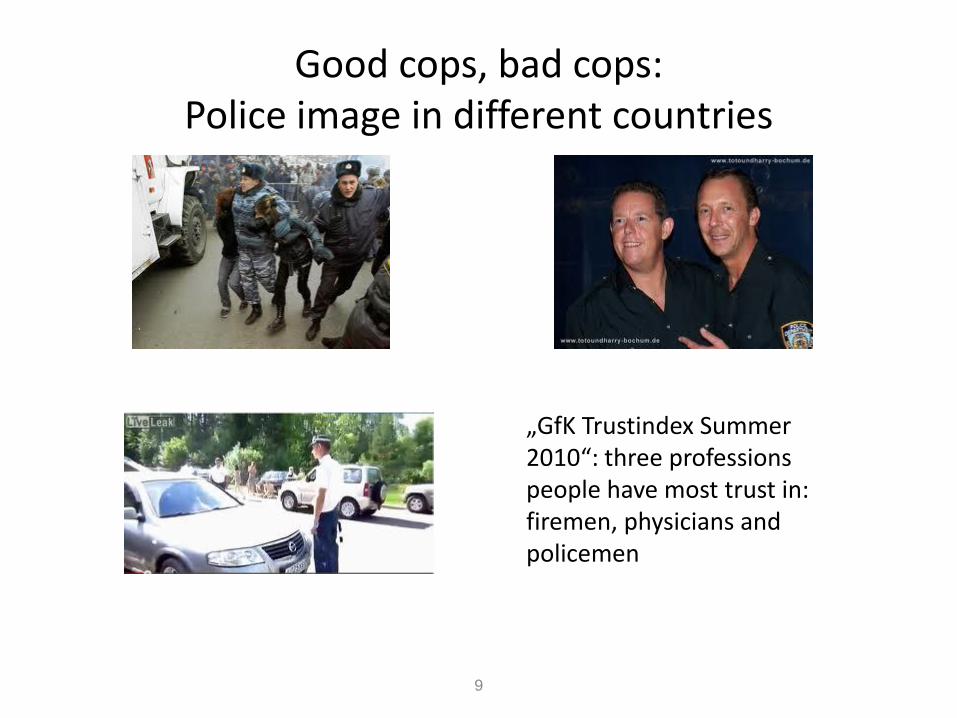
Good cops, bad cops: Police image in different countries
9
„GfK Trustindex Summer 2010“: three professions people have most trust in: firemen, physicians and policemen

What is a good policeman? • NYPD: “in partnership with the community, we pledge
to: • Maintain a higher standard of integrity than is generally
expected of others because so much is expected of us. • Value human life, respect the dignity of each individual
and render our services with courtesy and civility. • Fight crime by preventing it and by aggressively pursuing
violators of the law.
• German Police: • „Polizei, Dein Freund und Helfer“ • „to avert danger for public security and order“
Trustworthiness Willingness to enforce norms
10
The experiment
• State police: Hesse, Rhineland-Palatinate
• Applicants are pre-screened
• Then, various tests, physical, psychological, IQ
• College
• Our applicants are not even pre-screened, they have just filled in their application
• Police applicants and non-applicants: contacted with same letter
• Through Police, schools
• Several thousands of people are invited
11
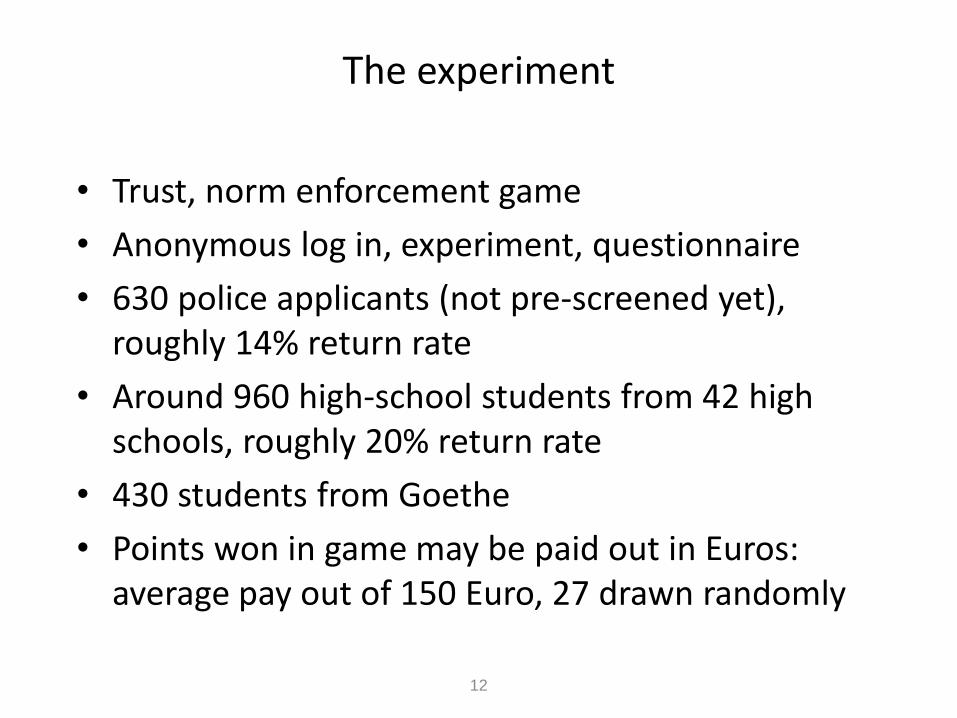
The experiment
• Trust, norm enforcement game
• Anonymous log in, experiment, questionnaire
• 630 police applicants (not pre-screened yet), roughly 14% return rate
• Around 960 high-school students from 42 high schools, roughly 20% return rate
• 430 students from Goethe
• Points won in game may be paid out in Euros: average pay out of 150 Euro, 27 drawn randomly
12
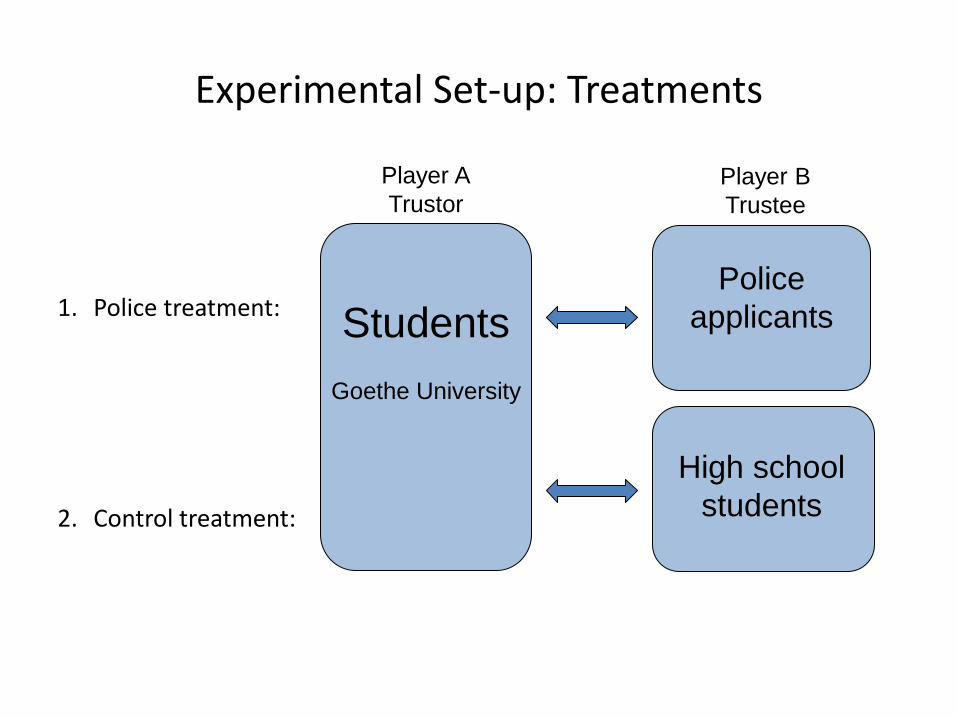
Experimental Set-up: Treatments
1. Police treatment:
2. Control treatment:
Students
Goethe University
Police
applicants
High school
students
Player A
Trustor Player B
Trustee
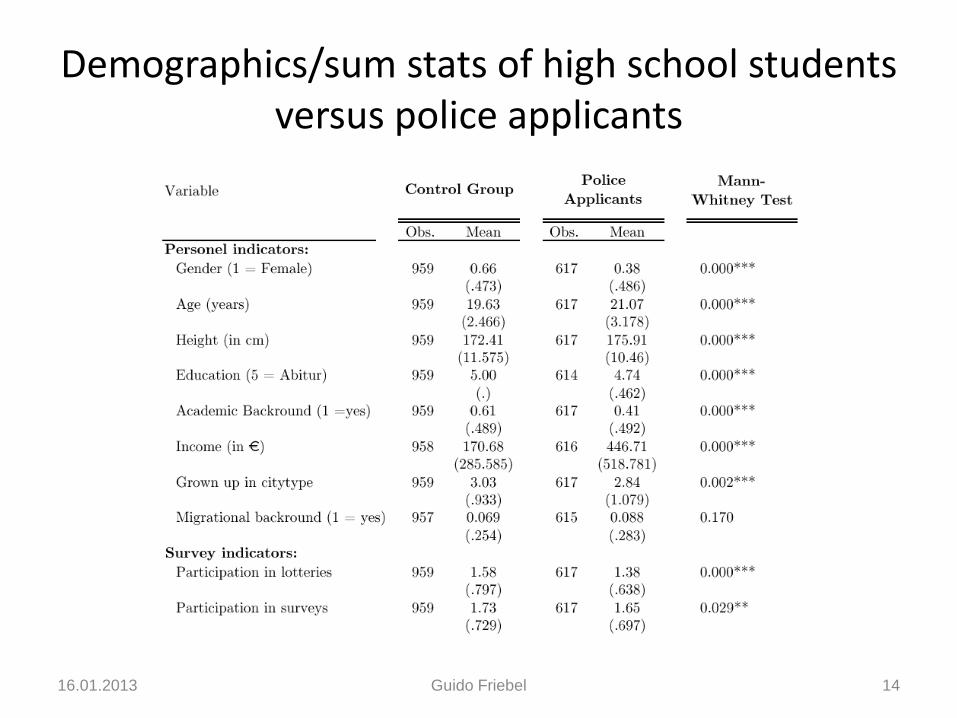
Demographics/sum stats of high school students versus police applicants
16.01.2013 Guido Friebel 14

THE TRUST GAME
16.01.2013 Guido Friebel 15
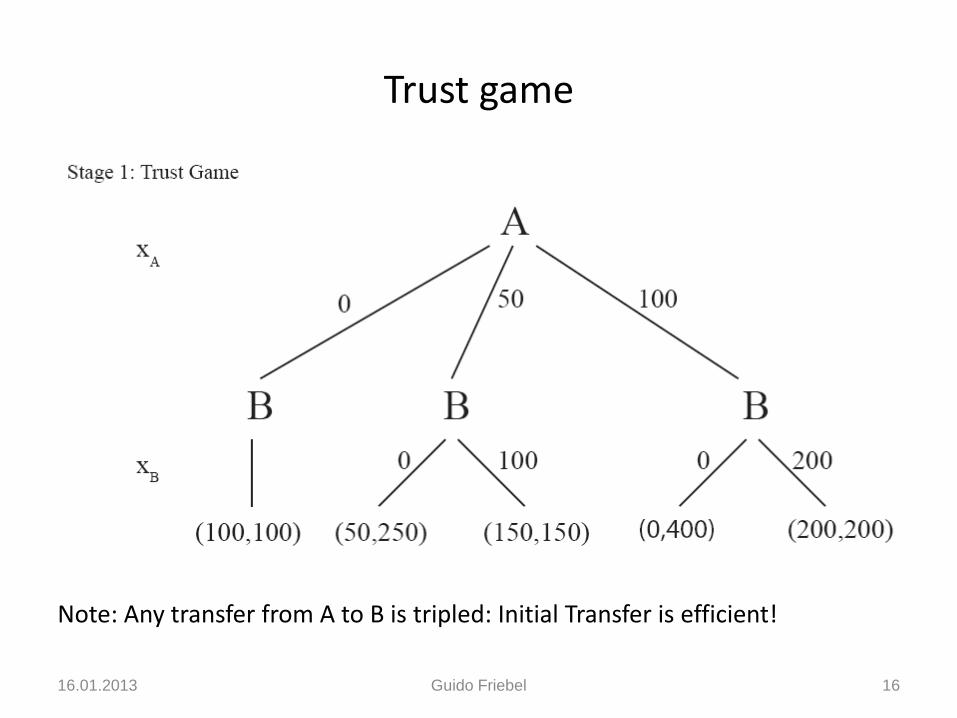
Trust game
16.01.2013 Guido Friebel 16
Note: Any transfer from A to B is tripled: Initial Transfer is efficient!
Students‘ (A player‘s) beliefs about trustworthiness
• A person’s trust increases if the other party has behaved in a kind way earlier, e.g. donating money to an NGO before the trust game starts (Albert et al., 2007; Fehrler, 2010)
• The social status or social role of people in society can work as a signal about a positive type and therefore the other person’s belief about trustworthiness is raised (Yamagishi, 1998)
Do trustors believe police applicants’ trustworthiness to be higher than the control group’s?
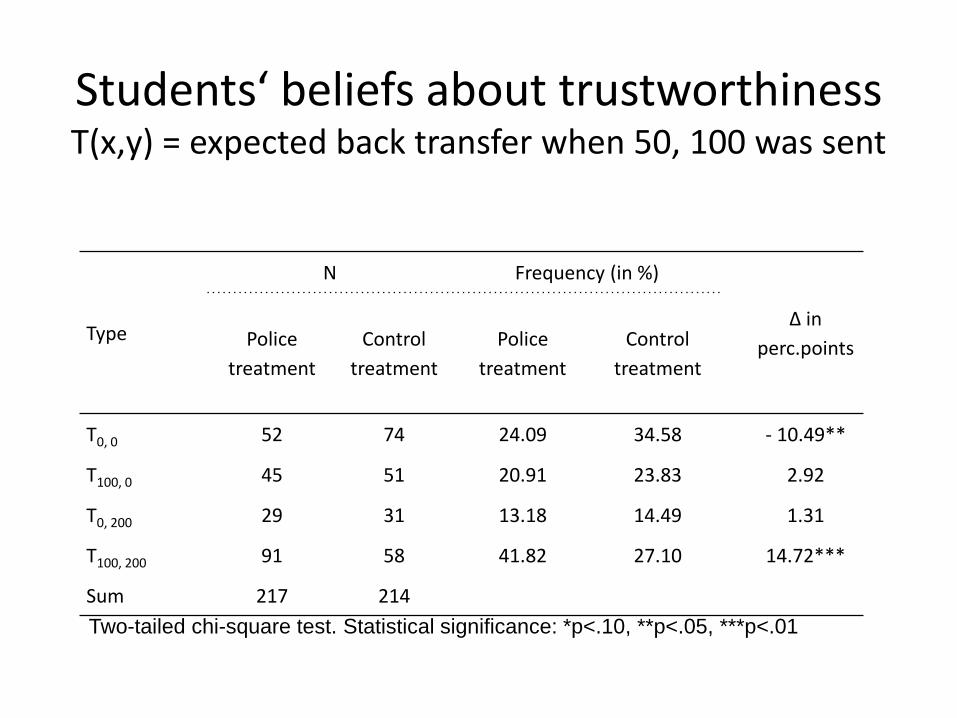
Students‘ beliefs about trustworthiness T(x,y) = expected back transfer when 50, 100 was sent
Type
N Frequency (in %)
Δ in
perc.points Police
treatment
Control
treatment
Police
treatment
Control
treatment
T0, 0 52 74 24.09 34.58 - 10.49**
T100, 0 45 51 20.91 23.83 2.92
T0, 200 29 31 13.18 14.49 1.31
T100, 200 91 58 41.82 27.10 14.72***
Sum 217 214
Two-tailed chi-square test. Statistical significance: *p<.10, **p<.05, ***p<.01
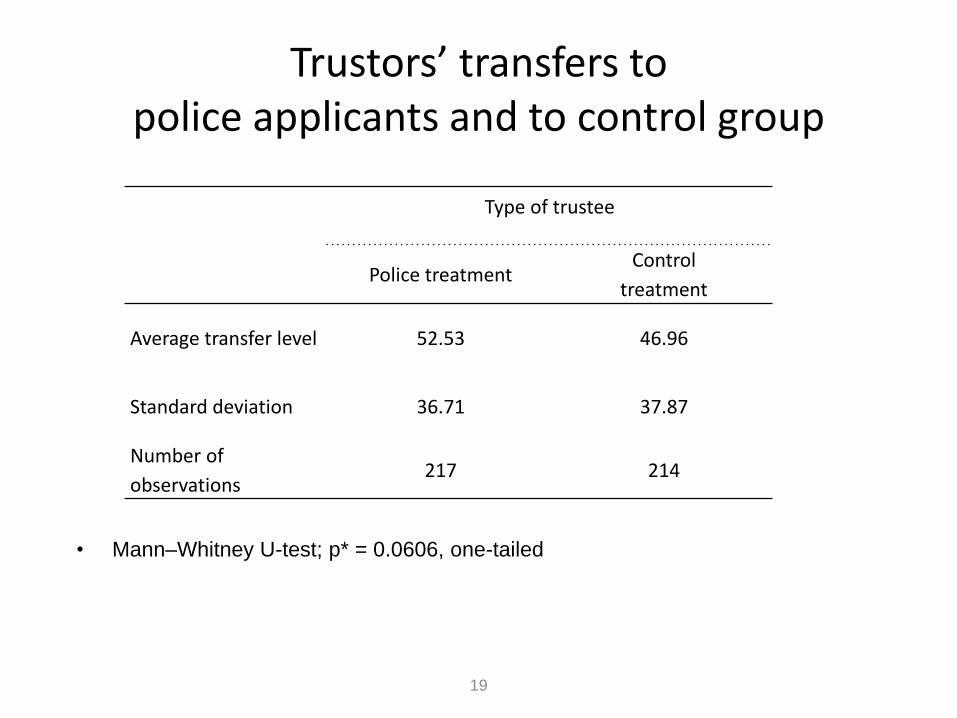
Trustors’ transfers to police applicants and to control group
19
Type of trustee
Police treatment Control
treatment
Average transfer level 52.53 46.96
Standard deviation 36.71 37.87
Number of
observations 217 214
• Mann–Whitney U-test; p* = 0.0606, one-tailed
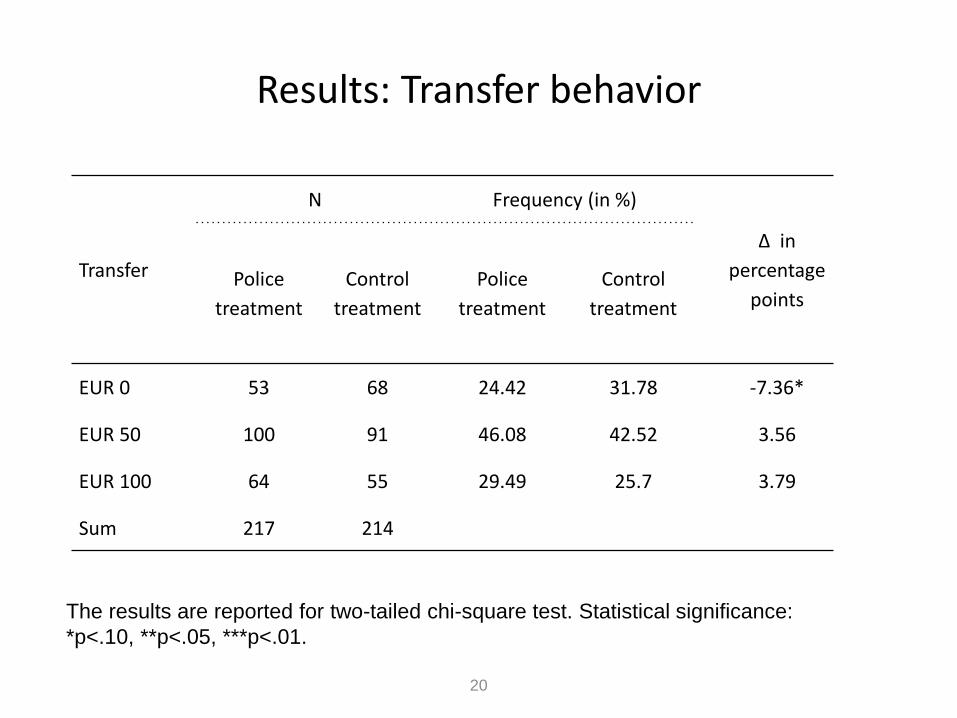
Results: Transfer behavior
Transfer
N Frequency (in %)
Δ in
percentage
points Police
treatment
Control
treatment
Police
treatment
Control
treatment
EUR 0 53 68 24.42 31.78 -7.36*
EUR 50 100 91 46.08 42.52 3.56
EUR 100 64 55 29.49 25.7 3.79
Sum 217 214
20
The results are reported for two-tailed chi-square test. Statistical significance:
*p<.10, **p<.05, ***p<.01.
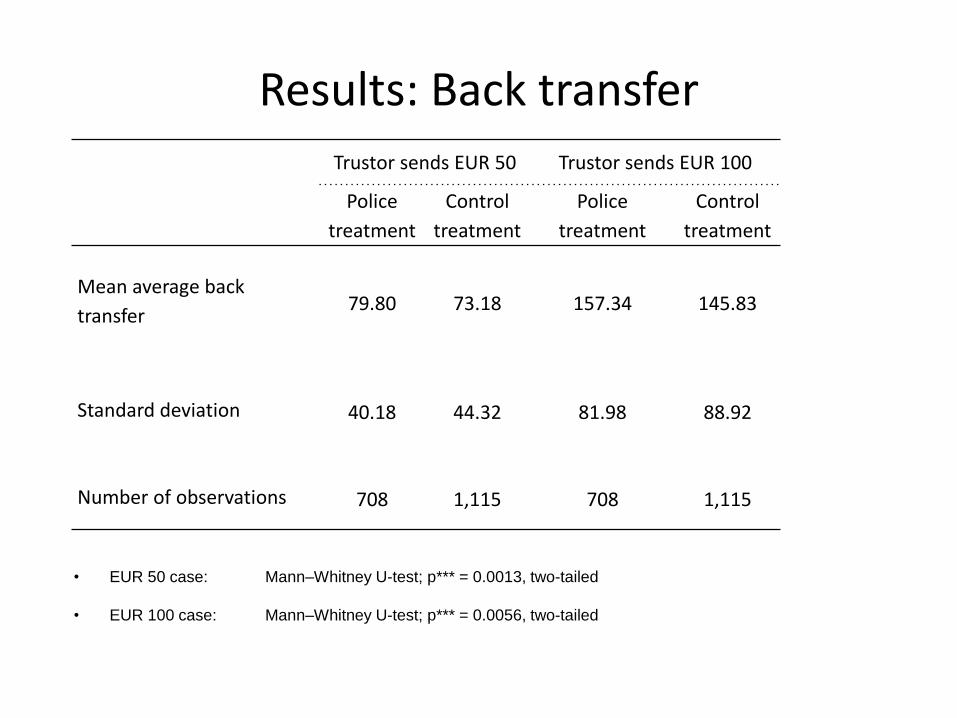
Results: Back transfer
Trustor sends EUR 50 Trustor sends EUR 100
Police
treatment
Control
treatment
Police
treatment
Control
treatment
Mean average back
transfer 79.80 73.18 157.34 145.83
Standard deviation 40.18 44.32 81.98 88.92
Number of observations 708 1,115 708 1,115
• EUR 50 case: Mann–Whitney U-test; p*** = 0.0013, two-tailed
• EUR 100 case: Mann–Whitney U-test; p*** = 0.0056, two-tailed
NORM ENFORCEMENT
22
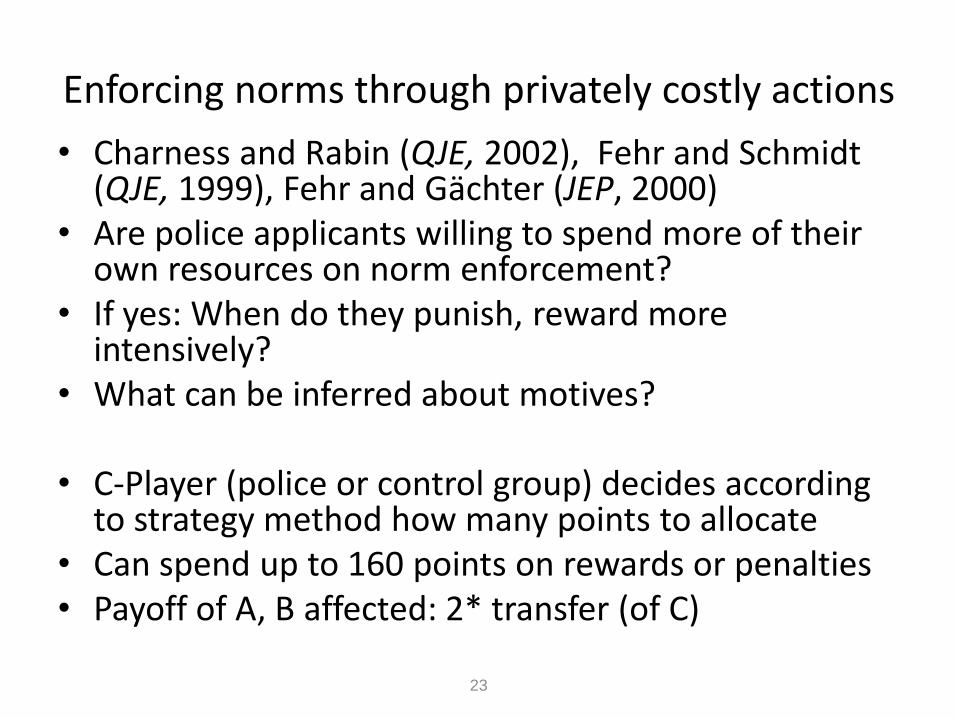
Enforcing norms through privately costly actions
• Charness and Rabin (QJE, 2002), Fehr and Schmidt (QJE, 1999), Fehr and Gächter (JEP, 2000)
• Are police applicants willing to spend more of their own resources on norm enforcement?
• If yes: When do they punish, reward more intensively?
• What can be inferred about motives?
• C-Player (police or control group) decides according to strategy method how many points to allocate
• Can spend up to 160 points on rewards or penalties • Payoff of A, B affected: 2* transfer (of C)
23
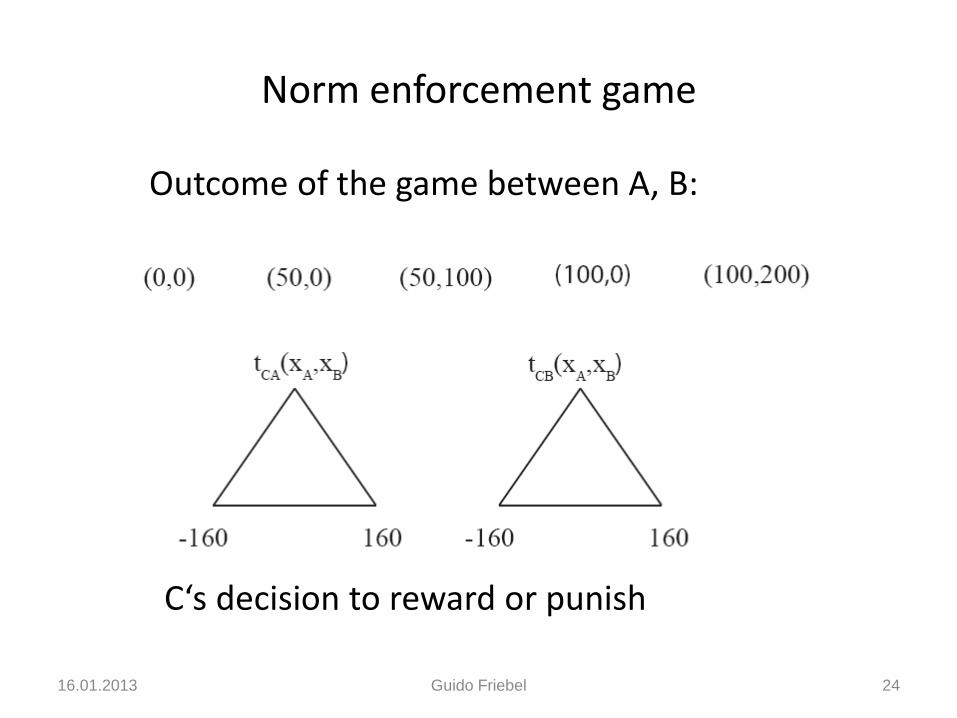
Norm enforcement game
16.01.2013 Guido Friebel 24
Outcome of the game between A, B:
C‘s decision to reward or punish
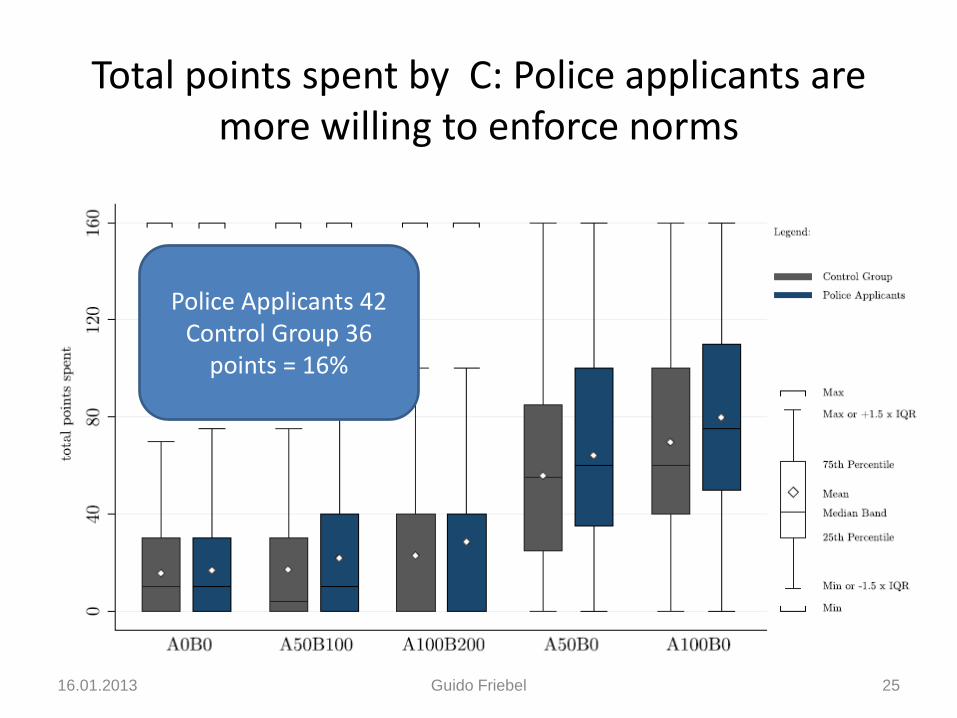
Total points spent by C: Police applicants are more willing to enforce norms
16.01.2013 Guido Friebel 25
Police Applicants 42 Control Group 36
points = 16%
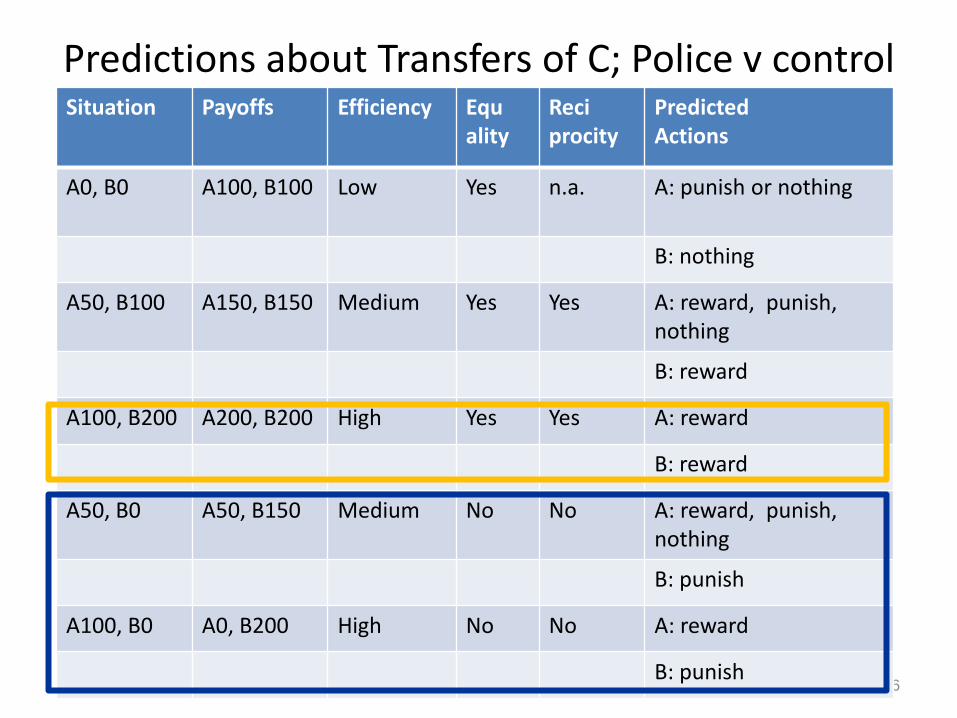
Predictions about Transfers of C; Police v control
16.01.2013 Guido Friebel 26
Situation Payoffs Efficiency Equ ality
Reci procity
Predicted Actions
A0, B0 A100, B100 Low Yes n.a. A: punish or nothing
B: nothing
A50, B100 A150, B150 Medium Yes Yes A: reward, punish, nothing
B: reward
A100, B200 A200, B200 High Yes Yes A: reward
B: reward
A50, B0 A50, B150 Medium No No A: reward, punish, nothing
B: punish
A100, B0 A0, B200 High No No A: reward
B: punish
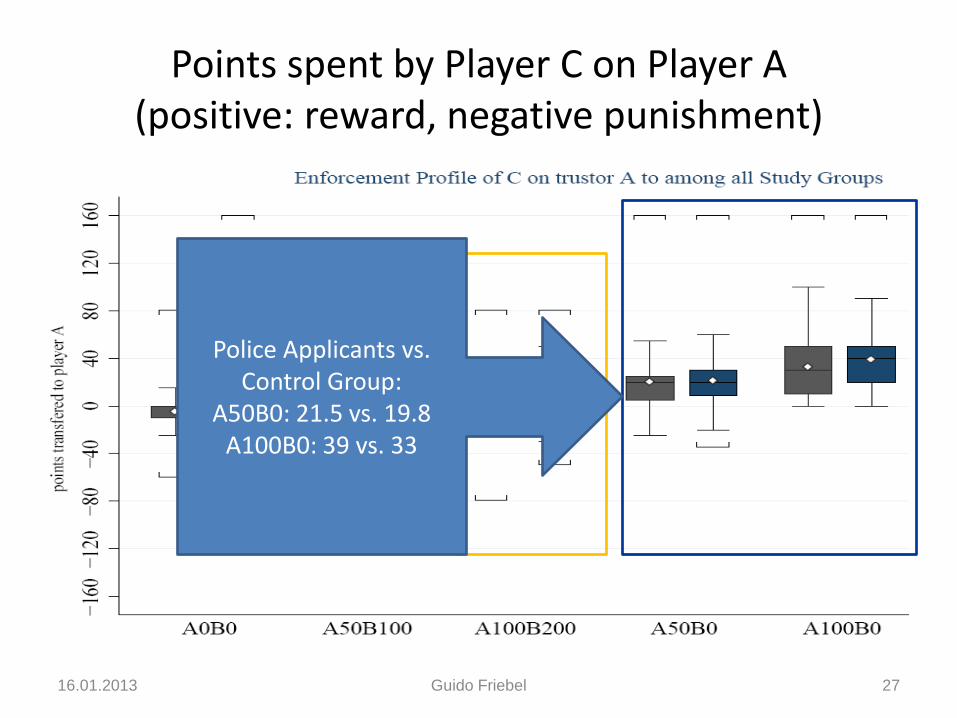
Points spent by Player C on Player A (positive: reward, negative punishment)
16.01.2013 Guido Friebel 27
Police Applicants vs. Control Group:
A50B0: 21.5 vs. 19.8 A100B0: 39 vs. 33
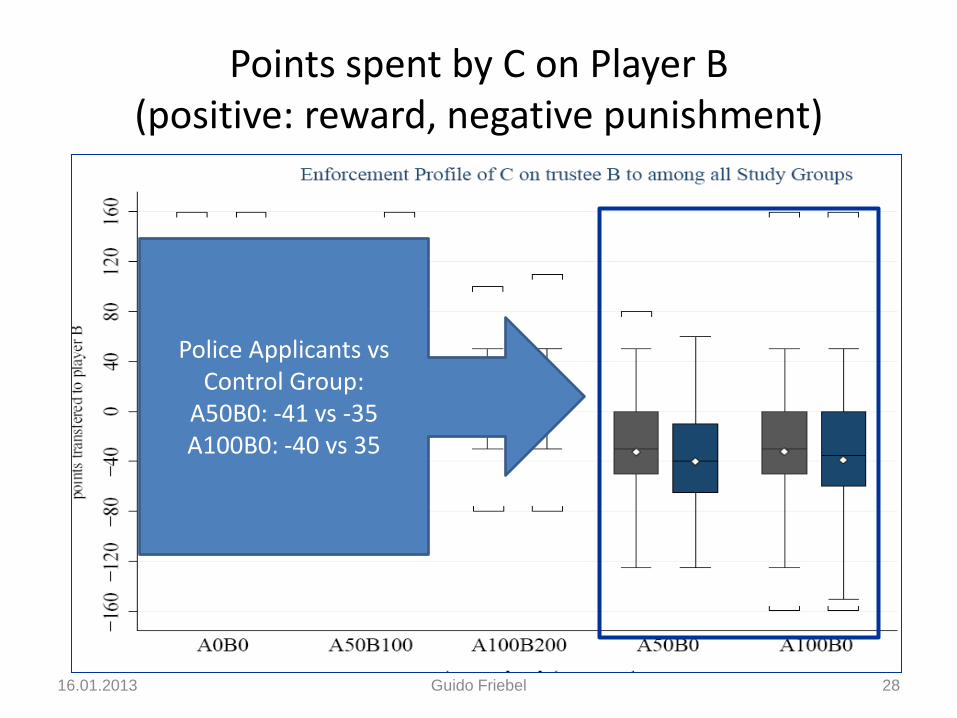
Points spent by C on Player B (positive: reward, negative punishment)
16.01.2013 Guido Friebel 28
Police Applicants vs Control Group:
A50B0: -41 vs -35 A100B0: -40 vs 35
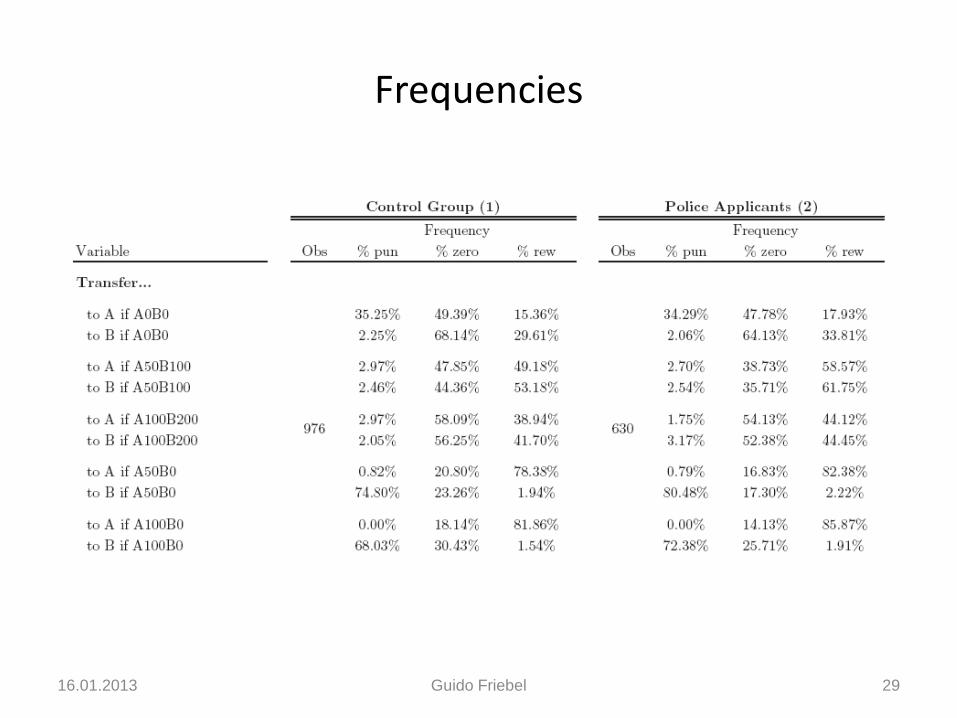
Frequencies
16.01.2013 Guido Friebel 29
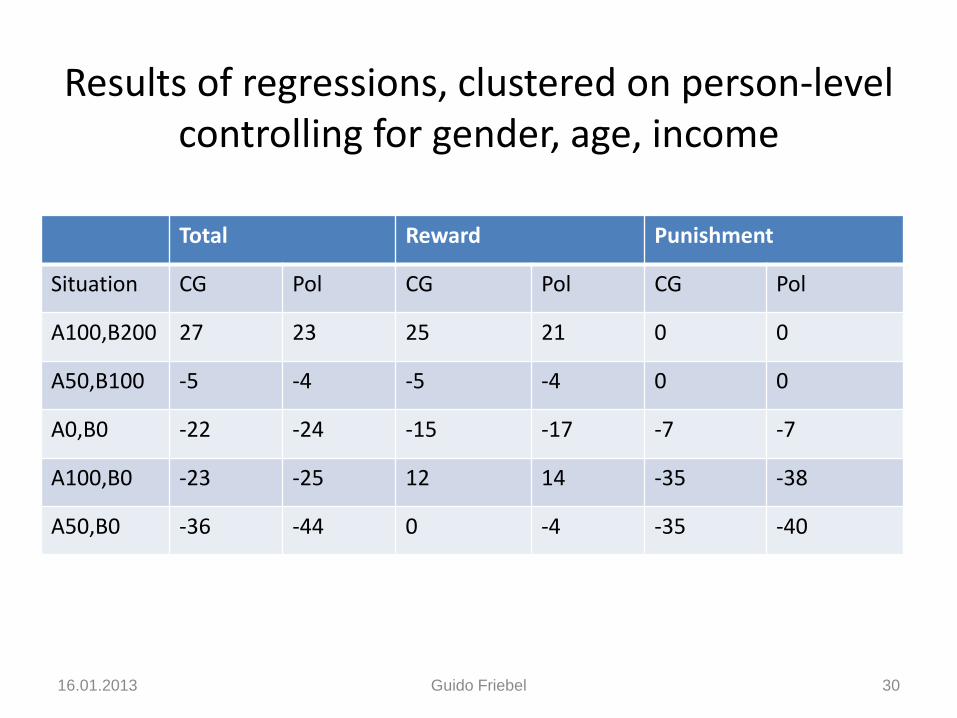
Results of regressions, clustered on person-level controlling for gender, age, income
Total Reward Punishment
Situation CG Pol CG Pol CG Pol
A100,B200 27 23 25 21 0 0
A50,B100 -5 -4 -5 -4 0 0
A0,B0 -22 -24 -15 -17 -7 -7
A100,B0 -23 -25 12 14 -35 -38
A50,B0 -36 -44 0 -4 -35 -40
16.01.2013 Guido Friebel 30
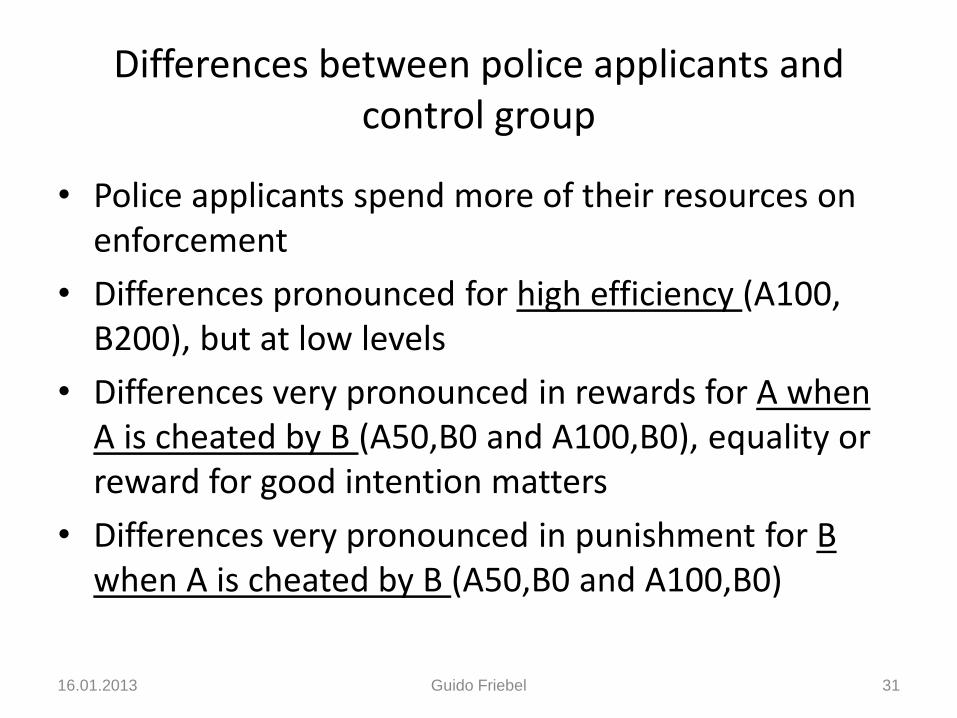
Differences between police applicants and control group
• Police applicants spend more of their resources on enforcement
• Differences pronounced for high efficiency (A100, B200), but at low levels
• Differences very pronounced in rewards for A when A is cheated by B (A50,B0 and A100,B0), equality or reward for good intention matters
• Differences very pronounced in punishment for B when A is cheated by B (A50,B0 and A100,B0)
16.01.2013 Guido Friebel 31
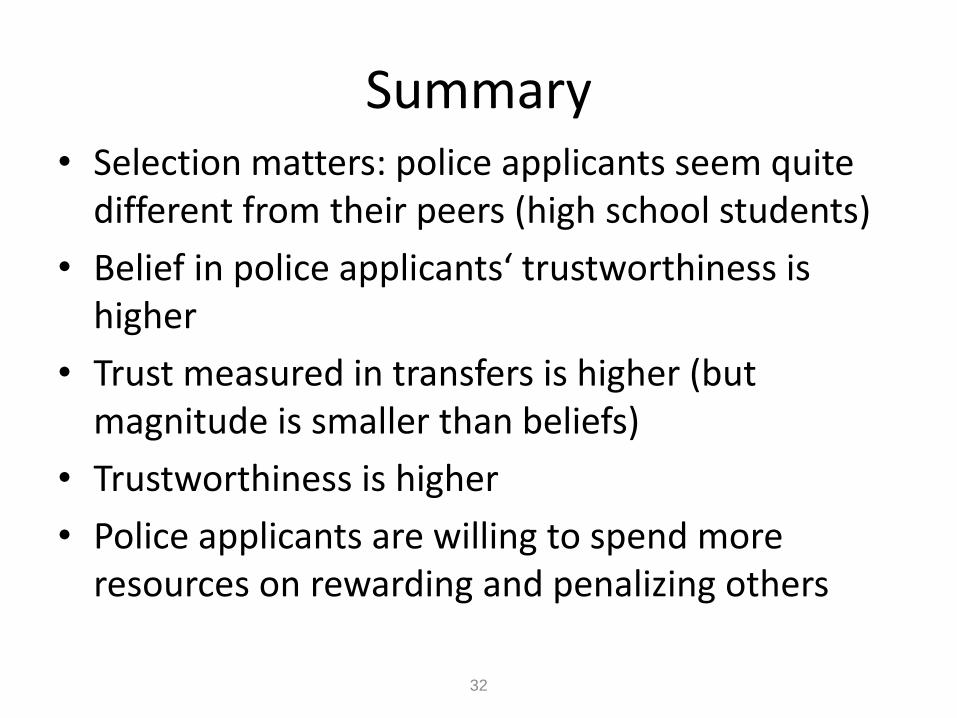
Summary • Selection matters: police applicants seem quite
different from their peers (high school students)
• Belief in police applicants‘ trustworthiness is higher
• Trust measured in transfers is higher (but magnitude is smaller than beliefs)
• Trustworthiness is higher
• Police applicants are willing to spend more resources on rewarding and penalizing others
32

BACKUP
16.01.2013 Guido Friebel 33
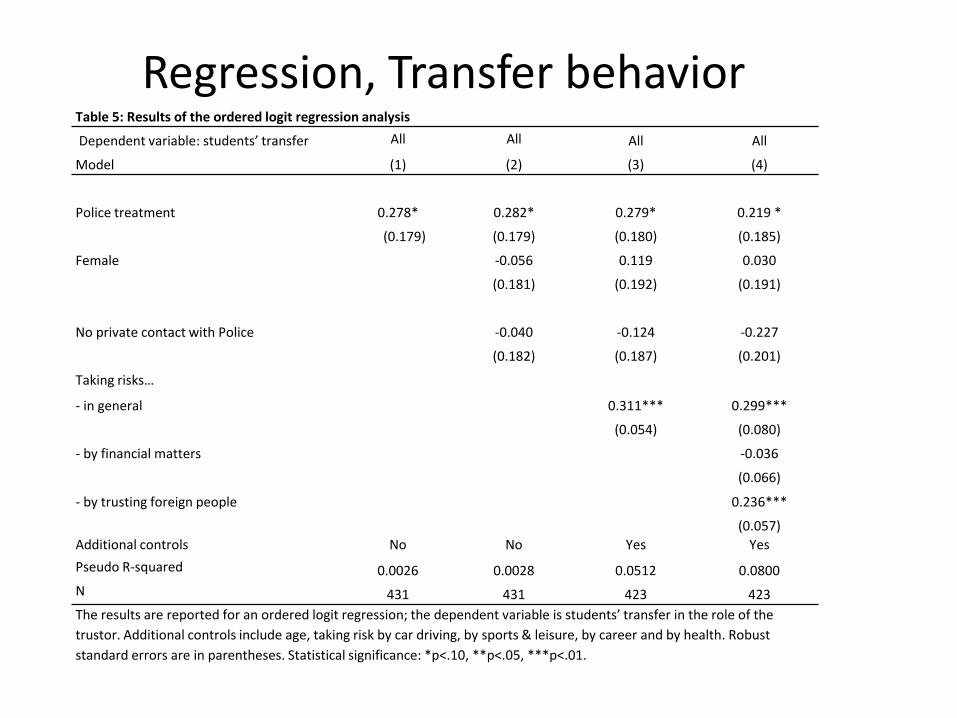
Table 5: Results of the ordered logit regression analysis
Dependent variable: students’ transfer All All All All
Model (1) (2) (3) (4)
Police treatment 0.278* 0.282* 0.279* 0.219 *
(0.179) (0.179) (0.180) (0.185)
Female -0.056 0.119 0.030
(0.181) (0.192) (0.191)
No private contact with Police -0.040 -0.124 -0.227
(0.182) (0.187) (0.201)
Taking risks…
- in general 0.311*** 0.299***
(0.054) (0.080)
- by financial matters -0.036
(0.066)
- by trusting foreign people 0.236***
(0.057)
Additional controls No No Yes Yes
Pseudo R-squared 0.0026 0.0028 0.0512 0.0800
N 431 431 423 423
The results are reported for an ordered logit regression; the dependent variable is students’ transfer in the role of the
trustor. Additional controls include age, taking risk by car driving, by sports & leisure, by career and by health. Robust
standard errors are in parentheses. Statistical significance: *p<.10, **p<.05, ***p<.01.
Regression, Transfer behavior
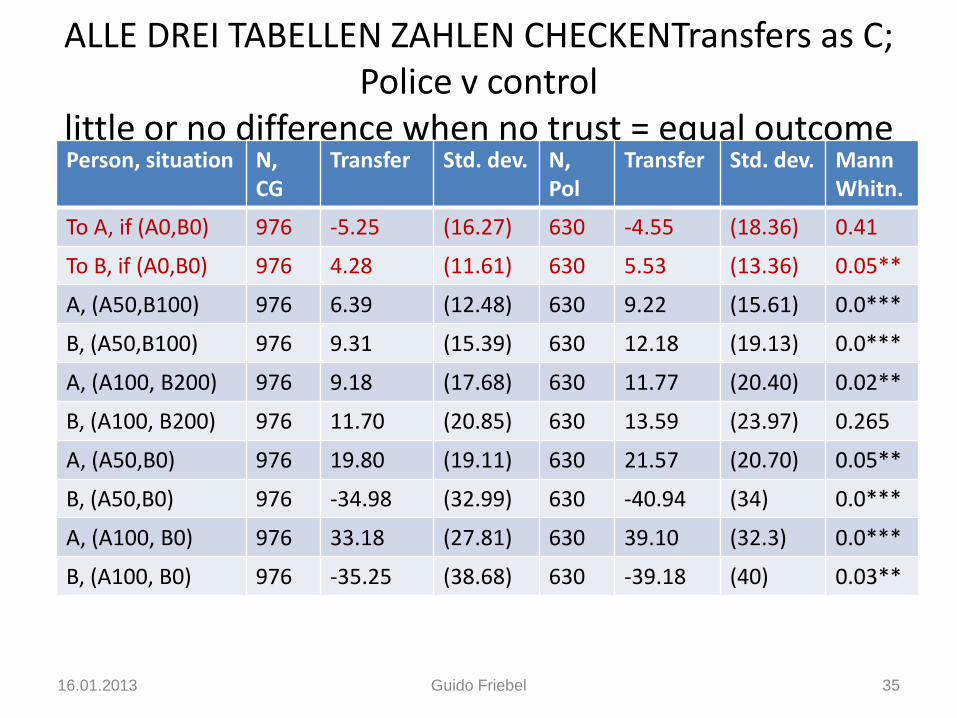
ALLE DREI TABELLEN ZAHLEN CHECKENTransfers as C; Police v control
little or no difference when no trust = equal outcome
16.01.2013 Guido Friebel 35
Person, situation N, CG
Transfer Std. dev. N, Pol
Transfer
Std. dev.
Mann Whitn.
To A, if (A0,B0) 976 -5.25 (16.27) 630 -4.55 (18.36) 0.41
To B, if (A0,B0) 976 4.28 (11.61) 630 5.53 (13.36) 0.05**
A, (A50,B100) 976 6.39 (12.48) 630 9.22 (15.61) 0.0***
B, (A50,B100) 976 9.31 (15.39) 630 12.18 (19.13) 0.0***
A, (A100, B200) 976 9.18 (17.68) 630 11.77 (20.40) 0.02**
B, (A100, B200) 976 11.70 (20.85) 630 13.59 (23.97) 0.265
A, (A50,B0) 976 19.80 (19.11) 630 21.57 (20.70) 0.05**
B, (A50,B0) 976 -34.98 (32.99) 630 -40.94 (34) 0.0***
A, (A100, B0) 976 33.18 (27.81) 630 39.10 (32.3) 0.0***
B, (A100, B0) 976 -35.25 (38.68) 630 -39.18 (40) 0.03**
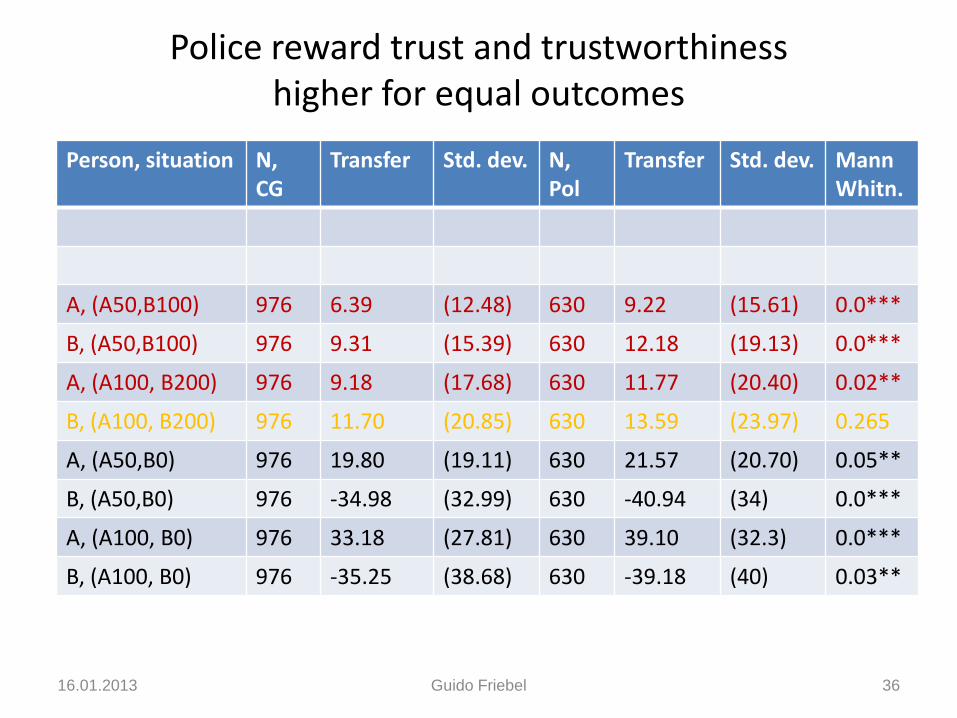
Police reward trust and trustworthiness higher for equal outcomes
16.01.2013 Guido Friebel 36
Person, situation N, CG
Transfer Std. dev. N, Pol
Transfer
Std. dev.
Mann Whitn.
A, (A50,B100) 976 6.39 (12.48) 630 9.22 (15.61) 0.0***
B, (A50,B100) 976 9.31 (15.39) 630 12.18 (19.13) 0.0***
A, (A100, B200) 976 9.18 (17.68) 630 11.77 (20.40) 0.02**
B, (A100, B200) 976 11.70 (20.85) 630 13.59 (23.97) 0.265
A, (A50,B0) 976 19.80 (19.11) 630 21.57 (20.70) 0.05**
B, (A50,B0) 976 -34.98 (32.99) 630 -40.94 (34) 0.0***
A, (A100, B0) 976 33.18 (27.81) 630 39.10 (32.3) 0.0***
B, (A100, B0) 976 -35.25 (38.68) 630 -39.18 (40) 0.03**
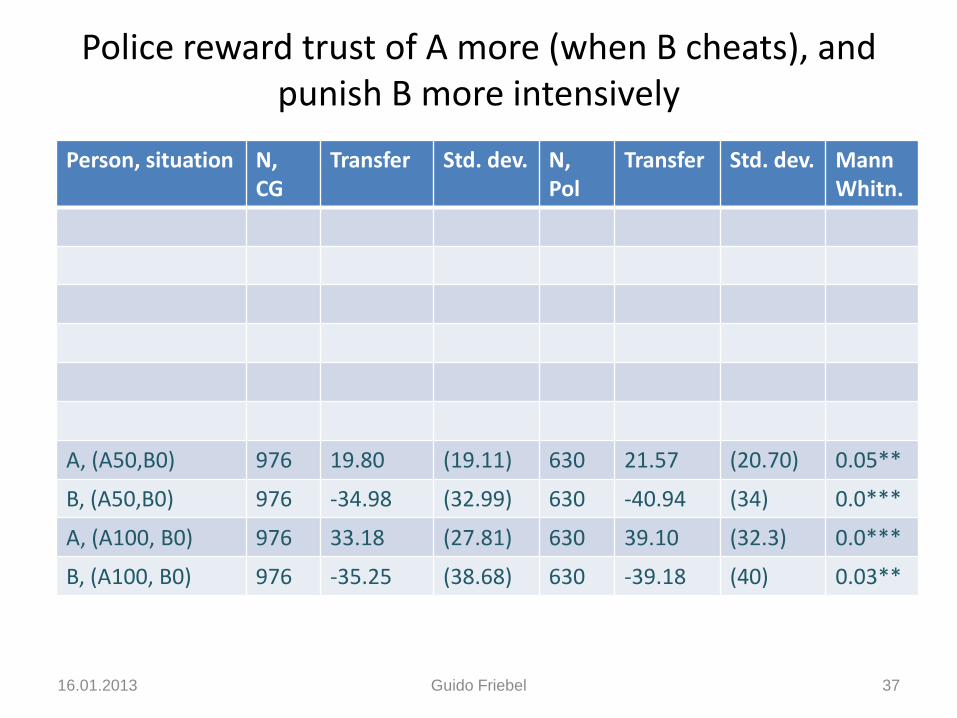
Police reward trust of A more (when B cheats), and punish B more intensively
16.01.2013 Guido Friebel 37
Person, situation N, CG
Transfer Std. dev. N, Pol
Transfer
Std. dev.
Mann Whitn.
A, (A50,B0) 976 19.80 (19.11) 630 21.57 (20.70) 0.05**
B, (A50,B0) 976 -34.98 (32.99) 630 -40.94 (34) 0.0***
A, (A100, B0) 976 33.18 (27.81) 630 39.10 (32.3) 0.0***
B, (A100, B0) 976 -35.25 (38.68) 630 -39.18 (40) 0.03**
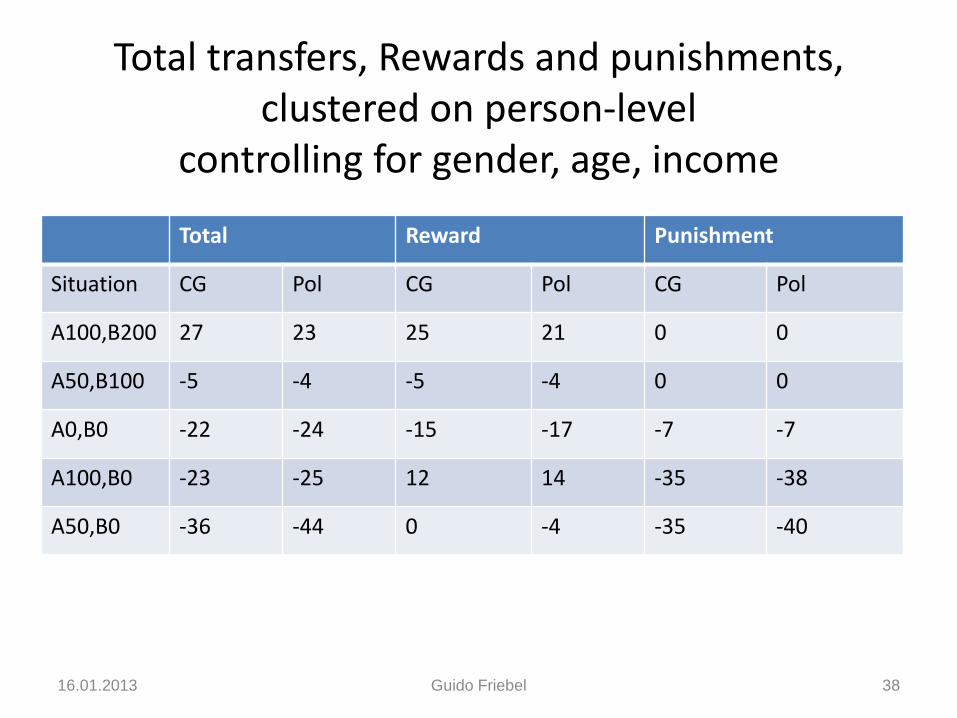
Total transfers, Rewards and punishments, clustered on person-level
controlling for gender, age, income
Total Reward Punishment
Situation CG Pol CG Pol CG Pol
A100,B200 27 23 25 21 0 0
A50,B100 -5 -4 -5 -4 0 0
A0,B0 -22 -24 -15 -17 -7 -7
A100,B0 -23 -25 12 14 -35 -38
A50,B0 -36 -44 0 -4 -35 -40
16.01.2013 Guido Friebel 38
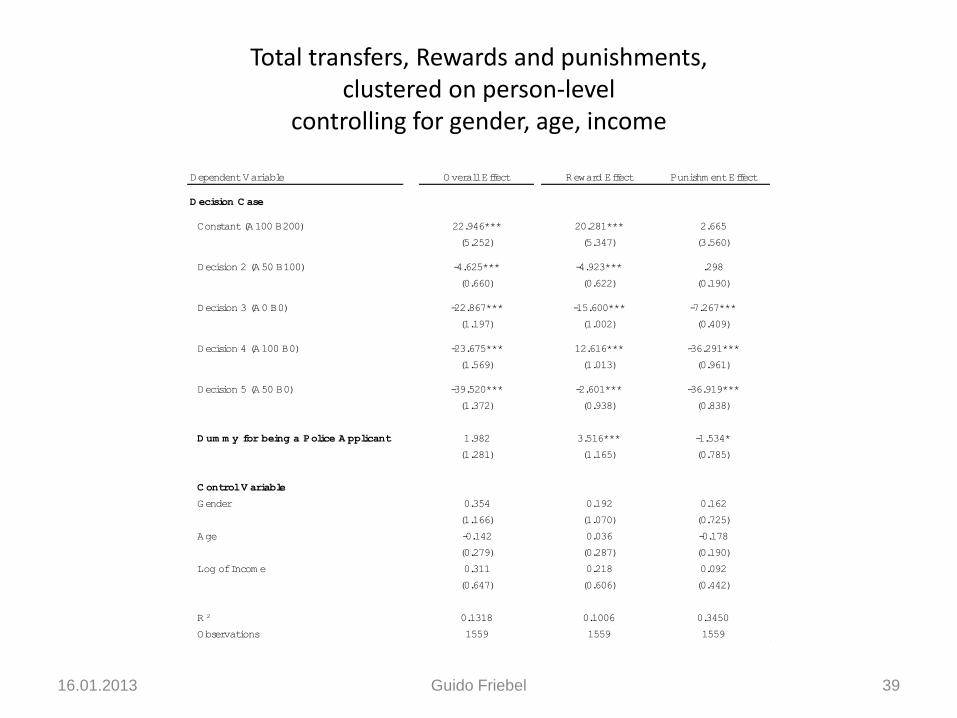
Total transfers, Rewards and punishments, clustered on person-level
controlling for gender, age, income
16.01.2013 Guido Friebel 39
Dependent Variable Overall Effect Reward Effect Punishm ent Effect
D ecision C ase
Constant (A100 B200) 22.946*** 20.281*** 2.665
(5.252) (5.347) (3.560)
Decision 2 (A50 B100) -4.625*** -4.923*** .298
(0.660) (0.622) (0.190)
Decision 3 (A0 B0) -22.867*** -15.600*** -7.267***
(1.197) (1.002) (0.409)
Decision 4 (A100 B0) -23.675*** 12.616*** -36.291***
(1.569) (1.013) (0.961)
Decision 5 (A50 B0) -39.520*** -2.601*** -36.919***
(1.372) (0.938) (0.838)
D um m y for being a Police A pplicant 1.982 3.516*** -1.534*
(1.281) (1.165) (0.785)
C ontrol V ariable
Gender 0.354 0.192 0.162
(1.166) (1.070) (0.725)
Age -0.142 0.036 -0.178
(0.279) (0.287) (0.190)
Log of Incom e 0.311 0.218 0.092
(0.647) (0.606) (0.442)
R² 0.1318 0.1006 0.3450
Observations 1559 1559 1559
Recommended