Clemson UniversityTigerPrints
All Theses Theses
12-2016
Soil Organic Carbon Distribution with Depth:Implications for Ecosystem ServicesRebecca Drayton ChandlerClemson University
Follow this and additional works at: https://tigerprints.clemson.edu/all_theses
This Thesis is brought to you for free and open access by the Theses at TigerPrints. It has been accepted for inclusion in All Theses by an authorizedadministrator of TigerPrints. For more information, please contact [email protected].
Recommended CitationChandler, Rebecca Drayton, "Soil Organic Carbon Distribution with Depth: Implications for Ecosystem Services" (2016). All Theses.2542.https://tigerprints.clemson.edu/all_theses/2542

SOIL ORGANIC CARBON DISTRIBUTION WITH DEPTH: IMPLICATIONS
FOR ECOSYSTEM SERVICES
A Thesis
Presented to
the Graduate School of
Clemson University
In Partial Fulfillment
of the Requirements for the Degree
Master of Science
Forest Resources
by
Rebecca Drayton Chandler
December 2016
Accepted by:
Elena Mikhailova, Ph.D., Committee Chair
Christopher Post, Ph.D.
Mark Schlautman, Ph.D.
Stephen Moysey, Ph.D.

ii
ABSTRACT
Most current frameworks of ecosystem services represent soil organic carbon
(SOC) as a bulk/composited stock without differentiating SOC ecosystem services in the
top and subsoil. This study evaluated SOC, nitrogen (N), and C/N distribution with depth
in glaciated soils at the Cornell University Willsboro Research Farm in upstate New
York. Soil organic carbon, N, and C/N decreased with depth in all soils sampled. The
vertical distribution of SOC was examined quantitatively by soil order, soil depth class
(top soil versus subsoil), and other environmentally-relevant soil and landscape variables.
Top soils (A horizon) contained more variable SOC concentrations compared with the
lower depth horizons (subsoils). Soil depth class was statistically significant in explaining
vertical distributions of SOC in all three soil orders present on the farm. Nitrogen
concentrations in the soils tracked well with SOC, decreasing sharply with depth from the
soil surface to about 40 cm and then declining slowly thereafter to stable low values with
additional depth. Despite the soils being highly heterogeneous due to past glaciation,
making coarse fraction corrections to the measured SOC concentrations did not result in a
statistically significant change in our results. Existing frameworks of ecosystem services
for SOC were integrated with an organizational hierarchy of soil systems. Ecosystem
services provided by SOC are depth-dependent because of the types of SOC within the
soil: top soil having more active or labile SOC and subsoil having less active, more non-
labile SOC which is relatively bio-geochemically stable (e.g. humus). Proposed
integration of existing ecosystem services framework with organizational hierarchy of

iii
soil systems provides a missing link to scale, time, degree of computation and
complexity.

iv
DEDICATION
This thesis is dedicated to my parents Martha and Ed Fitchett for their love, and
support throughout my life.
v
ACKNOWLEDGMENTS
I would like to thank my advisors for their guidance, and support during my
graduate studies. Technical Contribution No. 6404 of the Clemson University Experiment
Station. This material is based upon work supported by NIFA/USDA, under projects: SC-
1700452, and SC-1700462.

vi
TABLE OF CONTENTS
Page
TITLE PAGE .................................................................................................................... i
ABSTRACT ..................................................................................................................... ii
DEDICATION ................................................................................................................ iv
ACKNOWLEDGMENTS ............................................................................................... v
LIST OF FIGURES ....................................................................................................... vii
LIST OF TABLES ........................................................................................................ viii
CHAPTER
I. INTRODUCTION ......................................................................................... 9
II. SOIL ORGANIC CARBON DISTRIBUTION WITH DEPTH:
IMPLICATIONS FOR ECOSYSTEM SERVICES .................................... 14
Introduction ............................................................................................ 14
Materials and Methods ........................................................................... 17
Results and Discussion .......................................................................... 20
Conclusions ............................................................................................ 24
APPENDICES ............................................................................................................... 26
A: Figures.......................................................................................................... 27
B: Tables ........................................................................................................... 32
REFERENCES .............................................................................................................. 43
vii
LIST OF FIGURES
Figure Page
1 Map of Willsboro Farm, NY with the following soil types: Howard
gravelly loam, 2 to 8 percent slopes (HgB); Bombay gravelly loam,
to 8 percent slopes (BoB); Kingsbury silty clay loam, 0 to 3 percent
slopes (KyA); Kingsbury silty clay loam, 3 to 8 percent slopes (KyB);
Covington clay, 0 to 3 percent slopes (CvA); Churchville loam, 2 to 8
percent slopes (CpB); Cosad loamy fine sand, 0 to 3 percent slopes
(CuA); Claverack loamy fine sand, 3 to 8 percent slopes (CqB);
Deerfield loamy sand, 0 to 3 percent slopes (DeA); Stafford fine
sandy loam, 0 to 3 percent slopes (StA); Amenia fine sandy loam,
2 to 8 percent slopes (AmB); Massena gravelly silt loam,
3 to 8 percent slopes (McB); Nellis fine sandy loam, 3 to 8 percent
slopes (NeB); Nellis fine sandy loam, 8 to 15 percent slopes (NeC)
(Mikhailova et al., 2016) ………………………………………………….27
2 Soil organic carbon (SOC) distribution with depth in Entisols, Inceptisols, and
Alfisols at polypedon level: a) not corrected for coarse fraction (CF);
b) corrected for CF.. ..................................................................................... 28
3 Total nitrogen (%) concentration with depth and carbon-to-nitrogen
(C/N) ratios with depth by soil order Alfisols (a, b), Entisols (c, d), and
Inceptisols (e, f). .......................................................................................... 29
4 Soil organic carbon (SOC) distribution by soil order in top soil (A horizon),
and subsoil (weighted average).. .................................................................. 30
5 Carbon-to-nitrogen ratios distribution by soil order in a) top soil (A horizon)
and b) subsoil (weighted). ............................................................................ 31

viii
LIST OF TABLES
Table Page
1 Classification of Willsboro soil organic carbon study with depth as it is
relates to ecosystem services, scale hierarchy and knowledge type diagram
(Dijkerman, 1974; Hoosbeek and Bryant, 1992; Adhikari and Hartemink,
2016). ........................................................................................................... 32
2 Average A horizon values for thickness, percent soil organic carbon (SOC),
soil texture, and percent coarse fraction by soil type and soil order from
detailed field study (original core data from Mikhailova et al., 1996). ....... 33
3 Average subsoil (below A horizon) values for thickness, percent soil organic
carbon (SOC), soil texture, and percent coarse fraction by soil type and soil
order from detailed field study (original core data from Mikhailova et al.,
1996). ........................................................................................................... 37
4 Pearson correlation (r) of SOC (%) with SOC (%) corrected for CF (%) across
the total site depth, the upper depth class, the lower depth class, and by soil
order (p-values in parentheses). ................................................................... 41
5 ANOVA results for final mixed linear nested model. ................................. 42
9
CHAPTER ONE
INTRODUCTION
Soil organic carbon (SOC) plays a major role in the global carbon cycle. Soil
organic carbon accounts for an estimated 1500 gigatonnes of carbon stores worldwide
(Trumbore, 1997). The carbon stocks are supplied by decomposition of organic materials
and it is influenced by plants, gas exchanges, agriculture, and fossil fuel consumption
(Brady and Weil, 2002). Accurate modelling of soil organic carbon distribution is useful
for soil carbon accounting purposes in terms of carbon sequestration because of the large
amount of carbon stored within soils.
Soil organic carbon is a portion of soil organic matter (SOM) (Brady and Weil,
2002). Soil organic matter is composed of: <10% fresh organic residue which is mostly
leaf litter or mulch in an agricultural setting; <5% living organisms within the soil; 33-
50% humus which is plant material that has transformed from one organic compound to
another and is considered stabilized organic matter; and 33-50% decomposing organic
matter (active fraction of SOM) (Brady and Weil, 2002). The majority of soil organic
matter is plant derived. Soil organic carbon is critical for soil function and soil quality
and it provides aggregation and stability for better soil structure (Brady and Weil, 2002).
Soil organic carbon may be broken down into three distinct fractions: active,
intermediate, or passive (Xu et. al., 2016; Trumbore 1997). The active and intermediate
fractions are located in the upper 1 meter of soil and are often grouped together as non-
passive or labile SOC (Trumbore, 1997). The SOC found in this fraction is biologically
available and more susceptible to changes at the surface (Cheng et al., 2015). The size of
the non-passive fraction has been debated (Xu et al., 2016), but Trumbore (1997)
10
considers it as the smallest pool of SOC, containing an estimated 250-350 gigatonnes of
soil carbon. This fraction originates from new organic residues and living organisms and
turnover generally occurs from less than one year up to a few decades (Trumbore, 1997).
The passive fraction of SOC is often found below 1 meter and it is considered
chemically stable humus that is very resistant to decomposition from microorganisms
(Trumbore, 1997). According to Rumpel and Kogel-Knabner (2011), a high radiocarbon
age of SOC found in subsoils contributes to the stability and longevity of deep SOC. It
can take anywhere from 100 years to more than 2500 years for turnover to occur
(Trumbore, 1997; Xu et. al., 2016). The subsoil contains the largest pool of SOC and is
the least likely to be influenced by changes in management practice and often may be
subjected to different environmental conditions than top soil (Rumpel and Kogel-
Knabner, 2011).
Carbon-to-nitrogen (C/N) ratio is often used as a determinant for the health of a
soil (Xu et. al., 2016). Soil microorganisms (fungi, bacteria, protozoa, nematodes, etc.)
are directly affected by C/N ratio. Nitrogen is essential for microbial growth, therefore a
higher C/N ratio results in lower decomposition activities by soil microorganisms (Brady
and Weil, 2002; Xu et. al., 2016). Soil microorganisms require a constant supply of fresh
SOM and many will enter a starvation mode, a dormant state, in soils that do not provide
adequate food and fuel (Alexander, 1991). This is particularly true with soil depth as
subsoils do not have active supplies of SOM and shallow roots systems often fail to
penetrate into the subsoil (Brady and Weil, 2002). In addition, the bulk of soil fungi and
bacteria are found to be concentrated in the upper 10 cm of soil as there is a high
availability of SOM and oxygen (Brady and Weil, 2002).

11
The concept of ecosystem services groups together the positive effects gained by
humans and human well-being either directly or indirectly from the natural world
(García-Nieto et al., 2013; Schägner et al., 2013). Most often this concept is used as a
tool to put monetary value to natural capital (Baveye et al., 2016), and plays an
increasingly major role in decision making and forming policy by government agencies
(Schägner et al., 2013). Even though research on the characteristics and functions of soil
has been conducted for decades, only recently has soil been linked to ecosystem services
(Adhikari and Hartemink, 2016). Considering ecosystem services provided by soils began
in the mid-1990’s, with the concept gaining momentum in literature after 2005 (Baveye
et al., 2016). The use of ecosystem services in publications and proposals is increasingly
important as the concept allows for a link to real-world relevance for ecological concerns
(Baveye et al., 2016).
A study completed by Paudyal et al. (2015) sought to distinguish which methods
may be used to identify ecosystem services of a forest in a rural region of Nepal. They
identified methods such as expert opinion or professional judgment, biophysical and
environmental models, user perception, social and community value, visual
knowledge/repeat photography, participatory approaches, and use of GIS and remote
sensing. Paudyal et al. (2015) determined that interviews with local communities may be
the best tool for determining and prioritizing the ecosystem services of that particular
region. In a separate study seeking to map ecosystem services, García-Nieto et al. (2013)
used a combination of interviews with local stakeholders and existing GIS databases and
tools to identify and map ecosystem services in south-east Spain. Crespin and Simonetti
(2016) used a broader approach to identify ecosystem services in Ecuador. Using a

12
spatially explicit value transfer framework proposed by Troy and Wilson (2006), they
identified ecosystem services digitally and used GIS tools to track changes in land use to
estimate losses of natural capital.
Soil properties, including SOC, are a key part in many ecosystems and therefore
provide their own inherent ecosystem services. Though there is current global debate and
are several different interpretations of ecosystem services categorization exist, it may be
generally viewed that ecosystem services can be broadly classified by four categories;
regulating, cultural, provisional, or supporting services (Adhikari and Hartemink, 2016;
Baveye et al., 2016).
Provisional services are defined by the products gained from an ecosystem which
may include fuel, food, fresh water, wood, or fiber (Adhikari and Hartemink, 2016;
Baveye et al., 2016). In linking soil properties, all soil properties contribute to providing
food, fuel and fiber. Many provide fresh water or water retention, and few soil properties
are responsible for providing raw materials or genetic diversity (Adhikari and Hartemink,
2016). When only considering SOC, Adhikari and Hartemink (2016) listed food, fuel and
fiber, raw materials, and fresh water or water retention as provisioning services provided
by SOC.
Baveye et al. (2016) defines regulating services as the benefits that are gained
from just the regulation of ecological processes. In more specific terms, soil properties
may be involved with water and gas regulation (atmospheric CO2), carbon sequestration,
water purification, climate regulation, flood controls, erosion, and biological processes
(pollination, disease) (Adhikari and Hartemink, 2016). Soil organic carbon plays a

13
particular role in most of the regulating services according to the framework provided by
Adhikari and Hartemink (2016).
Supporting services provide a foundation for all other ecosystem services, and as
Baveye et al. (2016) states, are necessary for the production of the other ecosystem
services. The soil properties identified by Adhikari and Hartemink (2016) related to
supporting services include the formation of soil including the weathering of parent
material, nutrient cycling, and provisioning of habitat.
Finally, the cultural benefits provided by ecosystem services are non-tangibles
benefitting human well-being either esthetically, spiritually, educationally, or
recreationally (Baveye et al., 2016). More specifically, cultural services can benefit
ecotourism and recreation, inspiration and education, creating a “sense of place”, or
providing a place for cultural heritage (Adhikari and Hartemink, 2016). Crespin and
Simonetti (2016) suggested that only with the valuation of ecosystem services do policy-
makers begin to take natural capital of ecosystem services into consideration.

14
CHAPTER TWO
SOIL ORGANIC CARBON DISTRIBUTION WITH DEPTH: IMPLICATIONS FOR
ECOSYSTEM SERVICES
INTRODUCTION
As the largest terrestrial organic carbon pool and the third largest carbon (C)
reservoir worldwide, soil organic carbon (SOC) has an important role in the global C
cycle (Gray et al., 2015; Song et al., 2016; Stockmann et al., 2013; Weissert et al., 2016).
Soil organic carbon stock estimates are important for C sequestration and global change
predictions (Wiesmeier et al., 2012; Jandl et al., 2014; Li et al., 2013). The SOC in soil
promotes soil health, plant growth, and production (Li et al., 2013; Liu et al., 2015).
Therefore, SOC is fundamental to ecosystem services and plays an important part in
provisional services (e.g. food, fuel, fiber), regulating services (e.g. climate and
greenhouse regulation), cultural services (e.g. recreation, ecotourism), and supporting
services (e.g. weathering, soil formation, nutrient cycling) (Stockmann et al., 2013; Gray
et al., 2015; Adhikari and Hartemink, 2016).
Variability of SOC within a landscape complicates making estimates of its
contributions to ecosystem services (Stockman et al., 2013). Quantifying SOC variability
creates challenges for methodologies of soil monitoring, and often requires more
extensive soil sampling to accurately estimate SOC stocks (Jandl et al., 2014; Kumar et
al., 2013; Roudier et al., 2015; Song et al., 2016). Estimates of SOC concentrations can
be enhanced by modelling (Gray et al., 2015; Kumar et al., 2013; Wiesmeier et al., 2012)
to account for the variation that exists in soil properties across landscapes and within soil
profiles (Orton et al., 2016). Spatial variability of SOC within the landscape is well

15
documented, although standardization is needed for calculating SOC concentrations and
SOC variability within a given area (Roudier et al., 2015). Environmental variables such
as elevation, slope and topography can play major roles in the content and spatial
variability of soil properties, including SOC (Kumar et al., 2013; Liu et al., 2013; Obi et
al., 2014). These interrelated variables often complicate attempts to understand and
quantify the distribution of SOC (Wells et al., 2012).
Vertical variability of SOC in relation to ecosystem services is somewhat
overlooked because many studies do not account for different soil horizons or composite
soil horizons together to derive bulk values (Mikhailova et al., 2016). The correlation of
physical properties of soil to SOC with depth is an area of particular interest (Wells et al.,
2012). However, Wiesmeier et al. (2012) stated that the use of estimates rather than
measured data of soil factors such as SOC content, bulk density, and stone content causes
a lack of accuracy of SOC inventories. Some research has concluded that investigating
SOC by soil horizons rather than fixed depth intervals may provide better accuracy as soil
horizons vary in depth across any given location and are subject to different pedogenic
processes (Wiesmeier et al., 2012; Orton et al., 2015). Kempen et al. (2011) used three-
dimensional mapping of soil matter content using soil type-specific depth functions:
constant or exponentially decreasing over depth.
The total depth in which soil properties, including SOC, are measured is largely
debated (Olson and Al-Kaisi, 2014; Wells et al., 2011). A review by Stockmann et al.
(2013) stated that most soil carbon models do not account for factors that would affect
SOC content vertically, and that subsoil (>30 cm) SOC stocks are often not considered in
soil carbon estimates. While there is much published research recommending sampling

16
for SOC within 0-30 cm depth, some have questioned how universally suitable that
recommendation may be (Wells et al., 2011; Wiesmeier et al., 2012). Many studies state
that the majority of SOC is found primarily between 0 to 30 cm because it is the most
biologically active (Wells et al., 2011); however, according to Wiesmeier et al. (2012),
SOC content is greater than 50% in the subsoils of most ecosystems. Trumbore (1997)
stated that of the 1500 gigatonnes of SOC stored in soils, only 250-350 gigatonnes are
found in the active carbon pool, within the top 1 m of soil. This indicates that passive
SOC found in subsoils make up a large portion of the carbon cycle and may play an
important ecological role.
Soils are an important part of many ecosystems, so understanding their role within
the concept of ecosystem services may be beneficial. The framework for ecosystem
services is becoming increasingly important and thus being adopted by many
international and governmental agencies in order to track conservation and sustainable
use of soils (Baveye et al., 2016). Few studies have linked ecosystem services to soil
properties (Adhikari and Hartemink et al., 2016), but no studies have examined SOC
vertical distribution at different scales in relation to ecosystem services. The inherent
differences in active and passive fractions of SOC indicate that soil organic carbon at
different depths will have different functions in terms of ecosystem services. Baveye et
al. (2016) discussed the importance of looking beyond the plow layer (0.25-0.3 m) in
order to determine carbon stocks, and stated that deeper soil horizons are responsible for
a sizable amount of carbon storage. Furthermore, it has been shown through radiocarbon
dating that stability of SOC through time is different in top soils versus subsoils (Rumpel
and Kogel-Knabner, 2011).

17
The aim of this study was to assess the vertical distribution of SOC within the
context of ecosystem services. The specific objectives were to: 1) determine SOC
distribution with depth in the glaciated soils present at the Cornell University Willsboro
Research Farm, NY; 2) evaluate the need for coarse fraction corrections for SOC
concentrations in the glaciated soils; 3) compare SOC concentrations in top soil (A
horizon) versus subsoil (below A horizon), and 4) determine which soil and landscape
parameters statistically explain/predict SOC concentrations with depth.
2. Materials and methods
2.1. Study area
This study was conducted in an area underlain by a lacustrine plain in New York
State, USA. Samples used for the study were collected in Upstate New York, specifically
at the Cornell University Willsboro research farm located in Willsboro, NY (44° 22' N,
73° 26' W) (Fig. 1). Upstate New York features a humid continental climate with an
average annual high temperature is 12.9º C, average annual low temperature of 2.5º C,
and an average annual rainfall of 78.7 cm with summer months seeing more average
rainfall than winter months. The study area was utilized primarily for agriculture with
crop and land cover varying across the farm. The growing season for the region is about
150 days (Mikhailova et al., 1996). Located along Lake Champlain, the property totals
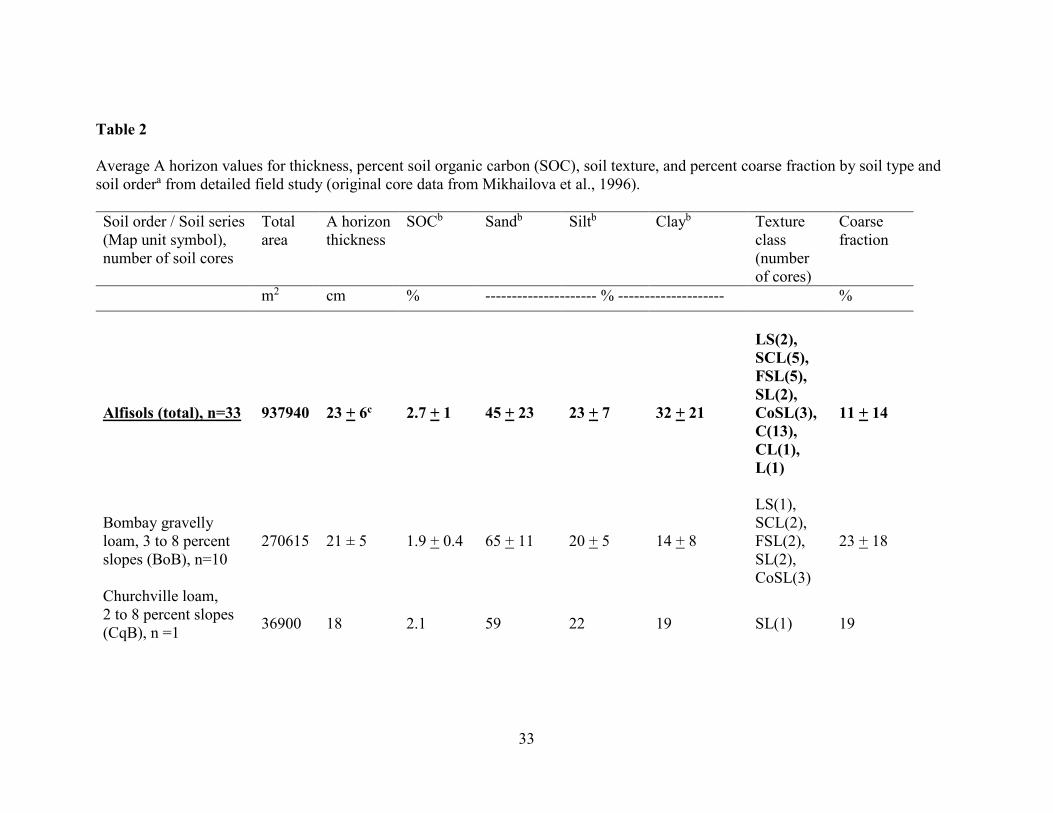
142 hectares in area (Mikhailova et al., 1996). Soil found in the study area (Table 2,
Table 3) developed with glacial deposits and are therefore highly variable. The soils
included at this site are from three distinct soil orders: Entisols, Inceptisols, and Alfisols.

18
2.2. Sampling
Fifty-four deep soil cores were sampled on a square grid (Fig. 1), with each cell
being 137.16 meters by 137.16 meters in the summer of 1995. Coordinates (NAD27 State
Plane Coordinate System’s New York East Zone, using Station ESSEX2 and Poke-A-
Moonshine L.O.T. and Bench Mark H 395) and elevation values for the 78 grid locations
were obtained from a professional land survey team that used an Intelligent Total Station,
Set 2C SOKKISHA (Standard deviation: + 3 mm + 2 ppmD) (Mikhailova et al., 1996).
Undisturbed soil cores of variable depth were extracted using a Giddings hydraulic
sampler (Model – GSR-T-S) and plastic tubes with the average diameter of 4.5 cm
(Mikhailova et al., 1996).
2.3. Laboratory analysis
Plastic tubes with soil samples closed with plastic caps were stored vertically in
the refrigerator (at approximately 1°C) until processing and analysis (Mikhailova et al.,
1996). For each of the soil cores the following information was recorded: upper and
lower boundary of soil horizon, moist and dry soil color (Munsell Color Chart), pH,
reaction to weak HCl (“0” = no reaction, “1” = presence of effervescence), and coarse
fraction (percent of soil sample that was greater than 2 mm fraction. Soil samples were
air-dried, manually ground and passed through a 2-mm-mesh sieve. Particle-size
distribution of the less than 2-mm fraction was determined by the pipette method after
pre-treating for carbonates and soluble salts with 1M NaOAc (adjusted to pH 5), and
organic matter was removed with 30% H2O2 (Gee and Bauder, 1986). Soil pH was
measured in 1:1 soil/water suspension (Mc Lean, 1982). Organic carbon (C) was

19
determined by dry-combustion spectrometry using a Robo-prep-Tracemass system,
Europa Scientific (Cheshire, U.K.). Carbonates were removed from samples that reacted
to weak HCl prior to the analysis.
2.4. Statistical analysis
The amount of SOC reported in each sample was corrected for coarse fraction (CF)
material using the following equation:
SOC, % (CF corrected) = SOC, % * ((100 – CF, %) / 100) (1)
where SOC, % is the laboratory measured percent organic carbon of a given sample, and
CF, % is the percent of coarse fracture reported in laboratory analysis of each sample.
The relationship between SOC and SOC corrected for coarse fracture (CF) were
evaluated by using Pearson’s correlations (p=0.95).
In order to compare top soil and subsoil depth classes, the SOC, % measurements for
samples within the subsoil depth class were composited using weighted averaging with
the following equation:
���, % ���� ���� = ������,%��������,���
� �!" #$%# &" '����,�� (2)
where SOC, % is the laboratory measured percent organic carbon of a given sample
within the subsoil, depth is the lower boundary for each soil horizon, and total subsoil
depth is the sum of the depths of the horizons below A horizon. These calculations were
completed using the assumption that bulk density of soils did not vary within the study
site and would not affect the results.
Carbon-to-nitrogen (C/N) ratios were completed using the mass ratio as opposed
to the atomic ratio. A mixed linear nested model was created using JMP® Software,

20
version 12 (SAS Institute Inc., 2016) to test the significance of soil parameters (depth,
pH, land use) against SOC, % as a dependent variable.
3. Results and discussion
3.1. Integration of framework for ecosystem services with organizational hierarchy of
soil systems
This study proposed to integrate framework for ecosystem services with
organizational hierarchy of soil systems (Table 1) since soil properties have different
ecosystem services depending on scale hierarchy (e.g. pedon, polypedon etc.), time (e.g.
age of the soil etc.), degree of computation (qualitative or quantitative), and degree of
complexity (mechanistic or empirical). In case of study at Willsboro farm, SOC was
investigated at soil horizon (i-1), pedon (i), and polypedon (i+1) levels with variable time
(e.g. soil orders: Entisols, Inceptisols, and Alfisols; variations in SOC pools with depth)
by quantitative methods using both empirical (e.g. distribution of SOC with depth) and
mechanistic (e.g. prediction of SOC based on soil depth class, pH, and land use) degrees
of complexity.
Ecosystem services provided by SOC are depth-dependent because of the types of
SOC within the soil: top soil having more active or labile SOC which experiences higher
turnover and subsoil having more slow or passive SOC which is chemically stable (e.g.
humus). Top soil SOC plays an important role in provisional (e.g. food, feed, fiber etc.),
regulatory (e.g. atmospheric CO2 exchange), and supporting (e.g. soil structure, nutrient
retention) services. Meanwhile, subsoil SOC plays a more dominant role in regulatory
(e.g. carbon sequestration) services, and somewhat less important in provisional and

21
supporting services. Lawrence et al. (2015) proposed a conceptual framework for depth
and time dependent evolution of SOC, where formation, transport and transformation of
secondary weathering products were intertwined with SOC cycling, but not with
ecosystem services. Tiessen et al. (1994) examined the role of soil organic matter in
sustaining soil fertility by comparing agricultural life-spans of soils. They found that
agriculture was economically productive for 65 years in temperate prairie ecosystems and
for 3 years in tropical rainforest ecosystems, suggesting that managing SOC inputs to the
top soil is necessary for prolonging the fertility of a given soil. Understanding the role of
SOC to agricultural output is significant in determining the provisional ecosystem
services that may be provided by soil (Tiessen et al., 1994).
3.2. Soil organic carbon, nitrogen, and C/N distribution with depth in Entisols,
Inceptisols, and Alfisols
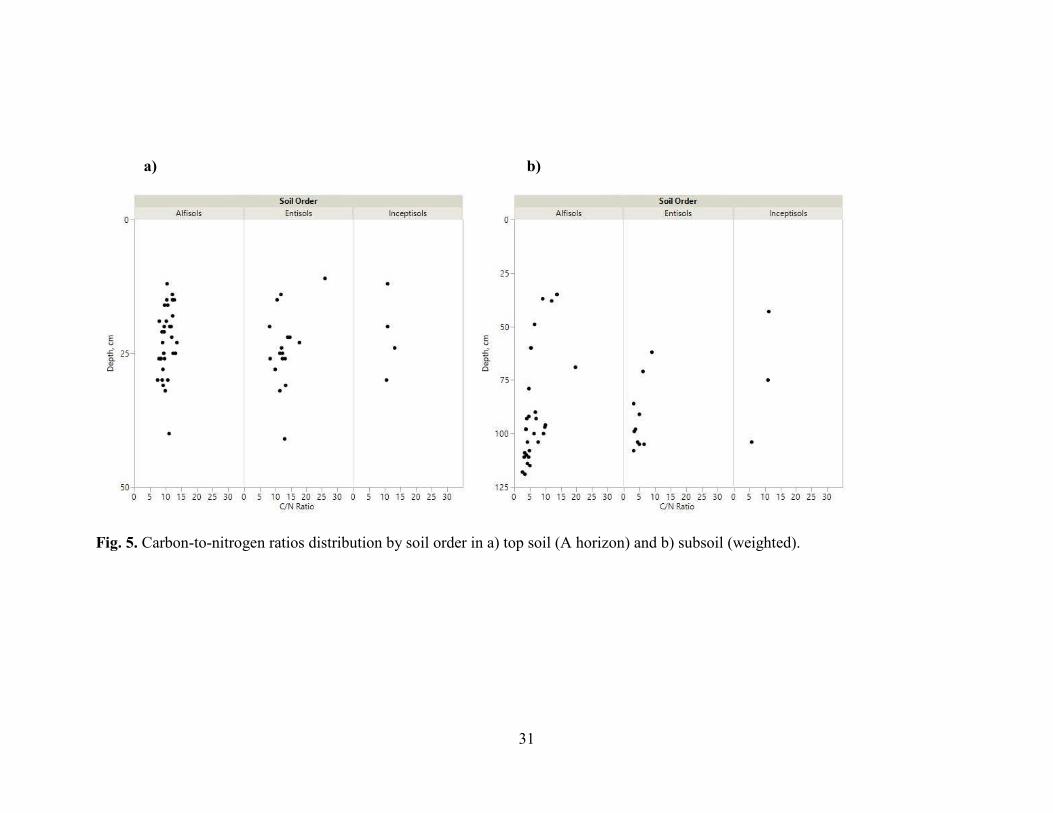
Soil organic carbon, N, and C/N decreased sharply with depth from the soil
surface to about 40 cm and declined to stable values below that depth in all soil orders
(Fig. 2, 3, 5). The decreasing relationship SOC, N, C/N and depth has been documented
in previous studies (Wells et al., 2012; Li et al., 2013; Sinoga et al., 2012; Lawrence et
al., 2015). According to the United States Department of Agriculture (2011) C/N ratio of
around 24 is considered optimal for microbial activity. Fig. 5 indicates that C/N ratios are
below 24 in both top and subsoils, increasing the rate of decomposition activities by
microorganisms. Fontaine et al. (2007) reported that organic carbon in deep soils remains
stable because of a lack of fresh carbon supply, an essential source of energy for soil
microbes, thus soil at the surface is relatively unstable. Xu et al. (2016) stated that there is

22
a direct impact of C/N ratios to decomposing microorganisms. Rumpel and Kogel-
Knabner (2011) discussed that the radiocarbon age of SOC increases with depth, while
SOC and C/N ratios decrease with depth.
3.3. Comparison of bulk and coarse fraction corrected SOC concentrations with depth
Coarse fraction can be important in SOC estimates especially if present in large
quantities. Soil organic carbon concentrations were corrected for coarse fraction (CF) and
compared against samples not corrected for CF (Fig. 2). Table 2 and Table 3 showed that
the highest average CF was found in Inceptisols. This was also evident by comparing
graphs of bulk and CF corrected SOC concentrations (Fig. 2a, Fig. 2b). The most
noticeable change was observed in Inceptisols, while very little change was seen in
Alfisols and Entisols. The five highest individual concentrations (>48%) of CF in cores
were found in Alfisols, however low corresponding SOC concentration made the affects
CF correction insignificant.
Correlations between SOC and SOC corrected for CF were analyzed by soil order
(Table 4). The results showed the strongest correlations in Alfisols and Entisols with
r2=0.99 for both. While Inceptisols correlation was still strong, it’s worth noting it was
less than that of Alfisols and Entisols with r2=0.93. Though this data reveals CF may not
be a significant influence on SOC concentrations in soils at this site, Wiesmeier et al.
(2012) determined CF material in different soil types resulted in overestimation of up to
18% in SOC stock calculations.

23
3.4. Comparison of SOC distribution in top soil and subsoil
Soil samples were separated into top (A horizon) and subsoil depth classes. The
top soil depth class represents the A horizon with an average depth of 23 (+6) cm in
Alfisols, 24 (+7) in Entisols, and 27 (+8) in Inceptisols. The thickness of the subsoil
depth class by soil order is an average 65 (+26) cm in Alfisols, 65 (+20) cm in Entisols,
and 55 (+35) cm in Inceptisols. The SOC % found in the A horizon was active SOC. The
lower depth class represents all samples within a core collectively that are below the A
horizon and considered passive SOC. In order to make comparisons, the SOC
concentrations in the lower depth class were composited by weighing them against the
depth of each sample within a core. Top soil (A horizon) contained more SOC (2.2 +
1.0%) and was highly variable compared to the subsoil (below A horizon), which
contained less of SOC (0.4 + 0.3%) (Fig. 4). The importance of scale, time, and
uncertainty in estimating SOC in relation to ecosystem services was discussed by Baveye
et al. (2016). The importance of subsoil was highlighted by Weismeier et al. (2012) by
stating that subsoil SOC stocks make up almost all of the passive SOC pool. Fontaine et
al. (2007) carbon-dated SOC with depth in French grasslands and reported that surface
layer was dominated by young fast-cycling carbon compared to subsoil dominated by
ancient slow-cycling carbon (passive) suggesting that decomposition was strongly
reduced at depth. Fang et al. (2005) investigated the impact of climate change (global
warming in particular) on soil-stored carbon and concluded that both labile and resistant
soil organic matter will have similar response to changes in temperature. Lehmann and
Kleber (2015) argue that traditional view of soil organic matter pools should be replaced
with viewing SOM as a continuum of progressively decomposing organic compounds.

24
3.5. Correlation of SOC with soil depth class, pH, and land use
Based on the results of a mixed linear nested model only depth class (top and subsoil)
was found to be significant (p≤0.0001) in explaining SOC distribution in Entisols,
Inceptisols, and Alfisols (Table 5). This is supported by results from Fig. 2 that show
definite differences in SOC content with depth. Land use and pH were not significant in
explaining SOC distribution with depth, despite the fact that previous research found land
use to be significant in predicting SOC distribution and storage (Li et al., 2013; Gardi et
al., 2016). The vertical variability of SOC may provide more detailed functions, since
active SOC is often found within the top soil and passive SOC found within the subsoil
(Trumbore, 1997). The top soil is of great importance for provisional services since it
provides habitat, food, fiber, and raw materials (Brady and Weil, 2002). Subsoils contains
significant fraction of SOC, but have a greater role in carbon sequestration which falls
under regulating ecosystem services (Trumbore, 1997; Wiesmeier et al., 2012).
Incorporation of soil depth into SOC ecosystem services framework will benefit the land
management and decision making. For example, Comerford et al. (2013) reports that the
protection of the soil surface with plant residue and SOC will help to control erosion,
increase rainfall infiltration, enhance particle aggregation, increase nutrient supply and
biodiversity.
3. Conclusions
This study analyzed differences in SOC and N distribution with depth in glaciated
soils of the Upstate New York in the context of ecosystem services. Existing frameworks

25
of ecosystem services for SOC were integrated with organizational hierarchy of soil
systems. The vertical SOC distribution was examined quantitatively by soil order and
depth class (top soil versus subsoil). Soil organic carbon decreased with depth in all soil
orders. Bulk SOC concentration did not statistically differed from SOC with coarse
fraction (CF) correction. Top soil (A horizon) contained more SOC and was highly
variable compared to the subsoil (below A horizon). Depth class was statistically
significant in explaining SOC distribution in all three soil orders. Ecosystem services
provided by SOC are depth-dependent because of the types of SOC within the soil: top
soil having more active or labile SOC and subsoil having more slow/passive SOC which
is chemically stable (e.g. humus). Top soil SOC plays an important role in provisional
(e.g. food, feed, fiber etc.), regulatory (e.g. atmospheric CO2 exchange), and supporting
(e.g. soil structure, nutrient retention) services. Meanwhile, subsoil SOC plays a more
dominant role in regulatory (e.g. carbon sequestration) services, and somewhat less
important in provisional and supporting services.

26
APPENDICES

27
Appendix A
Figures
Fig. 1. Map of Willsboro Farm, NY with the following soil types: Howard gravelly
loam, 2 to 8 percent slopes (HgB); Bombay gravelly loam, to 8 percent slopes (BoB);
Kingsbury silty clay loam, 0 to 3 percent slopes (KyA); Kingsbury silty clay loam, 3 to 8
percent slopes (KyB); Covington clay, 0 to 3 percent slopes (CvA); Churchville loam, 2
to 8 percent slopes (CpB); Cosad loamy fine sand, 0 to 3 percent slopes (CuA); Claverack
loamy fine sand, 3 to 8 percent slopes (CqB); Deerfield loamy sand, 0 to 3 percent slopes
(DeA); Stafford fine sandy loam, 0 to 3 percent slopes (StA); Amenia fine sandy loam,
2 to 8 percent slopes (AmB); Massena gravelly silt loam, 3 to 8 percent slopes (McB);
Nellis fine sandy loam, 3 to 8 percent slopes (NeB); Nellis fine sandy loam, 8 to 15
percent slopes (NeC) (Mikhailova et al., 2016).

28
a) b)
Fig. 2. Soil organic carbon (SOC) distribution with depth (values are reported for the low boundary of sampled horizon) in Entisols,
Inceptisols, and Alfisols at polypedon level: a) not corrected for coarse fraction (CF); b) corrected for CF.

29
c) d)
e) f)
Fig. 3. Total nitrogen (%) concentration with depth and carbon-to-nitrogen (C/N) ratios
with depth by soil order: Alfisols (a, b), Entisols (c, d), and Inceptisols (e, f).
a) b) In
cep
tiso
ls
Enti
sols
A
lfis
ols

30
Fig. 4. Soil organic carbon (SOC) distribution by soil order in top soil (A horizon), and subsoil (weighted average).
Su
bso
il
To
p s
oil
SO
C (
%)
We
igh
ted
SO
C (
%)
31
a) b)
Fig. 5. Carbon-to-nitrogen ratios distribution by soil order in a) top soil (A horizon) and b) subsoil (weighted).

32
Table 1
Classification of Willsboro soil organic carbon study with depth as it is relates to ecosystem services, scale hierarchy and knowledge
type diagram (Dijkerman, 1974; Hoosbeek and Bryant, 1992; Adhikari and Hartemink, 2016).
Organizational hierarchy of soil systems Framework for ecosystem services
Degree of … Ecosystem services
System Scale
hierarchy
Time Computation
(qualitative or
quantitative)
Complexity
(mechanistic
or empirical)
Provisional Regulating Cultural Supporting
World i+6
Continent i+5
Region i+4
Watershed i+3
Catena i+2
Polypedon i+1 variable quantitative both x x x x
Pedon i variable quantitative both x x x x
Soil horizon i-1 variable quantitative both x x x x - Top soil
(A horizon) variable quantitative both x x x x
- Subsoil
(below A horizon) variable quantitative both x x x x
Soil structure i-2
Basic structure i-3
Molecular
interaction
i-4
33
Table 2
Average A horizon values for thickness, percent soil organic carbon (SOC), soil texture, and percent coarse fraction by soil type and
soil ordera from detailed field study (original core data from Mikhailova et al., 1996).
Soil order / Soil series
(Map unit symbol),
number of soil cores
Total
area
A horizon
thickness
SOCb
Sandb
Siltb
Clayb
Texture
class
(number
of cores)
Coarse
fraction
m2 cm % --------------------- % -------------------- %
Alfisols (total), n=33
937940 23 + 6c 2.7 + 1 45 + 23 23 + 7 32 + 21
LS(2),
SCL(5),
FSL(5),
SL(2),
CoSL(3),
C(13),
CL(1),
L(1)
11 + 14
Bombay gravelly
loam, 3 to 8 percent
slopes (BoB), n=10
270615 21 ± 5 1.9 + 0.4 65 + 11 20 + 5 14 + 8
LS(1),
SCL(2),
FSL(2),
SL(2),
CoSL(3)
23 + 18
Churchville loam,
2 to 8 percent slopes
(CqB), n =1
36900 18 2.1 59 22 19 SL(1) 19

34
Covington clay, 0 to 3
percent slopes (CvA),
n=1
49076 26 4.6 13 13 74 C(1) 0
Howard gravelly
loam, 2 to 8 percent
slopes (HgB), n/ad
58680 n/a n/a n/a n/a n/a n/a n/a
Kingsbury silty clay
loam, 0 to 3 percent
slopes (KyA), n=19
480679 23 + 6 3.1 + 0.9 35 + 20 26 + 7 39 + 16
C(12),
CL(1),
SCL(2),
FSL(2),
L(1),
LS(1)
6 + 7
Kingsbury silty clay
loam, 3 to 8 percent
slopes (KyB), n=2
41990 30 + 14 1.8 + 0.6 59 + 18 21 + 5 20 + 13 FSL(1),
SCL(1) 2 + 0
Entisols (total), n=17
378691 24 + 7 2.0 + 0.7 69 + 27 17 + 13 14 + 19
SiL(1),
SL(2),
L(1),
FS(5),
FSL(1),
LS(2),
C(2),
S(1),
LFS(2)
6 + 10
Claverack loamy fine
sand, 3 to 8 percent
slopes (CqB), n=3
64230 31 + 9 2.3 + 0.5 62 + 32 28 + 21 10 ± 10
SiL(1),
SL(1),
L(1)
3 + 3

35
Cosad loamy fine
sand, 0 to 3 percent
slopes (CuA), n=6
168530 19 + 7 1.8 + 0.8 61 + 26 18 + 12 20 + 20
SL(1),
L(1),
FS(1),
C(1),
FSL(1),
LS(1)
12 + 13
Deerfield loamy sand,
0 to 3 percent slopes
(DeA), n=1
331 22 2.2 87 10 3 FS(1) 2
Stafford fine sandy
loam, 0 to 3 percent
slopes (StA), n=7 145600 26 + 4 2.0 + 0.8 75 + 29 12 + 7 13 + 22
C(1),
LFS(2),
FS(3),
LS(1)
2 + 5
Inceptisols (total),
n=4
157764
27 + 8
3.3 + 0.8
57 + 22
33 + 10
9 + 16
CL(1),
SL(1),
CoSL(2)
41 + 22
Amenia fine sandy
loam, 2 to 8 percent
slopes (AmB), n/a
3185 n/a n/a n/a n/a n/a n/a n/a
Massena gravelly silt
loam, 3 to 8 percent
slopes (McB), n/a
8479 n/a n/a n/a n/a n/a n/a n/a
Nellis fine sandy
loam, 3 to 8 percent
slopes (NeB), n=3
39030 19 + 6 3.3 + 0.9 56 + 27 24 + 10 19 + 17
CL(1),
SL(1),
CoSL(1)
21 + 20

36
Nellis fine sandy
loam, 8 to 15 percent
slopes (NeC), n=1
107070 30 3.3 58 36 6 CoSL(1) 48
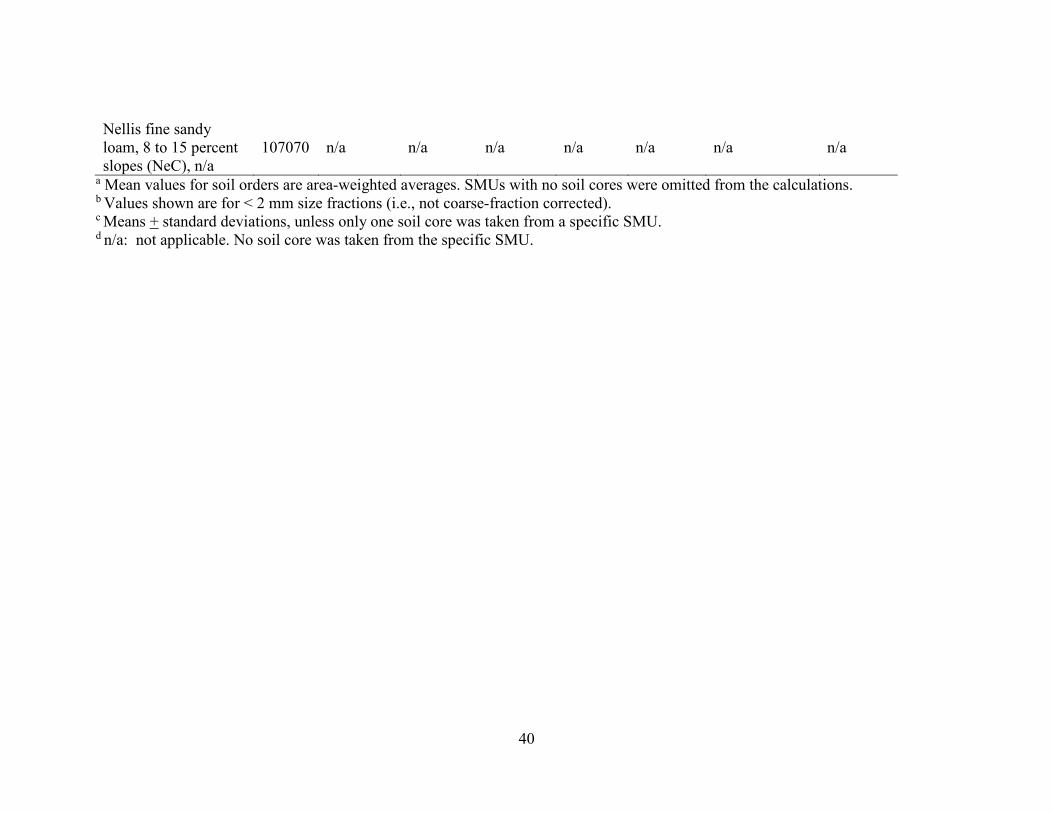
a Mean values for soil orders are area-weighted averages. SMUs with no soil cores were omitted from the calculations. b Values shown are for < 2 mm size fractions (i.e., not coarse-fraction corrected). c Means + standard deviations, unless only one soil core was taken from a specific SMU. d n/a: not applicable. No soil core was taken from the specific SMU.

37
Table 3
Average subsoil (below A horizon) values for thickness, percent soil organic carbon (SOC), soil texture, and percent coarse fraction
by soil type and soil ordera from detailed field study (original core data from Mikhailova et al., 1996).
Soil order / Soil series
(Map unit symbol),
number of soil cores
Total
area
Subsoil
thickness
SOCb
weighted
Sandb
Siltb
Clayb
Texture class
(number of
samples)
Coarse
fraction
m2 cm % ------------------ % ------------------ %
Alfisols (total), n=32
937940 65 + 26c 0.4 + 0.3 25 + 23 33 + 11 42 + 20
SL(2),
SCL(1),
FSL(10),
SiL(1),
SiC(19),
CoSL(2),
C(38), SC(1),
CL(11), L(6),
SiCL(4)
6 + 10
Bombay gravelly
loam, 3 to 8 percent
slopes (BoB), n=9
270615 52 + 35 0.5 + 0.2 42 + 25 31 + 12 26 + 17
C(1), CL(2),
CoSL(2),
FSL(6), L(3),
SC(1), SiC(4),
SiCL(1), SL(1)
23 + 18
Churchville loam,
2 to 8 percent slopes
(CqB), n=1
36900 51 0.6 58 + 5 24 + 4 18 + 1 FSL(2), SL(1) 22 + 0

38
Covington clay, 0 to 3
percent slopes (CvA),
n=1
49076 66 0.5 6 + 4 29 + 2 65 + 4 C(4) 0
Howard gravelly
loam, 2 to 8 percent
slopes (HgB), n/ad
58680 n/a n/a n/a n/a n/a n/a n/a
Kingsbury silty clay
loam, 0 to 3 percent
slopes (KyA), n=19
480679 71 + 22 0.4 + 0.1 17 + 18 35 + 12 48 + 18
C(27), CL(9),
SCL(1),
FSL(2), L(3),
SiL(1),
SiC(14),
SiCL(3)
4 + 6
Kingsbury silty clay
loam, 3 to 8 percent
slopes (KyB), n=2
41990 75 + 9 0.3 + 0 7 + 3 30 + 8 64 + 10 C(6), SiC(1) 1 + 2
Entisols (total), n=16
378691 65 + 20 0.3 + 0.3 50 + 38 21 + 13 30 + 28
SiC(2), LS(1),
FS(15),
FSL(1), C(20),
LFS(4),
CL(3), S(1),
CoSL(1),
LVFS(1),
VFLS(2)
2 + 4
Claverack loamy fine
sand, 3 to 8 percent
slopes (CqB), n=3
64230 57 + 30 0.3 + 0.1 39 + 38 21 + 10 40 + 31
FSL(1), CL(1),
LS(1), C(3),
LFS(1)
2 + 3

39
Cosad loamy fine
sand, 0 to 3 percent
slopes (CuA), n=5
168530 76 + 17 0.5 + 0.2 35 + 35 26 + 13 39 + 25
SiC(1), CL(2),
FS(4), C(10),
LFS(1)
2 + 3
Deerfield loamy sand,
0 to 3 percent slopes
(DeA), n=1
331 69 0.6 79 + 13 18 + 10 4 + 4
FS(1), S(1),
LFS(1),
VFSL(1)
0
Stafford fine sandy
loam, 0 to 3 percent
slopes (StA), n=7 145600 60 + 18 0.3 + 0.1 60 + 38 17 + 13 23 + 27
C(7), CoSL(1),
LFS(1),
FS(10), SiC(1),
LVFS(1),
VFSL(1)
2 + 6
Inceptisols (total),
n=3
157764
55 + 35
0.4 + 0.1
37 + 29
32 + 13
31 + 18
C(1), SiC(3),
FSL(2),
SCL(1), SL(1)
12 + 13
Amenia fine sandy
loam, 2 to 8 percent
slopes (AmB), n/a
3185 n/a n/a n/a n/a n/a n/a n/a
Massena gravelly silt
loam, 3 to 8 percent
slopes (McB), n/a
8479 n/a n/a n/a n/a n/a n/a n/a
Nellis fine sandy
loam, 3 to 8 percent
slopes (NeB), n=3
39030 55 + 35 0.4 + 0.1 37 + 29 32 + 13 31 + 18
C(1), SL(1),
FSL(2),
SCL(1), SiC(3)
12 + 13
40
Nellis fine sandy
loam, 8 to 15 percent
slopes (NeC), n/a
107070 n/a n/a n/a n/a n/a n/a n/a
a Mean values for soil orders are area-weighted averages. SMUs with no soil cores were omitted from the calculations. b Values shown are for < 2 mm size fractions (i.e., not coarse-fraction corrected). c Means + standard deviations, unless only one soil core was taken from a specific SMU. d n/a: not applicable. No soil core was taken from the specific SMU.

41
Table 4
Pearson correlation (r) of SOC (%) with SOC (%) corrected for CF (%) across the total
site depth, the upper depth class, the lower depth class, and by soil order (p-values in
parentheses).
Parameter SOC (%) vs. SOC (%) corrected for CF (%)
Total soil profile
Alfisols 0.99 (<0.0001)
Entisols 0.99 (<0.0001)
Inceptisols 0.93 (<0.0001)
All soil orders 0.98 (<0.0001)
Upper soil class (top soil)
Alfisols 0.98 (<0.0001)
Entisols 0.96 (<0.0001)
Inceptisols 0.51 ( 0.4983)
All soil orders 0.93 (<0.0001)
Lower soil class (subsoil)
Alfisols 0.98 (<0.0001)
Entisols 0.99 (<0.0001)
Inceptisols 0.98 (<0.0001)
All soil orders 0.99 (<0.0001)
7

42
Table 5
ANOVA results for final mixed linear nested model.
Dependent
variable
Independent variable Dfa F valueb Pr (>F)
Alfisols
SOC (%) Soil depth (depth class) 54 102.77 <0.001
pH 54 0.65 0.4234
Land use 54 1.24 0.2931
Entisols
SOC (%) Soil depth (depth class) 17.7 55.01 <0.001
pH 9.7 0.50 0.4951
Land use 6.7 0.58 0.7834
Inceptisols
SOC (%) Soil depth (depth class) 3 22.55 0.0177
pH 3 0.22 0.6725
Land use 3 0.10 0.7718 a The degrees of freedom are using an approximation method accounting for
heterogeneity of variances. b Numerator degrees of freedom are always 1.
.

43
References
Adhikari, K., Hartemink, A., 2016. Linking soils to ecosystem services – A global
review. Geoderma 262, 101-111.
Baveye, P., Baveye, J., Gowdy, J., 2016. Soil “ecosystem” services and natural capital:
Critical appraisal of research on uncertain ground. Front. Environ. Sci. 4, Article 41
doi: 10.3389/fenvs.2016.00041.
Brady, N.C., Weil, R.R., 2002. The nature and properties of soils (No. Ed. 13). Prentice-
Hall Inc.
Cheng, M., Xiang, Y., Xue, Z., An, S., Darboux, F., 2015. Soil aggregation and intra-
aggregate carbon fractions in relation to vegetation succession on the Loess Plateau,
China. Catena 124, 77-84.
Crespin, S.J., Simonetti, J.A., 2016. Loss of ecosystem services and the decapitalization
of nature in El Salvador. Ecosyst. Serv. 17, 5-13.
Dijkerman, J.C., 1974. Pedology as a science: The role of data, models and theories in the
study of natural soil systems. Geoderma 11, 73-93.
Environmental Systems Research Institute (ESRI), 2009. ArcGIS Desktop: Release 9.3.1.
Environmental Systems Research Institute, Redlands, California.
García-Nieto, A.P., García-Llorente, M., Iniesta-Arandia, I., Martín-López, B., 2013.
Mapping forest ecosystem services: From providing units to beneficiaries. Ecosyst.
Serv. 4, 126-138.
Gardi, C., Sconosciuto, F., 2007. Evaluation of carbon stock variation in Northern Italian
soils over the last 70 years. Sustain. Sci. 2(2), 237-243.

44
Gee, G.W., Bauder, J.W., 1986. Particle-size analysis. In A. Klute (ed.) Methods of Soil
Analysis (pp. 383-411). Part 1. 2nd edition. Agron. Monogr. 9. ASA and SSSA,
Madison, WI.
Gray, J.M., Bishop, T.F., Yang, X., 2015. Pragmatic models for the prediction and digital
mapping of soil properties in eastern Australia. Soil Res. 53 (1), 24-42.
Hoosbeek, M.R., Bryant, R.B., 1992. Towards the quantative modeling of pedogenesis –
a review. Geoderma 55, 183-210.
Jandl, R., Rodeghiero, M., Martinez, C., Cotrufo, M.F., Bampa, F., van Wesemael, B.,
Harrison, R.B., Guerrini, I.A., deB Richter, D., Rustad, L., 2014. Current status,
uncertainty and future needs in soil organic carbon monitoring. Sci. Total Environ.
468, 376-83.
JMP®, Version 12. SAS Institute Inc., Cary, NC, 1989-2007.
Kempen, B., Brus, D.J. and Stoorvogel, J.J., 2011. Three-dimensional mapping of soil
organic matter content using soil type–specific depth functions. Geoderma, 162(1),
107-123.
Kumar, S., Lal, R., Liu, D., Rafiq, R., 2013. Estimating the spatial distribution of organic
carbon density for the soils of Ohio, USA. J. Geogr. Sci., 23(2), 280-96.
Lawrence, C.R., Harden, J.W., Xu, X., Schulz, M.S., Trumbore, S.E., 2015. Long-term
controls on soil organic carbon with depth and time: A case study from the Cowlitz
River Chronosequence, WA USA. Geoderma 247-248, 73-87.
Lehmann, J., Kleber, M., 2015. The contentious nature of soil organic matter. Nature
528(7580), 60-68.

45
Li, M., Zhang, X., Pang, G., Han, F., 2013. The estimation of soil organic carbon
distribution and storage in a small catchment area of the loess plateau. Catena 101,
11-16.
Liu, S., An, N., Yang, J., Dong S, Wang C, Yin Y, 2015. Prediction of soil organic matter
variability associated with different land use types in mountainous landscape in
southwestern Yunnan province, China. Catena 133:137-44.
Mikhailova, E.A., Van Es, H.M., Lucey, R.F., DeGloria, S.D., Schwager, S.J. and Post,
C.J., 1996. Soil Characterization Data for Selected Pedons from the Willsboro Farm,
Essex County, New York. Research Series R96-5. Department of Soil, Crop, and
Atmospheric Sciences, Cornell University, Ithaca, New York 14853.
Mikhailova, E.A., Altememe, A.H., Bawazir, A.A., Chandler, R.D., Cope, M.P., Post,
C.J., Stiglitz, R.Y., Zurqani, H.A., Schlautman, M.A., 2016. Comparing soil carbon
estimates in glaciated soils at a farm scale using geospatial analysis of field and
SSURGO data. Geoderma 281, 119-126.
Obi, J., Ogban, P., Ituen, U., Udoh, B., 2014. Development of pedotransfer functions for
coastal plain soils using terrain attributes. Catena 123:252-62.
Olson, K., Al-Kaisi, M., 2015. The importance of soil sampling depth for accurate
account of soil organic carbon sequestration, storage, retention and loss. Catena
125:33-7.
Orton, T., Pringle, M., Bishop, T., 2016. A one-step approach for modelling and mapping
soil properties based on profile data sampled over varying depth intervals. Geoderma
262, 174-86.

46
Paudyal, K., Baral, H., Burkhard, B., Bhandari, S.P., Keenan, R.J., 2015. Participatory
assessment and mapping of ecosystem services in a data-poor region: case study of
community-managed forests in central Nepal. Ecosyst. Serv.13, 81-92.
Roudier, P., Hedley, C., Ross, C., 2015. Prediction of volumetric soil organic carbon
from field‐moist intact soil cores. Eur. J. Soil Sci. 66(4), 651-60.
Rumpel, C., Kögel-Knabner, I., 2011. Deep soil organic matter—a key but poorly
understood component of terrestrial C cycle. Plant Soil. 338(1-2), 143-158.
Schägner, J.P., Brander, L., Maes, J. and Hartje, V., 2013. Mapping ecosystem services'
values: Current practice and future prospects. Ecosyst. Serv. 4, 33-46.
Sinoga, J.D.R., Pariente, S., Diaz, A.R., Murillo, J.F.M., 2012. Variability of
relationships between soil organic carbon and some soil properties in Mediterranean
rangelands under different climatic conditions (south of Spain). Catena 94, 17-25
Song, X., Brus, D.J., Liu, F., Li, D., Zhao, Y., Yang, J., Zhang, G., 2016. Mapping soil
organic carbon content by geographically weighted regression: A case study in the
Heihe river basin, China. Geoderma 261, 11-22.
Stockmann, U., Adams, M.A., Crawford, J.W., Field, D.J., Henakaarchchi, N., Jenkins,
M., Minasny, B., McBratney, A.B., de Courcelles, V., Singh, K., Wheeler, I., Abbott,
L., Angers, D.A., Baldock, J., Bird, M., Brookes, P.C., Chenu, C., Jastrow, J.D., Lal,
R., Lehmann, J., O’Deonnell, A.G., Parton, W.J., Whitehead, D., Zimmermann, M.,
2013. The knowns, known unknowns and unknowns of sequestration of soil organic
carbon. Agric. Ecosyst. Environ. 164, 80-99.

47
Statistical Analysis System Institute Inc. (SAS Institute Inc.). 2016. JMP® Software,
version 12 SAS Institute, Cary, NC.
Tiessen, H., Cuevas, E., Chacon, P., 1994. The role of soil organic-matter in sustaining
soil fertility. Nature 371(6500), 783-785.
Troy, A., Wilson, M.A., 2006. Mapping ecosystem services: practical challenges and
opportunities in linking GIS and value transfer. Ecol. Econ. 60(2), 435-449.
USDA NRCS East National Technology Support Center. (2011). Carbon to nitrogen
ratios in cropping systems. Greensboro, NC: Soils.usda.gov/sqi USDA Natural
Resources Conservation Service.
Weissert, L., Salmond, J., Schwendenmann, L., 2016. Variability of soil organic carbon
stocks and soil CO 2 efflux across urban land use and soil cover types. Geoderma
271, 80-90.
Wiesmeier, M., Spörlein, P., Geuß, U., Hangen, E., Haug, S., Reischl, A., Schilling, B.,
Lützow, M., Kögel‐Knabner, I., 2012. Soil organic carbon stocks in southeast
Germany (Bavaria) as affected by land use, soil type and sampling depth. Global
Change Biol. 18(7), 2233-45.
Wells, T., Hancock, G. R., Dever, C., Murphy, D. 2012. Prediction of vertical soil
organic carbon profiles using soil properties and environmental tracer data at an
untilled site. Geoderma 170, 337-346.
Recommended