Social Cash Transfer Programs in Africa: Rational and Evidences
Solomon Asfaw
Food and Agricultural Organization (FAO)Agricultural Development Economics Division (ESA)
Rome, Italy

Outline of the presentation
1. Background of CT programs in Africa
2. Why do we expect growth linkages?
3. What does the evidence say?

Expansion of government-runcash transfers in Sub Saharan Africa
Approximately half of the countries of SSA have some kind of government-run CT program
– And others have multilateral/NGO-run CT programs Some programs are national
– Others scaling up– Some pilots beginning this year
Beneficiaries predominately rural, most engaged in agriculture

Cash transfers national scale up (as of end 2010)
% of population covered by cash transfer program
South AfricaNamibia Ethiopia Swaziland Botswana LesothoMozambique Kenya Rwanda Malawi Ghana Zambia Tanzania0
5
10
15
20
25
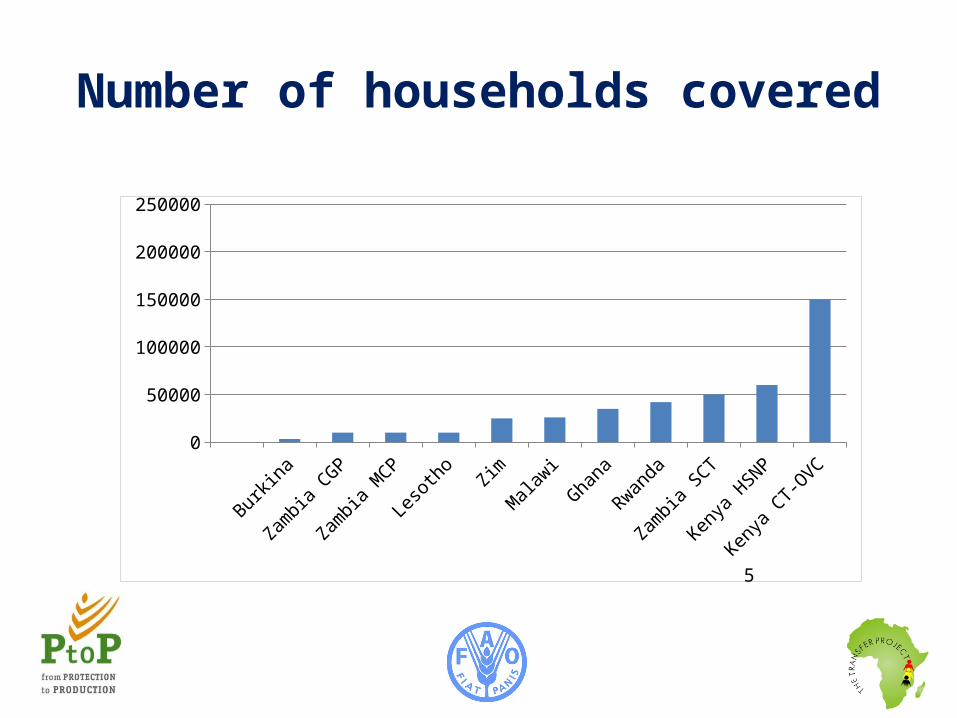
Number of households covered
Burkin
a
Zambia
CG
P
Zambia
MCP
Lesoth
oZim
Mala
wi
Ghana
Rwanda
Zambia
SCT
Kenya H
SNP
Kenya C
T-OVC
0
50000
100000
150000
200000
250000
5
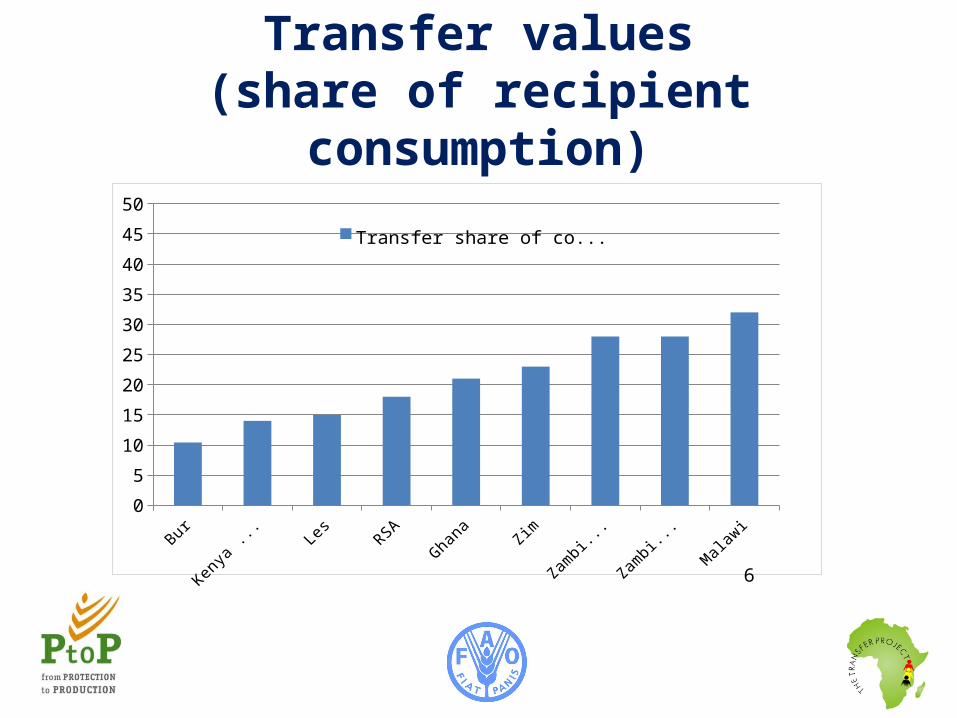
Transfer values(share of recipient consumption)
Burkina Kenya CT-OVC
Lesotho RSA CSG
Ghana Zim Zambia CGP
Zambia MCP
Malawi0
5
10
15
20
25
30
35
40
45
50Transfer share of consump-tion
6
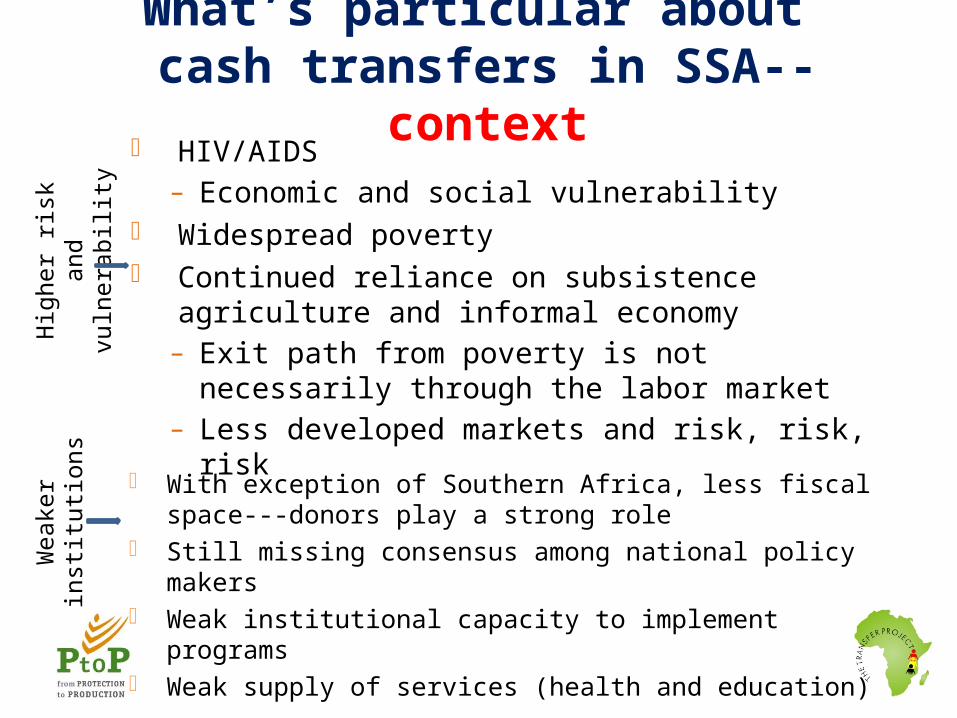
What’s particular about cash transfers in SSA--context
HIV/AIDS– Economic and social vulnerability
Widespread poverty Continued reliance on subsistence agriculture and
informal economy– Exit path from poverty is not necessarily through the
labor market– Less developed markets and risk, risk, risk
Hig
her r
isk
and
vuln
erab
ility
Wea
ker i
nstit
ution
s
With exception of Southern Africa, less fiscal space---donors play a strong role
Still missing consensus among national policy makers Weak institutional capacity to implement programs Weak supply of services (health and education)
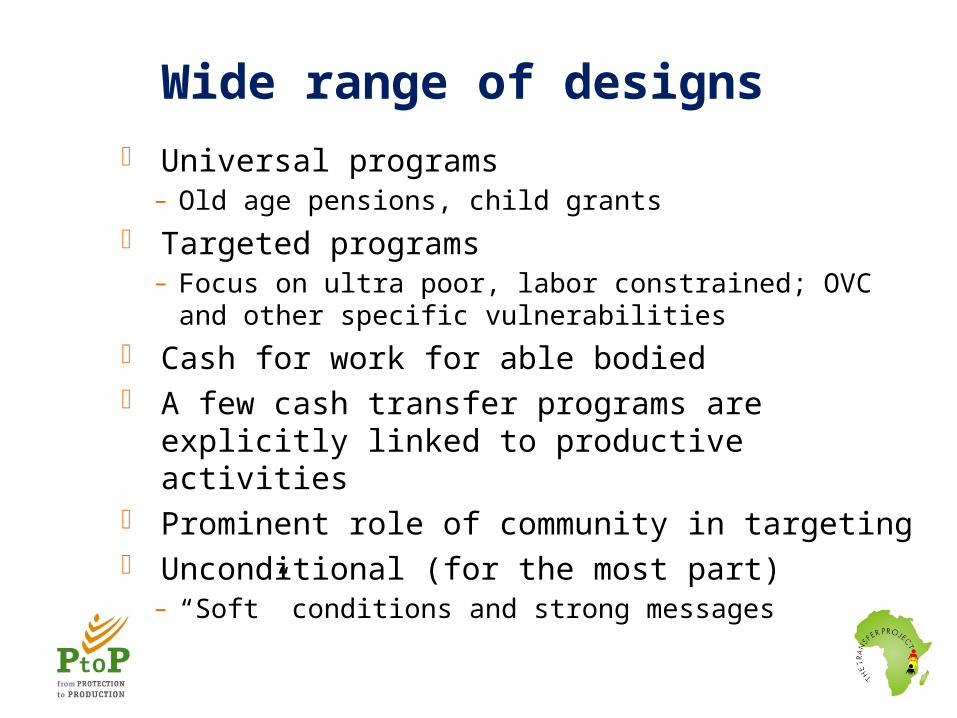
Wide range of designs Universal programs
– Old age pensions, child grants
Targeted programs – Focus on ultra poor, labor constrained; OVC and
other specific vulnerabilities
Cash for work for able bodied A few cash transfer programs are explicitly
linked to productive activities Prominent role of community in targeting Unconditional (for the most part)
– “Soft” conditions and strong messages
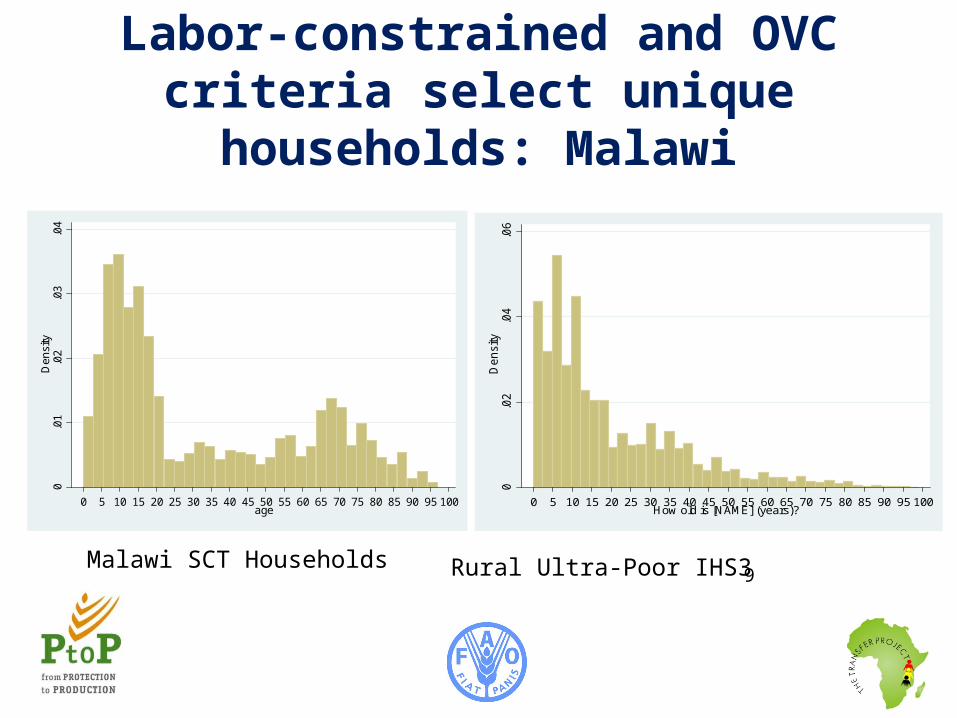
Labor-constrained and OVC criteria select unique households: Malawi
0.0
1.0
2.0
3.0
4D
ensi
ty
0 5 10 15 20 25 30 35 40 45 50 55 60 65 70 75 80 85 90 95 100age
0.0
2.0
4.0
6D
en
sity
0 5 10 15 20 25 30 35 40 45 50 55 60 65 70 75 80 85 90 95 100How old is [NAME] (years)?
Malawi SCT Households Rural Ultra-Poor IHS3 9

Labor-constrained and OVC criteria select unique households: Zambia
Zambia (Monze) SCT Households Rural Ultra-Poor LCMS 2010
0.0
1.0
2.0
3.0
4.0
5.0
6D
ensi
ty
0 5 10 15 20 25 30 35 40 45 50 55 60 65 70 75 80 85 90 95 100105agey
Age Distribution of Monze, Zambia SCT Beneficiaries
0.0
1.0
2.0
3.0
4.0
5.0
6D
ensi
ty0 5 10 15 20 25 30 35 40 45 50 55 60 65 70 75 80 85 90 95 100
agey
Age Distribution of Rural Severly Poor: Zambia LCMS 2010
10

5 (+1) ways in which cash transfer programs have
productive/economic impacts and lead to improved
resilience
Why do we expect economic impacts (growth linkages) from
SCT programs?

1. Improve human capital
• Nutritional status• Health status• Educational attainment
Typically core objectives of CT programsUnderlying rationale for CCTs in LAC
enhance productivity
improve employability
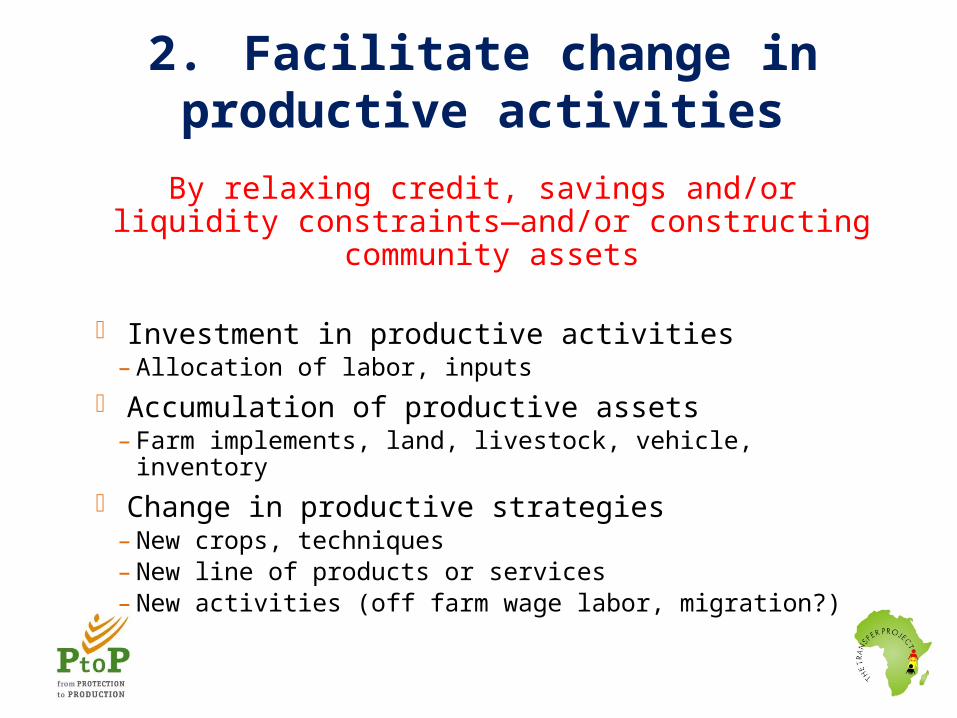
2. Facilitate change in productive activities
By relaxing credit, savings and/or liquidity constraints—and/or constructing community assets
Investment in productive activities– Allocation of labor, inputs
Accumulation of productive assets– Farm implements, land, livestock, vehicle, inventory
Change in productive strategies– New crops, techniques– New line of products or services– New activities (off farm wage labor, migration?)

3. Better ability to deal with risk and shocks
By providing insurance via regular and predictable CTs
Avoid detrimental risk coping strategies– Distress sales of productive assets, children school
drop-out, risky income-generation activities Avoid risk averse production strategies
– “Safety first” or “eat first” Increase risk taking into more profitable crops
and/or activities– Specialization or diversification
• Higher value crops or ….. migration

4. Relieve pressure on informal insurance mechanisms
By regular and predictable CTs to the poorest and most vulnerable
Reduce burden on social networks– Local networks of reciprocal relationships
• In SSA, often weakened and over burdened in context of HIV/AIDS
Rejuvenate social networks Allow beneficiaries to participate in social
networks Allow non beneficiaries to redirect their
resources

5. Strengthen the local economy
Immediate impact of transfer will raise purchasing power of beneficiary households.
As beneficiary households spend cash, impacts immediately spread outside beneficiary households to others inside and outside treated villages.
Trade and purchases within village may set in motion income multipliers inside treated villages.
Periodic markets and purchases outside village will shift income effects to non-treated villages, potentially unleashing income multipliers there.
In longer run, as program is scaled up, transfers will have direct and indirect (or general equilibrium) effects throughout the region of implementation.
How do local economy effects work?

Transfer
Control
Treatment

Transfer
Control
Treatment

Transfer
Rest of Lesotho
Rest of World
Control
Treatment

Transfer
Rest of Lesotho
Rest of World
Control
TreatmentTransfer

Transfer
Rest of Lesotho
Rest of World
Treatment
Control?

What does the evidence say?
Lots of evidence on human capital– Poverty, food security and food consumption– Nutrition, health and education
Relatively few studies on risks and shocks Very few studies on
– Productive activities– Multiplier effects– Social networks– Climate change adaptation

1st and 2nd generation cash transfer program impact evaluations in SSA (19 in 13)
• Malawi SCT – Mchinji pilot, 2008-2009– Expansion, 2012-2014
• Kenya– CT-OVC, Pilot 2007-2011– CT-OVC, Expansion, 2012-
2014– HSNP, Pilot 2010-2012
• Mozambique PSA– Expansion, 2008-2009
• Zambia– Monze pilot, 2007-2010– Child Grant, 2010-2013
• South Africa CSG– Retrospective, 2010
• Burkina Faso– Experiment, 2008-2010
• Ethiopia – PSNP, 2006-2010– Tigray SPP, 2012-2014
• Ghana LEAP– Pilot, 2010-2012
• Lesotho, CGP– Pilot, 2011-2013
• Uganda, SAGE– Pilot, 2012-2014
• Zimbabwe, SCT– Pilot, 2013-2015
• Tanzania, TASAF– Pilot, 2009-2012– Expansion, 2012-2014
• Niger– Begins in 2012

Summary of results on social outcomes
Schooling Morbidity Health care Anthro.
Burkina x
Ghana LEAP x NS X
Kenya CT-OVC x x* X* NS
Lesotho
Mlw Mchinji X X X ?
RSA CSG X NS
Zam CGP
Zam Monze x NS NS
Zam MCP
Not collected x=significant empty=pending NS=not significant24

Summary of results on economic outcomes
Not collected x=significant empty=pending NS=not significant
Consumption Food security Assets Production
Burkina
Eth PSNP x x x x
Ghana LEAP NS X NS NS
Kenya CT-OVC X X x NS
Lesotho
Mlw Mchinji X X x x
RSA CSG X
Zam CGP X X x x
Zam Monze NS NS x x
Zam MCP x x x x
25
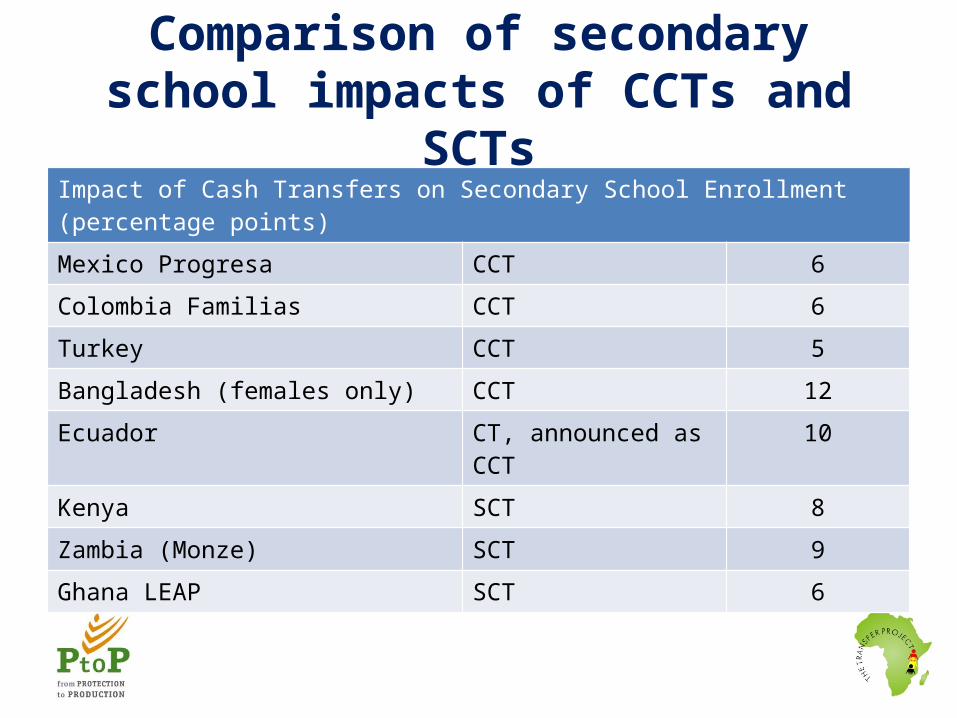
Comparison of secondary school impacts of CCTs and SCTs
Impact of Cash Transfers on Secondary School Enrollment (percentage points)
Mexico Progresa CCT 6
Colombia Familias CCT 6
Turkey CCT 5
Bangladesh (females only) CCT 12
Ecuador CT, announced as CCT
10
Kenya SCT 8
Zambia (Monze) SCT 9
Ghana LEAP SCT 6

Our websites
From Protection to Production Projecthttp://www.fao.org/economic/PtoP/en/
The Transfer Projecthttp://www.cpc.unc.edu/projects/transfer
Recommended