SOA vs POA in the Amazon: Current model estimates and predicted change
Colette L. [email protected]
Aerosols in the Amazon WorkshopFebruary 18, 2008
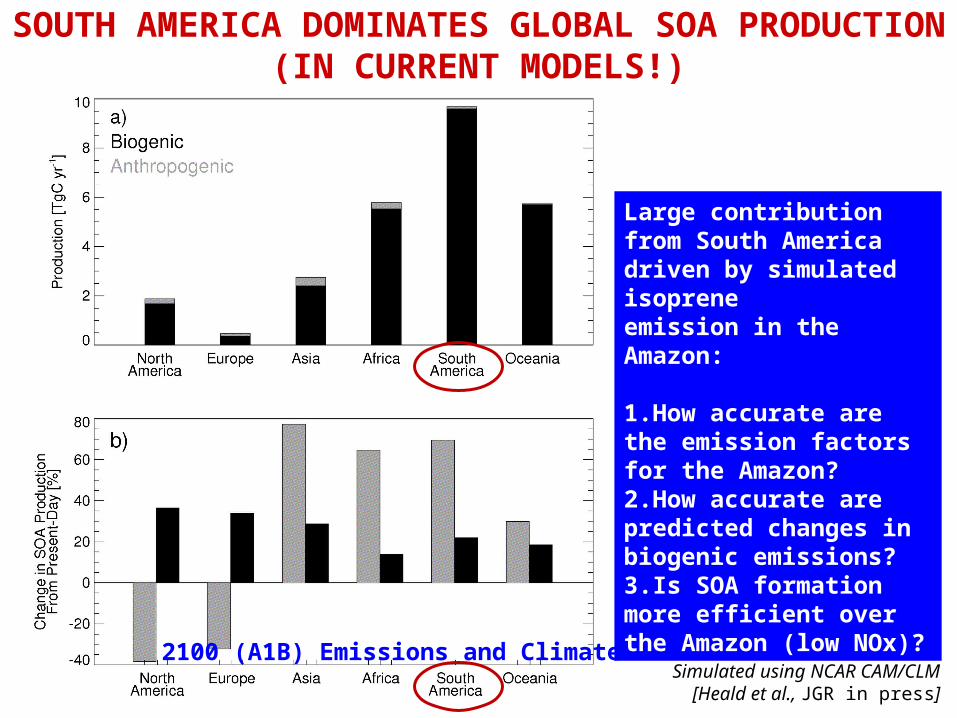
SOUTH AMERICA DOMINATES GLOBAL SOA PRODUCTION (IN CURRENT MODELS!)
Large contribution from South America driven by simulated isoprene emission in the Amazon:
1.How accurate are the emission factors for the Amazon?2.How accurate are predicted changes in biogenic emissions?3.Is SOA formation more efficient over the Amazon (low NOx)?
2100 (A1B) Emissions and ClimateSimulated using NCAR CAM/CLM
[Heald et al., JGR in press]

BIOGENIC EMISSIONS IN SOUTH AMERICASimulated in NCAR CLM model for year 2000 (annual mean), based on MEGAN v2 algorithms.
ISOPRENE:32 % of global total
MONOTERPENES:16% of global total

ANNUAL MEAN CONCENTRATIONS IN 2000
Large seasonality, but generally in
phase with peak in dry season
Simulated using NCAR CAM/CLM

EMISSION/PRODUCTION CHANGES PREDICTED FOR 2100
SOA24.3
POA45.0
SOA30.2
(+24%)
POA72.0
(+60%)
Pro
du
ctio
n/E
mis
sio
nT
g/y
r
2000 2100 A1B
SOx150.0
SOx56.4
(-62%)
GLOBAL
SOA9.7
POA7.7
SOA11.8
(+22%) POA10.5
(+38%)
Pro
du
ctio
n/E
mis
sio
nT
g/y
r
2000 2100 A1B
SOx4.5
SOx4.3
(-4%)
SOUTHAMERICA
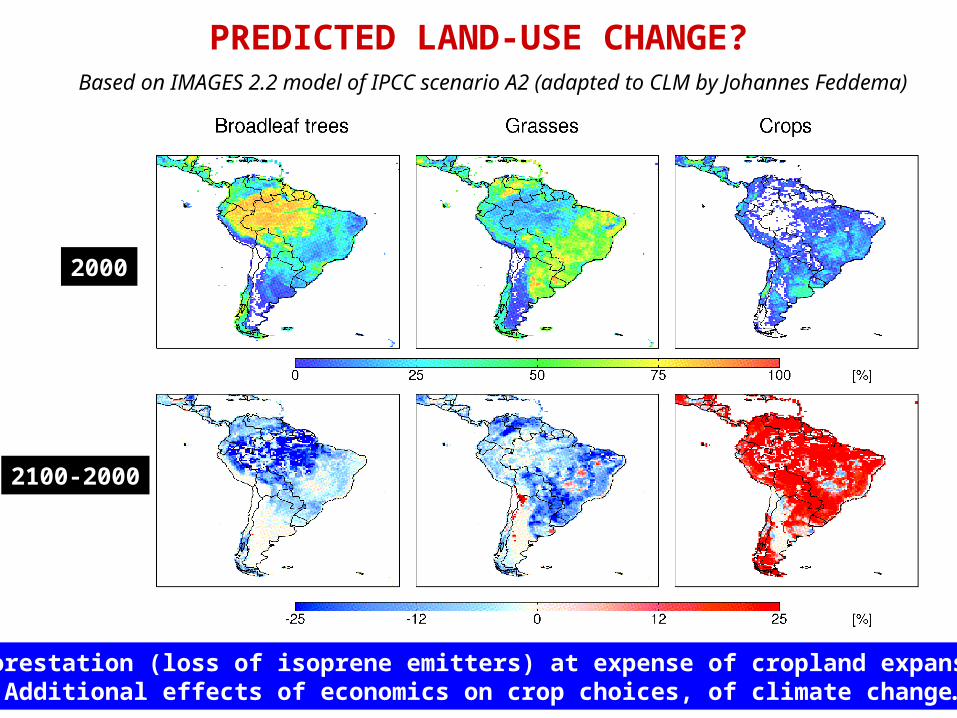
PREDICTED LAND-USE CHANGE?
2000
2100-2000
Deforestation (loss of isoprene emitters) at expense of cropland expansion.Additional effects of economics on crop choices, of climate change…
Based on IMAGES 2.2 model of IPCC scenario A2 (adapted to CLM by Johannes Feddema)
Recommended