Enerov Mines anaSnergie. Mines e\
Resources CanaoaResources Canada
CANMETCanada CentreCentre canadien
for Mineralde la technologie
and Energydes minerauxTechnologyet de I energie
PERMEABILITY OF DIFFERENT MATERIALS TO RADON (^Rn) GAS
J. BIGU, E.D. HALLMAN AND L. KENDRICK
ELLIOT LAKE LABORATORY
NOVEMBER 1991
Sudbury Neutrino Observatory Project Report SNO-STR-91-069
MINING RESEARCH LABORATORYDIVISION REPORT MRL 91- (TR)

99?PERMEABILITY OF DIFFERENT MATERIALS TO RADON (""Rn) GAS
J. Bigu*, E.D. Hallman** and L. Kendrick***
ABSTRACT
000
The permeability of a variety of materials to ^ Rn has been measured
in a Radon/Thoron Test Facility (RTTF) of the walk-in type. The measurements
were conducted using an automated multi-sensor apparatus consisting of a
number of ^Rn passive monitors and meteorological sensors which permit
simultaneous permeability studies of up to 12 different materials. Twenty-two
different materials were tested. The permeability measured for thesec 01
materials ranged from greater than about 1 x 10’ cm s~ to less than
-1.0 x 10’9 cn^s’1. Among the several materials investigated, a number of
them are suitable as ^Rn barriers. However, for the special application000
intended here as wall-cover for restricting the flow of Rn from mine walls
(which require low permeability to ^^n. as well as great mechanical
flexibility and resistance to impact) only two materials are potentially
suitable, namely, an epoxy resin, and MIROC�, a polyurethene-based material.
Permeability studies are in progress to evaluate other materials for similar
applications but different mechanical configurations.
Key words: Permeability; Radon; Diffusion.
^Research Scientist (MRL, CANMET. E.M.R.) and Adjunct Professor (Laurentian
University); **Professor (Laurentian University); ***Research Technologist
(Laurentian University).

Ill
CONTENTS
Page
ABSTRACT .............................................................. i
RESUME ................................................................ ^INTRODUCTION .......................................................... 1
THEORETICAL BACKGROUND ................................................ 2
EXPERIMENTAL APPARATUS AND PROCEDURE .................................. 13
EXPERIMENTAL RESULTS AND DISCUSSION ................................... 15
EXPERIMENTAL DIFFICULTIES ............................................. 20
CONCLUSIONS ........................................................... 22
ACKNOWLEDGEMENT ....................................................... 22
REFERENCES ............................................................ 23
TABLES
No.999
1. Permeability of several materials to Rn ........................ 25
2. Diffusion length of ^Rn in several materials .................... 26
’� � FIGURES
1. Membrane geometry .��................................................ 25
2. Normalized count rate versus elapsed time ......................... 26
3. Radon-222 monitors showing geometrical arrangement used to
determine the permeability of membranes ........................... 27
4. ’Multisensor’ apparatus used to determine the permeability ofmembranes ......................................................... 28
5. Alpha-particle count rate versus elapsed time for a glass fibrefilter (upper trace) and a low permeability membrane (epoxy) ...... 29

INTRODUCTION
A desirable feature of certain materials is their ability
to separate the components of a gas mixture by diffusion processes. While
some materials are quite effective in separating individual gases from a gas
mixture diffusing through them, other materials are equally efficient in
separating the components of a liquid mixture. In all these cases, the
process of separation is related to the different rates at which different
gases or liquids diffuse through the material. Materials that have the
property of separating individual components from a gas or a liquid mixture
are commonly referred to as membranes.
A variety of natural and artificial materials commonly
available in the market have properties that make them ideally suitable for a
variety of applications for industrial, chemical, medical, biological.
pharmaceutical, commercial and research purposes (1-4). Practical
applications of membranes are far too numerous to be listed here.- Suffice to
say that were it not for the properties of some biomacromolecules. that play a
fundamental role in the diffusion of ions through living cells, biological
systems would cease to exist. Some membrane materials are also useful in
filtration and reverse osmosis processes.
In addition to a number of natural chemical compounds, a
wide range of artificially produced materials, such as polymers, are
potentially useful in a variety of separation applications. Included In this
group of materials are silicone and hydrocarbon rubbers, polyethylenes.
polypropylenes, polystyrenes, polysulfones. polycarbonates, polyesters,
pblyamides. and epoxies. to name but a few materials. The usefulness of some
of these complex organic compounds is not restricted to their partial or total
permeability to a given gas or liquid, i.e., fluid, or their different
permeability to different fluids. Equally important in many applications is
their very low. or even total lack of permeability to a particular type of

fluid. Materials with very low permeability characteristics to some
particular fluid or group of fluids are usually referred to as ’barriers’.
Clearly, the basic difference between a ’membrane’ and a ’barrier’ resides in
their degree of permeability Co a given fluid or group of fluids. .Both types
of materials are equally important in the context of this report.
In this report, the permeability characteristics of a
977number of common and rather specialized materials to radon ( Rn) are
investigated. Permeability data are of interest in the design of effective
^^n emissions from, say, underground mine cavities. Because Rn is a
naturally occurring radioactive gas whose -r-ray emitting progeny can interfere
with the detection of neutrinos, the present study is of interest to the
Sudbury Neutrino Observatory (SNO) which is to be built and operated in the
Creighton Mine (Inco Ltd.), Ontario.
THEORETICAL BACKGROUND
The diffusion of gases through solids is governed by the
first and second Pick’s Law of Diffusion. The penetration of gases into and
through solids, such as polymer membranes and other materials, by pure
diffusive phenomena represents an idealized case. In actual practice.
transport phenomena caused by pressure and temperature differentials between
opposite sides of the material, as well as airflow, can significantly affect
the penetration and penetration rate of gases into the solid.
In this work, processes other than diffusion will be
ignored although frequent reference to experimental difficulties and practical
aspects of the work will be made. But even in this simplified scheme, pure
diffusive phenomena can be very complex. With regard to the gas/membrane
system there are a number of cases of great practical interest:
1. The gas is-chemically inert, and is, in addition, a stable isotope, i.e.,
it neither reacts chemically with the membrane or decays by radioactive

processes;
2. The gas is chemically active (it reacts chemically with the membrane) but.
is a stable isotope;
3. The gas is chemically inactive with regards to the membrane, but is not a
stable isotope;
4. The gas reacts chemically with the membrane, and, in addition, is not a
stable isotope.
In the above cases it has been tacitly assumed that the
membrane contains no radioactive isotopes, in other words, it is not a
radioactive source itself. However, this is frequently not the case, e.g..
most materials contain measurable amounts of ^Ra which in turn decays into
222?^ ^g radioactive gas we are mainly interested in here.
The diffusion of a gas through a thin solid material such
as a membrane can be described by the following expressions:
J - -SDOC/az)^_o W
QC/91 =. DCa^/Bz2) - KC + 4> <2)
q(t) - JS ^^dt (3)
Equations 1 and 2 are the first and second Fick’s Laws of
diffusion, respectively. The meaning of the symbols used are as follows:
J is the flux density of gas through the material (membrane).
D is the diffusion coefficient of the gas in the material,
S is the surface area of the material.
C is the concentration of gas in the material.
z is the coordinate, i.e.. distance from an arbitrary origin.
4> is the radioactive source term of the material, i.e.. the rate of
production of radioactive gas in the membrane.
K is the quantity that characterizes chemical reactions taking place
between the gas and the membrane, as well as the radioactive decay of
the gas. \, diffusing through the membrane,

q(t) is the quantity of gas passing through the membrane.
In the more general case. the quantity K can be written:
K - k^+A (4)
where, kp is the reaction constant for the first-order chemical process, and \
is the radioactive decay constant of the gas diffusing through the membrane.
In the case investigated in this work, a number of
simplifications can be introduced:
999 990A. Because of the relatively high chemical inertness of Rn and Rn (5),
one can safely assume for our particular case: kn - 0. Hence, K - \’,
B. In general, the ^^Ra content in the membrane materials is quite low, and
999hence, it mainly results in the production of some additional Rn which
will diffuse through the membrane resulting in small contributions to the
total Rn concentration measured at the opposite side of the membrane
0 0 /
(see experimental procedure). The same reasoning applies to Ra in the
9 9 nmembrane and its decay into Rn. However, the problem becomes more
complex if the diffusion of a radioactive gas is measured in a membrane
containing a radioisotope which upon decay produces a radioactive gas
99/t. 99?different from the one being measured, e.g., -�Ra when measuring Rn,
or ^Ra when measuring ^Rn. As we shall see, the conditions of the
experiment can be set to reduce the contribution(s) discussed here to a
negligible amount. Under these conditions, one can safely set: ^ - 0.
(Note: it is assumed that the radioactive source does not induce material
damage thereby changing the characteristics of the membrane.)
Taking the above discussion into account, i.e., items A and
B, our case reduces to solving the situation depicted in item 3, and Equation
2 reduces to:
ac/3t - D^C/Sz2) - AC (5)
Expressions 1, 3 and 5 can be solved using the standard
methods of mathematical physics (6,7) and Figure 1 (which shows the geometry

of the problem), taking into account the boundary conditions:
C(0,t) - 0 , C(6.t) - CQ . C(z.o) - 0 (6)
where 6 is the thickness of the membrane. The symbol C^ is used to denote
the concentration of ^^n (or ^^n) ’outside’ the membrane. This
concentration is assumed to remain constant during the measurements and
experiment (see Figure 1 and Experimental Procedure).
With the above in mind, it can be shown that the
concentration distribution across the membrane of thickness 6 with time t,
i.e.. C(z,t), is given by (8):
C(z t) - c^- + 2COA ^ (-l^ sin(nffz/6)
^ . g^"2^^]6 ff n"1 n^B + A)
.^ ^ ^ sin(n^) e-^^)t <7)w n-1 n
where, in Equation 7 the quantity B is given by:
o 9B - ^D/^
’5*5^ 970The flux density, J, i.e., number of atoms (""Rn or Rn)
crossing the membrane of surface area A at a point z-0 (see Figure 1) per unit
time can be calculated by substituting Equation 7 into Equation 1:
J(t) - -DA(5C/az)^_Q
-DA-^ [1+2 ^ (.l)n e-^B+^tS n-1
+2A ^ i^ (1 - e-^2^)^] (8)
n-1 i^B+A
The total number of atoms crossing the membrane in time t,
i.e.. q(t), can be calculated substituting Equation 8 into Equation 3. After
some algebraic manipulations the result is:

q(t) - J^ J(t) dt - -Aj^ DOC/3z)^o dt
DA C.’ al/ �n" (’r^R+I’lf-���2[t + 2 2i-^- (1 - e-^ &+x)t]8n-1n^+A
CO
+ 2At 2n"1 n^+A
. 2A I (-^ (1 - e-^23^)n"1 (n^+A)2
(9)
Under steady-state conditions, i.e., conditions at t^".
Equation 8 becomes:
^^-^-^[l^A 2 ^] <10)6 n-1 n^+A
Equation 9 on the other hand indicates that q(t) is
composed of a linear part and an exponential contribution. For sufficiently
large values of t, i.e., t-fi the exponential term becomes very small, i.e.,
^e^B^t
and Equation 9 reduces to:.
DA C- <0/ i\n
co/ i\n
co/ 1^n , (11)
q(t^) - q. - ���� [t + 2 2 i-i^- + 2At 2 i-1^- - 2At 2 < ^ 1 (n)6 n"1 n2B+A n"1 n2B+A n�:l� (n^B+A)2
Equation 11 shows the linear growth of q(t). For a time
t-0 at which q(t)-0. Equation 11 becomes:
ee[l . 2> 2 i-l^l - 2X 2 -C^ - 2 ^^ ^12)
n-1 n2B+A n-1 (n2B+A)2 n-1 n^+A
But it can easily be shown that the right hand side (rhs) of Equation 12 is:
rhs - 2 ^ ^ n2B a3)n"1 (n2B+A)2
From Equations 12 and 13 the time 9 at which q(t)-0, i.e.,

intercepts the time axis, can be calculated:
CO _ ^2 2 (-D ^B
6- n^I (n^.)2 (14)
�����co (-1)^1 + 2A 2 -"-"-
n-1 n^B+A
The quantity 6, is called the time-lag and can be
A f\
calculated from experiment (see Figure 2). Since B - ff"D/$ , and \ and 6 are
known or can be measured, Equation 14 can be used to calculate D during the
early phase of the diffusion process, i.e.. linear growth as opposed to
measurement at steady-state conditions, i.e., t-°o.
It is easy to show that Equation 14 reduces to the well
known (simple) time-lag expression for a stable diffusing gas (3.9). For the
case of A-0 (stable gas), Equation 14 becomes:
9(A-0) - (2$2/A) ^ (-D^n2 <15^n-1
The summation term S (-D^n2 can be calculated using the
n-1
summation of series general expression:
(l/l2P) - (1/2^) + (1/3^) - (I/A2?) + ....
(2P-1-!) ^ ^(2p)!
(16)
where. B is the Bernoulli’s number of index p. Equation 16 applies to
Equation 15 for p-1 for which Bp - B^ - 1/6. Hence:
S (-D^n2 - ff2/^ and.n-1
e(A-O) - ^/CD <17)
Equation 17 is identical to the expression given for the
stable isotope case given by several authors (3,9).
As previously indicated, Equation 14 can be used to
calculate D from graphical analysis of the data. Likewise, Equation 10 can be
used to determine D although the procedure is somewhat more involved.
The theory presented above is readily applicable to the
case for which the following boundary condition is satisfied: C(x-O) - 0 at
t>0 (see Equation 6 and the geometry of the arrangement shown in Figure 1).
This is the case for which the flow ,of radioactive gas through the membrane
occurs under the maximum concentration gradient (6C/fiz - (C^-0)/(5-0))
possible. In other words, when the concentration of radioactive gas in the
receiver volume, Vn (the volume downstream of the membrane where the
radioactive gas is ’collected’) is negligible compared with C^, the
concentration upstream of the membrane. This conditions is met when V^ is
large, or when the diffusion coefficient, D, of the radioactive gas in the
membrane material is very small, or both.
When the condition C(x-0)>0 at t>0 is met rather than the
condition previously indicated above, the theory describing the diffusion
process requires some modification and a different theoretical approach has
been developed and applied (10). This condition applies to the case of
membranes with moderate and high diffusion coefficients through which the
radioactive gas diffuses into a well-stirred small receiver volume, V^. Under
these experimental conditions, C(x-O) at t>0 represents the actual
concentration of radioactive gas in V^. namely. C(V^) - C(x-O) at t>0.
In the remainder of this section, a different theoretical
approach to the diffusion of a radioactive gas through membranes is presented.
This theory, although somewhat less rigorous than the one discussed above and
the one described elsewhere (10) is simpler experimentally and analytically.
The theoretical approach described here has been discussed elsewhere (11). and

has been used at our Laboratory in conjunction with a multisensor apparatus
222 220which was designed and developed for comparative membrane Rn and Rn
permeability studies (12).
With the geometry sketched in Figure 3 with a source of N^
atoms of ^Rn or ^Rn in volume V^, i.e., the radioactive gas reservoir,
separated from the sensitive volume. V^. of a ^Rn (^Rn) gas monitor by a
membrane of thickness 5, surface area A. and permeability k, one may write the
kinetic equations describing the gas diffusion process as follows:
dN^/dt - -AN^ + ^ - QN^/V^ - (kA/6V^) (N^ - N3) (18)
i
and,
dN^/dt - -AN2 + (kA/fiV^) (N^ - N3) (19)
where,
No is the number of atoms of ^Rn or ^Rn in volume V^.
4> is the production rate of ^Rn or ^Rn in volume v^.
^ r/7<’r^<it, (, 1,’h,Q is the airflow rate in volume V^,
~
’-
222 220\ is the radioactive decay constant of Rn or Rn.
The first, third, and fourth terms on the right hand side
of Equation 18 describe, respectively, the removal of the radioactive gas in
volume Vi by radioactive decay, mechanical (forced) ventilation, or airflow.
and diffusion through the membrane. The first and second terms on the right
hand side of Equation 19 describe, respectively, the removal of radioactive
gas in Vn by radioactive decay, and the increase in gas concentration in the
same volume by diffusion of gas from Vi through the membrane.
Equations 18 and 19 can be rearranged as follows:
(dNp/dt) + MN^ - ^ + SN^, and.
(20)
(dN^/dt) + PN^ - TN^ (21)
where,
M - A + (kA/6V^). A - \ + (Q/Vp (22)
S - kA/5Vp P - > + (kA/fiV^), T - kA/6V^ (23)

10
However., as soon as the radioactive gas starts diffusing
from Vi into the sensitive volume, Vp , of the membrane and detector
arrangement, it immediately starts decaying into its short-lived decay
products (progeny). The rate of growth of these radioactive products can be
expressed as follows:
dNj/dt - N^ \^,^ - N^ (24)
oio 0 1 A
where the index i in the above expression refers to Po, Po and
^BK^Po) for the ^Rn progeny, and ^Po. ^Pb, ^Bi and ^Po for the
^Rn progeny. The index i-1 refers to the parent products of the decay
779 718product i, i.e., Rn for Po, and so on.
The solution to Equation 21 can be simplified as in our
case dN./dt - 0 for the ^^Rn concentration in V^. (The reader should be
aware that experiments have been conducted in a large radioactivity-controlled
Radon/Thoron Test Facility (RTTF) of the walk-in type. Hence, steady-state
conditions are easily attained.)
After some algebraic manipulation, and taking into account
the boundary conditions:
N^(t-O) - N^. ^(t-O) - 0
it is easy to show that:
N3 - (E/K) (l-e’^) (25)
where.
E - ^T/M and K - P -(ST/M) (26)
Correspondingly more complex expressions are obtained from
Equation 24 for N^, as shown elsewhere (13.14). It can be shown that the
activities N^A and N^ in V^ reduce to a constant value A(E/K) for large
values of t (13,14). The ratio E/K is given, after some algebraic
manipulation, by:
E/K-^ 1 (27)A 1 + (M) (!2)
k A

11
If an d-particle detector of geometrical a-counting
efficiency c in a given volume, i.e., V^, is used, the a-count rate recorded
by the detector. N^, is given by:
N^ - e(N^ + S^N^) - n(E/K) (28)
where the symbol 0 represents a proportionality factor which depends on e and
other variables.
Equations 27 and 28 can be used to determine the
permeability k. This is most readily done by comparing data. i.e.. o-particle
count, obtained with two ^Rn gas monitors, one covered with the membrane of
interest and the other covered with a porous material of sufficiently high
permeability to allow free passage of the radioactive gas while still removing
its decay products. Under steady-state conditions, i.e., for Kt»l it is easy
to show from Equations 27 and 28 that:
N /N R- - 1 (29)^am/"Qp ^m.p u
1 + (M) (^)k A
Hence, from Equation 29, one obtains k:
� - ^where, y R^p/(l - R^p) (31)
The approach discussed above has the advantage that only measurements
under steady-state conditions, i.e., t-<° for which dN^/dt - 0, need to be
accurate. This considerably simplifies the experimental procedure and reduces
man-power requirements. However, it also has some drawbacks, namely:
1. The exposure time necessary to attain steady-state conditions in V^ may
take several days depending on k. This requires a highly stable reservoir
of ^Rn or ^Rn;
2. Equations 18 and 19 are only approximate because the terms kA(N^-N^)/6V^
and kA(Ni-No)/5V5 assume that a steady-state is instantaneously
12
established across the membrane for a given concentration gradient. This
assumption is only satisfied if the diffusion length DL - (D/A)-/2 and the
n
time-lag 9 - 6 /6D Tihtaii satisfy the following requirements:
DL>>5 and 8«0.693/A (32)
For ^Rn. the inequality 9«0.693/A can be rewritten as
Q«3.82 d. This conditions is fairly easy to verify from experimental values
of 8 obtained by graphical analysis of the data. If the condition '<<3.82 d
is met, Equation 17 (which applies for the stable isotope case, i.e.. A-0) can
be used to calculate D. With this tentative value of D, the diffusion length
DL - (D/A) / can be calculated and the condition DL>>5 can be checked. (One
way of meeting the requirement DL>>5 is by reducing (choosing) the thickness
of the membrane under consideration, accordingly. However, this is not always
possible or practical.) If both conditions indicated by Equation 32 are met,
the simplified version for the time-lag can be used to calculate D instead of
the much more complex expression given by Equation 14.
It should be noted that the diffusion ’constant’ D, and the
permeability, k, of a membrane are related by the simple expression:
k - sD (33)
where, s is the solubility of the membrane.
The solubility of the membrane can be written as:
s - c(f)»? (34)
where, c(f) is a conversion factor, and »y Is a dimensionless ratio which
stands for the concentration of gas Inside the pores of the solid (membrane)
to the concentration of gas outside the solid. If the pressure of the gas
outside the material Is the same as the pressure inside, the quantity T) Is^the
same as the porosity of the medium, provided that the gas Inside the pores in
the solid behave like an Ideal gas.

13
EXPERIMENTAL APPARATUS AND PROCEDURE
f)f)f)
The diffusion characteristics of Rn through membranes
was studied by means of ^^Rn monitors of the passive kind using a solid-state
detector of the diffused-junction (DJ) type in conjunction with its associated
preamplifier/amplifier system and other electronic circuitry. The detector
and associated electronic circuitry are located in a stainless steel
cylindrically-shaped case (34 cm long. 5 cm outer diameter). The DJ detector
is located about 8 cm from the open end of the stainless steel case, thereby
providing a well defined volume. i.e.,-V^ (see Equations 18 and 19). The DJ
detector is protected by an aluminized mylar sheet covering the detector. A
(removable) plastic grid located at about 2 cm from the open end of the case
protects the detector against accidental damage.
Because meteorological variables play an important role in
gas diffusion and transport processes, sensors Co monitor barometric pressure
(P), temperature (T), air velocity (v) and direction, and relative humidity
r) o o 222(RH), were also used in conjunction with the "--Rn monitors. The Rn
monitors and the meteorological sensors were interfaced to a data logger with
programmable sampling time from 1 min to 999 min in steps of 1 min. Digital
output sensors {222Rn monitors) could be programmed independently of analog
r\ ft r\
sensors (meteorological sensors). A total of 12 "-"Rn monitors and 8 analog
sensors could be logged into the data logger. Data were printed in ’real-
time’ and stored in a personal computer (PC) for further graphical and
statistical analysis.
Samples of the membranes of interest were cut in a circular
shape and sandwiched tightly between two circular flanges. One flange was
attached to the end of the steel case housing the DJ detector and its
associated electronic circuitry. The other flange was free. The two flanges
were brought together by means of threaded screws, nuts and washers thus
providing a leak free seal when the membrane was in place.
14
All the Rn monitors were used simultaneously with
different types of membranes except for one monitor which was used with glass
999fibre (GF) filter material as the reference Rn monitor. The GF material
f\ r\ e\ 997was used to remove Rn progeny while still allowing Rn to diffuse through
it easily.
999The Rn monitors, the meteorological sensors and the data
logger are manufactured by Alpha -NUCLEAR (Toronto) and are known under the
999following commercial names: model 601 ( Rn monitor); model 604 (P sensor);
model 602 (air T probe); model DS 608 (dew point sensor); and model 650
(data logger). In this series of measurements a modified version of the
experimental apparatus shown in Figure 4 was used (12).
Measurements were conducted in a large Radon/Thoron Test
Facility (RTTF) of the walk-in type. The data logger and computer system were
999located outside the RTTF, whereas the Rn monitor and meteorological sensors
were placed inside it and connected to the data logger and computer system via
signal cables running through one of the test facility walls. The sampling
time was set at 1 h for most cases, depending on the type of membranes used,
999 999and the Rn concentration. At a given time the Rn monitors were
introduced into the RTTF where they were connected to their corresponding
signal cables, and measurements began. The increase In a-particle activity as
determined by the Rn monitors versus time was followed until steady-state
conditions were attained. A careful record of meteorological data was kept.
Because of differences in DJ detector efficiency to a-
999particles and electronic circuitry characteristics, the �~Rn monitors used in
membrane permeability measurements were often calibrated in order to correct
for differences in ^Rn monitor sensitivity. Calibrations were carried out
using glass fibre (GF) filter material as the ’membrane reference’ material in
the Rn monitors, which were all exposed simultaneously to identical
environmental conditions of Rn concentration. T, P, and RH. The data were

15
97?
used to calculate the calibration factor (CF) for each Rn monitor in
cph/pCiL’1 and cph/Bqm’3. where cph stands for counts per hour.
After background (B) and sensitivity (CF) corrections were
000
applied to the a-count rate obtained by each "--Rn monitor, the data were used
in the fashion indicated in Equation 30 in order to calculate k for each
membrane.
The obvious advantage of using a multisensor apparatus,
such as the one described here. is clear. First, it allows simultaneous
determination of the permeability (k) and diffusion coefficient (D) of several
membranes to the same radioactive gas, thereby minimizing the errors
associated with the more conventional method whereby one membrane is measured
at a time. Second, it relaxes certain restrictions regarding the constancy
and degree of accuracy with which the radioactive gas concentration should be
known, and maintained, during experimentation. Third, it provides a rapid
means of comparing the characteristics of several materials with minimum
effort.
EXPERIMENTAL RESULTS AND DISCUSSION
A summary of the experimental results obtained is given in
Tables 1 and 2. Figure 2 shows a typical run where the normalized a-particle
count rate has been plotted versus the time elapsed from the tine the
diffusibility experiment began. The data have been somewhat smoothed out for
clarity of presentation. The y-axis (normalized count rate, dimensionless
quantity) represents the ratio of the ^Rn concentration [^Rn], measured in
the volume V^(m) (see Equations 18 and 19) enclosed by the membrane under
investigation, to the [^Rn] measured in V^GF) enclosed by the reference
material, i.e., glass fibre filter (GF). In our ease, V^dn) - V^GF), where m
stands for membrane. The square brackets are used to indicate concentration.
The [^Rn] is measured in each case by the DJ detector enclosed in V^ in the

J.O
’a-meters’, i.e.. 222Rn monitors calibrated prior to any diffusion experiment
in a known ^Rn concentration atmosphere, which is accurately measured by the
Two Filter Tube (2FT) method (15.16). and by scintillation cells calibrated
using a traceable ^Rn standard source. Figure 2 is typical of these types
999
of experiments, and is composed of three parts: a) a slow increase in [ Rn]
at the start until ^Rn ’break-through’ of the gas in the membrane is
attained; b) a linear increase in [^Rn] ; c) a steady-state condition
attained when the rate of ^Rn diffusing through the membrane into V^ equals
the rate of decay of ^Rn already in V^. Curves like Figure 2 are used to
determine graphically the time-lag. 6 <see Equations 14 and 17), from which
the diffusion coefficient. D. can be calculated. This procedure and its
result for a typical case will be illustrated below.
Figure 5 shows an example of a typical run in which the
response of an epoxy membrane (lower trace) is compared with the response for
the reference material (GF) , upper trace. The a-partlcle count-rate
fluctuations are partly due to the statistics of counting, and to the
following factors:
1. Barometric pressure variations;
2. Airflow rate fluctuations in the Radon/Thoron Test Facility (RTTF) where
the measurements are carried out (see the variable Q in Equation 18);
3. Air turbulence in the RTTF caused by mixing fans of the ’rotating’ type
’709whose operation is important for adequate ��Rn air mixing, and hence, to
produce a uniform and isotropic [^Rn] throughout V^. i.e.. the volume of
the RTTF.
It should be noted that when V^ is enclosed by the
membrane, the air in V^ is essentially ’trapped’ at the ambient pressure
prevailing at the time this operation takes place. Subsequent barometric
pressure (P) variations induce pressure differentials, AP. between the two
999sides of the membrane, thereby causing in-flow or out-flow of Rn through
17
the membrane material by convective transport mechanisms. The operation of
the fan(s) also causes potentially strong disturbances, on the outer side of
the membrane, namely, positive pressure when the fan is pointing at the
membrane and a negative pressure when it is pointing away from the membrane.
This causes strong air currents and pressure differentials which encourage
convective transport of ^Rn through the membrane.
The contribution to the flow of ^Rn through materials
from convective transport mechanisms is rather complex and beyond the scope of
this report, particularly when variable pressure perturbations are externally
imposed on pure diffusion processes. The effects caused by the above
perturbations depend a great deal on the diffusion coefficient and
permeability of the material. The effect will be considerably accentuated if
’microscopic’ pinholes. i.e.. mechanical defects in the material are present.
It is not difficult to realize that the effect of items 1
to 3. combined with statistics of counting, can easily account for the or-
particle count rate fluctuations observed during some of the experiments.
Table 1 presents permeability, k, data for a variety of
materials. Also shown in the Cable are the values measured for the thickness
of the different materials investigated. The data represent the result of
nine independent experiments. Each experiment consisted of measuring the
permeability of several materials at the same time. When possible, the
materials are identified according to their commercial name. If the latter
was not known, various means of identification were used according to what was
known about the material. A quick glance at Table 1 suggests that the
materials investigated fall into four groups or categories, namely:
1. Low permeability : k <1.0xl0’9 cn^s’1
2. Medium permeability : l.OxlO’7 cmV1 >k >1.0xl0’8 cm^’1
3. High permeability : k >1.0xl0’6 cn^s’1222
4. Very high permeability : i.e., ’transparent’ to Rn.
18
The values assigned to k, according to the permeability
classification given above, are totally arbitrary and only meant to bring to
the attention of the reader the broad range of experimental values found for k
for the several materials (-20) investigated. In terms of performance,
Q 91 227materials with k <1.0xl0 cm s can be considered good barriers to Rn.
299i.e.. diffusion of Rn through these materials is totally impeded. The
material with the lowest permeability measured was that of Kapton-Polyamide
film, for which k -9.5xl0’10 cn^s"1. Materials with k in the range l.OxlO’7f\ i R 9 1
cm s" to 1.0x10" cm s" are fairly good barriers, i.e.. they only allow a
999small fraction of the -�Rn to diffuse through. The best materials in this
permeability range are listed (in no particular order) below:
1. Epoxy resins (manufactured by BMS Mfg. Inc., trade mark Oxyguard):
k -3.5xl0’8 cn^s’1;^FM
2. MIROC (a polyurethane-based material manufactured by URYLON ):
k -3.0xl0’8 cmV1;
3.’ Saranex (commercial name, manufactured by Dow Canada, material used for
wrapping foods):
k - 3.7xl0’8 cii^s’1;
4. "Anti-thoron" membrane (obtained from Terradex, U.S.A.. a commercial firm
specializing in track etch nuclear measurements):
k -7.9xl0"8 cmV1;
5. Coated polyester (obtained from 3M):
k -5.3x 10’8 cn^’1;
6. Saran wrap (commercial name. material used for wrapping foods; high
density polyethelene):
k -l.OxlO’8 cii^s’1;
7. Aluminized mylar:
k -5.2xl0"8 cii^s’1;
8. Freezer bags (manufactured by Glad, commercial firm):

19
k -7.8xl0*8 cii^s’1;
9. Mylar (manufactured by DuPont):
k -1.6xl0’8 cn^s’1;
10. Aluminum foil (identified as Foil - Stuart House):
k -4.6xl0’8 cii^s’1;
Materials of permeability significantly higher than
n r\ rt
1.0x10’^ cm^s’^ can be used in general as membranes through which Rn can
diffuse relatively easily while acting as a water vapour barrier. This is a
very attractive feature with special application in instrumentation designed
for assaying Rn by passive methods.
Materials that allow ^Rn to diffuse freely through them
while removing its decay products are in the context of this research of
particular use as ’reference’ materials. Some of these materials include
’porous* polyurethanes, and filter materials such as cellulose acetates and
nitrates and glass fibre (GF). The latter material (GF) has been used
extensively here as the reference material -in order to calculate k by the
simplified method described in this work (see Equation 30). It should be
noted, however, that the same experimental data obtained in this work can be
used in conjunction with other theoretical approaches in order to obtain the
diffusion coefficient. D. This will be shown in a forthcoming report.
It has been indicated above that in order for the
simplified theoretical approach (Equations 18 to 31) to be applicable to a
radioactive gas such as ^Rn, the following two conditions must be met:
6 � 52/6D«0.693/A. and DL - (D/A)172^ (32)
Time-lag (G) analyses of the samples (see for example
Figure 2 which will be discussed below) show that Q <30 h, whereas 0.693/A -3.82 d -92 h. Hence, the first condition (left hand side of Equation 32) is
satisfied. The second condition (right hand side of Equation 32) can only be
approximately tested because the diffusion coefficient. D. is not obtained

20
directly from the procedure used here. However, setting D ~k, an approximate
value for the diffusion length (DL) can be obtained (see Table 2) . It can be
seen that the condition DL «S is amply satisfied for all the materials
investigated here, except for the thicker samples of MIROC where this
condition is marginally met. From the above, one may surmise that the
simplified procedure used here is satisfied.
Finally, the time-lag graphical method is illustrated in
^Figure 2 for an epoxy resin membrane (5 - 6x10" cm). Extrapolation of the
linear part of the figure gives: 9 -26 h.
Hence:
D - ^ - (6xl0-2)2 . e.^io-9 cmV166 6x26x3600
Similarly, application of the more elaborated theory
outlined here (see Equation 14) gives D -5.9xl0’9 cn^s’1. Taking the average
value for the diffusion coefficient obtained by the two methods, namely.
D -6.1xl0’9 cD^s’1, the solubility of the material can be calculated from the
simple relationship: k -SD. Hence, s - k/D-5, where as calculated above
(Table 1), k -3.5xl0’8 cn^s’1. As will be shown elsewhere, the solubility of
the material can be obtained more directly from the intercept of the linear
222part of the figure with the y-axis of the graph (i.e., ’normalized* Rn
concentration in V^).
EXPERIMENTAL DIFFICULTIES
Although conceptually very simple, the measurement of k and
D is complicated by a number of factors the experimenter should be aware of.
Experimental difficulties encountered can be divided broadly into the
following categories:
1. Radioactivity measurements;
2. Membrane manufacture;
3. Measurement of some characteristics of membranes;

21
4. Verification of the ’physical’ integrity of the membrane.
Items 1 to 4 will be discussed briefly below.
For low permeability materials, the o-particle count
measured by the detector, i.e., [^Rn] in V^ may be very low. depending on k
or D, and not much different from the background of the detector and its
associated electronic circuitry. Hence, counting statistics become an
important consideration, and the accuracy of the results are usually subject
to great uncertainty.
The physical and chemical characteristics of a given
material may not only vary with time but with manufacturer and details of the
manufacturing process. Hence, materials measured at different times may give
different results. This is not unusual for materials that ’age’, e.g.. their
characteristics deteriorate under exposure to the UV-component of light.
The precise measurement of S (thickness of the material) is
important in the calculation of k (see Equation 30). Measurement of S becomes
increasingly difficult as the thickness of the material decreases.
Furthermore, lack of thickness uniformity, a common problem, becomes much more
pronounced as 6 diminishes.
Verification of the physical integrity of materials used in
diffusion studies, and the like, is very difficult. The presence of
’pinholes’, microfractures and structural defects (invisible to the naked eye)
arising in the manufacturing and handling processes can have a great influence
in permeability measurements. This problem is frequently overlooked and might
explain some ’conflicting’ results reported in the literature.
As previously pointed out. another difficulty that
complicates permeability experiments Is the variability of certain
environmental factors during measurements, such as barometric pressure and
temperature, as well as the airflow rate (Q) and [^Ru] In the ’source’
volume. Vrt (see Equations 18 and 19).

22
In view of the above discussion, it is not at all
surprising that measurements with the same material conducted at different
times, or different samples of the same material measured at the same time,
can give results ranging from close agreement to varying by a factor of two.
or more.
CONCLUSIONS
The data presented in this report suggest that some of the
n f\ f\
materials investigated here have permeabilities to Rn low enough to be
suitable as ^^Rn barriers in applications of practical interest such as wall-
cover materials in the Sudbury Neutrino Observatory (SNO) Project. However,
because of severe mechanical constraints not all materials of low permeability
to ^^Rn are suitable as ^^Rn barriers in the SNO Project. Barrier materials
for this specific purpose must meet some basic mechanical requirements such as
great resistance to mechanical impact and great mechanical flexibility.
Hence, only materials of low permeability that do not easily break, crack,
rupture, fissure or develop pinholes are truly suitable for use in conjunction
with the SNO Project. These requirements rule out virtually all the materials
tested except for the epoxy ’membranes’ and MIROC. These materials have
permeabilities of the order of -3.0x10" cm s" . Because of their relevance
in the context of the SNO Project, the properties of the materials will be
further investigated and reported in a forthcoming report.
ACKNOWLEDGEMENT
The authors are grateful to Dr. J. Archibald (Dept. of
Mining Engineering, Queen’s University) for allowing one of us (JB) to
reproduce the results of permeability studies conducted on MIROC. The above
work is part of a collaborative effort between Dr. Archibald and one of us (J.
Bigu).

23
REFERENCES
1. Lundstrom, J . E. and Bearman, R.J., "Inert gas permeation through
homopolymer membranes"; J. Polymer Sci., vol. 17, pp. 97-114. 1974.
2. Heni-s, M.S. and Tripodi. M.K. , "The developing technology of gas
separating membranes"; Science, vol. 220, pp. 11-17. 1983.
3. Paul. D.R. and DiBenedetto, A.T., "Diffusion in amorphous polymers"; J.
of Polymer Sci. Part C, No. 10. pp. 17-44, 1965.
4. van Amerongen, G.J., "Diffusion in elastomers", in Rubber Chemistry and
Technology, pp. 1067-1152.
5. Stein, L., "Chemical properties of radon", in Radon and Its Decay Products
- Occurrence, Properties, and Health Effects (P.K. Hopke, Ed.), pp. 240-
251, American Chemical Society Series 331. Washington, D.C., 1987.
6. Morse. P.M. and Feshbach. H., "Methods of Theoretical Physics, vol. 1 and
2.. McGraw Hill Book Company, New York, 1953.
7. Ayres, F., "Differential Equations", Schaum’s Outline Series. McGraw Hill
Book Company. New York. 1952.
8. Bekman. I.N. , "Experimental studies of radioactive gas diffusion in
solids. II. Evaluation of radioactive decay and growth in the penetrance
method"; Soviet Radiochemistry, vol. 23, No. 2, pp. 221-227, 1981.
9. Crank. J.. "The Mathematics of Diffusion"; Clarendon Press, Oxford. 2nd
Edition, 1975.
10. Bigu, J., Report in preparation and unpublished data.
11. Ward III, W.J., Fleischer, R.L. and Mogro-Campero. A., "Barrier techniques
for separate measurements of radon isotopes"; Rev. Set. lustrum, vol. 48,
pp. 1140-1441. 1977.
12. Bigu, J. , "An automated multisensor apparatus for comparative membrane
radon and thoron permeability studies"; Nuclear Instruments and Methods

24
in Physics Research, vol. A251, pp. 366-373. 1986
13. Bigu, J., "Theory and application of radon and thoron progeny monitoring
under steady-state and non steady-state radiation conditions. Part II:
passive sampling"; Division Report MRP/MRL 85-91(J), CANMET, Energy.
Mines and Resources Canada, 1985.
14. Bigu, J., "Theory of diffusion of radon and thoron through membranes under
steady-state and time-dependent radiation conditions - parts I and II";
Division Reports MRP/MRL 85-51(TR) Part I, and MRP/MRL 85-52(TR) Part II.
CANMET, Energy, Mines and Resources Canada. 1985.
15. Thomas, J.W. and LeClare. P.C. , "A study of the two-filter method for
radon-222"; Health Phys. vol. 18, pp. 113-122. 1970.
16. Mayya, Y.S. and Kotrappa, P. , "Modified double filter method for the
measurement of radon or thoron in air"; Ann. Occup. Hyg. , vol. 21, pp.
169-176, 1978.

25
222,Table I - Permeability of several materials to Rn
Material
Saranex
Polystyrene
Rubber
Plasticsheeting
Transparency
Transalloy
Teflon
"Anti-thoron"membrane
Rubber
Polyester
Polyester
"Yellowmembrane"
Polyamide
Saran Wrap’*’Gelman Zefluor
Aluminizedmylar
Glad Wrap4"*’Glad freezerbags
Mylar
Al-foil
MIROC 1
MIROC II
MIROC III
EPOXY I
EPOXY II*
EPOXY III
EPOXY IV’1’
Thickness(5)(cm)
4.0x10"32.6xl0’22.3xl0’22.3xl0’2
pale blue
l.OxlO’22.6xl0’26.1xl0’35.6xl0’3
2.5xl0’25.9xl0’35.3xl0’38.8xl0’3
7.0xl0’41.3xl0’3l.lxlO’2l.OxlO’3
I.4xl0’33.5x10"3
9.0xl0’42.1xl0’37.9xl0’2
11.4x10’216.5x10�22.5xl0’24.9xl0’25.9xl0’22.7xl0"2
Permeability
w^(cn/s-1)
3.7xl0’81.3xl0’6
>1.0xl0’4l.OxlO’6
4.0xl0’71.5xl0’63.5xl0’77.9xl0’8
1.5xl0’52.3xl0"75.3xl0’82.1xl0’7
9.5x10⁻¹⁰l.lxlO’8
>1.0xl0’45.2xl0’8
1.7xl0’77.8xl0’8
1.6xl0’84.6xl0’83.1xl0’8
3.7xl0’84.3xl0’83.5xl0’81.2xl0’73.5xl0’84.5xl0’6
Remarks Manufacturer
Dow Canada
Transilwrap of Canada
Surgical glove From dental practice
Transparent From Canadian Tire Corp
Xerox
Transilvrap of Canada
DuPont
From Terradex
Chase-Valton Elastomers Ltd,
White 3M
Coated 3M
Yellow From Terradex
Kapton ?
From Supermarket ?
Gelman Sciences Inc.
From a-NUCLEAR
From Supermarket 7
n n ?
� DuPont
From Supermarket From Stuart House
Non-uniform URYLON Canadathickness
t. 1 "
n n n
BMS Mfg. Inc.
n " n n
n n " "
it 11 " *’
*Pinholes suspected; + High density polyethylene; ++ Low density polyethylene.
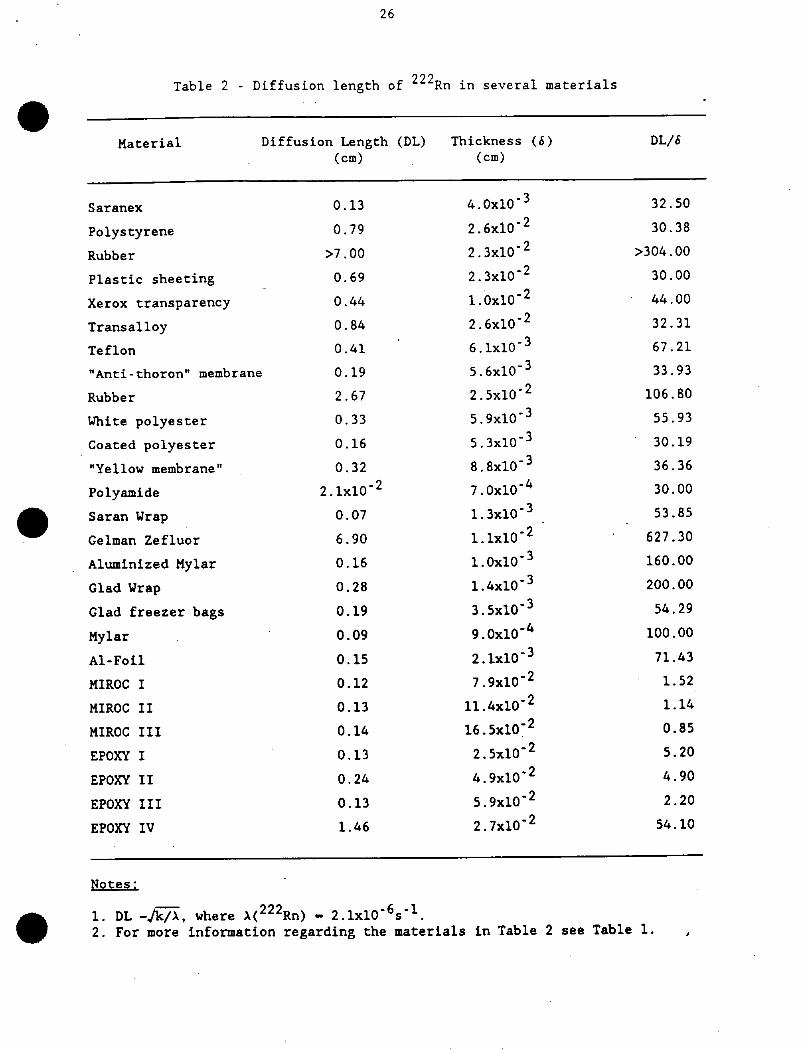
26
f)r)r)Table 2 - Diffusion length of ""Rn in several materials
Material
Saranex
Polystyrene
Rubber
Plastic sheeting
Xerox transparency
Transalloy
Teflon
"Anti-thoron" membrane
Rubber
White polyester
Coated polyester
"Yellow membrane"
Polyamide
Saran Wrap
Gelman Zefluor
Aluminized Mylar
Glad Wrap
Glad freezer bags
Mylar
Al-Foil
MIROC I
MIROC II
MIROC III
EPOXY I
EPOXY II
EPOXY III
EPOXY IV
Diffusion Length (DL)(cm)
0.13
0.79
>7.00
0.44
0.84
0.41
2.1xl0’2
0.69
0.19
2.67
0.33
0.16
0.32
0.07
6.90
0.16
0.28
0.19
0.09
0.15
0.12
0.13
0.14
0.13
0.24
0.13
1.46
Thickness (6)(cm)
4.0xl0’32.6xl0’22.3x10"22.3xl0"2l.OxlO’22.6xl0’26.1x10"35.6x10’32.5xl0’25.9xl0’35.3xl0’38.8x10"37.0xl0’41.3xl0’3l.lxlO’2l.OxlO’31.4xl0’33.5x10"39.0xl0’42.1xl0"37.9xl0’211.4xl0’216.5x10"22.5xl0"24.9x10’25.9xl0’22.7xl0’2
DL/6
32.50
30.38
>304.00
30.00
44.00
32.31
67.21
33.93
106.80
55.93
30.19
36.36
30.00
53.85
627.30
160.00
200.00
54.29
100.00
71.43
1.52
1.14
0.85
5.20
4.90
2.20
54.10
Notes:
222, 2.1xl0�6s�l1. DL -A/A, where AC^Rn) - 2.1xl0’°s.2. For more information regarding the materials in Table 2 see Table 1.

membrane
C(5.t)=Co|^^^
z=6 z=0
Fig. 1 - Membrane geometry

TIME-LAG ANALYTICAL PROCEDURE
Fig. 2 - Normalized count rate versus elapsed time. Graph used to calculate the time-lag.

27
SENSITIVE VOLUME (V^)��DJ-DETECTOR
;"��’ / /_____:^^/^. \/ DIGITAL^.^.^^ : PREAMP/AMP SIGNAL
r^^afe;;;^^^ :��� SYSTEM TO DATA *�� ^:=:^:;::::::::::::;V=^�� ;___________ LOGGER
N��ALUMINIZED MYLAR
PROTECTIVE NYLON GRID
MEMBRANE(k,8,A)
^@11^JNn;. ^ ^.N^::;::;:;::^
rB^lGAS_I^ ^ ^ENSlfiVE^te:-1 FLOW ::: ;. ^ :VOLUME OF,l::i?^^;&.^^ . < ’: RADON:��::::Vtfi’-:’^^^^^^^ ;
^ : DETECTOR; :;�V@,RTTF ; ^(V^^^:/mW^ ^^m^\�.^;�.:�.:;�.�:..�:�.:�:�.�:�.����� ,. ^
� �’ �� -� �� ’� �� " �/V^^; f:.-^:.;^::^- -,. � ^ �::"::":;��::"::�;:::::�:::./
Fig. 3 - Radon-222 monitors showing geometrical arrangement usedto determine the permeability of membranes.

PROCESSEDDATA
Fig. 4 - ’Multisensor’ apparatus used to determine the permeability of membranes.

300 -T-
280 -
260 -
240 -
220 -
200 -
180 -
160 -
140 -
120 -
100 -
80 -
60 -
40 -
20 -
0 -
4+ + +
+ ++ -^ +
+ -f^"*" \ -j4- + + + ++ -^+-^l-.rf-+
^Yv/y^/^^ ^w^:^’+, ++++ +++++ +^ +
4 + , + + +
f + + ++
a "" AM^^^^i^^^SS^^^0^^1^^^^^^^%^n^^^^ cuu^^ -t,
�’’cri���-^ LJ�|���i���i���i���r iii’111
0 20 40 60 80
Elapsed time, h
100 120 140
Fig. 5 Alpha-particle count rate versus elapsed time for a glass fibre filter (upper trace)
and a low permeability membrane (epoxy).
Recommended


![[XLS] · Web viewSTR 20015 STR 30105 STR 30115 STR 30123 STR 30125 STR 30130 STR 40090 ORİ STR 40115 STR 41090 ORİ STR 44115 STR 45111 STR 50020 STR 50103A STR 50112 STR 50113A](https://img.pdfslide.us/doc/110x75/5ad04b0c7f8b9a1d328e1e93/xls-viewstr-20015-str-30105-str-30115-str-30123-str-30125-str-30130-str-40090.jpg)