SMUD’s Preparations For 2030 And Beyond
Tim Tutt Presented to California Energy Commission
Electricity System Needs Workshop August 19th, 2013
Powering forward. Together.

Fifth Largest California Utility; 3300 MW Peak, 11,000 GWh Sales
Publicly-Owned; Governed By Seven Member Elected Board
Board Adopted Goals
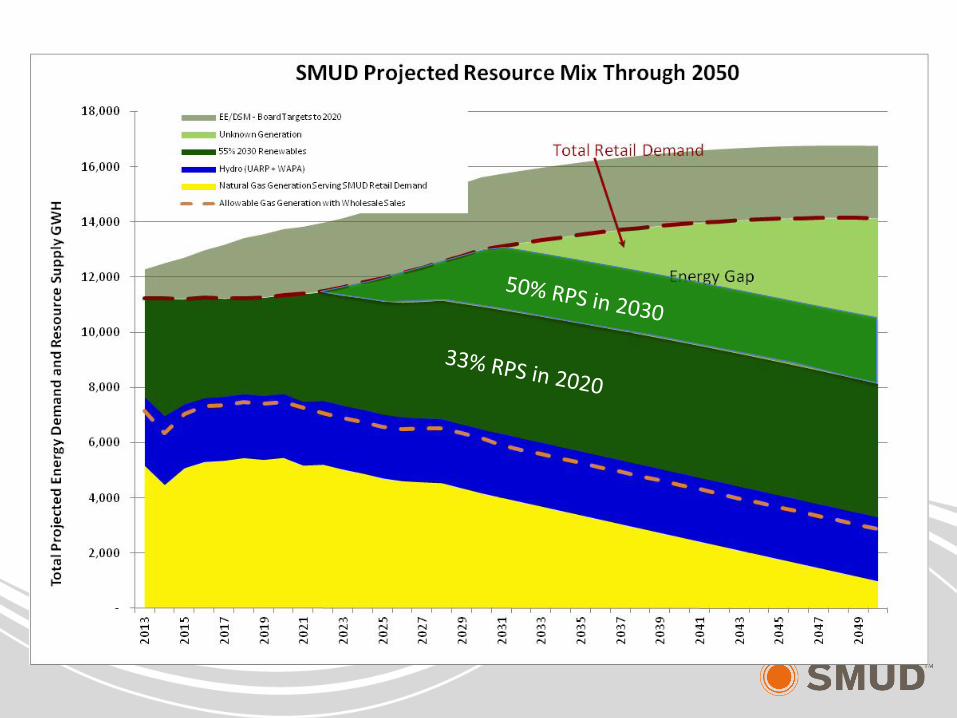
33% Renewables By 2020 15% Efficiency Savings 90% Reduction In GHG Emissions By 2050
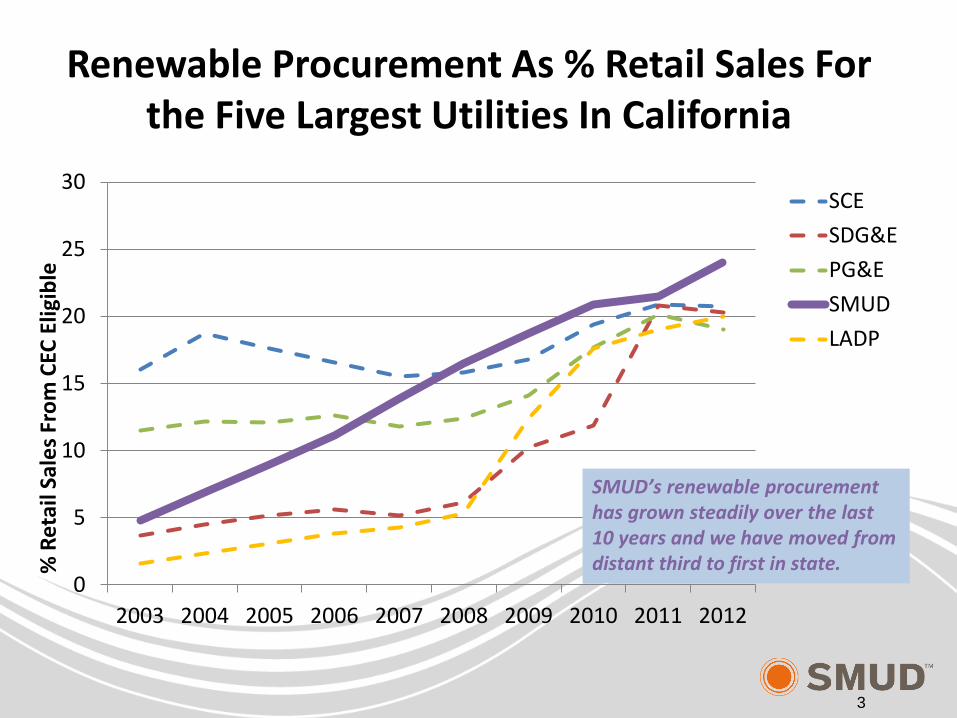
Renewable Procurement As % Retail Sales For the Five Largest Utilities In California
0
5
10
15
20
25
30
2003 2004 2005 2006 2007 2008 2009 2010 2011 2012
SCE
SDG&E
PG&E
SMUD
LADP
SMUD’s renewable procurement has grown steadily over the last 10 years and we have moved from distant third to first in state. %
Ret
ail S
ales
Fro
m C
EC E
ligib
le
3

SMUD’s Renewable Portfolio: 2012 2490 GWH total, 24%
Biomass and Biogas, 1018,
41%
Biomethane, 287, 12%
Solar, 222, 9%
Wind, 683, 27%
Small Hydro, 280, 11%
4
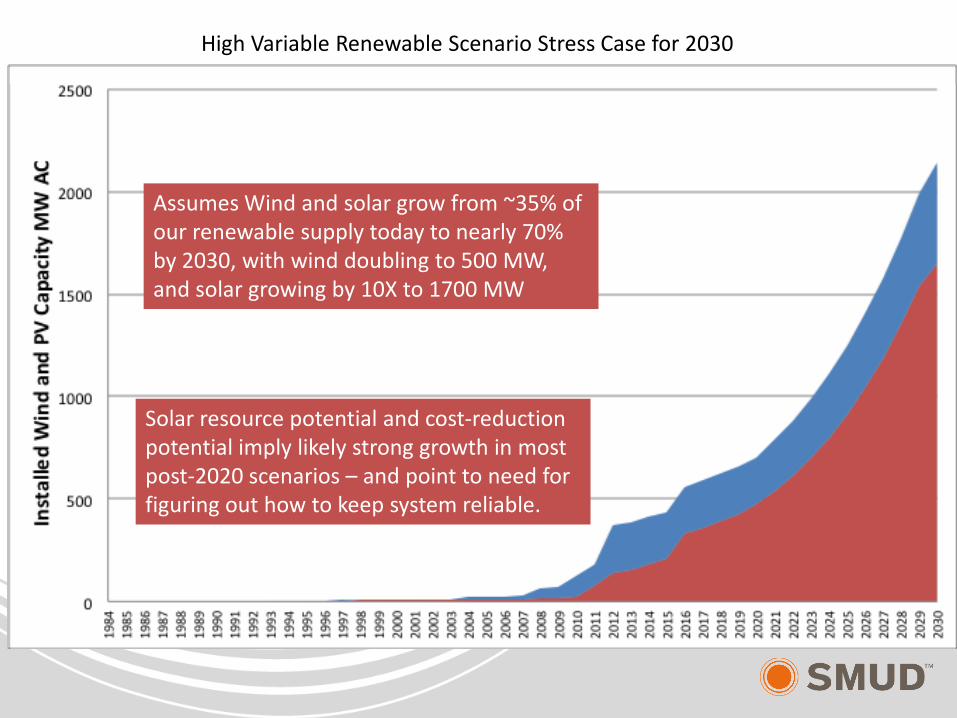
Historical Forecast
Solar
Wind
High Variable Renewable Scenario Stress Case for 2030
Assumes Wind and solar grow from ~35% of our renewable supply today to nearly 70% by 2030, with wind doubling to 500 MW, and solar growing by 10X to 1700 MW
Solar resource potential and cost-reduction potential imply likely strong growth in most post-2020 scenarios – and point to need for figuring out how to keep system reliable.

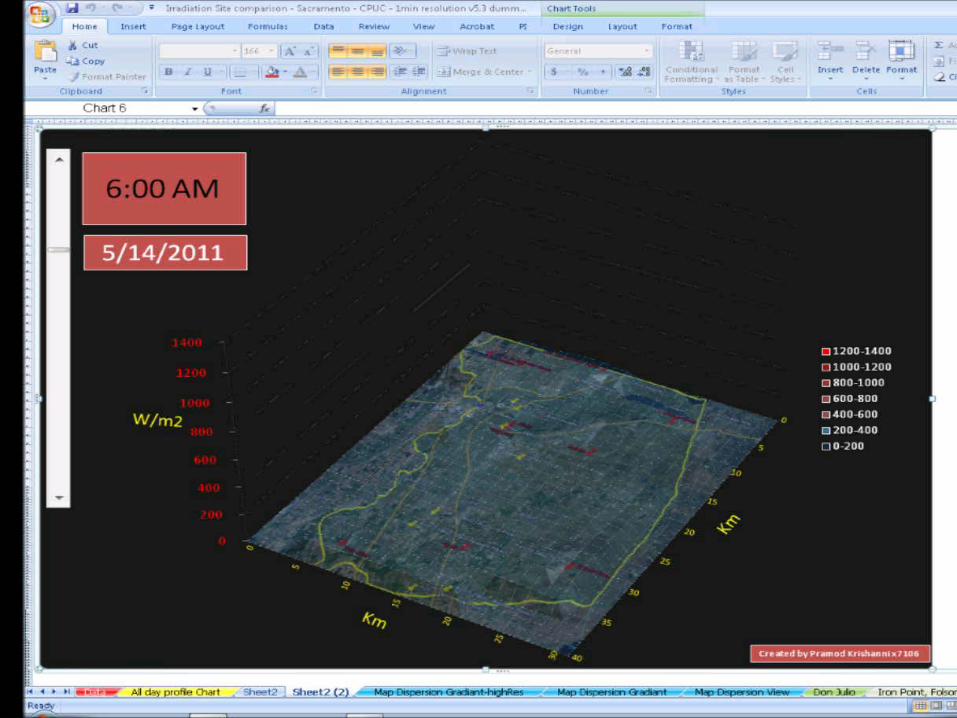
Solar Resource, Variability and Forecasting Assessments
Irradiance Sensor Network and large PV site Locations
CSI RD&D Program Manager
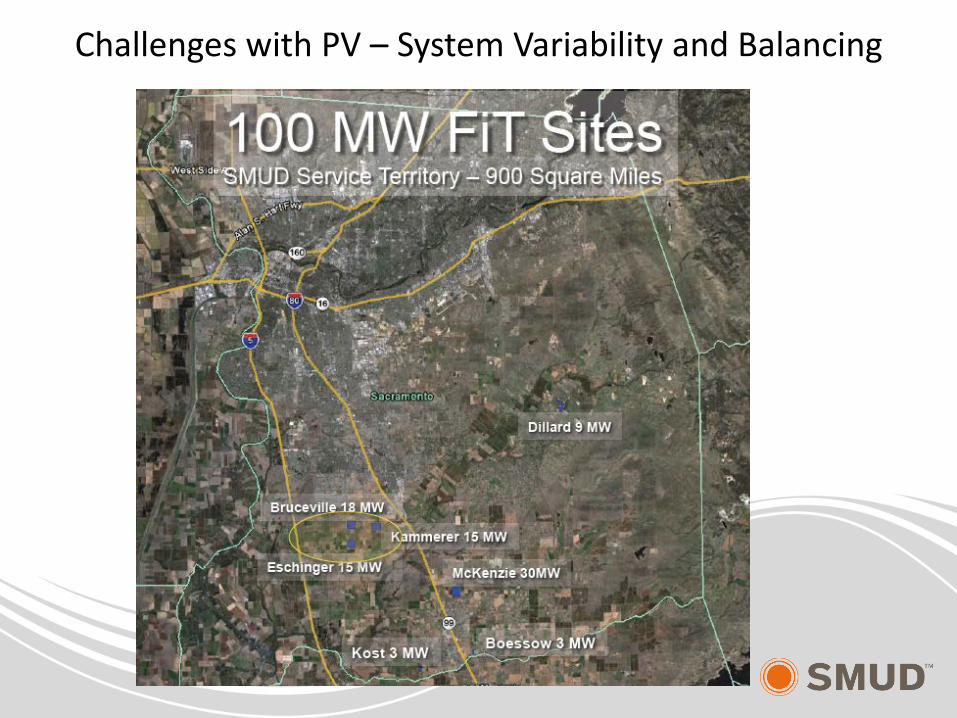
Challenges with PV – System Variability and Balancing
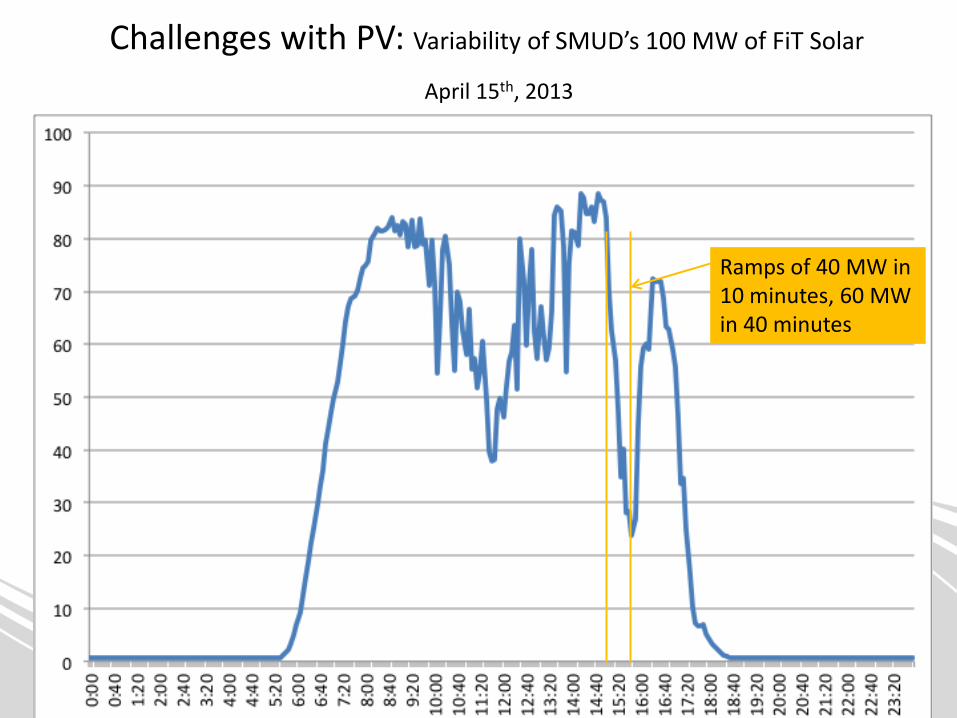
Challenges with PV: Variability of SMUD’s 100 MW of FiT Solar
April 15th, 2013
Ramps of 40 MW in 10 minutes, 60 MW in 40 minutes
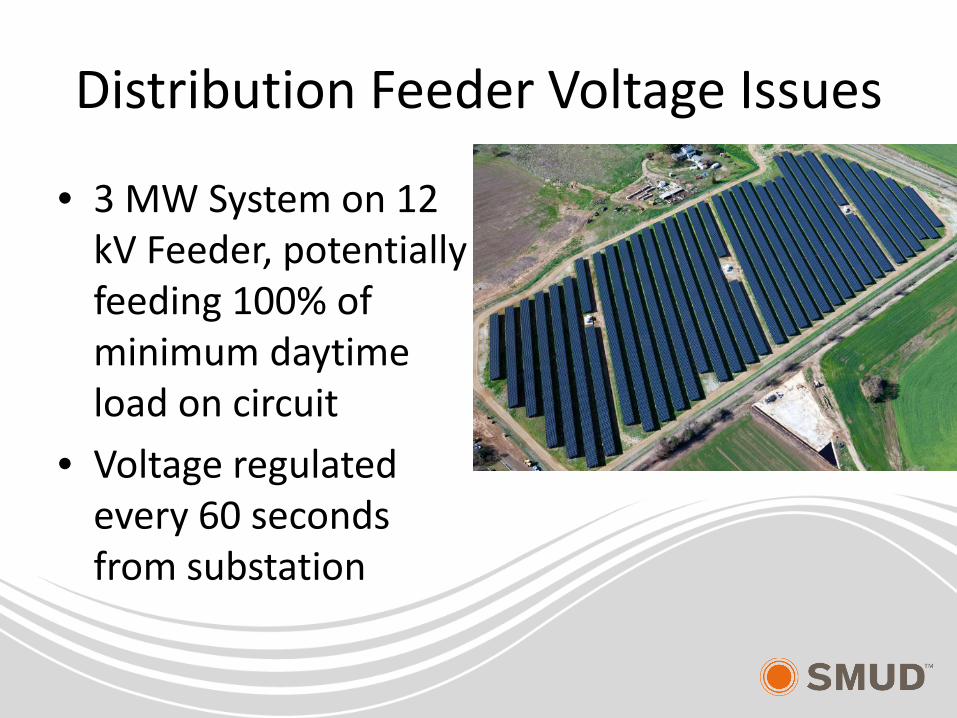
Distribution Feeder Voltage Issues
• 3 MW System on 12 kV Feeder, potentially feeding 100% of minimum daytime load on circuit
• Voltage regulated every 60 seconds from substation
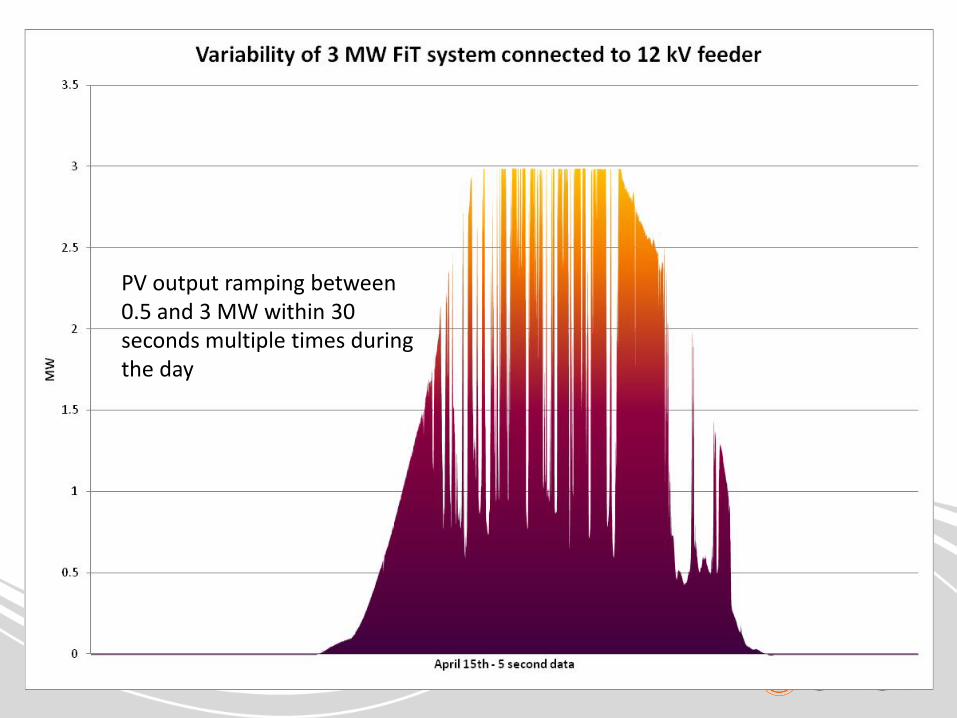
PV output ramping between 0.5 and 3 MW within 30 seconds multiple times during the day
SMUD Research Looking at Grid Impacts, Mitigation Alternatives, System Effects and Policies
• Developing better forecasting models; examining the effect of geographic variation
• Examining communications between PV inverters and system to allow monitoring and possibly control
• Research on storage at the house, neighborhood, and system level, and with Electric Vehicles (managed charging, V2H, V2G)
• Demand Response pilots and goals
• Strategic flexible IC engine pilot for system support
13
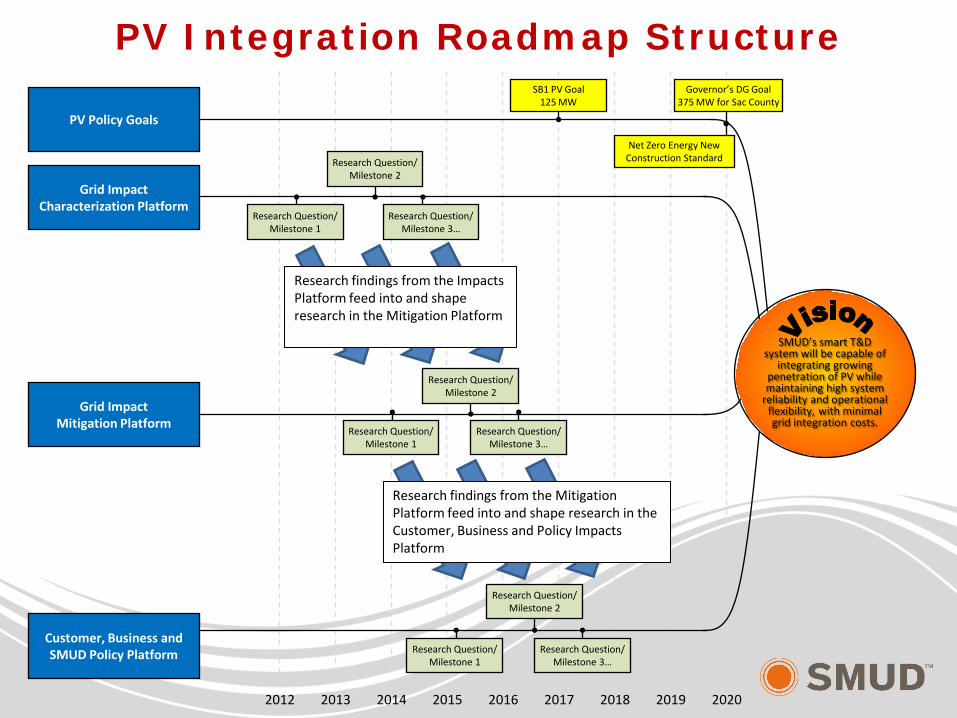
Grid Impact Characterization Platform
2018 2015 2016 2017
SMUD’s smart T&D system will be capable of
integrating growing penetration of PV while maintaining high system
reliability and operational flexibility, with minimal grid integration costs.
2019 2020 2014
Grid Impact Mitigation Platform
PV Integration Roadmap Structure
Research Question/ Milestone 1
Research Question/ Milestone 2
Research Question/ Milestone 3…
Research Question/ Milestone 1
Research Question/ Milestone 2
Research Question/ Milestone 3…
2013 2012
PV Policy Goals
SB1 PV Goal 125 MW
Governor’s DG Goal 375 MW for Sac County
Customer, Business and SMUD Policy Platform
Research findings from the Mitigation Platform feed into and shape research in the Customer, Business and Policy Impacts Platform
Research findings from the Impacts Platform feed into and shape research in the Mitigation Platform
Research Question/ Milestone 1
Research Question/ Milestone 2
Net Zero Energy New Construction Standard
Research Question/ Milestone 3…
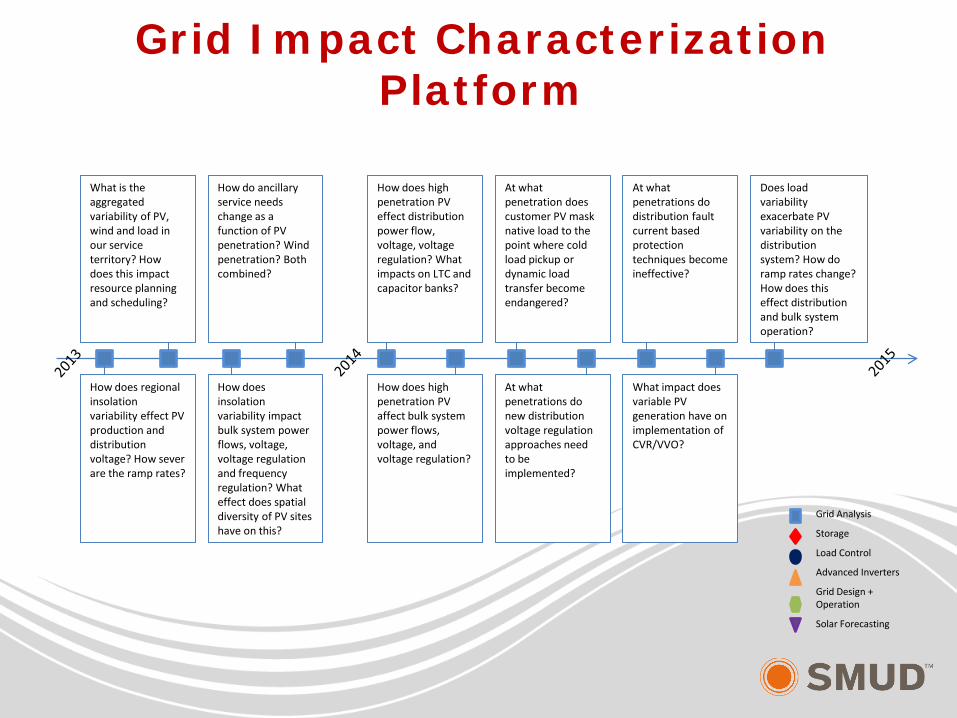
How does high penetration PV affect bulk system power flows, voltage, and voltage regulation?
At what penetration does customer PV mask native load to the point where cold load pickup or dynamic load transfer become endangered?
Does load variability exacerbate PV variability on the distribution system? How do ramp rates change? How does this effect distribution and bulk system operation?
How does insolation variability impact bulk system power flows, voltage, voltage regulation and frequency regulation? What effect does spatial diversity of PV sites have on this?
How do ancillary service needs change as a function of PV penetration? Wind penetration? Both combined?
Grid Impact Characterization Platform
How does high penetration PV effect distribution power flow, voltage, voltage regulation? What impacts on LTC and capacitor banks?
At what penetrations do distribution fault current based protection techniques become ineffective?
How does regional insolation variability effect PV production and distribution voltage? How sever are the ramp rates?
What is the aggregated variability of PV, wind and load in our service territory? How does this impact resource planning and scheduling?
What impact does variable PV generation have on implementation of CVR/VVO?
Grid Analysis
Storage
Load Control
Advanced Inverters
Grid Design + Operation
Solar Forecasting
At what penetrations do new distribution voltage regulation approaches need to be implemented?
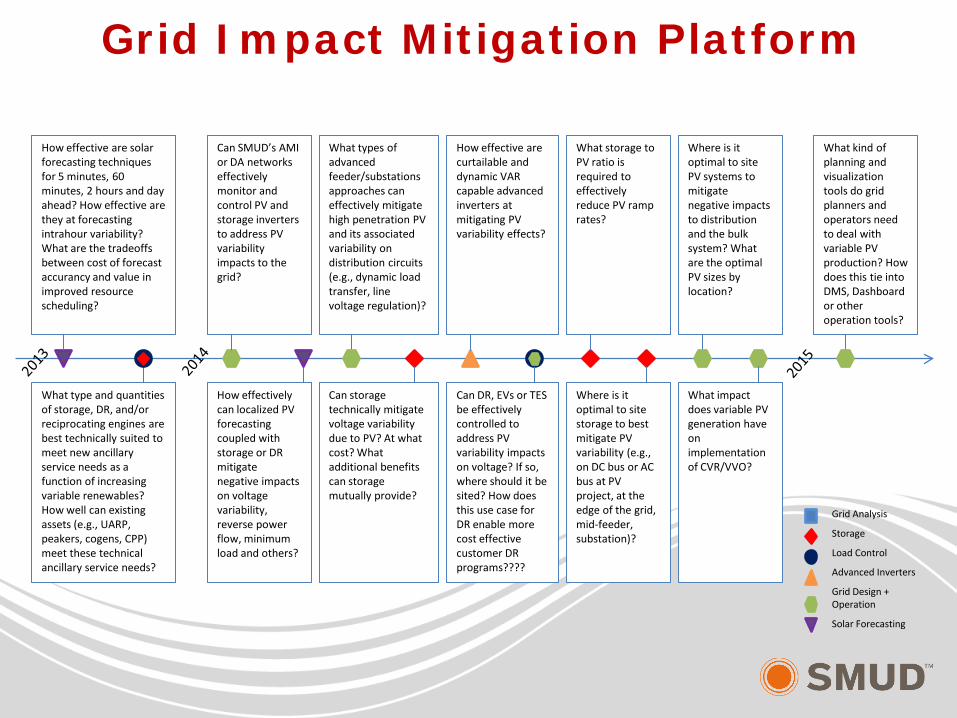
Can storage technically mitigate voltage variability due to PV? At what cost? What additional benefits can storage mutually provide?
Where is it optimal to site storage to best mitigate PV variability (e.g., on DC bus or AC bus at PV project, at the edge of the grid, mid-feeder, substation)?
How effective are curtailable and dynamic VAR capable advanced inverters at mitigating PV variability effects?
What type and quantities of storage, DR, and/or reciprocating engines are best technically suited to meet new ancillary service needs as a function of increasing variable renewables? How well can existing assets (e.g., UARP, peakers, cogens, CPP) meet these technical ancillary service needs?
Can SMUD’s AMI or DA networks effectively monitor and control PV and storage inverters to address PV variability impacts to the grid?
What storage to PV ratio is required to effectively reduce PV ramp rates?
How effectively can localized PV forecasting coupled with storage or DR mitigate negative impacts on voltage variability, reverse power flow, minimum load and others?
What types of advanced feeder/substations approaches can effectively mitigate high penetration PV and its associated variability on distribution circuits (e.g., dynamic load transfer, line voltage regulation)?
How effective are solar forecasting techniques for 5 minutes, 60 minutes, 2 hours and day ahead? How effective are they at forecasting intrahour variability? What are the tradeoffs between cost of forecast accurancy and value in improved resource scheduling?
What kind of planning and visualization tools do grid planners and operators need to deal with variable PV production? How does this tie into DMS, Dashboard or other operation tools?
Grid Impact Mitigation Platform
Grid Analysis
Storage
Load Control
Advanced Inverters
Grid Design + Operation
Solar Forecasting
Where is it optimal to site PV systems to mitigate negative impacts to distribution and the bulk system? What are the optimal PV sizes by location?
What impact does variable PV generation have on implementation of CVR/VVO?
Can DR, EVs or TES be effectively controlled to address PV variability impacts on voltage? If so, where should it be sited? How does this use case for DR enable more cost effective customer DR programs????
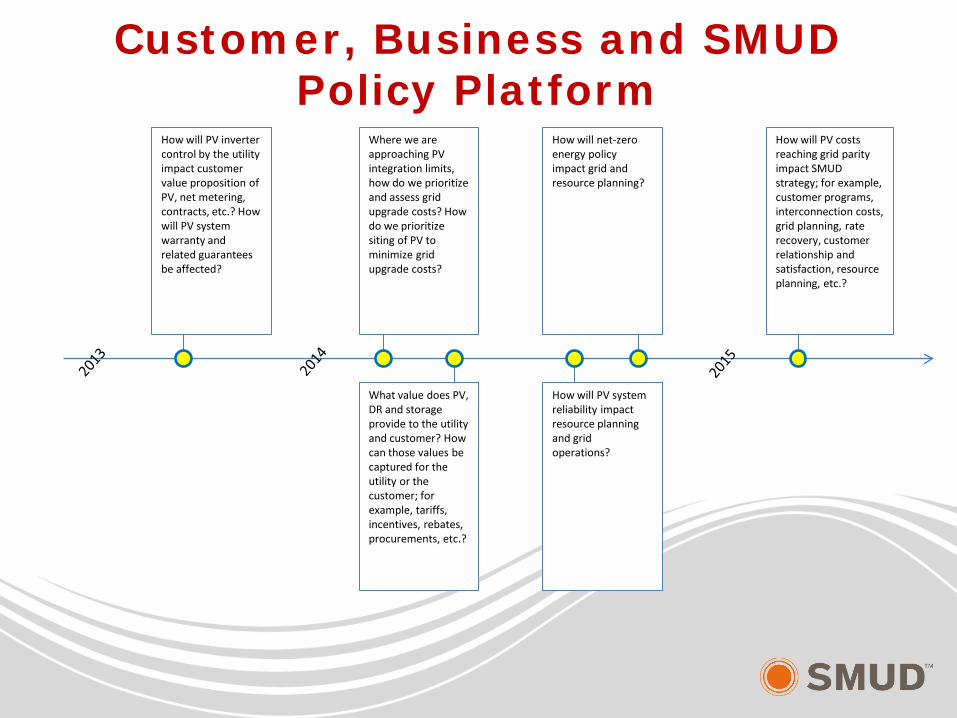
How will PV system reliability impact resource planning and grid operations?
How will PV inverter control by the utility impact customer value proposition of PV, net metering, contracts, etc.? How will PV system warranty and related guarantees be affected?
Where we are approaching PV integration limits, how do we prioritize and assess grid upgrade costs? How do we prioritize siting of PV to minimize grid upgrade costs?
What value does PV, DR and storage provide to the utility and customer? How can those values be captured for the utility or the customer; for example, tariffs, incentives, rebates, procurements, etc.?
How will net-zero energy policy impact grid and resource planning?
Customer, Business and SMUD Policy Platform
How will PV costs reaching grid parity impact SMUD strategy; for example, customer programs, interconnection costs, grid planning, rate recovery, customer relationship and satisfaction, resource planning, etc.?

Integrated T&D Modeling Tool
• Integrates T&D into single model
• Enables systemic evaluation of impacts from: – High penetrations of PV
– High penetrations of EVs
• Allows for optimization analysis – where best to locate PV, Demand Response, EVs, Distribution Automation
• SMUD system online this year for analysis
19
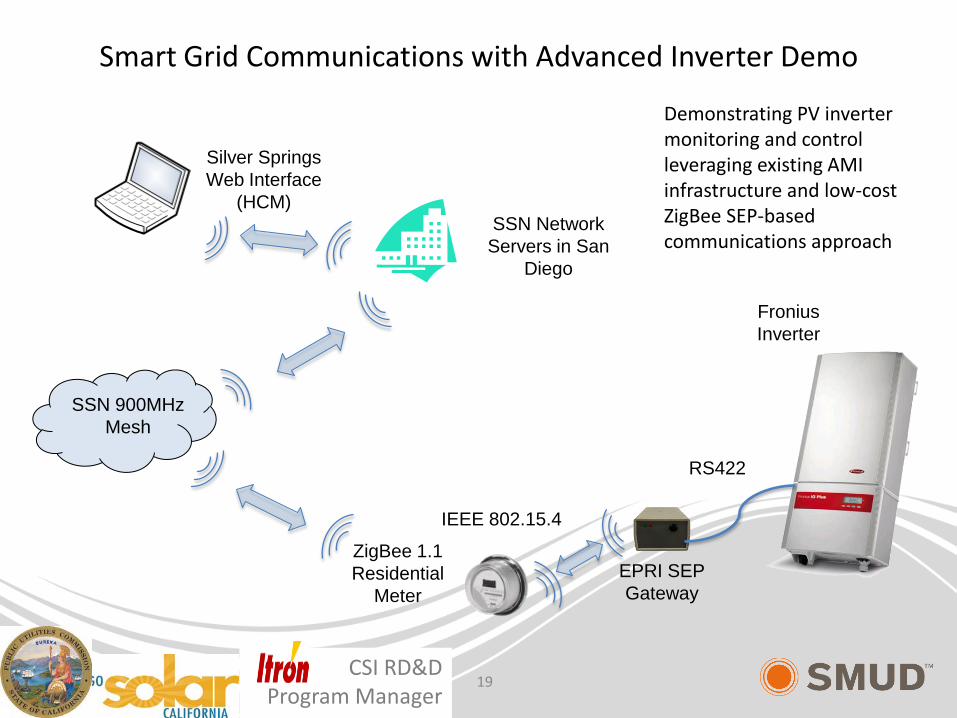
Smart Grid Communications with Advanced Inverter Demo
Silver Springs Web Interface
(HCM)
ZigBee 1.1 Residential
Meter EPRI SEP Gateway
Fronius Inverter
IEEE 802.15.4
SSN 900MHz Mesh
RS422
SSN Network Servers in San
Diego
CSI RD&D Program Manager
Demonstrating PV inverter monitoring and control leveraging existing AMI infrastructure and low-cost ZigBee SEP-based communications approach
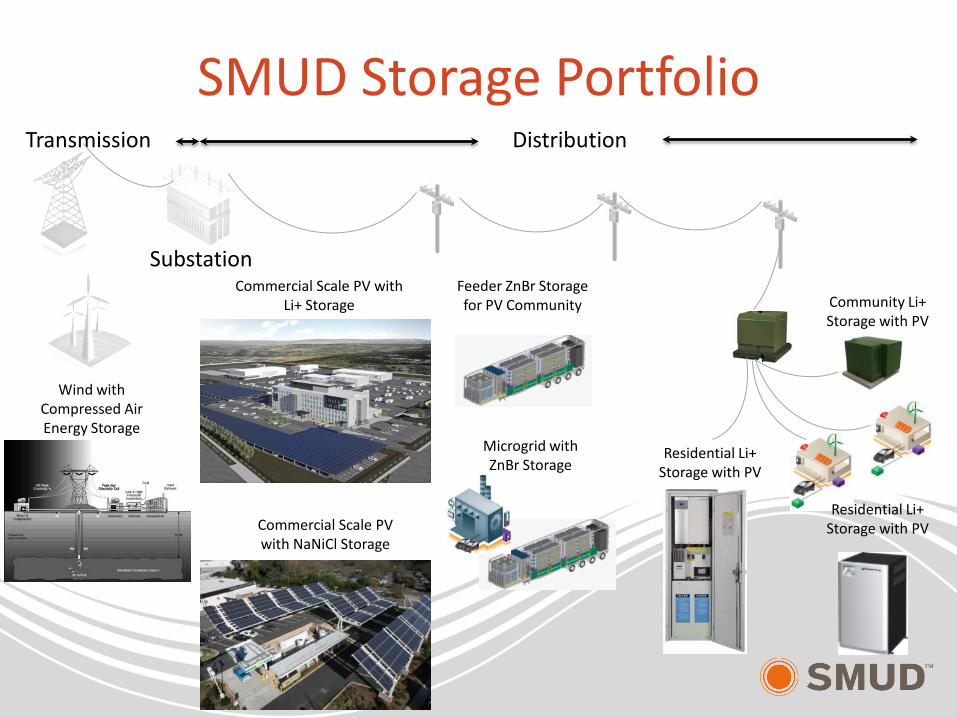
SMUD Storage Portfolio Transmission Distribution
Residential Li+ Storage with PV
Community Li+ Storage with PV
Substation Feeder ZnBr Storage for PV Community
Microgrid with ZnBr Storage
Commercial Scale PV with NaNiCl Storage
Wind with Compressed Air Energy Storage
Commercial Scale PV with Li+ Storage
Residential Li+ Storage with PV
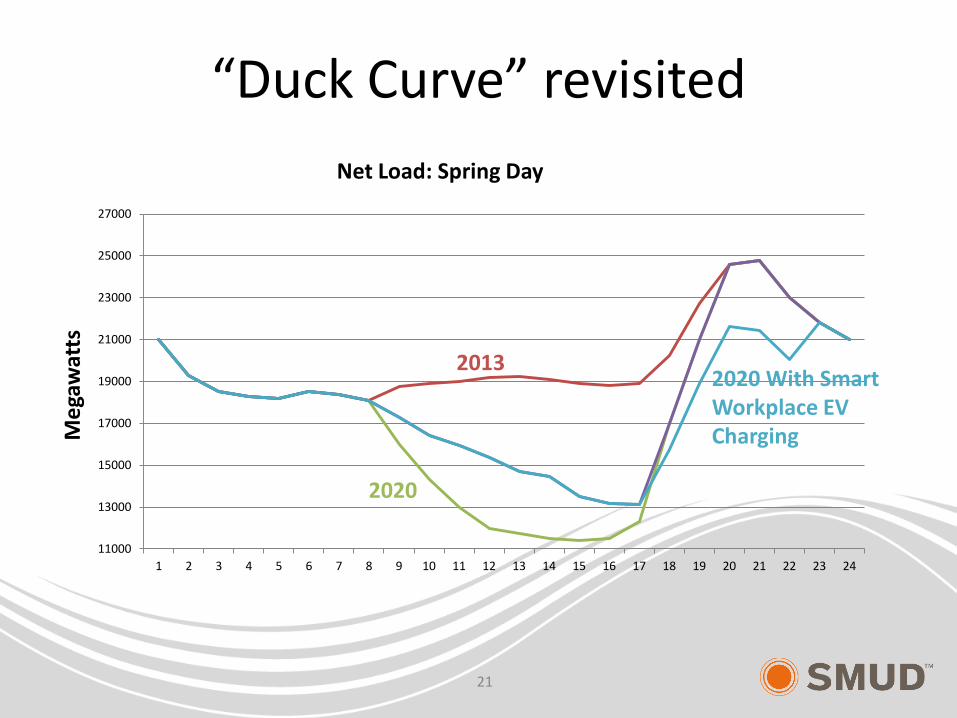
“Duck Curve” revisited
21
11000
13000
15000
17000
19000
21000
23000
25000
27000
1 2 3 4 5 6 7 8 9 10 11 12 13 14 15 16 17 18 19 20 21 22 23 24
Meg
awat
ts
Net Load: Spring Day
2013
2020
2020 With Smart Workplace EV Charging
Appendix slides:
Current SMUD storage project details
Feeder 1202 Feeder 1201
CB CB
Galt Substation Bank #1 6.25 MVA 69-12kV
Feeder 1204
Feeder 1203
CB CB
Galt Substation Bank #2 6.25 MVA 69-12kV
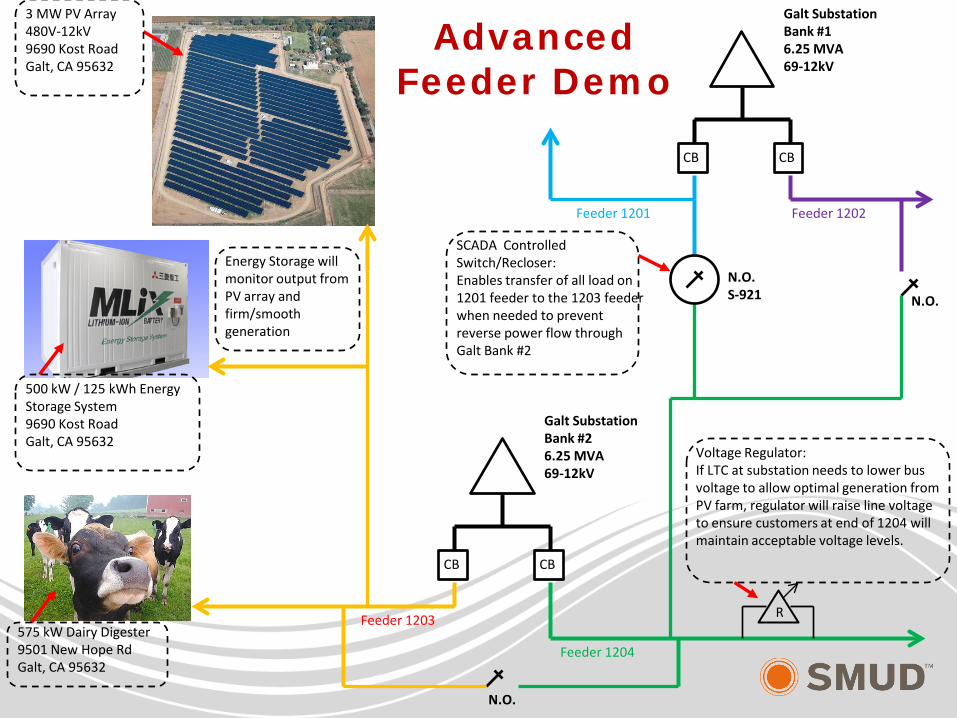
3 MW PV Array 480V-12kV 9690 Kost Road Galt, CA 95632
575 kW Dairy Digester 9501 New Hope Rd Galt, CA 95632
500 kW / 125 kWh Energy Storage System 9690 Kost Road Galt, CA 95632
SCADA Controlled Switch/Recloser: Enables transfer of all load on 1201 feeder to the 1203 feeder when needed to prevent reverse power flow through Galt Bank #2
R
Voltage Regulator: If LTC at substation needs to lower bus voltage to allow optimal generation from PV farm, regulator will raise line voltage to ensure customers at end of 1204 will maintain acceptable voltage levels.
Energy Storage will monitor output from PV array and firm/smooth generation
N.O.
N.O. S-921 N.O.
Advanced Feeder Demo
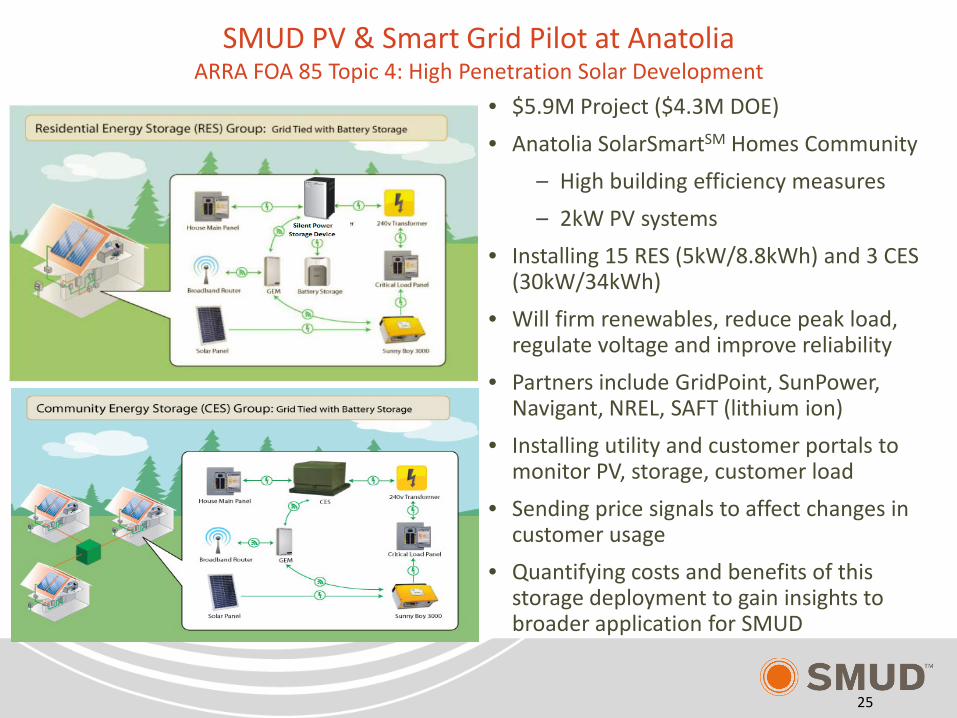
SMUD PV & Smart Grid Pilot at Anatolia ARRA FOA 85 Topic 4: High Penetration Solar Development
• $5.9M Project ($4.3M DOE)
• Anatolia SolarSmartSM Homes Community
– High building efficiency measures
– 2kW PV systems
• Installing 15 RES (5kW/8.8kWh) and 3 CES (30kW/34kWh)
• Will firm renewables, reduce peak load, regulate voltage and improve reliability
• Partners include GridPoint, SunPower, Navigant, NREL, SAFT (lithium ion)
• Installing utility and customer portals to monitor PV, storage, customer load
• Sending price signals to affect changes in customer usage
• Quantifying costs and benefits of this storage deployment to gain insights to broader application for SMUD
25
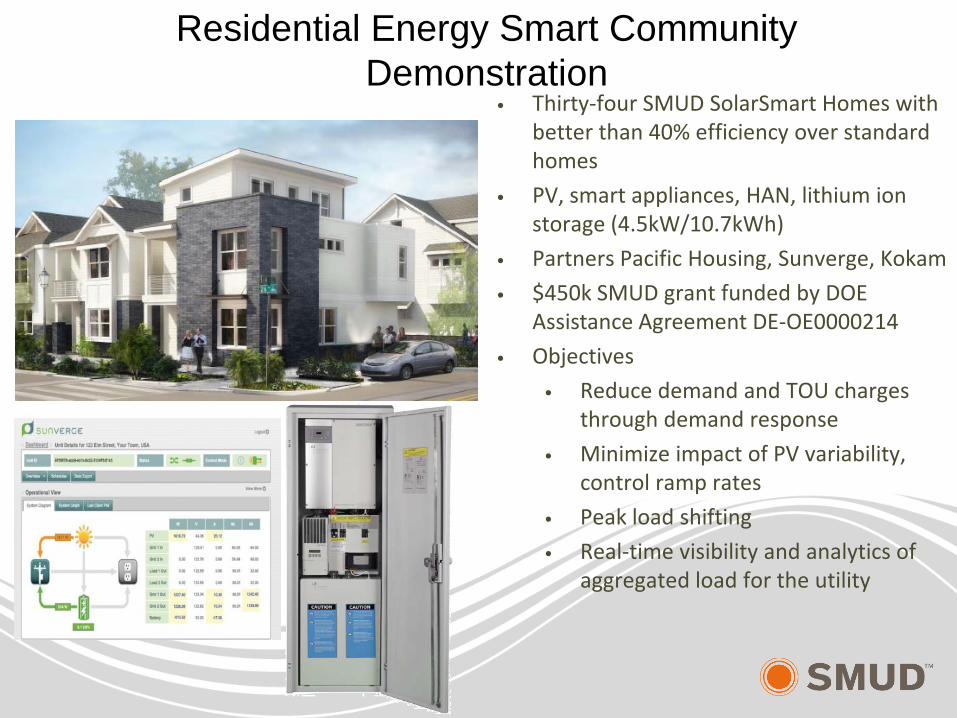
Residential Energy Smart Community Demonstration
• Thirty-four SMUD SolarSmart Homes with better than 40% efficiency over standard homes
• PV, smart appliances, HAN, lithium ion storage (4.5kW/10.7kWh)
• Partners Pacific Housing, Sunverge, Kokam
• $450k SMUD grant funded by DOE Assistance Agreement DE-OE0000214
• Objectives
• Reduce demand and TOU charges through demand response
• Minimize impact of PV variability, control ramp rates
• Peak load shifting
• Real-time visibility and analytics of aggregated load for the utility
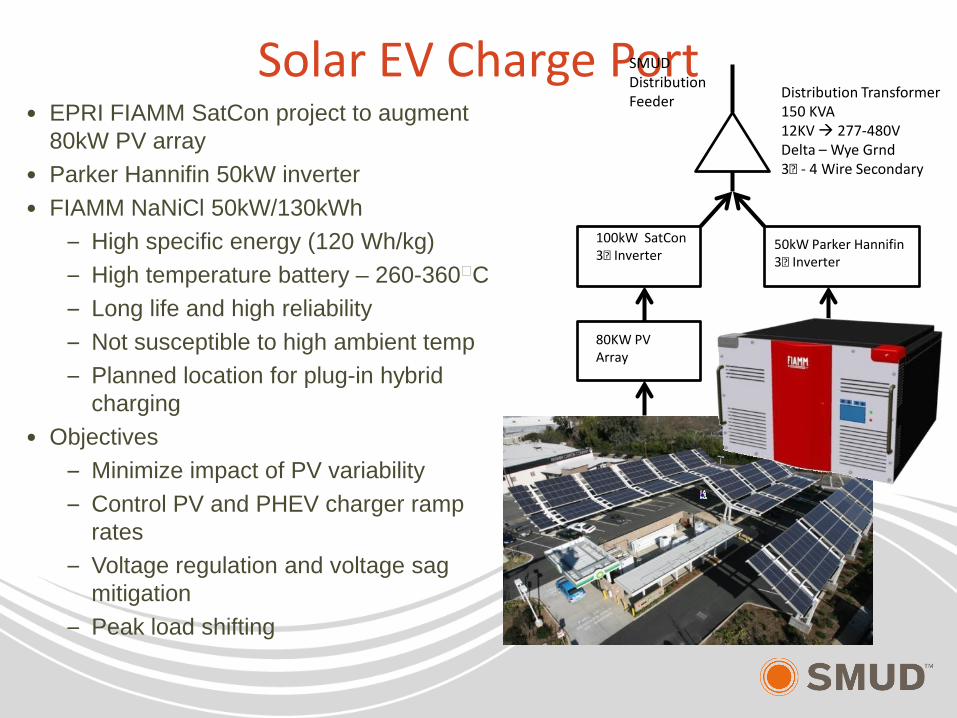
Solar EV Charge Port • EPRI FIAMM SatCon project to augment
80kW PV array • Parker Hannifin 50kW inverter • FIAMM NaNiCl 50kW/130kWh
– High specific energy (120 Wh/kg) – High temperature battery – 260-360ᴏC – Long life and high reliability – Not susceptible to high ambient temp – Planned location for plug-in hybrid
charging • Objectives
– Minimize impact of PV variability – Control PV and PHEV charger ramp
rates – Voltage regulation and voltage sag
mitigation – Peak load shifting
Distribution Transformer 150 KVA 12KV 277-480V Delta – Wye Grnd 3ᴓ - 4 Wire Secondary
80KW PV Array
100kW SatCon 3ᴓ Inverter
50kW Parker Hannifin 3ᴓ Inverter
SMUD Distribution Feeder
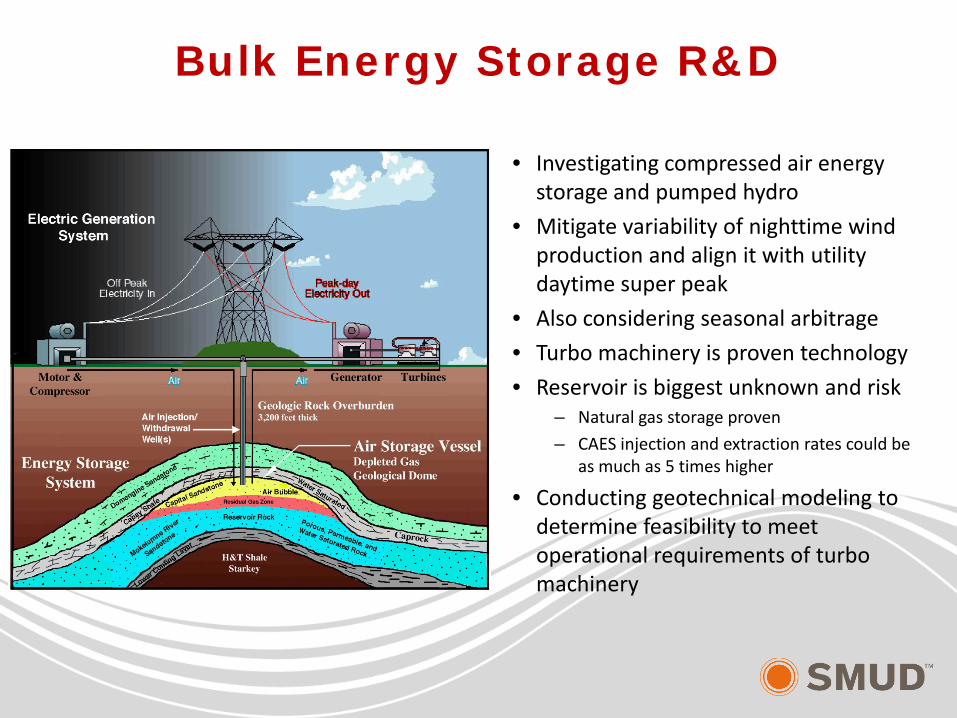
Bulk Energy Storage R&D
• Investigating compressed air energy storage and pumped hydro
• Mitigate variability of nighttime wind production and align it with utility daytime super peak
• Also considering seasonal arbitrage
• Turbo machinery is proven technology
• Reservoir is biggest unknown and risk – Natural gas storage proven
– CAES injection and extraction rates could be as much as 5 times higher
• Conducting geotechnical modeling to determine feasibility to meet operational requirements of turbo machinery
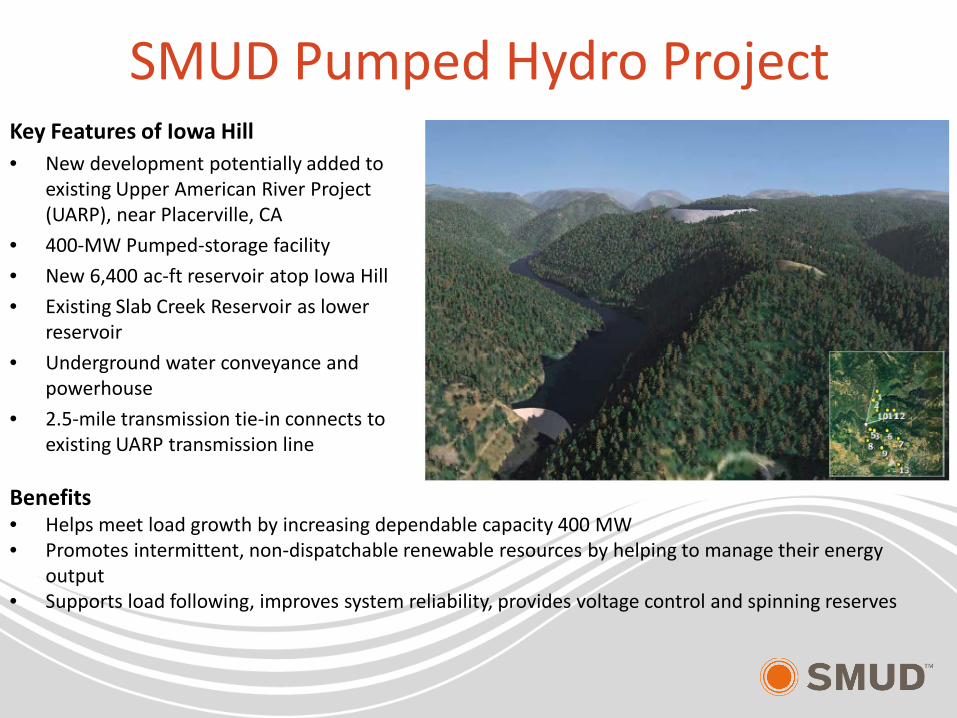
SMUD Pumped Hydro Project Key Features of Iowa Hill • New development potentially added to
existing Upper American River Project (UARP), near Placerville, CA
• 400-MW Pumped-storage facility
• New 6,400 ac-ft reservoir atop Iowa Hill
• Existing Slab Creek Reservoir as lower reservoir
• Underground water conveyance and powerhouse
• 2.5-mile transmission tie-in connects to existing UARP transmission line
Benefits • Helps meet load growth by increasing dependable capacity 400 MW • Promotes intermittent, non-dispatchable renewable resources by helping to manage their energy
output • Supports load following, improves system reliability, provides voltage control and spinning reserves
Recommended