SMOS Validation Rehearsal Campaign Workshop, 18-19/11/2008, Noordwijkerhout, The Netherlands
SMOS Validation Rehearsal Campaign Mediterranean flights
C. Gabarró, M. Talone, J. Font
SMOS Barcelona Expert CentrePg. Marítim de la Barceloneta 37-49, Barcelona (Spain)E-mail: [email protected]: www.smos-bec.icm.csic.es
SMOS Rehearsal Campaign 2
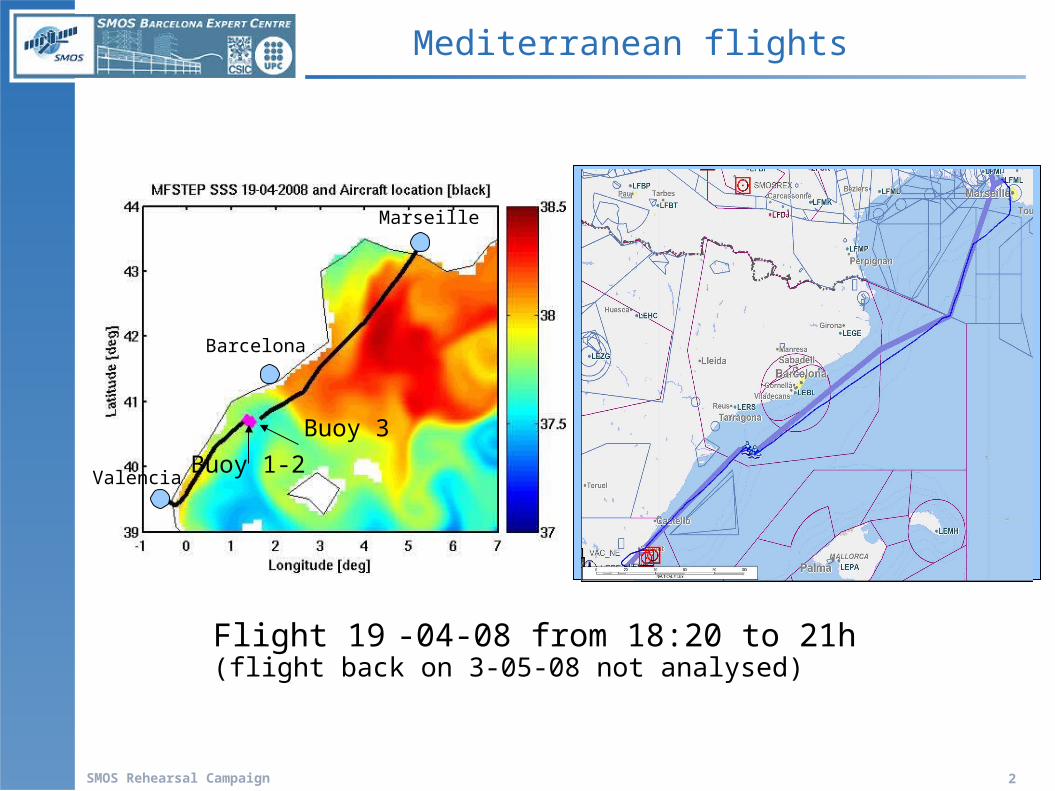
Flight 19 -04-08 from 18:20 to 21h(flight back on 3-05-08 not analysed)
Marseille
Valencia
Barcelona
Buoy 3
Buoy 1-2
Mediterranean flights
SMOS Rehearsal Campaign 3
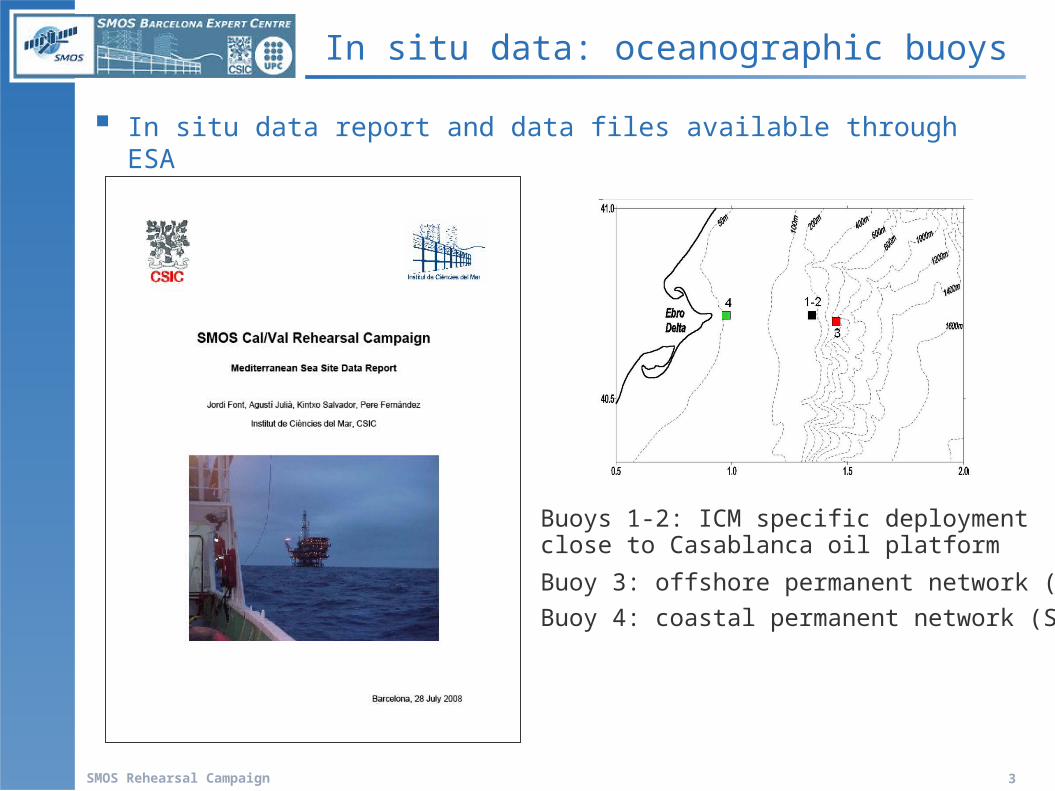
In situ data: oceanographic buoys
In situ data report and data files available through ESA
Buoys 1-2: ICM specific deploymentclose to Casablanca oil platform
Buoy 3: offshore permanent network (PE)
Buoy 4: coastal permanent network (SMC)
SMOS Rehearsal Campaign 4
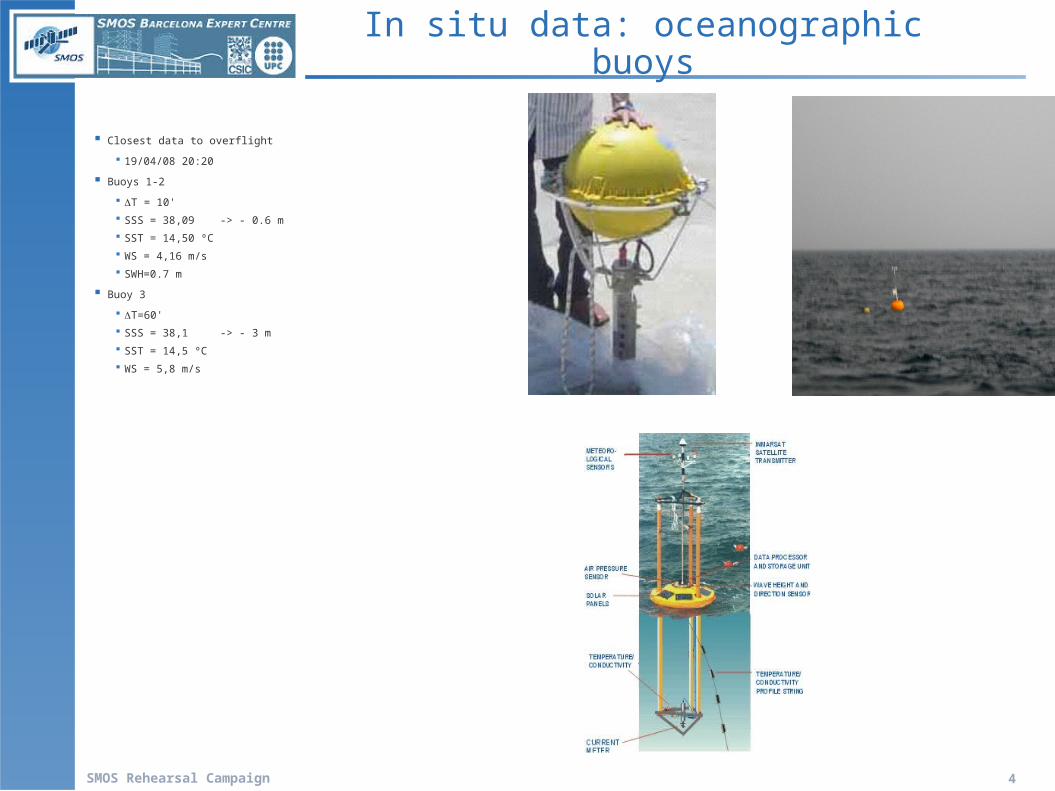
Closest data to overflight
19/04/08 20:20
Buoys 1-2
T = 10'
SSS = 38,09 -> - 0.6 m
SST = 14,50 ºC
WS = 4,16 m/s
SWH=0.7 m
Buoy 3
T=60'
SSS = 38,1 -> - 3 m
SST = 14,5 ºC
WS = 5,8 m/s
In situ data: oceanographic buoys
SMOS Rehearsal Campaign 5
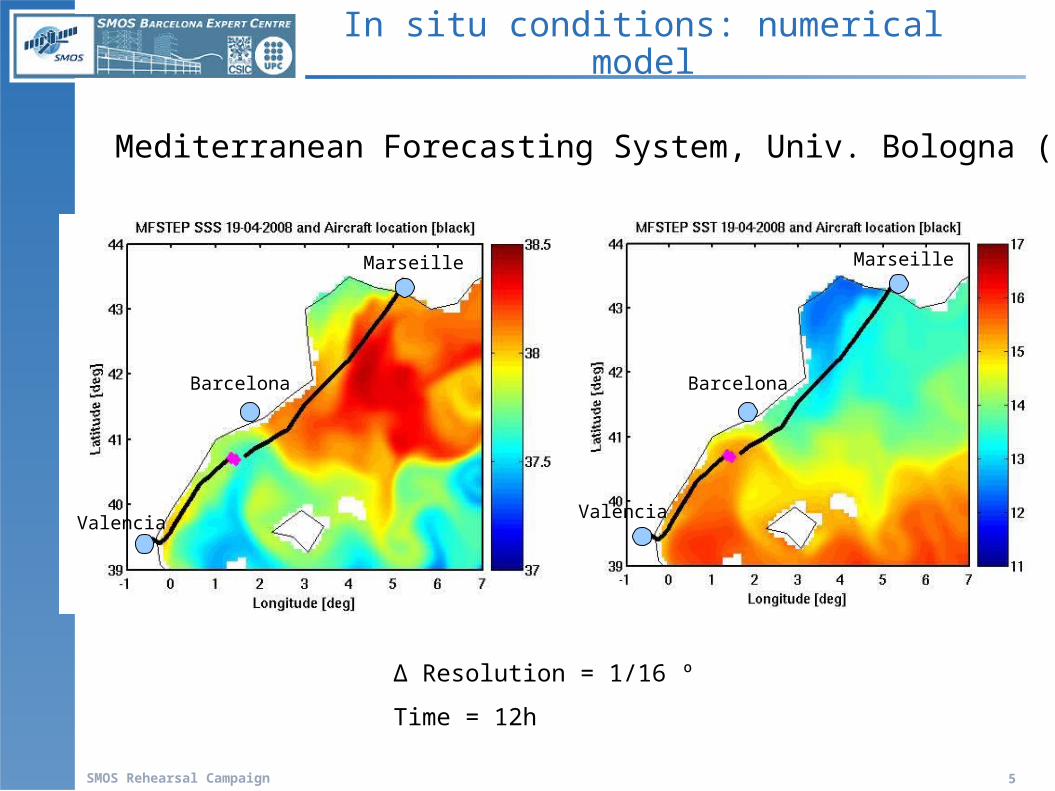
Δ Resolution = 1/16 º
Time = 12h
Marseille
Valencia
Barcelona
Marseille
Valencia
Barcelona
Mediterranean Forecasting System, Univ. Bologna (MOON)
In situ conditions: numerical model
SMOS Rehearsal Campaign 6
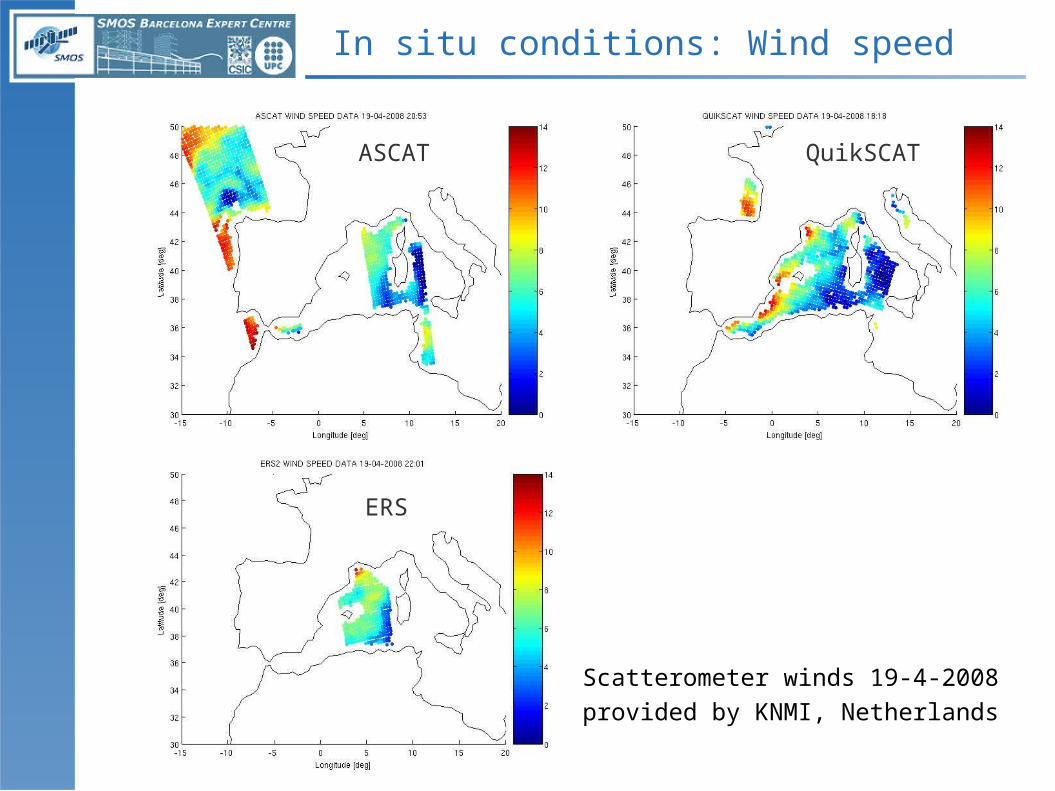
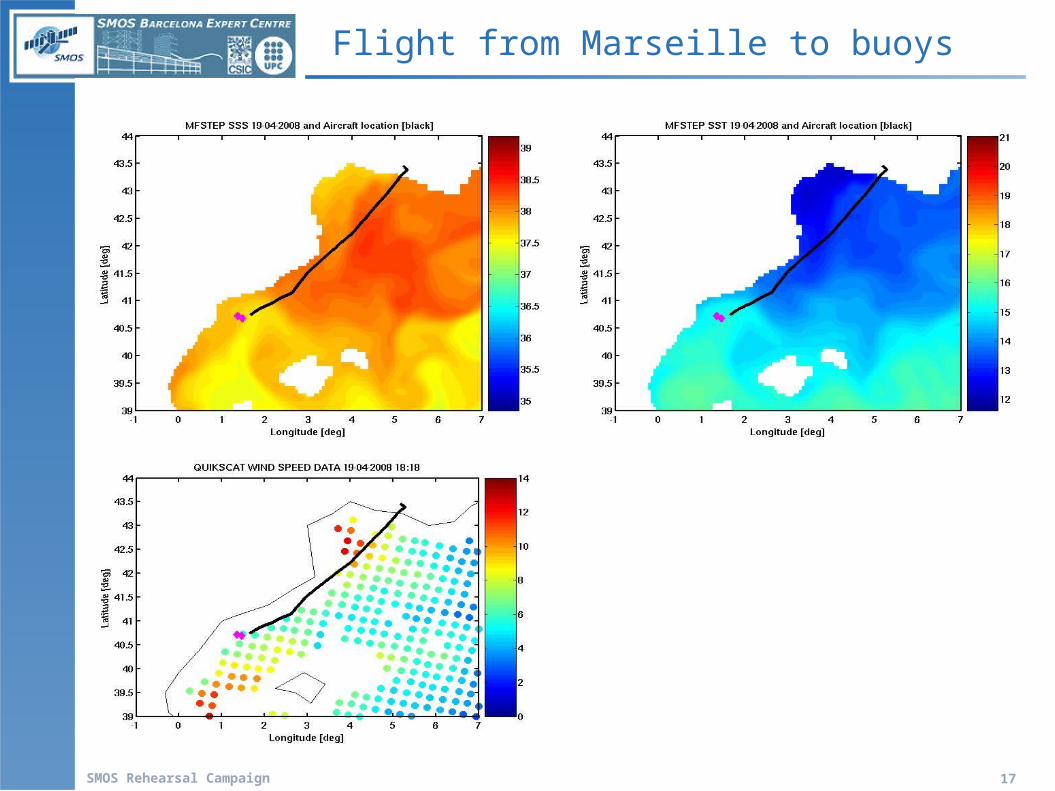
Scatterometer winds 19-4-2008
provided by KNMI, Netherlands
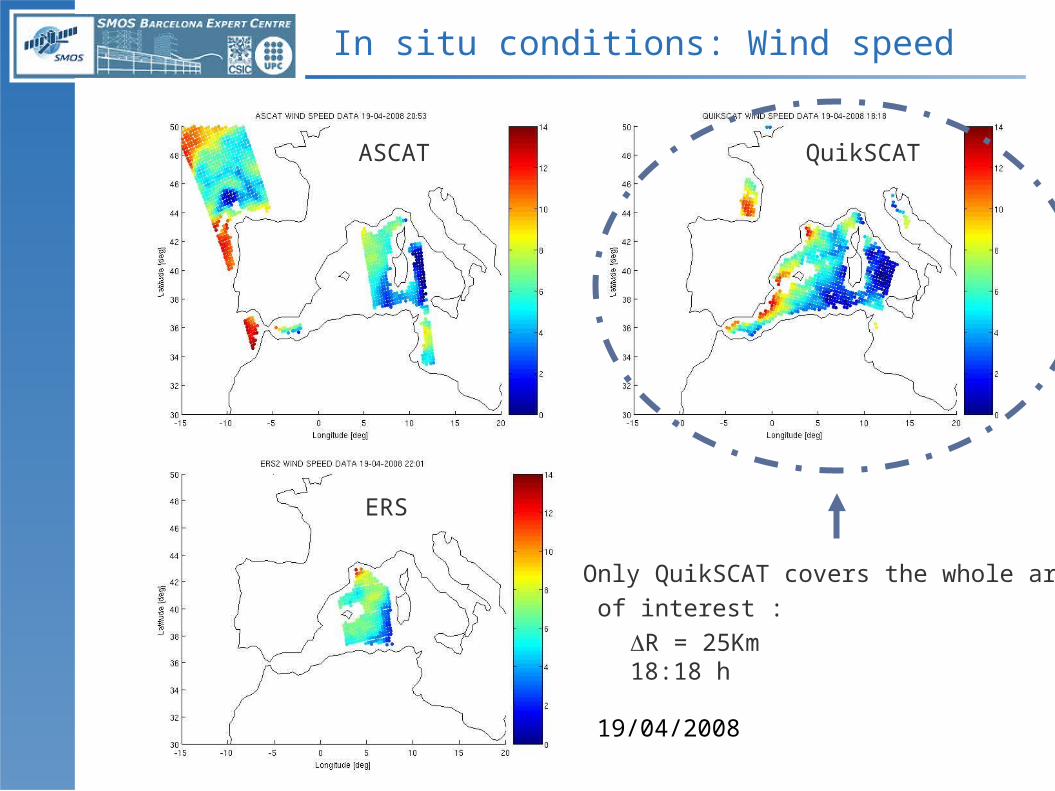
In situ conditions: Wind speed
ASCAT QuikSCAT
ERS
SMOS Rehearsal Campaign 7
Only QuikSCAT covers the whole area
of interest :
R = 25Km18:18 h
19/04/2008
In situ conditions: Wind speed
ASCAT QuikSCAT
ERS
SMOS Rehearsal Campaign 8
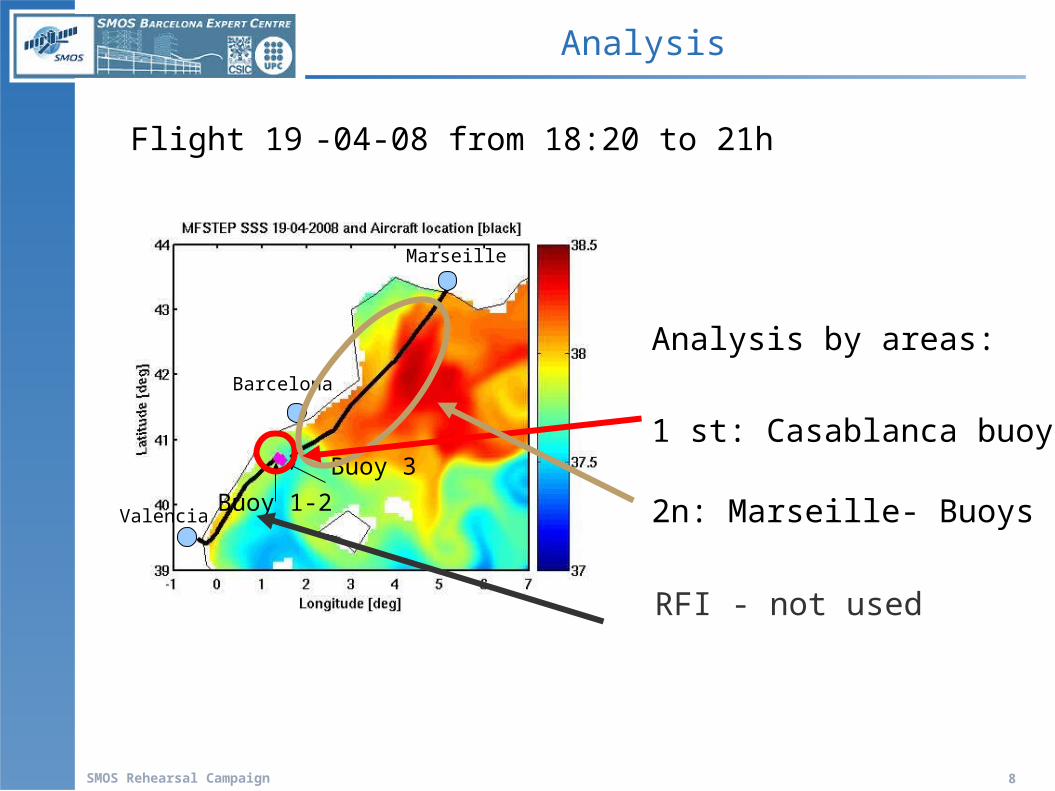
Flight 19 -04-08 from 18:20 to 21h
Analysis by areas:
1 st: Casablanca buoys
2n: Marseille- Buoys
Marseille
Valencia
Barcelona
Buoy 3
Buoy 1-2
Analysis
RFI - not used
SMOS Rehearsal Campaign 9
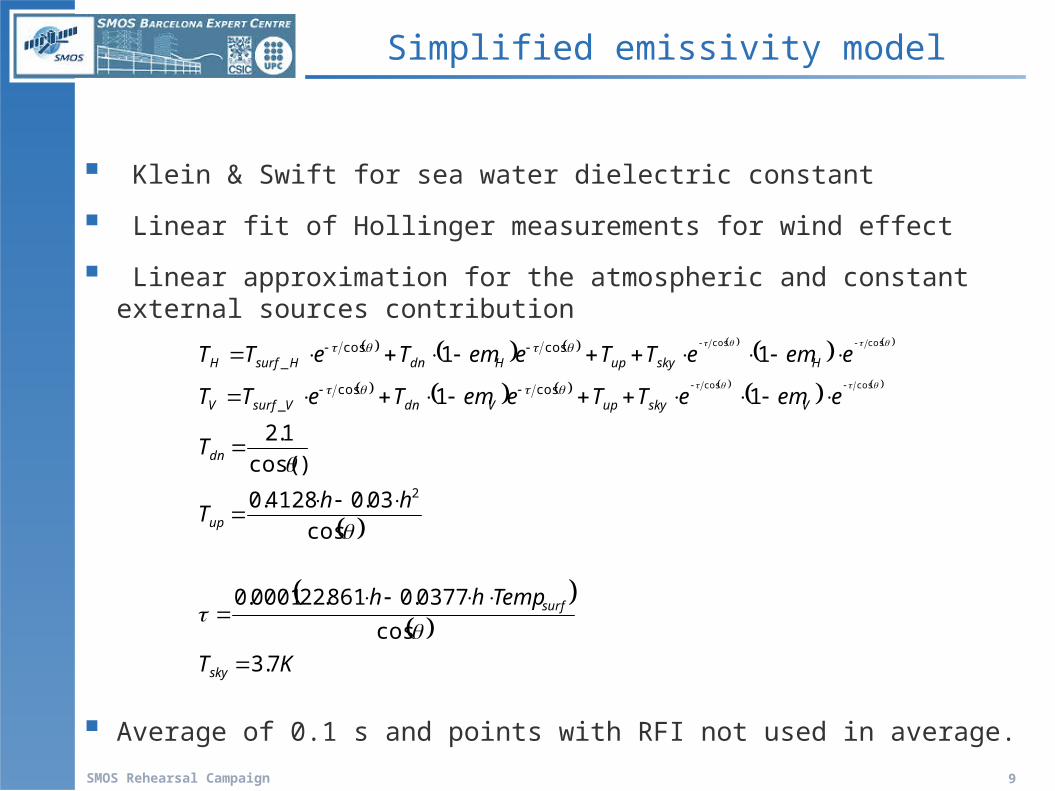
Simplified emissivity model
Klein & Swift for sea water dielectric constant
Linear fit of Hollinger measurements for wind effect
Linear approximation for the atmospheric and constant external sources contribution
Average of 0.1 s and points with RFI not used in average.
KT
Temphh
hhT
T
eemeTTeemTeTT
eemeTTeemTeTT
sky
surf
up
dn
VskyupVdnVsurfV
HskyupHdnHsurfH
7.3
cos
0377.0861.220001.0
cos
03.04128.0
)cos(
1.2
11
11
2
coscos_
coscos_
coscos
coscos
SMOS Rehearsal Campaign 10
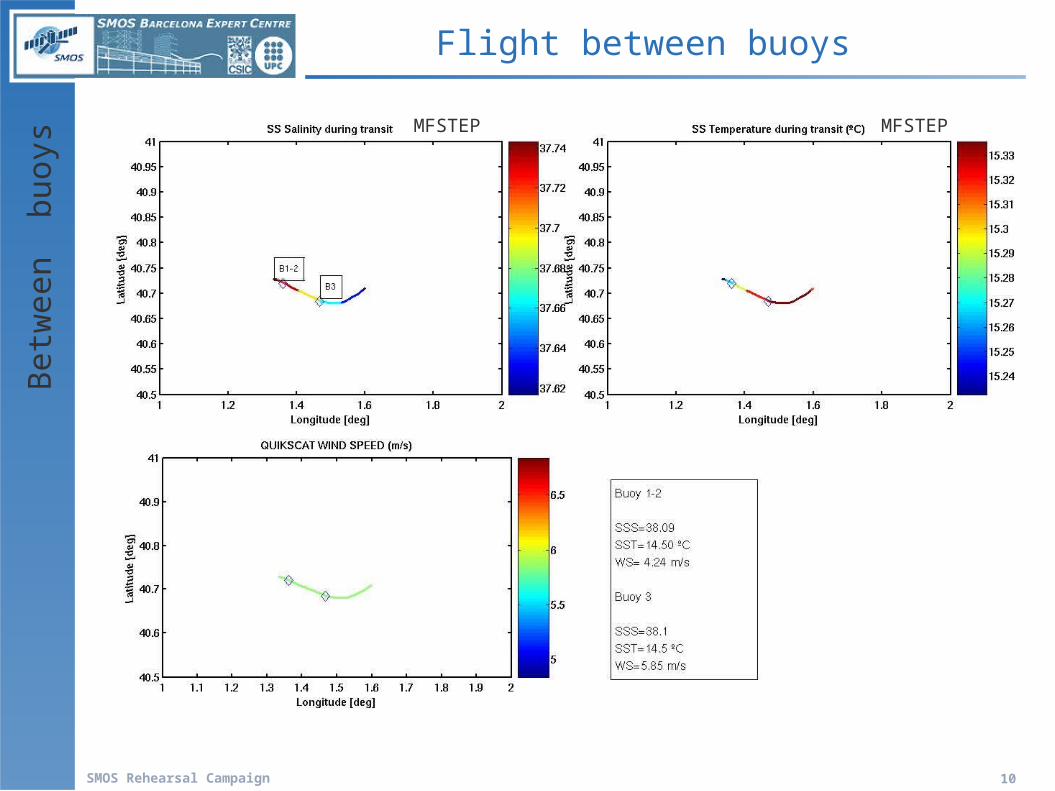
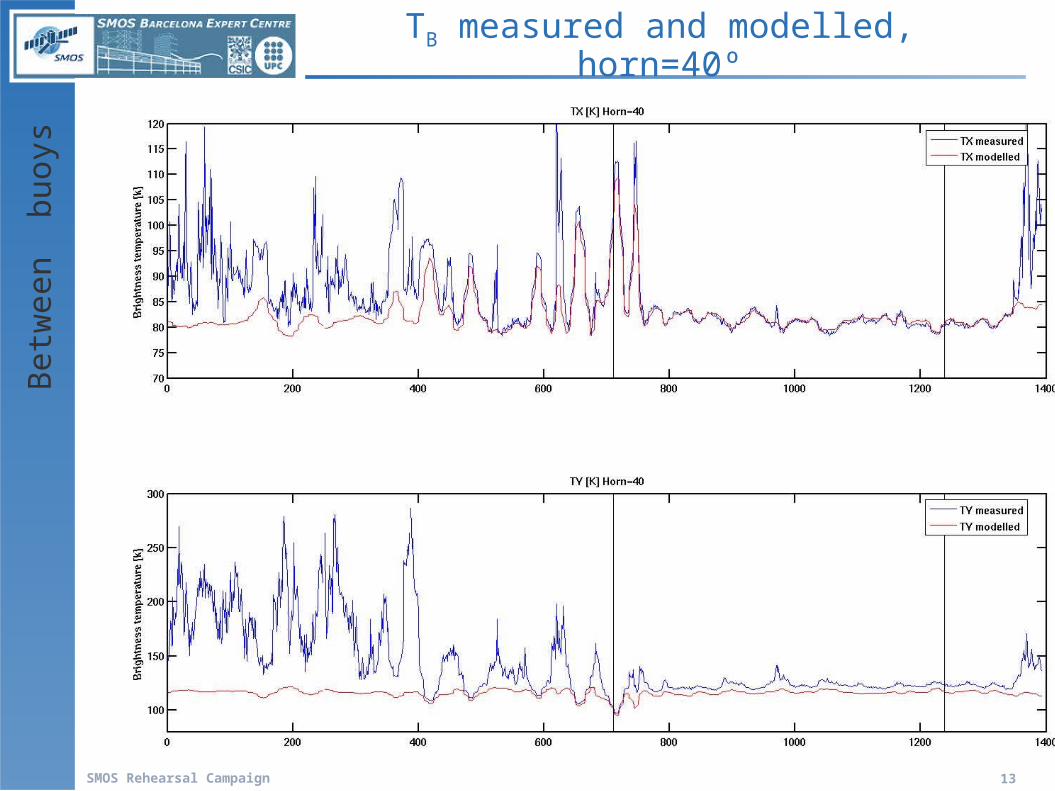
Flight between buoys
MFSTEP MFSTEP
Bet
wee
n b
uoys
SMOS Rehearsal Campaign 11
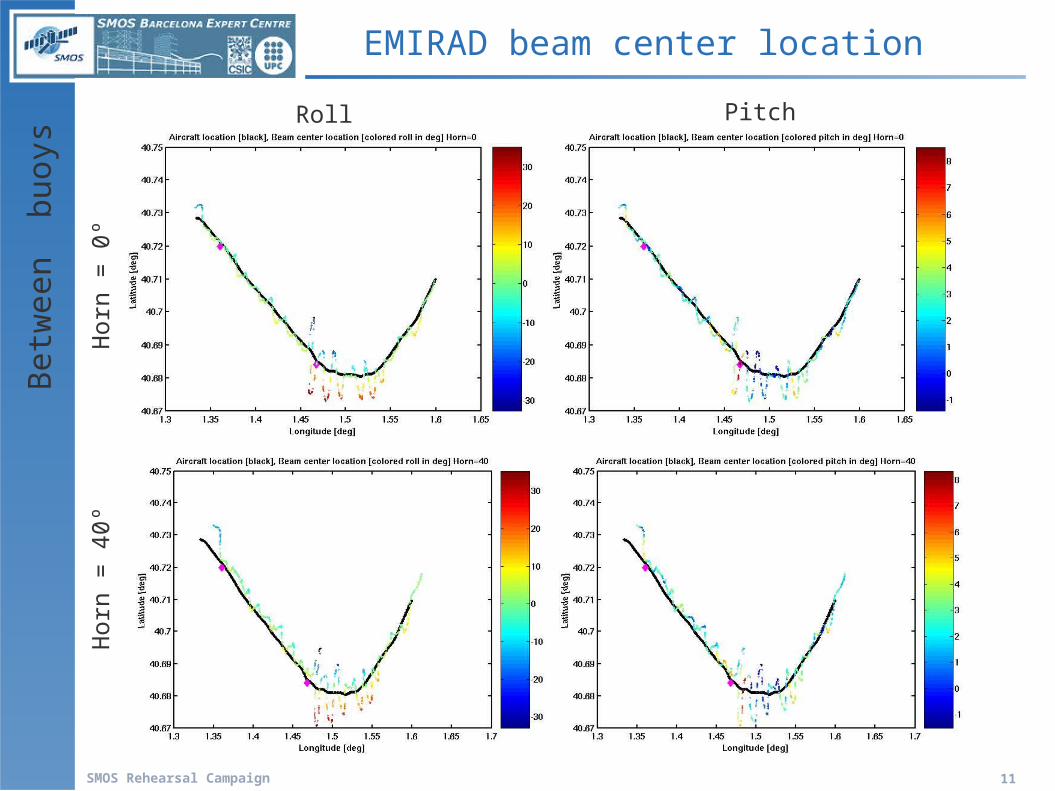
EMIRAD beam center locationB
etw
een
buo
ys
Hor
n =
0º
Hor
n =
40º
Roll Pitch
SMOS Rehearsal Campaign 12
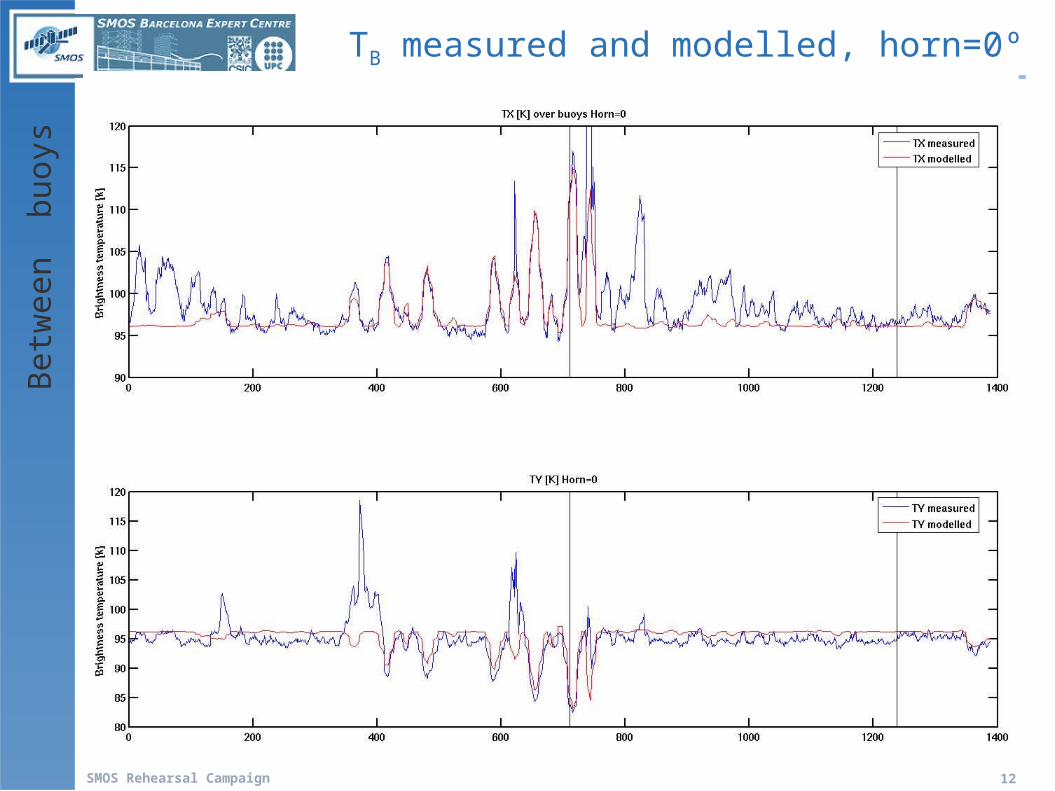
TB measured and modelled, horn=0ºB
etw
een
buo
ys
SMOS Rehearsal Campaign 13
Bet
wee
n b
uoys
TB measured and modelled, horn=40º
SMOS Rehearsal Campaign 14
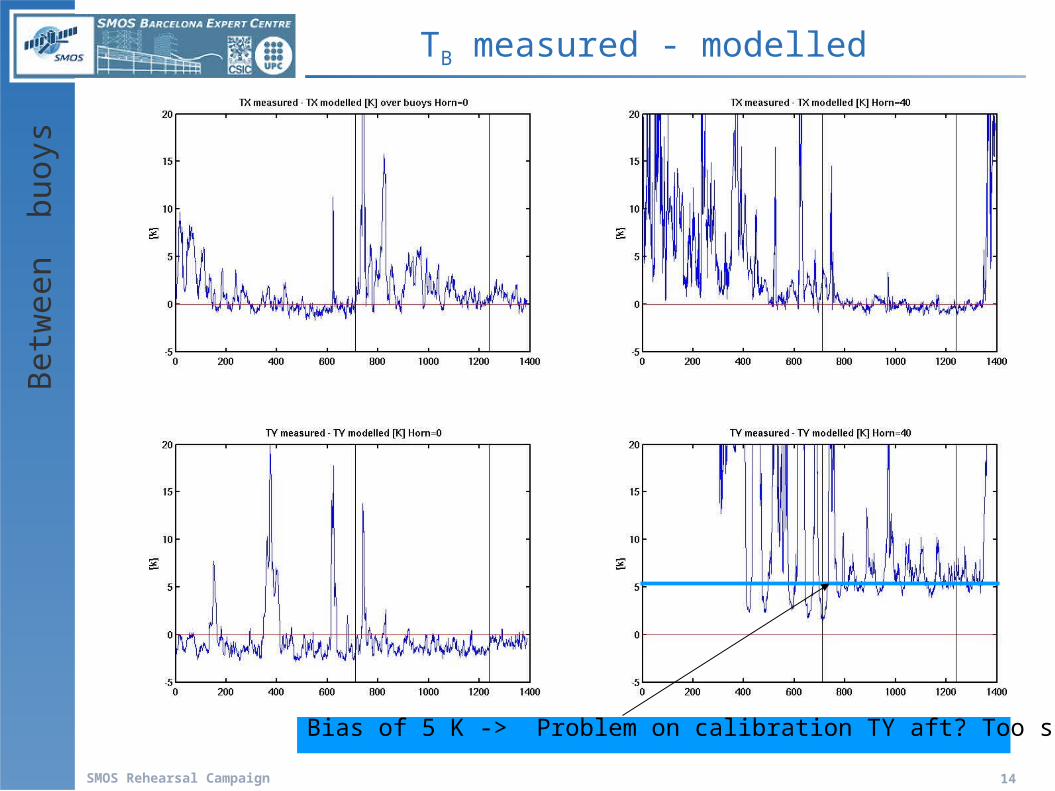
Bias of 5 K -> Problem on calibration TY aft? Too simple model?
TB measured - modelledB
etw
een
buo
ys
SMOS Rehearsal Campaign 15
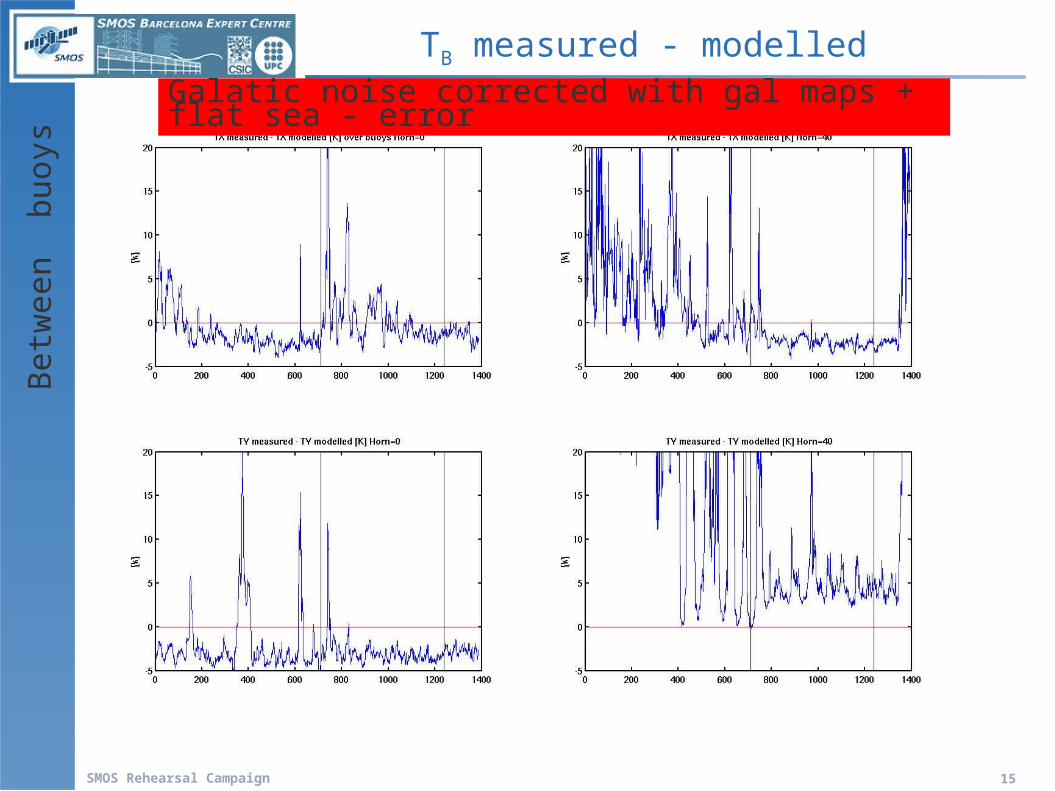
TB measured - modelledB
etw
een
buo
ys
Galatic noise corrected with gal maps + flat sea - error
SMOS Rehearsal Campaign 16
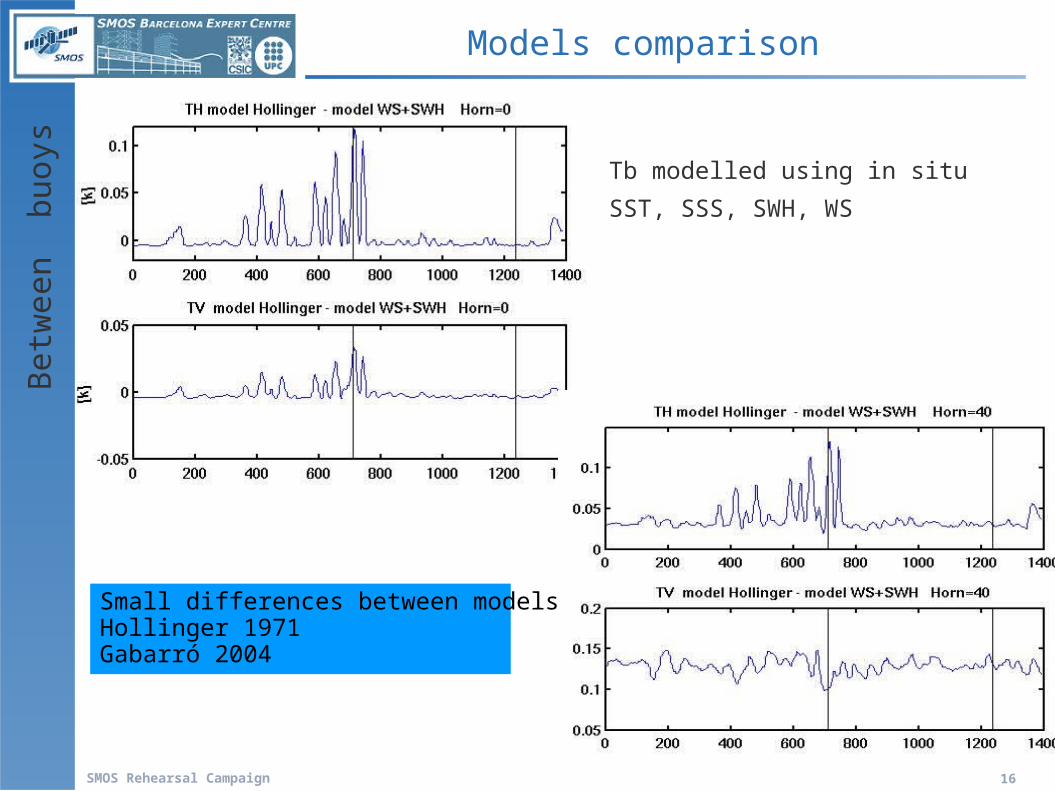
Small differences between models:Hollinger 1971Gabarró 2004
Models comparisonB
etw
een
buo
ys Tb modelled using in situ
SST, SSS, SWH, WS
SMOS Rehearsal Campaign 17
Flight from Marseille to buoys
SMOS Rehearsal Campaign 18
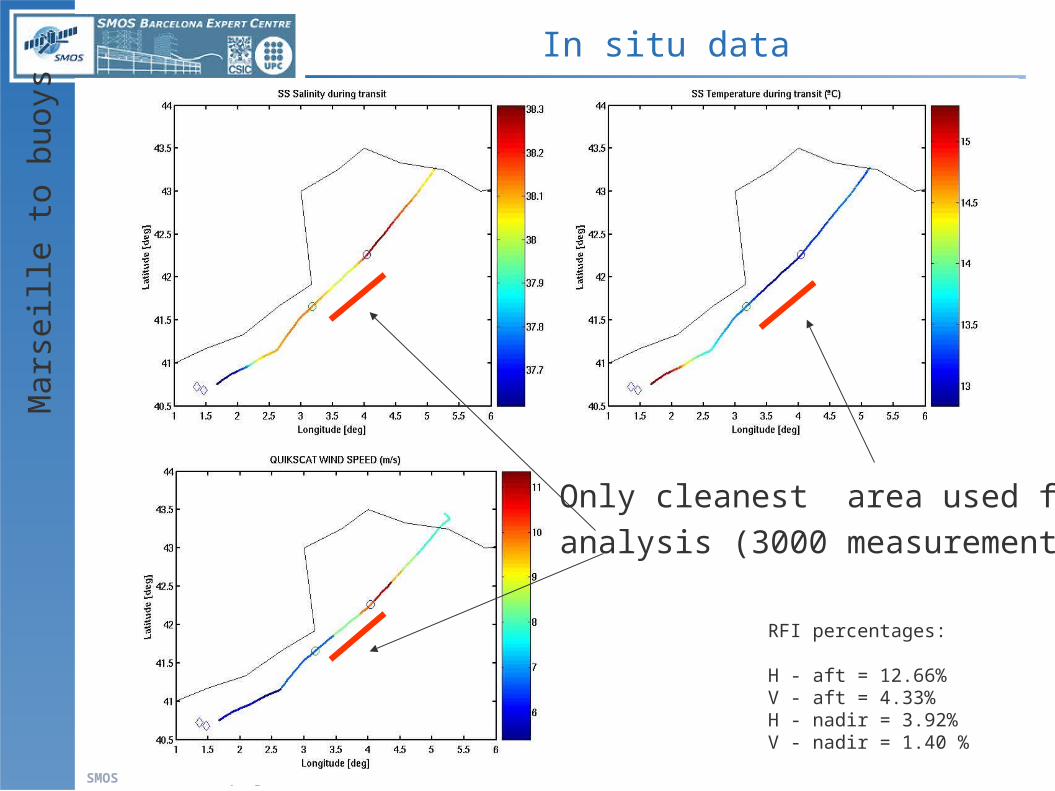
Only cleanest area used for
analysis (3000 measurements)
In situ dataM
arse
ille
to b
uoys
RFI percentages:
H - aft = 12.66%V - aft = 4.33%H - nadir = 3.92%V - nadir = 1.40 %
SMOS Rehearsal Campaign 19
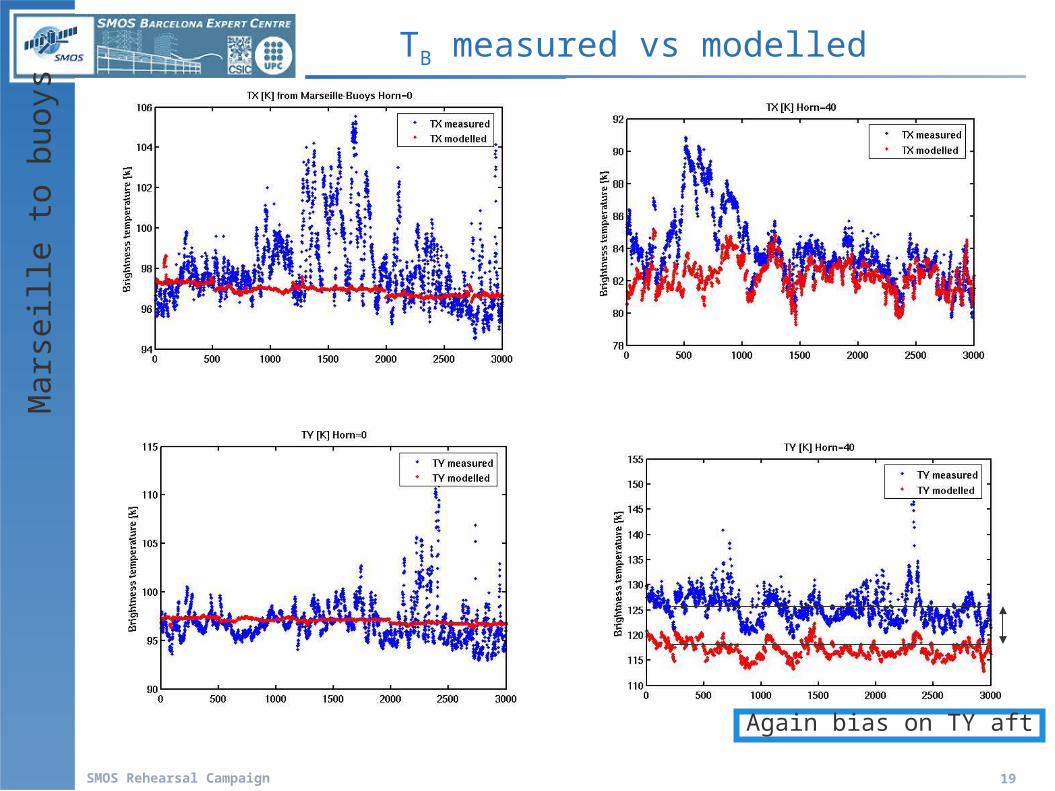
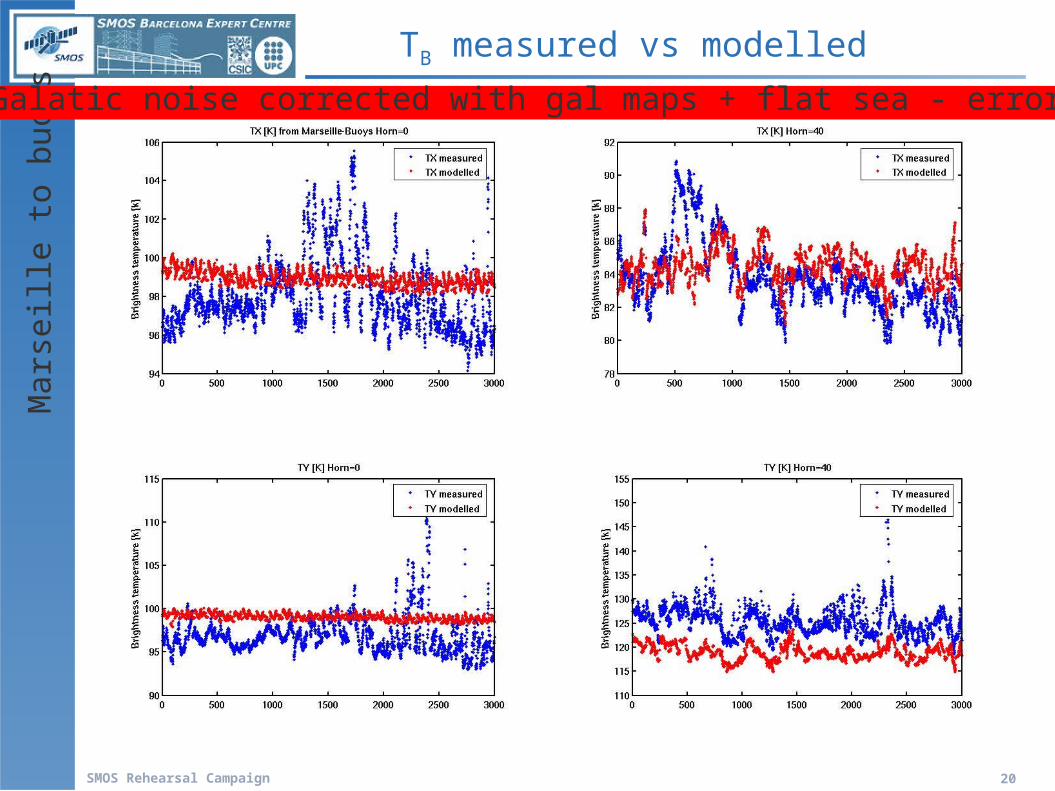
TB measured vs modelled
Again bias on TY aft
Mar
seill
e to
buo
ys
SMOS Rehearsal Campaign 20
TB measured vs modelled M
arse
ille
to b
uoys
Galatic noise corrected with gal maps + flat sea - error ?
SMOS Rehearsal Campaign 21
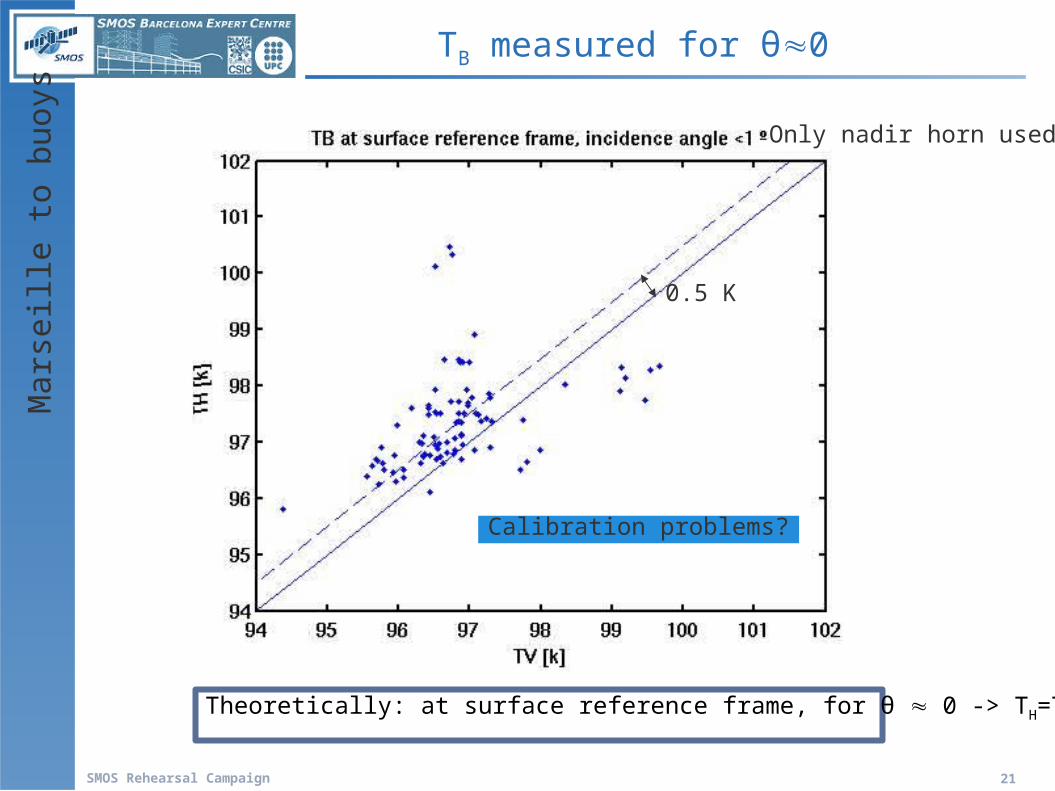
Theoretically: at surface reference frame, for θ 0 -> TH=TV
TB measured for θ0
Calibration problems?
Only nadir horn used
0.5 K
Mar
seill
e to
buo
ys
SMOS Rehearsal Campaign 22
Conclusions – EMIRAD over sea
An important bias appears on the aft V channel
antenna (~ 5 K) -> galactic noise??? Not accordance between TH & TV on θ0 (~ 0.5 K)
Important RFI and noise are detected (near Valencia)
Measured TB variability fits with modeled variability
WE NEED TO USE A REALISTIC MODELING OF
GALACTIC NOISE –> use a roughness model (not flat
sea) -> review which output from TRAP to use.
SMOS Rehearsal Campaign 23
INTERFEROMETRIC RADIOMETER
DATA – HUT 2D
Flights over the Gulf of Finland
August, 13th and 15th 2007
SMOS Rehearsal Campaign 24
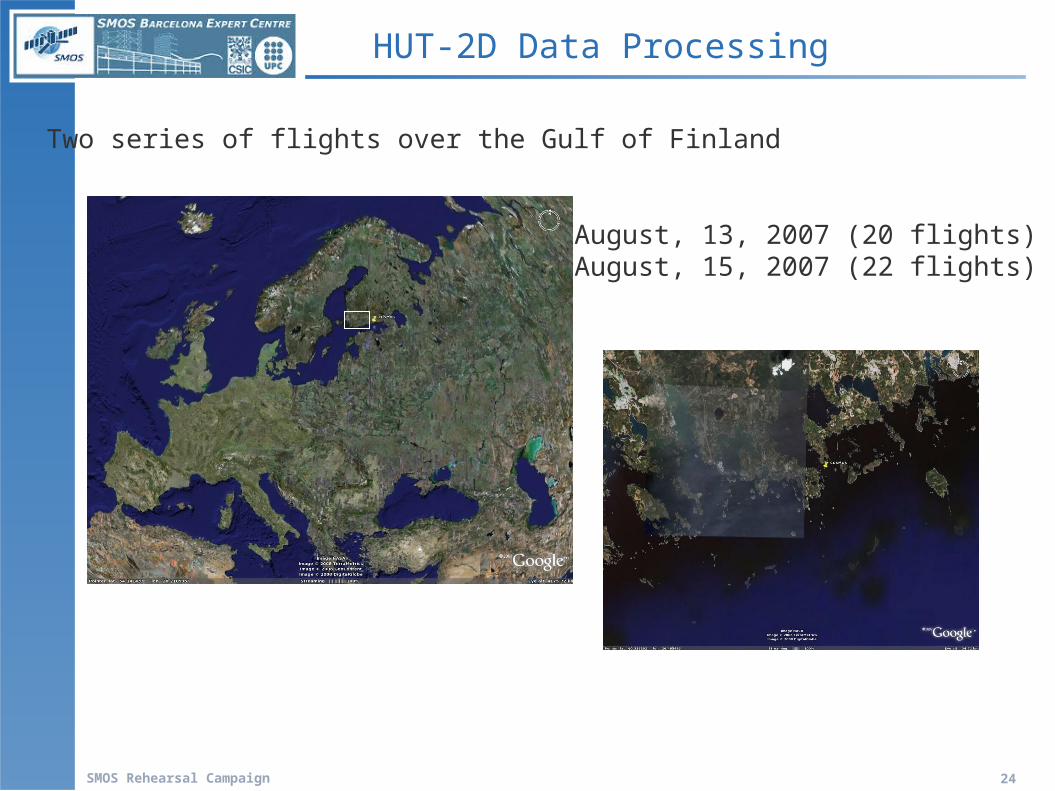
HUT-2D Data Processing
Two series of flights over the Gulf of Finland
August, 13, 2007 (20 flights) August, 15, 2007 (22 flights)
SMOS Rehearsal Campaign 25
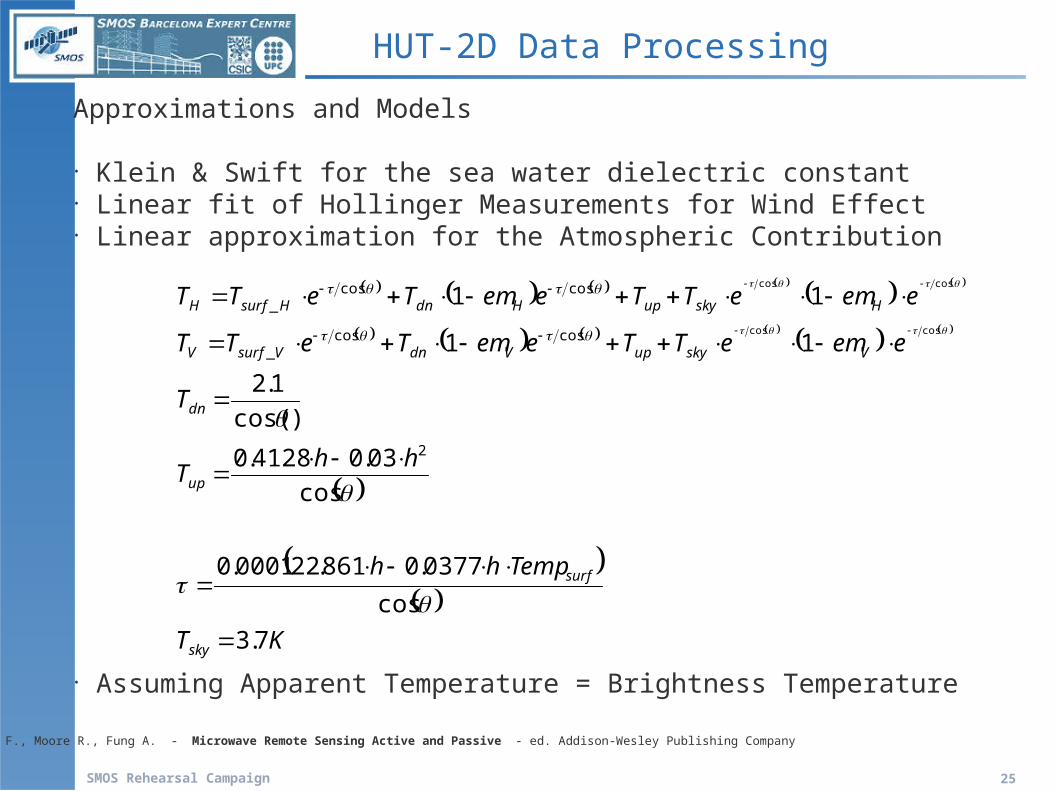
Approximations and Models
• Klein & Swift for the sea water dielectric constant• Linear fit of Hollinger Measurements for Wind Effect • Linear approximation for the Atmospheric Contribution
• Assuming Apparent Temperature = Brightness Temperature
KT
Temphh
hhT
T
eemeTTeemTeTT
eemeTTeemTeTT
sky
surf
up
dn
VskyupVdnVsurfV
HskyupHdnHsurfH
7.3
cos
0377.0861.220001.0
cos
03.04128.0
)cos(
1.2
11
11
2
coscos_
coscos_
coscos
coscos
Ulaby F., Moore R., Fung A. - Microwave Remote Sensing Active and Passive - ed. Addison-Wesley Publishing Company
HUT-2D Data Processing
SMOS Rehearsal Campaign 26
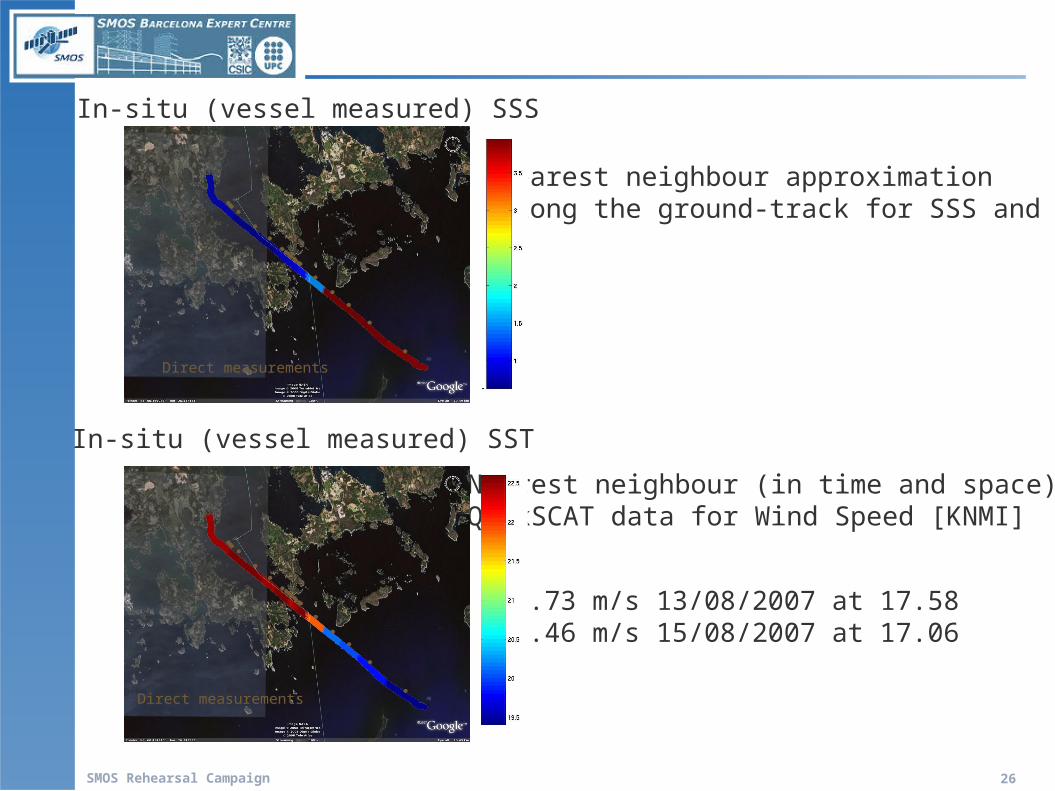
In-situ (vessel measured) SSS
Nearest neighbour approximationalong the ground-track for SSS and SST
Nearest neighbour (in time and space) QuikSCAT data for Wind Speed [KNMI]
3.73 m/s 13/08/2007 at 17.583.46 m/s 15/08/2007 at 17.06
Direct measurements
In-situ (vessel measured) SST
Direct measurements
SMOS Rehearsal Campaign 27
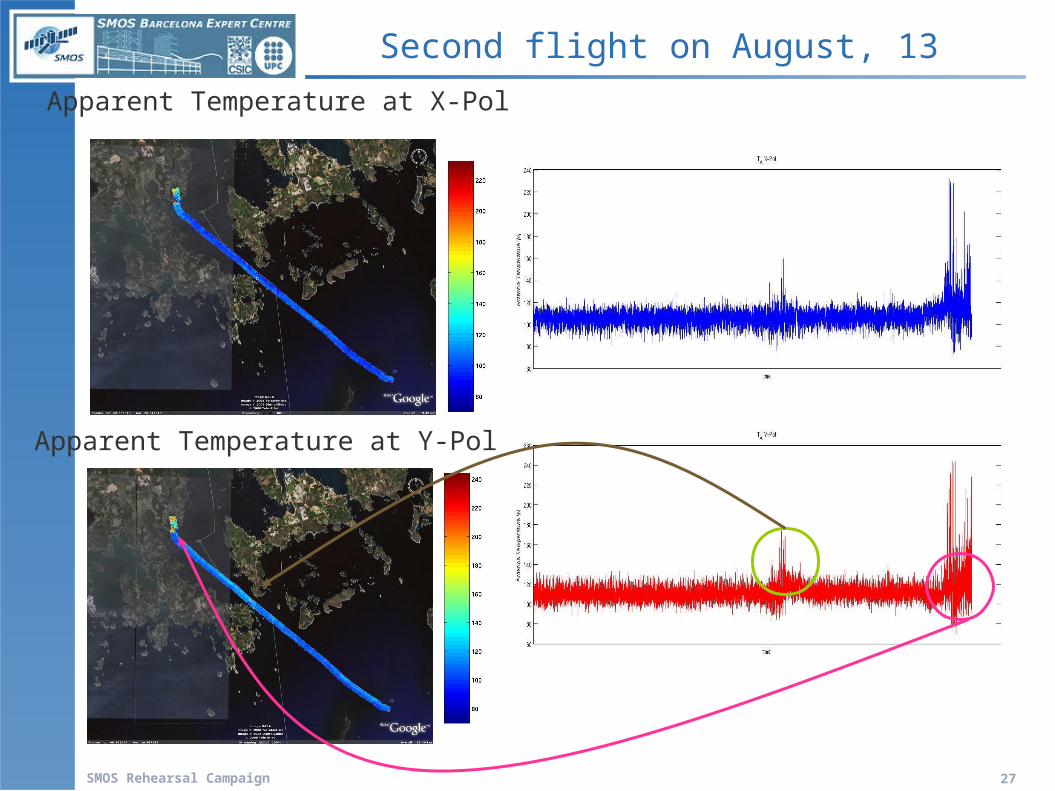
Apparent Temperature at X-Pol
Apparent Temperature at Y-Pol
Second flight on August, 13
SMOS Rehearsal Campaign 28
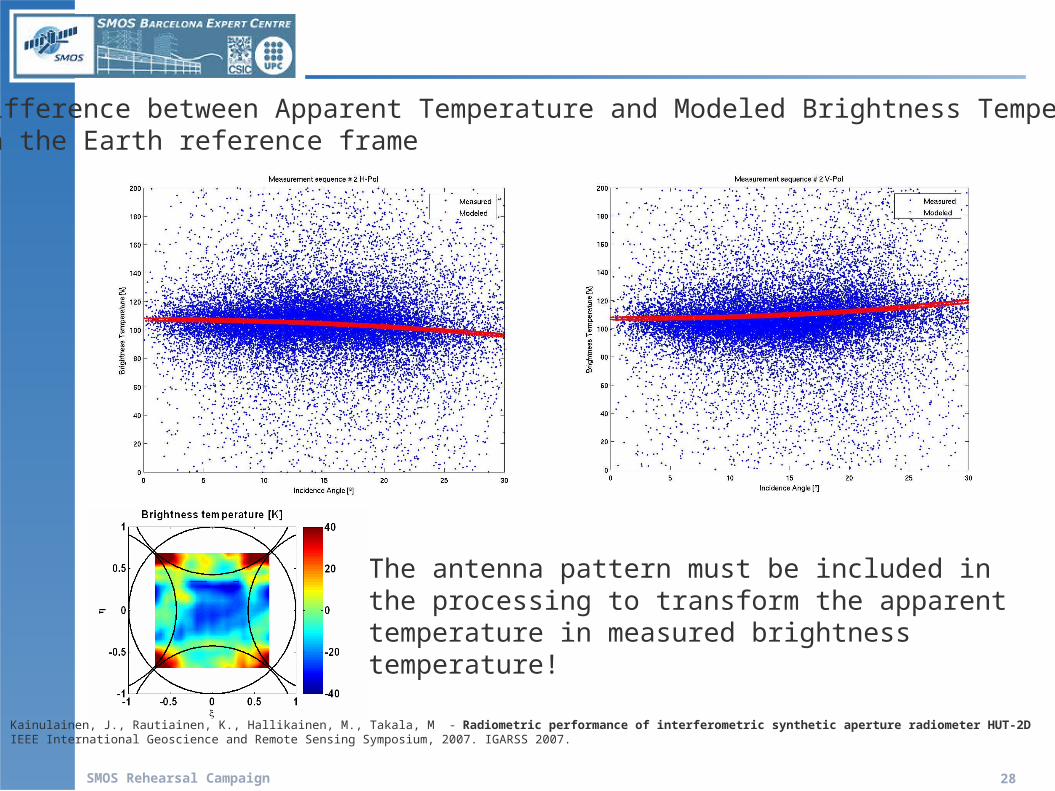
Difference between Apparent Temperature and Modeled Brightness Temperature in the Earth reference frame
The antenna pattern must be included in the processing to transform the apparent temperature in measured brightness temperature!
Kainulainen, J., Rautiainen, K., Hallikainen, M., Takala, M - Radiometric performance of interferometric synthetic aperture radiometer HUT-2D IEEE International Geoscience and Remote Sensing Symposium, 2007. IGARSS 2007.
SMOS Rehearsal Campaign 29
In order to make the SSS retrieval possible and reliable:
• Antenna pattern must be considered
• A previous selection of the measurements must be performed
• Better models for atmospheric and galactic contribution must be used
SMOS Barcelona Expert Centre (SMOS-BEC)Pg. Marítim de la Barceloneta 37-49, E-08003 Barcelona, SPAINTel. (+34) 93 230 95 00; Fax. (+34) 93 230 95 55URL: www.smos-bec.icm.csic.es
Recommended