Smart Control of Low Voltage Grids Christian Oerter, Nils Neusel-Lange
Wuppertal University – Institute of Power System Engineering
Germany
July 31st 2014
IEEE Power & Energy Society General Meeting 2014 Panel Session:
Advanced Modelling and Control of Future Low Voltage Networks
1

Current Challenges on Distribution Level
• Integration of decentralized generation units, especially due to the German “Energiewende”
• “Electrification” of air conditioning for buildings (heat pumps and air cons)
• Future integration of electric vehicles and storage units
• Increased capacity utilization, overloading possible
• Exceedance of the permitted voltage range
Voltage
Length of the line
Ur + 10%
72,1A 129,8A
187,6A
Overloading!
NAYY 4x50 SE Ith,max = 142A 10kV/0,4kV
St,r = 400kVA
2

Future Distribution Grids – conventional or smart?
Problem: Grid capacity bottleneck
Conventional grid expansion measures
Smart Grid
Solution: Intelligent grid expansion
Substitution
Technology Options: Ancillary Services Smart Outage Management Smart Market Condition Monitoring
Additional features
Technical and economical benefits
3
Monitoring and Control System for LV-grids
4

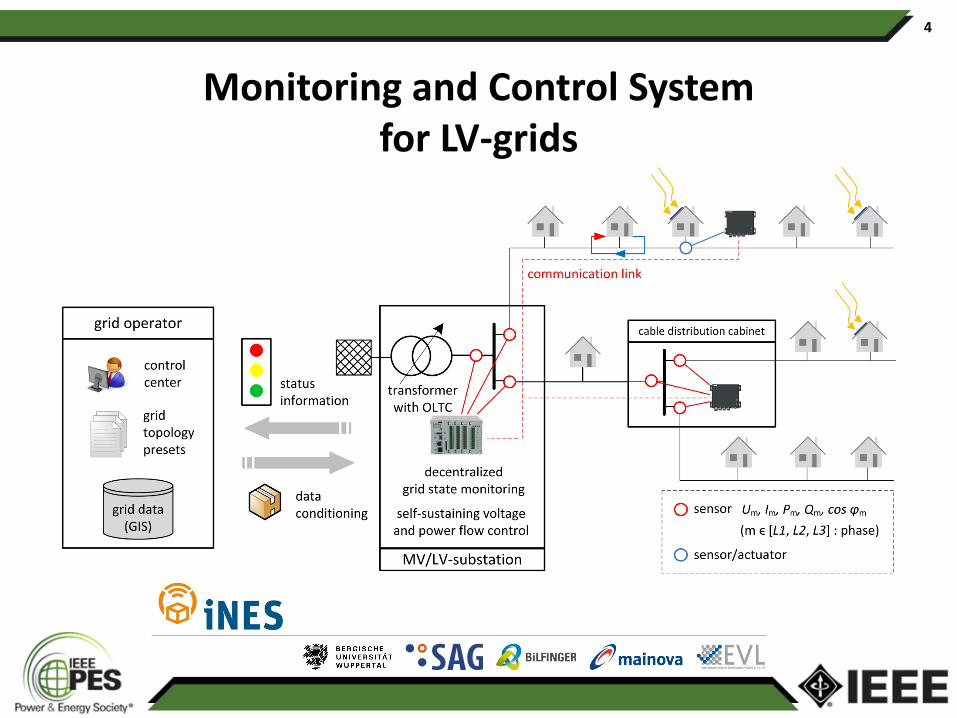
Monitoring and Control System for LV-grids
• Process sequence: – Cyclic operation
– Virtually real-time (10sec cycle interval)
• Optimization tasks: – Robustness
– Performance
• Main modules: – Grid State Identification
– Control Process
Grid State Identification
Control Demand Reset Demand
Update Process Values
System Initialization
Grid State Analysis
Control Process
Set Points
5

Monitoring of LV-grids
• Grid State Identification – Minimal sensor environment
due to cost efficiency
– Estimation of load and feed currents to compensate the lack of information
– Phase-selective power flow calculation
• Grid Topology Identification – During grid operation switching
operations can be necessary
– Grid State Identification depends on accurate topology for power flow calculations
– Automatic topology-change recognition
Topology II
Topology I
Low Voltage Grid State Identification
including predictive methods
Cycle Inputs:Slack-VoltageMeasured Branch Currents
uSlack , iBranch,Meas
Static Grid Parameters:TopologyTechnical Data
R’Branch X’Branch LBranch
Unique Grid State
uLoad , iBranch , sSlack
I/O parameters of the developed algorithm
6

Voltage and Power Control for LV-grids
• Combination of control facilities (actuators) for LV-grids, e.g. controllable transformers with OLTC, generation units, loads or storage units, in a consecutive, 3-stage control model – Avoidance of active power curtailment as long as possible!
– Active power curtailment necessary to resolve overloading conditions!
Ur +10%
Ur -10%
1st stage: controllable transformer
2nd stage: power factor control
3rd stage: active power control
1.
2. 3.
# nodes/line length
3-stage control model in an infeed-oriented scenario
7

Voltage and Power Control for LV-grids
• Influencing parameters on actuator effectivity: – Grid topology
– Position of the actuator within the grid
– Control range of the actuator
• Task for the control algorithm: Identification of the most suitable actuator to resolve a given critical grid state – Maximum effectivity of the actuator leads to minimum influence on
customers and decentralized generation units
– Compensation of customers/producers for curtailed active power by the grid operator
– German government consideration: 5% curtailment of the annual energy yield without compensation
8
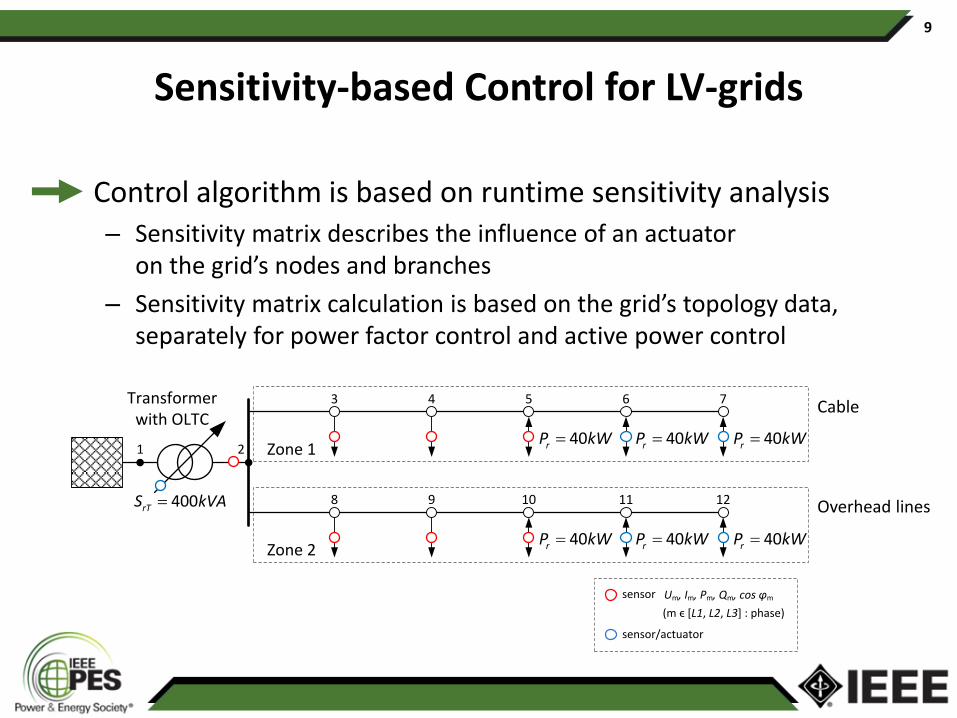
Sensitivity-based Control for LV-grids
• Control algorithm is based on runtime sensitivity analysis – Sensitivity matrix describes the influence of an actuator
on the grid’s nodes and branches
– Sensitivity matrix calculation is based on the grid’s topology data, separately for power factor control and active power control
Transformer with OLTC
400rTS kVA
40rP kW 40rP kW 40rP kW
40rP kW 40rP kW 40rP kW
Zone 1
Zone 2
1 2
3 4 5 6 7
8 9 10 11 12
sensor Um, Im, Pm, Qm, cos φm
(m ϵ [L1, L2, L3] : phase)
sensor/actuator
Cable
Overhead lines
9

Direct Control Strategy for LV-grids
• Characteristics: – Sequential process sequence
– Short cycle times
– 1 set point per cycle
– Multiple cycles for resolving critical grid states (where necessary)
Grid State Analysis
Grid State Identification
Update Process Values
System Initialization
Set Points
ControlProcess
Control Model Stage 1:Direct Voltage Control
Control Model Stage 2:Power Factor Control
Control Model Stage 3:Active Power Control
Control Demand Reset Demand
10

Optimized Control Strategy for LV-grids
• Characteristics: – Iterative process sequence
– Increased cycle times
– Multiple set points per cycle
– Resolving critical grid states within a single cycle (if technically possible)
Grid State Analysis
Grid State Identification
Update Process Values
System Initialization
Set Points
ControlProcess
Control Model Stage 1:Direct Voltage Control
Control Model Stage 2:Power Factor Control
Control Model Stage 3:Active Power Control
Set Point Verification
Control Demand Reset Demand
11

Virtual Measurements
Initialization
Smart Grid System(Virtual Entity)
Set Points
LV-Grid Simulator(Power Flow Calculation)
Scenario Setup
Node # Cycle #
Dev
iati
on
fro
m U
r [%
]
-15%
-10%
-5%
0%
5%
10%
15%
1
2
24
68
1012
-15
-10
-5
0
5
10
15
12
34
24
68
1012
-15
-10
-5
0
5
10
15
Node # Cycle #
Dev
iati
on
fro
m U
r [%
]
-15%
-10%
-5%
0%
5%
10%
15%
Simulation Results
• Comparison of both control strategies in case of an exceedance of the permitted voltage range
Optimized Control Strategy
Direct Control Strategy
1. Set point: OLTC 2. Set point : Power Factor 3. Set point : Power Factor
*12cos 0,95ind
2%U
*11cos 0,95ind
Simulation Environment
12
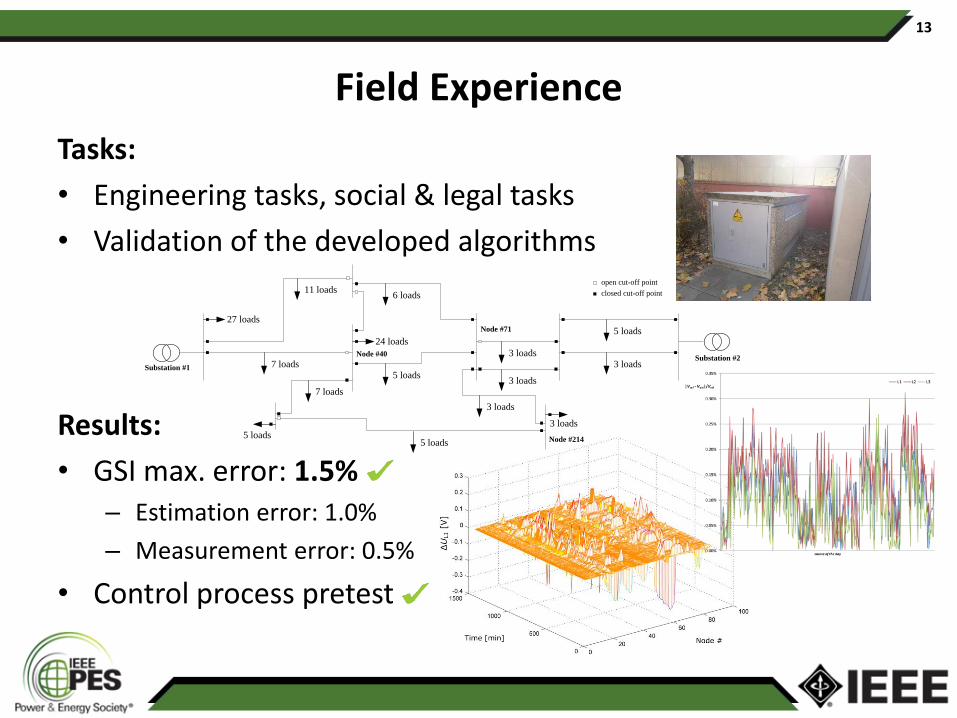
Field Experience
Tasks:
• Engineering tasks, social & legal tasks
• Validation of the developed algorithms
Results:
• GSI max. error: 1.5% – Estimation error: 1.0%
– Measurement error: 0.5%
• Control process pretest
27 loads
7 loads
11 loads6 loads
5 loads
3 loads
3 loads
5 loads
3 loads
3 loads
5 loads
7 loads
5 loads
24 loads
Substation #1
Substation #2
3 loads
Node #40
Node #214
Node #71
open cut-off point
closed cut-off point
13

Conclusion
• Cost-effective system, minimum of components
• Avoidance of critical grid states
• Better utilization of existing grid capacity
• Avoidance/Delay of expensive grid expansion measures
• Extension for MV-grid application under development
Lessons learned from field application:
• Smart Meters not useable as measurement devices a.t.m.
• Compensation of customers for curtailed active power
• Experience with power line communication technology
• Developed algorithms worked reliable in first tests – tuning and adaption for further improvement
14
Recommended