
Small-scale Farmer Managed Aquaculture Trials in Raichur District, Karnataka State, India. Principles of back-yard aquaculture.
Richard Newton Institute of Aquaculture Stirling University
Principles
Background
"Back-yard aquaculture" was first developed in Bangladesh in an attempt to alleviate poverty and to
provide a source of animal protein in an area where protein intake is very low. Essentially, back-yard
aquaculture strives to use minimal inputs to achieve high yields.
Back yard aquaculture uses small lm2 by lm deep ponds that are either plastic lined ditches or constructed
from brick and water-proofed cement. This is to minimise water loss through seepage. whereas brick and
cement ponds are more expensive (about five times the cost of plastic lining in India), they are also much
more durable. Plastic lined ditches are extremely prone to damage resulting in rapid loss of the water.
Subsequent replacement also results in stress to the fish and it may be weeks before the pond achieves
its previous primary productivity level as phytoplankton levels re-establish themselves. As the ponds are
so small, they are especially prone to stagnation and therefore, the African catfish, Clarius gariepinus is
used, a species that is highly tolerant to poor water quality, including low oxygen concentration, high
ammonia levels and high temperatures. This is especially important as the fish are fed a diet mainly
consisting of kitchen slops supplemented with locally available food items. Any wasted food can rapidly
build up and lead to anoxic conditions. In the initial Bangladeshi trials, snails were found in abundance
and provided a good protein source resulting in high growth rates, SGR = 2.55% starting with 4g fry and
harvesting at a mean weight of 100g (Marttin 2000). A growth rate such as this means that two batches of
marketable size fish can be grown per year. It is also thought that feed supplementation improved the
fish's appetite for the poorer quality kitchen waste meaning less build up in the ponds. The high tolerance
of Clarius means that the greenness and thus the primary productivity of the pond can be encouraged,
using organic fertilisers, to much higher levels than in other culture systems. This is because the
aborescent organ of Clarius allow it to breathe the air directly and it can therefore survive times when
oxygen levels can be as low as from 0 to 3 p.p.m., which can be common in the morning in highly
productive systems. This, together with the achievable high growth rates, make Clarius an excellent
species for this system of aquaculture (Viveen et al 1986).
Although the fish are tolerant to high water temperatures, upwards of 30°C, the ponds are usually
sheltered in an attempt to limit evaporative losses and also to protect the fish from UV radiation. This
however is a trade off when compared to possible losses in primary production and in some
circumstances it may be better to remove the shelter entirely. This will depend on how green the water is
already (as high turbidity results in low UV penetration) and also individual circumstances with
evaporative losses. Some people may not have good access to fresh water and therefore find frequent
water replacement too difficult. It is also, therefore, desirable to maintain relatively good water quality.
Although tolerant to poor water quality, Clarius may suffer in sub- lethal ([NH3]<0.05 p.p.m_) conditions
(Viveen et al 1986). High ammonia levels for example have been reported to result in poor growth rates
in the channel catfish, a similar species to Clarius (Boyd 1979). Overfeeding should therefore be
minimised and diet supplementation as an appetite stimulator as well as a growth enhancer should be
included wherever possible (Murray 2000). Fertilisation to encourage primary production must also be
regulated carefully. The pond is covered with a mesh made from a wooden frame and chicken wire. This
is to prevent predation by birds and frogs especially, to prevent escape of the fish and also as a safety
feature, preventing small children and animals from falling in. The ponds should also be fitted with
drainage systems also with a mesh to prevent escape during flood events. In Bangladesh, incidents of
Clarius escaping have caused sufficient concern for their introduction to be discouraged although their
exact impact on native species is unknown (O'Riordan 1992).
The nature of this system of aquaculture is such that women especially, but also children can be the
main participants as part of their daily routine, realising that these people often have many household
chores and responsibilities. Marttin (2000) estimated that approximately one hour was needed to tend the
pond and feed the fish per day in the Bangladeshi trial. This includes preparation of the diet and collection
of locally available food items. The feed consists of food waste but this may then be mixed with rice bran
and flour plus collection of feed items and water replacement or exchange can be time consuming. In the
Bangladeshi trial, snails were an abundant source of protein, however in Raichur district, snails were

uncommon but it is hoped that this small scale system may be employed in this much more arid
environment using the same principles of low input, using only local resources and minimum time and
expenditure.
References
Boyd C.E., 1979. Water quality in warm water fish ponds. Auburn University Agriculture Experiment Station. Printed by Craftmaster Printers, Inc. Opelika, Alabama. Marttin F., de Graaf G., 2000. Poverty alleviation through homestead catfish culture in Bangladesh. DFID/NACA online workshop. Murray F., 2000. Small scale farmer managed aquaculture trials in Raichur district, Karnataka state, India, "Mid-term progress report and back to the office report 4". Aquaculture in smallscale farmer managed irrigation systems. DFID Aquaculture Research programme,(ARP) Project R7064. O' Riordan B., 1992. NGOs in Bangladesh fishculture workshop, Strategies towards benefiting the poor. Association of Development Agencies in Bangladesh and Intermediate Technology Development Group. ITDG, Dhaka, Bangladesh. Viveen W.J.A.R., Richter C.J.J., van Oordt P.G.W.J.,Janssen J.A.L., Huisman E.A., 1986. Practical manual foor the culture of the African Catfish (Clarius gariepinus). Joint Publication of General International Cooperation of the Ministry of Foreign Affairs, The Hague, Netherlands; Department of Fish Culture and Fisheries of the Agricultural University of Wageningen, the Netherlands; Research Group for Comparative Endocrinology, Department of Zoology of the University of Utrecht, the Netherlands.

Small-scale Farmer Managed Aquaculture Trials in Raichur District, Karnataka State, India
Nutrition, water quality and micro-irrigation trials report.
1 Feb - 15 Apr 2001
Richard Newton
Institute of Aquaculture Stirling University
1 Background
This report follows on directly from the "Mid term progress report No. 4" and is in response to the
findings contained in the same. The aim of these trials was to assess the problems which had been faced
in the on-farm trials and to try to provide solutions with respect to nutrition and water quality. At all
times, any solutions should be within the reach of the farmers in terms of time, labour, expense,
availability of local resources and also any moral attitudes that they may have.
2 On-farm backyard catfish trials
i. Nutrition
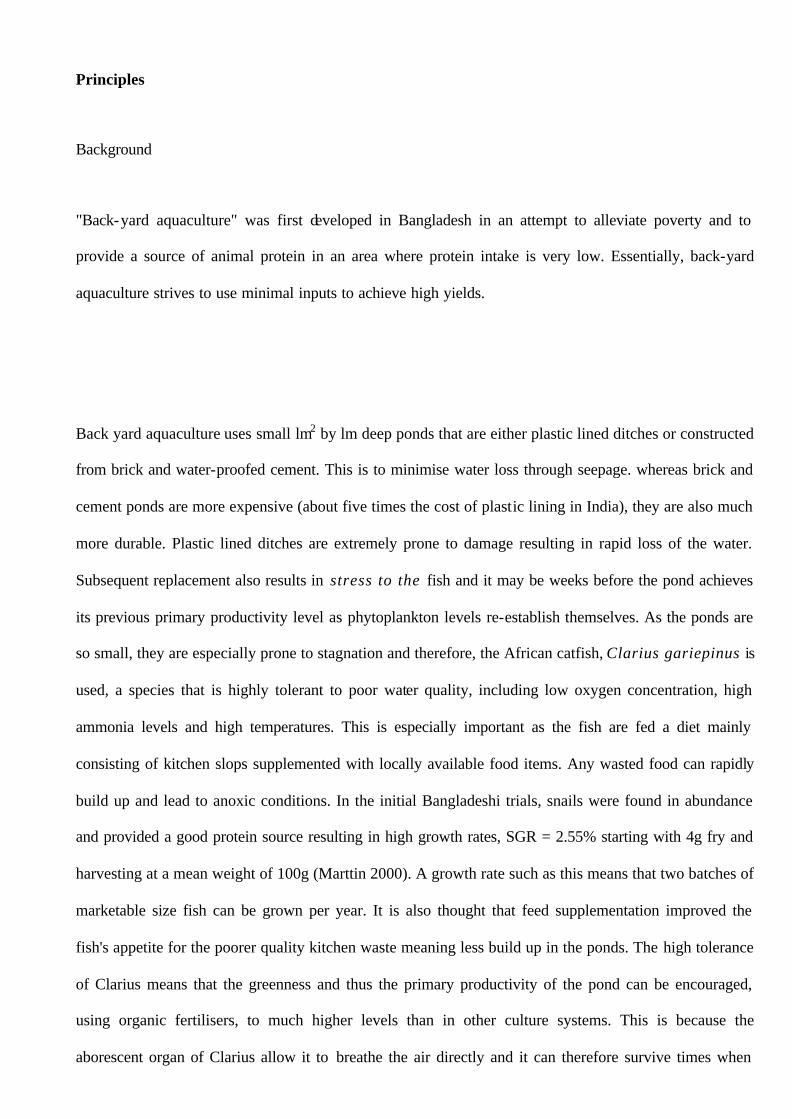
The situation at the beginning of the trials on-farm was disappointing with many of the
farms failing completely and others showing negative growth. Many of the surviving
fish showed a pinhead appearance (Murray 2000). The two main areas of husbandry that
utilised were principally plain cooked rice
supplemented with finger-millet roti or
uncooked bajara waste (husk and broken
gain), rice and finger millet flour. Also some
farmers were feeding "Jaggery flour", a school
children's food supplement which contains
approximately 12% crude protein. It is
thought that these dry diets, low in protein,
resulted in a constipated condition of the fish
and eventually lead to a rupturing of the
stomach wall and death. Also these poor diets
Evoked a poor feed response and food tended
to be dumped in the pond, which subsequently
sank
Photo 1. Chpcaid.Suwaiiadenmnstratioufann,
to the bottom and contributed to the poor water quality. One participant found that the addition of insects
prior to feeding the poorer quality feed attained a better feed response and this indicated that some sort of
appetite stimulator, suc h as insects, may be necessary. Some participants had expressed a willingness to make
use of the abundant frogs which are available locally and it was these two findings which formed the basis of
the on-station nutrition trials. (Murray 2000).
ii. Water quality
It was felt prior to the beginning of these trials that water quality played an important role in the failure of the
on-farm trials and visits to farms in Bingeradoddi confirmed this to some degree. The pond at the first farm
visited contained black, smelly water with a visibility of about 5cm. The fish were being fed large quantities
of plain cooked rice. It is thought that this was being largely untouched and that the quality of the water may
be a factor in the fish's lack of appetite and this in turn was leading to more waste and even poorer water
quality. It was also found that because of a lack of growth that the farmers were losing interest in performing
the required water exchange necessary to maintain adequate water quality. Many farmers did not have access
to an open well and had to carry water from a hand pump, which is both time consuming and hard work.
Many farmers did not want to exchange the water because it was felt that it was a waste of a precious
resource, however they were provided with some plants from the Samuha nursery to be watered with the
exchange water so that this water was not wasted. This formed the basis for the micro- irrigation trials
performed in parallel with the on-station nutrition trials and water quality measurements. 3. On-station Nutrition trials On the basis of the previous findings, it was deemed necessary to set up some controlled nutrition trials to
assess the required feed inputs to achieve the required growth rates to attain marketable
sized fish within six months. It was estimated that an SGR of around 2.5 would be required to achieve this, with
a mean start weight of around 6 grammes and a mean final weight of around 100 grammes with a stocking
density of between forty and fifty fish in the l m3 ponds and an expected mortality of 20%. This would provide
an overall biomass of between 4 and 5kg. Previous work estimated the protein requirements for African catfish
at between 28 and 32 percent of dietary intake (Sadiku 1995), full details of requirements can be seen in the
appendices. Trials were set up on the basis of locally available foodstuffs that could be collected readily at
minimal cost, effort and that was deemed acceptable to the farmers. As the trial progressed certain features
were changed as to try to achieve the best results, however each of the replicates within each of the treatments
received the same conditions as far as possible. Twelve brick and cement lined ponds were provided for the use
of this trial of approximate dimensions 1 mx 1 mx 1 m. Each pond was water proofed to cut out any seepage
and each pond was provided with a shelter to protect the fish from UV radiation and to decrease evaporative
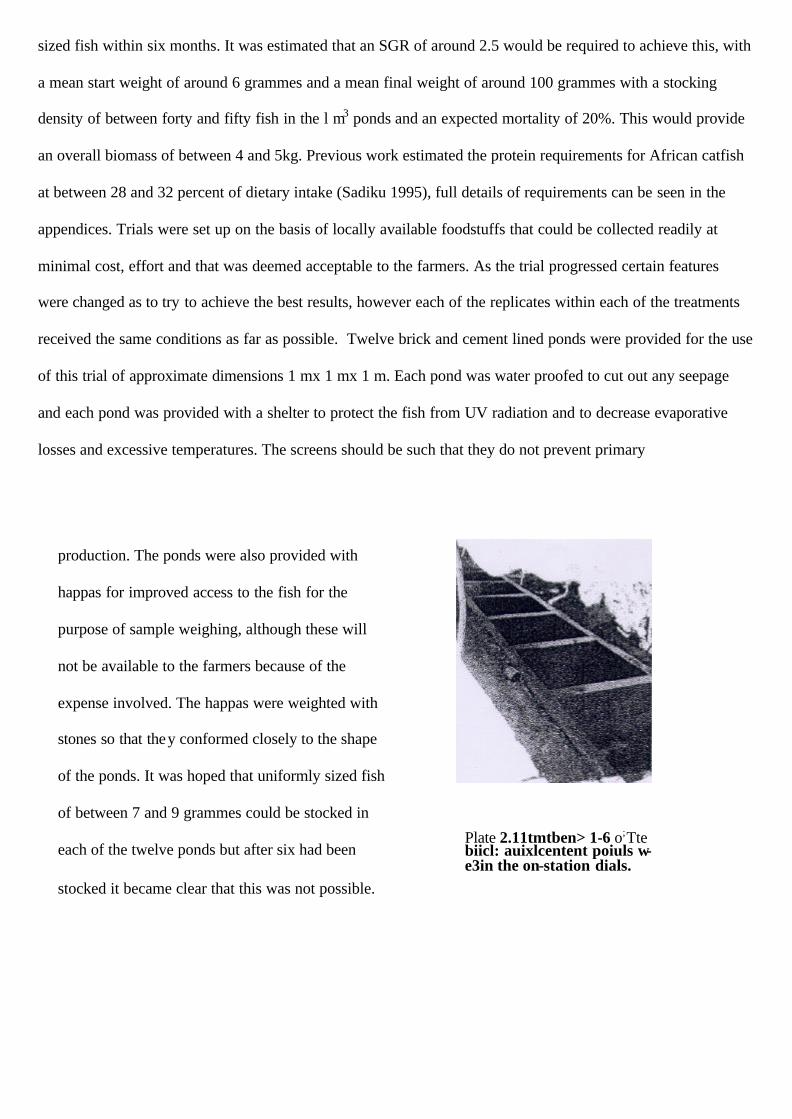
losses and excessive temperatures. The screens should be such that they do not prevent primary
production. The ponds were also provided with happas for improved access to the fish for the
purpose of sample weighing, although these will
not be available to the farmers because of the
expense involved. The happas were weighted with
stones so that they conformed closely to the shape
of the ponds. It was hoped that uniformly sized fish
of between 7 and 9 grammes could be stocked in
each of the twelve ponds but after six had been
stocked it became clear that this was not possible.
Plate 2.11tmtben> 1-6 o;Tte biicl: auixlcentent poiuls w-e3in the on-station dials.
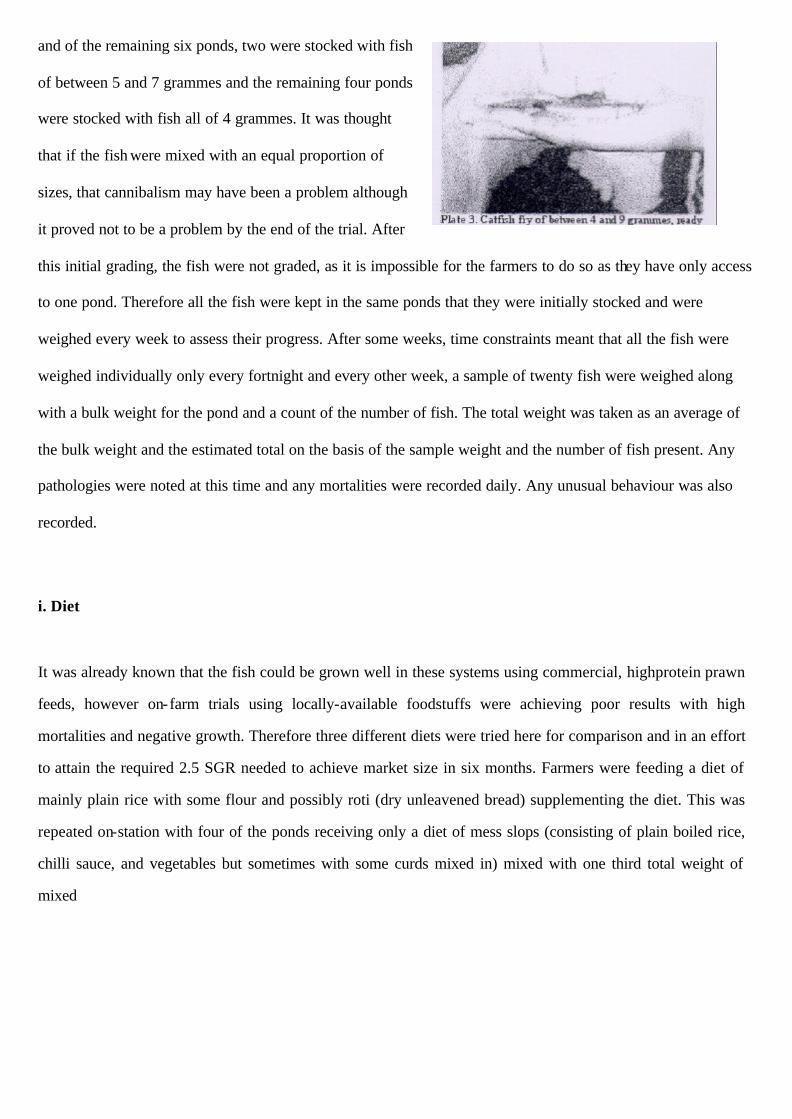
and of the remaining six ponds, two were stocked with fish
of between 5 and 7 grammes and the remaining four ponds
were stocked with fish all of 4 grammes. It was thought
that if the fish were mixed with an equal proportion of
sizes, that cannibalism may have been a problem although
it proved not to be a problem by the end of the trial. After
this initial grading, the fish were not graded, as it is impossible for the farmers to do so as they have only access
to one pond. Therefore all the fish were kept in the same ponds that they were initially stocked and were
weighed every week to assess their progress. After some weeks, time constraints meant that all the fish were
weighed individually only every fortnight and every other week, a sample of twenty fish were weighed along
with a bulk weight for the pond and a count of the number of fish. The total weight was taken as an average of
the bulk weight and the estimated total on the basis of the sample weight and the number of fish present. Any
pathologies were noted at this time and any mortalities were recorded daily. Any unusual behaviour was also
recorded.
i. Diet
It was already known that the fish could be grown well in these systems using commercial, highprotein prawn
feeds, however on-farm trials using locally-available foodstuffs were achieving poor results with high
mortalities and negative growth. Therefore three different diets were tried here for comparison and in an effort
to attain the required 2.5 SGR needed to achieve market size in six months. Farmers were feeding a diet of
mainly plain rice with some flour and possibly roti (dry unleavened bread) supplementing the diet. This was
repeated on-station with four of the ponds receiving only a diet of mess slops (consisting of plain boiled rice,
chilli sauce, and vegetables but sometimes with some curds mixed in) mixed with one third total weight of
mixed
rice bran and flour. The other two treatments (four ponds
each) received this kitchen waste along with a
supplementation of either insects or frog meat mixed into
the diet although this depended a great deal on availability,
initially. As the sizes of the fish varied between the ponds,
the type of diet was assigned to the ponds randomly to try to
achieve similarity between the treatments, although some
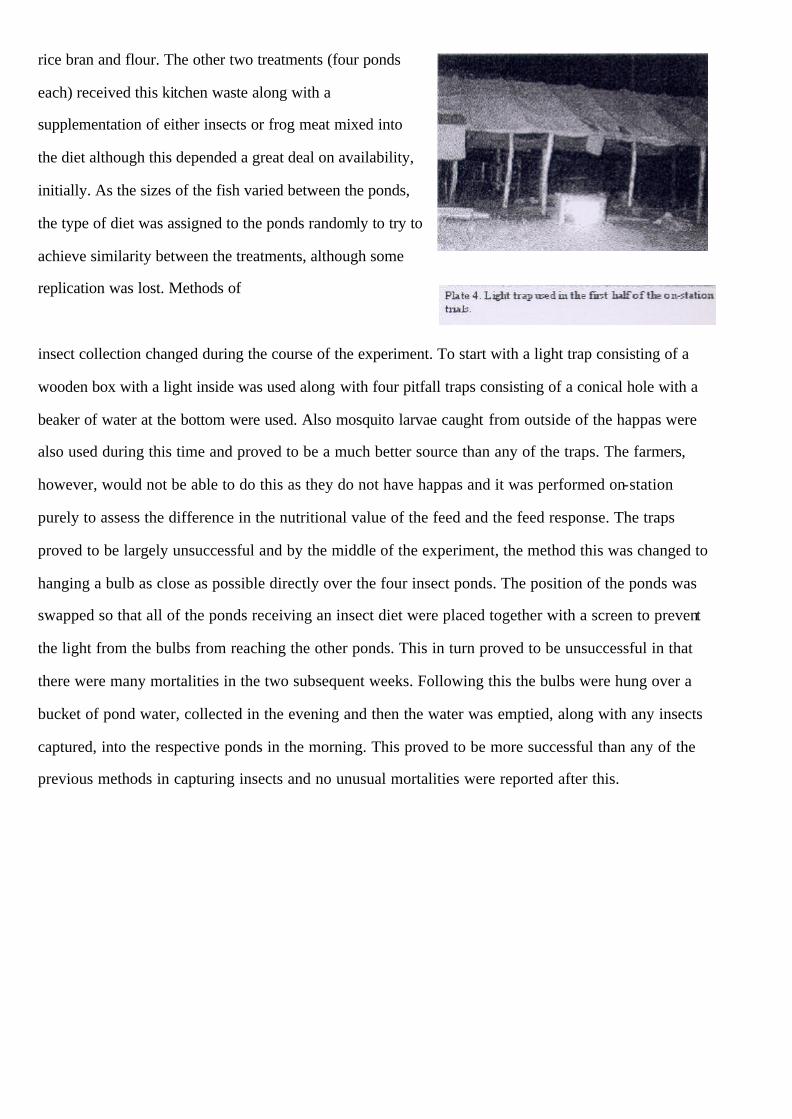
replication was lost. Methods of
insect collection changed during the course of the experiment. To start with a light trap consisting of a
wooden box with a light inside was used along with four pitfall traps consisting of a conical hole with a
beaker of water at the bottom were used. Also mosquito larvae caught from outside of the happas were
also used during this time and proved to be a much better source than any of the traps. The farmers,
however, would not be able to do this as they do not have happas and it was performed on-station
purely to assess the difference in the nutritional value of the feed and the feed response. The traps
proved to be largely unsuccessful and by the middle of the experiment, the method this was changed to
hanging a bulb as close as possible directly over the four insect ponds. The position of the ponds was
swapped so that all of the ponds receiving an insect diet were placed together with a screen to prevent
the light from the bulbs from reaching the other ponds. This in turn proved to be unsuccessful in that
there were many mortalities in the two subsequent weeks. Following this the bulbs were hung over a
bucket of pond water, collected in the evening and then the water was emptied, along with any insects
captured, into the respective ponds in the morning. This proved to be more successful than any of the
previous methods in capturing insects and no unusual mortalities were reported after this.
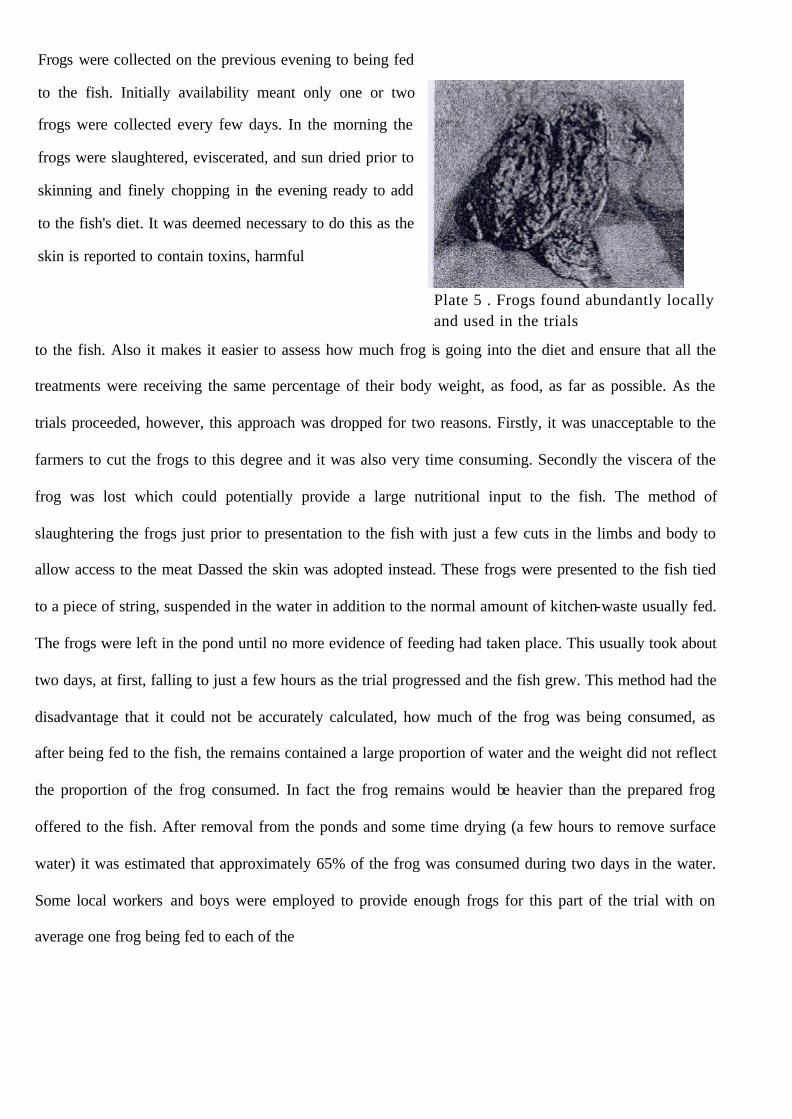
Frogs were collected on the previous evening to being fed
to the fish. Initially availability meant only one or two
frogs were collected every few days. In the morning the
frogs were slaughtered, eviscerated, and sun dried prior to
skinning and finely chopping in the evening ready to add
to the fish's diet. It was deemed necessary to do this as the
skin is reported to contain toxins, harmful
Plate 5 . Frogs found abundantly locally and used in the trials
to the fish. Also it makes it easier to assess how much frog is going into the diet and ensure that all the
treatments were receiving the same percentage of their body weight, as food, as far as possible. As the
trials proceeded, however, this approach was dropped for two reasons. Firstly, it was unacceptable to the
farmers to cut the frogs to this degree and it was also very time consuming. Secondly the viscera of the
frog was lost which could potentially provide a large nutritional input to the fish. The method of
slaughtering the frogs just prior to presentation to the fish with just a few cuts in the limbs and body to
allow access to the meat Dassed the skin was adopted instead. These frogs were presented to the fish tied
to a piece of string, suspended in the water in addition to the normal amount of kitchen-waste usually fed.
The frogs were left in the pond until no more evidence of feeding had taken place. This usually took about
two days, at first, falling to just a few hours as the trial progressed and the fish grew. This method had the
disadvantage that it could not be accurately calculated, how much of the frog was being consumed, as
after being fed to the fish, the remains contained a large proportion of water and the weight did not reflect
the proportion of the frog consumed. In fact the frog remains would be heavier than the prepared frog
offered to the fish. After removal from the ponds and some time drying (a few hours to remove surface
water) it was estimated that approximately 65% of the frog was consumed during two days in the water.
Some local workers and boys were employed to provide enough frogs for this part of the trial with on
average one frog being fed to each of the
four replicates every few days but this increasing as frogs became more available and
the fish grew. Larger frogs or two smaller frogs were fed to the ponds with larger
biomasses in an effort to keep with providing the same percentage of feed to biomass
ratio. It was assumed that as the frog proportion of the diet was increased, that the
kitchen-waste proportion would decrease, however it was found that the frog
availability was still too low and that no adverse affects due to over- feeding,
including constipation and poor water quality were being reported whilst kitchen
waste and frogs were being fed. The amount of frog being consumed was estimated
on the basis that 65% of the frog was eaten and this was accounted for when
calculating FCR's.
Initially it was thought that all of the ponds would be fed ad libitum, however this would
not provide information as to the quality of diets in terms of growth rate but only
palatability and replication would be lost. Therefore all of the ponds were fed the same
amount as a proportion of their body weight every day. On the first two days the fish
were fed 15% in one feed as they had been held for some time without feeding. This
however resulted in some mortalities similar to those described in the "Mid-term and
back to the office report No.4" with a constipated appearance and distended bellies
(Murray 2000). The feed was then dropped to 5% a day for two days, which resulted in a
few deaths due to cannibalism (four in one pond). In response the feed was increased to
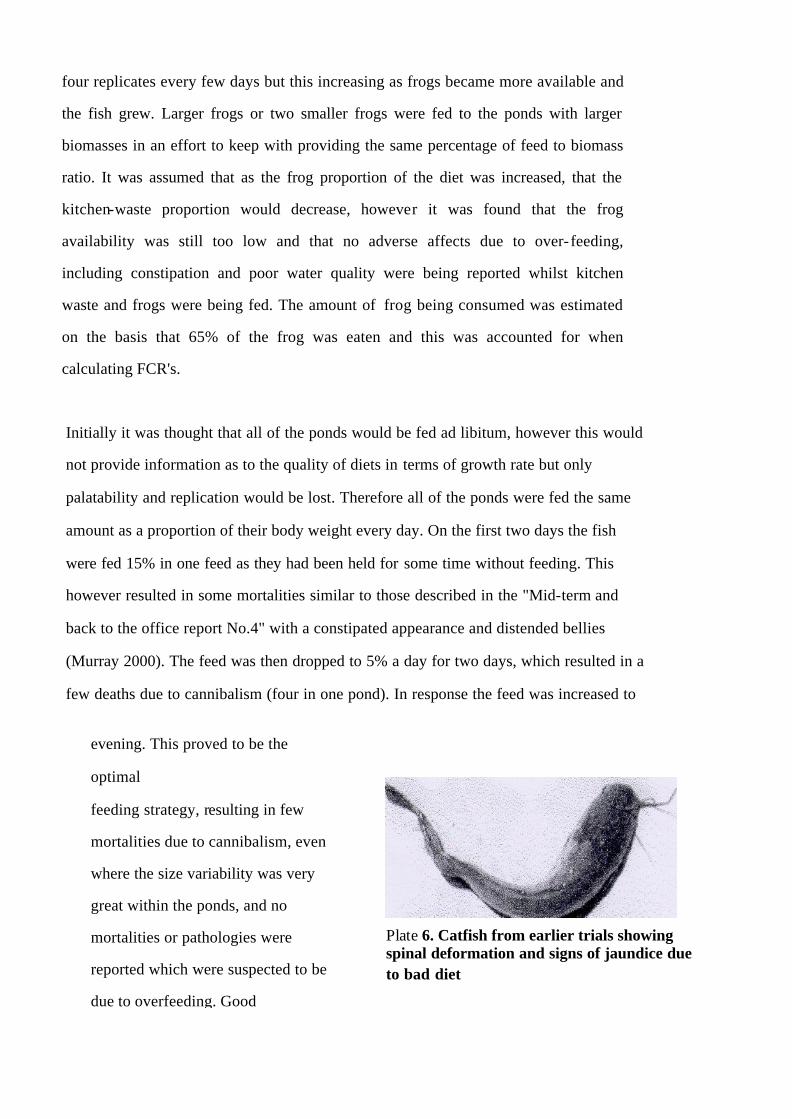
evening. This proved to be the
optimal
feeding strategy, resulting in few
mortalities due to cannibalism, even
where the size variability was very
great within the ponds, and no
mortalities or pathologies were
reported which were suspected to be
due to overfeeding. Good
Plate 6. Catfish from earlier trials showing spinal deformation and signs of jaundice due to bad diet
feed response was achieved from all of the diets and there was no evidence of
Full details of the results of these nutrition trials can be found within the appendices. It can be
clearly seen when referring to the figures and charts of SGR against weight that the ponds fed
kitchen waste only have a lower SGR than the ponds fed supplemented diets. All the ponds fed
kitchen waste only showed cumulative SGRs much less than the required 2.5, with the best being at
around 1.5 over the ten-week trial period. The best SGR achieved for kitchen waste and insect fed
ponds was 2.05 whereas the best SGR achieved for the kitchen waste and frog diet was 1.83.
Analysis of variance showed that there is no significant difference between kitchen waste only diet
and kitchen waste supplemented with insect diets (p= 0.212), however there was a difference
between kitchen waste only and kitchen waste supplemented with frogs (p= 0.039, see appendices).
As mentioned, the kitchen waste available on-station contained plain rice, and samba, sometime
with curds mixed in. This is considered, among some, to be luxury food and certainly curds will not
have been available to the farmers diet and hence the fish's. Milk and curds is produced on most
farms, however it is usually sold at the markets and not consumed by the farmers or their families.
The kitchen waste and insect ponds showed much better cumulative SGRs, especially in the latter
parts of the trial, when the lights were being suspended above buckets. Earlier in the trials insect
availability from the light trap and pitfall traps was insufficient, collection was laborious and the
diet was basically the same as the kitchen waste only ponds. It should be remembered, when
considering the growth rates, that the kitchen waste and insect diet ponds showed very high
mortality levels and that these dead fish were often cannibalised, although cannibalisation was not
necessarily the cause of death. These large mortality rates were found in the first two weeks when
the amount of feed was still being experimented with and in the weeks just after the light bulbs

had been installed over the ponds. It may be that bees were stinging the fish in the latter
case as certainly there were many bees being attracted to the light and falling into the water
although there is no literature to confirm this as a possibility. Another suggestion was that
increased aggressiveness of the fish when chasing the insects could have caused increased
cannibalism, as in many cases only the heads of the dead fish were found. Although water
quality in the insect ponds seemed to deteriorate after installation of the light bulbs, it was
not bad enough to result in the mortalities observed. The last three weeks, when there were
low mortality levels, however, showed good weekly SGRs, approaching and in fact
surpassing the required 2.5 SGR required, in some cases. However, the fish numbers were
much reduced at this time after suffering high mortalities previously, except for in pond no.
7. This may have contributed to higher SGRs, but it is also worth noting, that the weekly
SGRs will naturally decrease as the fish become larger and if this method was employed to
start with, a very high cumulative SGR may have been obtained, well above the 2.5 SGR,
required. More time needs to be invested in continuing this method of diet supplementation
to be sure that this can be achieved. Continuation of the trials may prove that there is
significant difference between the kitchen waste only and kitchen waste supplemented with
insects diets as there seemed to be a large improvement in performance after
the insect collection method was optimised.
All of the ponds fed kitchen waste supplemented with
frogs achieved higher SGRS than the ponds fed kitchen
waste only, as expected, although not reaching the
required 2.5 cumulative SGR. However much of the
time, especially at the start of the trial, frogs were not
available in the desired numbers and became increasingly hard to find as the summer
progressed, with daily temperatures reaching upwards of 42°C and local water sources
quickly becoming dry. After some local inhabitants were employed to find frogs, they
became more available but still less than desired, as there was some reluctance on the part
of these individuals to bring many frogs because of cultural taboos. Also many of the
people who were willing to perform this task (for a modest wage) were often unavailable
because of other work in surrounding villages. The on-farm trials would only require one
quarter of the frogs needed for the on-station trials, however, and many people reported an
abundance of frogs around their homes. As frogs became more available the weekly SGR
increased and the cumulative SGR of 2.5 may have been achieved if this amount was fed
from the very beginning. However, the taboos of the local population has to be taken into
account and many farmers may not be willing to slaughter frogs in the required number. If,
however, the insects were also fed in the above manner, with supplementation of a few
frogs per week, then the required SGR would almost certainly be reached. It also has to be
remembered that electricity is not available on some farms and where it is available,
farmers may not be willing to use it for insect collection all night as it may be out of the
farmers reach, financially.
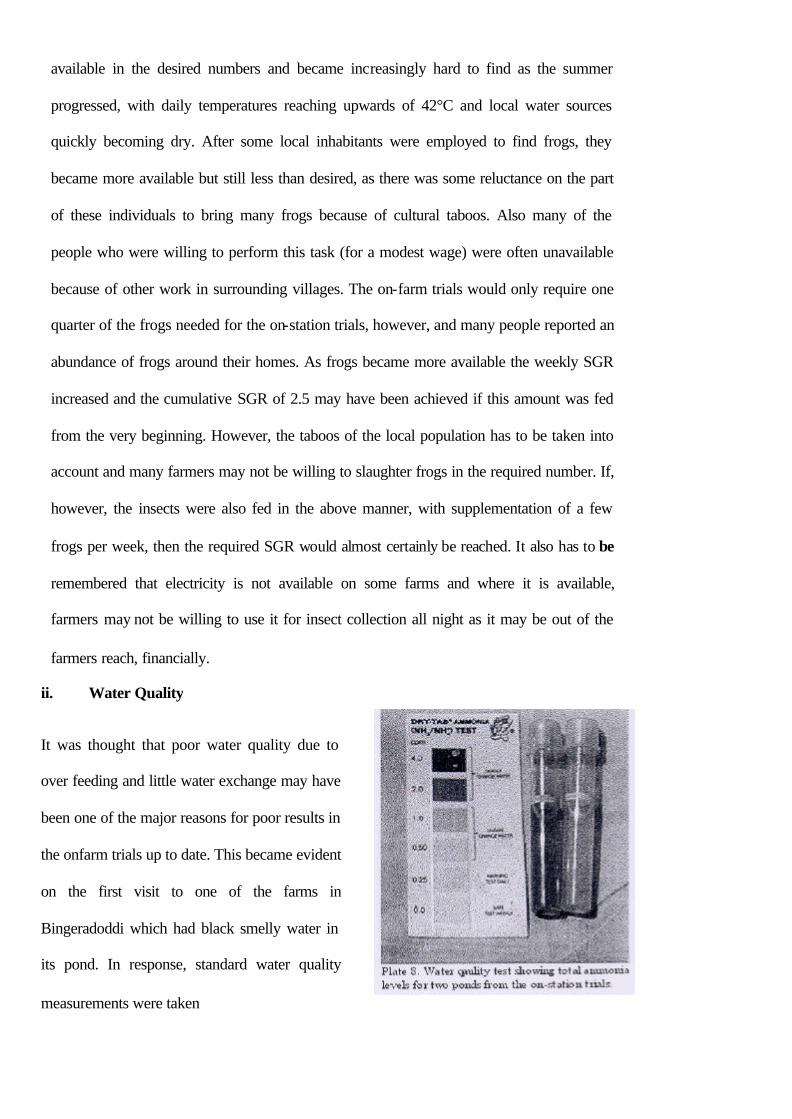
ii. Water Quality
It was thought that poor water quality due to
over feeding and little water exchange may have
been one of the major reasons for poor results in
the onfarm trials up to date. This became evident
on the first visit to one of the farms in
Bingeradoddi which had black smelly water in
its pond. In response, standard water quality
measurements were taken
weekly. These were a.m. and p.m. temperature, pH and oxygen concentration measurements
along with ammonia, nitrate, nitrite and phosphate measurements. These were performed
using a "Wellfish dry-tab" test kit and a "Tetratest" oxygen concentration test kit. Also as the
trial proceeded, depth, turbidity and greenness measurements were taken. Turbidity
measurements were taken using a Secchi disc and greenness was measured on an arbitrary
scale using a mineral water bottle that had increasing shades of green (from nought to three)
painted on the side with which to compare the water when held up to the sunlight. After a few
weeks most of the water quality tests were discontinued as the test kit ran out and was not
replaced, however results showed that after a couple of weeks, measurements stabilised.
However, after a few weeks, it was thought necessary to change the shelter that was provided
to the ponds in order to allow more light to encourage primary production levels. This was
because some of the ponds which were most shaded were becoming brown and smelly and the
worst of these were acquiring large total ammonia concentrations. After this modification,
daily measurements were taken, when possible, for depth, turbidity, greenness and
temperature as it was thought that evaporative losses may increase significantly and turbidity
would change markedly. Also, following partial replacement of the water quality test kits,
hourly measurements of temperature and oxygen concentration were taken over the course of
one day, from 7.15 a.m. to 6.15 p.m. to assess the temperature fluctuations and primary
productivity. This was performed in two ponds, one which was deemed the least productive
and one which was deemed to be the most productive, on the basis of greenness and turbidity
measurements, taken previously. It was thought before the trials started that regular water
exchange would be needed, based on the results coming from the on-farm trials. This was to
be done on the basis of the water quality in the worst pond, to be performed in conjunction
with the micro- irrigation trials. A full breakdown of the water quality results can be seen in
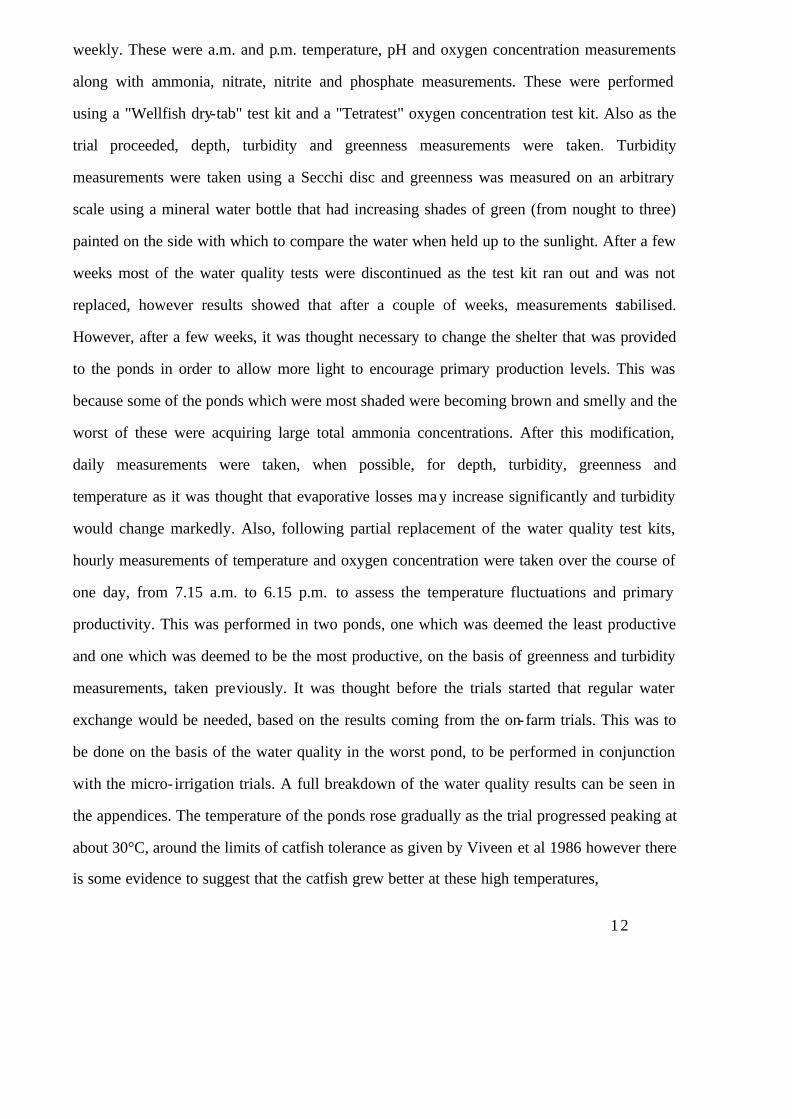
the appendices. The temperature of the ponds rose gradually as the trial progressed peaking at
about 30°C, around the limits of catfish tolerance as given by Viveen et al 1986 however there
is some evidence to suggest that the catfish grew better at these high temperatures,
12
this is supported by De Silva et al 1995 and certainly protein requirement tends to increase with
temperature in many fish (Tacon et al 1990). Essentially water quality measurements proved to
vary little between the groups in regard to concentration of nitrate, nitrite and ammonia with total
ammonia levels remaining below 0.5 p.p.m. except for a couple of ponds in the early stages of
the trial and nitrate and nitrite levels falling to zero in all ponds after three weeks. Boyd, 1979
gives the percentage of total ammonia appearing as NH3 at pH 8.0 and temperature 25°C as 5.2
%, this increases to 14.3% at pH 8.5 and 7.52% at 30°C. The highest total ammonia level
recorded was 1.6 p.p.m. at pH 8.0 and temperature 24°C, in pond 11, resulting in an unionised
ammonia concentration of 0.080ppm Although the water quality requirements given, suggest an
unionised ammonia level of less than 0.05 ppm African catfish can tolerate up to 0.1 p.p.m.
(Viveen 1986) and the 96hr LC50 value for channel catfish is given as 3.8mgL"1 at 30°C by
Boyd, 1979 with poor growth recorded at anything above 0.12 mgL-1. At the time that these
ammonia concentrations were being measured, however, the fish appeared pale but no low SGRs
were recorded when compared to the other replicates for that feed group. Turbidity and greenness
were the most variable of the parameters measured with pond 11 maintaining very high
greenness and turbidity levels once enough light was introduced. Good correlations were seen
between turbidity and primary productivity (oxygen production) in the green ponds and also
production of oxygen with time of day i.e. amount of direct sunlight (see appendices). Maximum
productivity in pond 1 was measured at 3.5 mgL"lhr 1 with the highest concentration at just over
9mgL-1 on a day where there was 100% sunshine. It was impossible to measure the productivity
of greener ponds because the colorimetric tests could not be read properly through the green
water. It was also possible to see the effect of the shelter in decreasing the primary productivity
level. Oxygen concentrations fell from 9mgL-1 to 7mgL-1 between 12.15p.m. and 13.15 p.m., the
time that overhead sunlight was blocked by the shelter, before increasing again. The optimum
level for turbidity is given as 25-50cm (Viveen 1986) however this is for much larger,
commercial systems and pond 11 showed no adverse effects from having such high turbidity
levels. Although highly tolerant of
low oxygen levels that may occur in highly green ponds in the morning, it should be remembered that
potential food source organisms may be affected (Viveen 1986). Unfortunately there is very little way of
controlling the greenness and turbidity of the ponds effectively and the variability between ponds and over
time means that no comparisons can effectively be drawn, however it seems that there are no ill effects from
having highly green ponds. It seems that the best greenness was maintained by the kitchen waste and frog
treatment and the worst by the kitchen waste and insect treatment, however, the kitchen waste and insect
ponds did not show any negative effects even though the ponds were becoming quite brown and smelly with
high turbidity in some cases. It is uncertain why the insect ponds seemed to suffer worse water quality, but it
occurred after the installation of the in situ light traps. It may be that the higher level of nutrition provided by
the insects resulted in more wastage of the kitchen waste, but then this should be seen in the frog ponds too.
Possibly the lights themselves were having some affect on the functioning of the phytoplankton. Another trial
would be needed to assess the affect of the greenness on the catfish's performance. It was hoped that another
trial would be started where the fish were not provided with any diet except for the natural food items found
in the ponds. Instead the ponds would be fertilised regularly to encourage primary productivity and to attract
food items such as mosquito larvae, however, time constraints and difficulties with supplies meant that this
project did not get under way at this time. It is however, unlikely that the 28-32% protein requirement cited
earlier could be achieved as cattle manure, the most commonly available, contains only 4.0% N as a
percentage of total solids (Little et al 1987) and the subsequent insect attraction is unlikely to make up this
shortfall. There are also hygiene implications if the pond is located near to the homestead such as possible
malaria outbreaks from a higher mosquito presence.
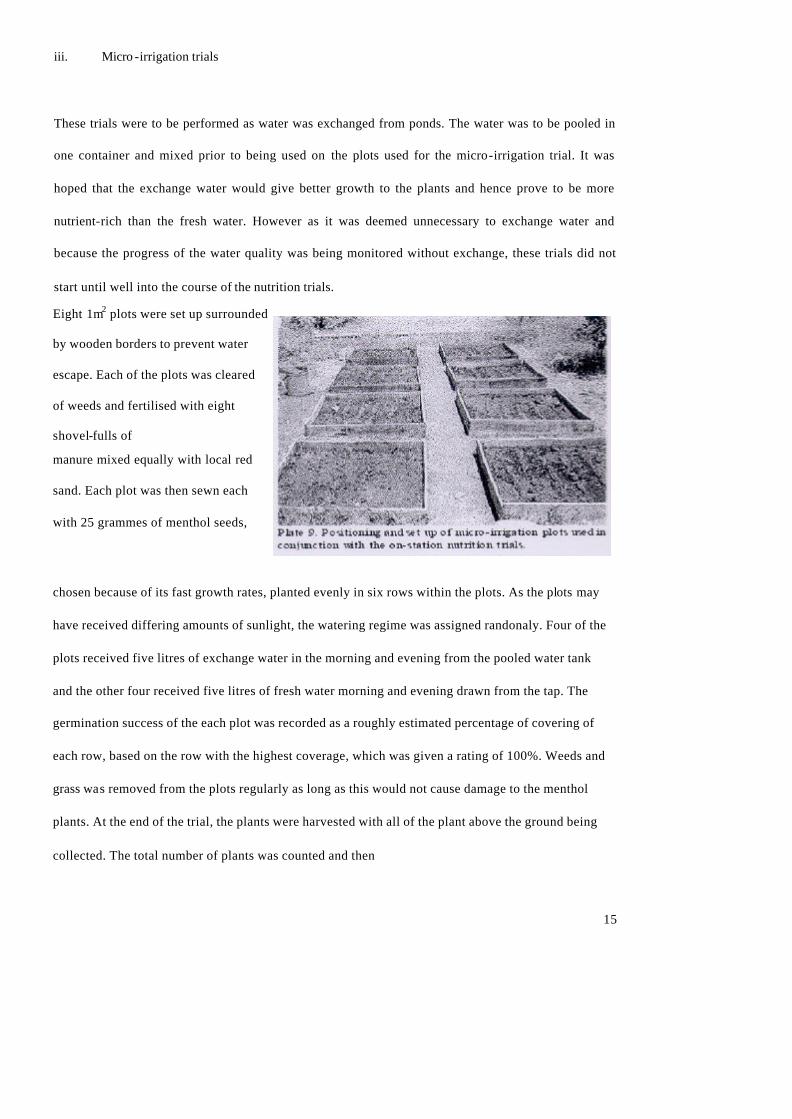
iii. Micro -irrigation trials
These trials were to be performed as water was exchanged from ponds. The water was to be pooled in
one container and mixed prior to being used on the plots used for the micro-irrigation trial. It was
hoped that the exchange water would give better growth to the plants and hence prove to be more
nutrient-rich than the fresh water. However as it was deemed unnecessary to exchange water and
because the progress of the water quality was being monitored without exchange, these trials did not
start until well into the course of the nutrition trials.
Eight 1m2 plots were set up surrounded
by wooden borders to prevent water
escape. Each of the plots was cleared
of weeds and fertilised with eight
shovel-fulls of
manure mixed equally with local red
sand. Each plot was then sewn each
with 25 grammes of menthol seeds,
chosen because of its fast growth rates, planted evenly in six rows within the plots. As the plots may
have received differing amounts of sunlight, the watering regime was assigned randonaly. Four of the
plots received five litres of exchange water in the morning and evening from the pooled water tank
and the other four received five litres of fresh water morning and evening drawn from the tap. The
germination success of the each plot was recorded as a roughly estimated percentage of covering of
each row, based on the row with the highest coverage, which was given a rating of 100%. Weeds and
grass was removed from the plots regularly as long as this would not cause damage to the menthol
plants. At the end of the trial, the plants were harvested with all of the plant above the ground being
collected. The total number of plants was counted and then
15
they were left to dry in the sun on gunnysacks for two days. The total weight of each plot was measured
and the average weight of each plant calculated.
As a result of time constraints, the menthol plants were only capable of limited growth, with only thirty-
three days between sewing and harvesting and only nineteen days between first germination and
harvesting. On inspection, the results seem to be poor with regards to the expected performance of the
plants watered with exchange water, with p=0.070, only just outside the significance value for there being
difference between the two treatments and the exchange water plots seeming to fare worse. However they
are much more consistent than the freshwatered plots, the exchange-watered plants achieved a mean dry
mass of between 0.024 and 0.027 grammes, whereas the fresh-watered plants achieved mean dry masses
of between 0.026 and 0.037 grammes. The largest of these, however was in a plot where the germination
success was lowest. The plots were of such a nature that the water tended to collect in the middle and
plants around the periphery of the plots were stunted compared to the plants growing in the middle. This
showed more in the plots where germination success was greater and would account for the large mean
dry mass attained in this plot. This aside, the results do seem to contradict the hypothesis that the
exchange water contributes more nutrients to the plants and will therefore provide for better growth. It
also seems to contradict the greenness measurements for the ponds which show that the water contained
enough nutrient value to achieve good algal growth, whereas fresh water took many days to achieve good
greenness. Ponds, which had poor water quality, with high ammonia levels and very low greenness,
became green very quickly once the shelter was converted to let in more light. It may be that the menthol
plants have a very low tolerance to ammonia compared to the algae, which would explain the poor
results. This, however, has been a relatively short trial with unequal numbers of plants per plot. Another
trial, with less seeds, scattered evenly rather than planted in rows would be easier to thin out into equal
numbers than the rows planted in this trial. It maybe worth while investigating to see if there are any
vegetables
20

which are more tolerant of the ammonia and which could potentially produce better growth rates than the
fresh-water. The water quality measurements showed that water exchange is not necessary if proper feed
management is practised, certainly in the first few months of growth. Water exchange, of course becomes
more necessary as the biomass of the pond increases and the level of food waste increases in parallel.
However, if the ponds are very green throughout, the water quality is controlled much better and the
catfish are after all an extremely tolerant species of poor water quality. This means that only minimal
water exchange is necessary, with only water replacement due to evaporation being required, a much
more acceptable situation for the farmer with limited access to fresh water.
References
Boyd C.E., 1979. Water quality in wane water fish ponds. Auburn University Agriculture Experiment Station. Printed by Craftmaster Printers, Inc. Opelika, Alabama. De Silva S.S., Anderson TA., 1995. Fish Nutrition in Aquaculture. Published by Chapman and Hall, imprint of Thomson Science, London. Little D., Muir J., 1987. A guide to Integrated warm water aquaculture. Published by the Institute of Aquaculture, University of Stirling. Murray F., 2000. Small scale fanner managed aquaculture trials in Raichur district, Karnataka state, India, "Mid-term progress report and back to the office report 4". Aquaculture in smallscale farmer managed irrigation systems. DFID Aquaculture Research programme,(ARP) Project R7064. Sadiku S.O.E., 1995. Use of soybean flour-poultry meat meal blends in practical diets of Oreochromis niloticus and Clarius gariepinus. PhD. Thesis, Institute of Aquaculture, University of Stirling. Tacon A.G.J., 1990. Standard methods for the Nutrition and Feeding of Fish and Shrimp. Argent Laboratories Press, Redmond, Washington 98052. Viveen W.J.A.R., Richter C.J.J., van Oordt P G.W.J.,Janssen J.A.L., Huisman E.A., 1986. Practical manual for the culture of the African Catfish (Clarius gariepinus). Joint Publication of General International Cooperation of the Ministry of Foreign Affairs, The Hague, Netherlands; Department of Fish Culture and Fisheries of the Agricultural University of Wageningen, the Netherlands; Research Group for Comparative Endocrinology, Department of Zoology of the University of Utrecht, the Netherlands.
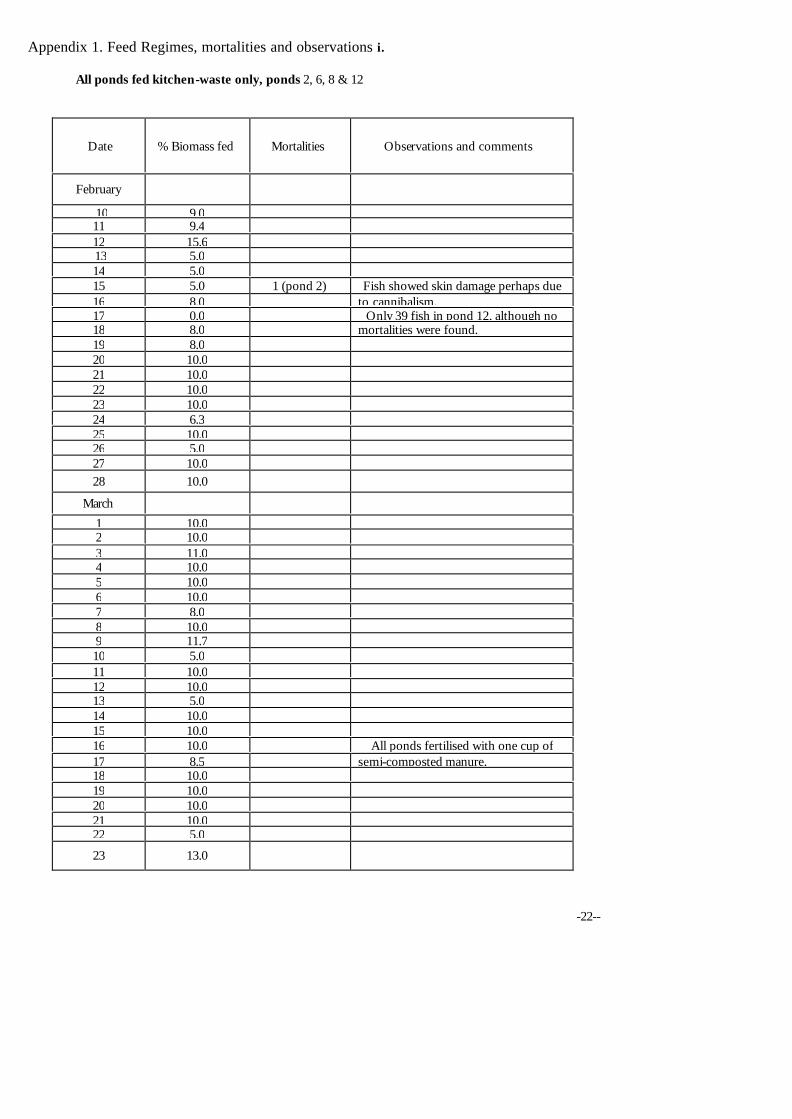
Appendix 1. Feed Regimes, mortalities and observations i.
All ponds fed kitchen-waste only, ponds 2, 6, 8 & 12
Date % Biomass fed Mortalities Observations and comments
February
10 9.0 11 9.4 12 15.6 13 5.0 14 5.0 15 5.0 1 (pond 2) Fish showed skin damage perhaps due 16 8.0 to cannibalism. 17 0.0 Only 39 fish in pond 12, although no 18 8.0 mortalities were found. 19 8.0 20 10.0 21 10.0 22 10.0 23 10.0 24 6.3 25 10.0 26 5.0 27 10.0 28 10.0
March 1 10.0 2 10.0 3 11.0 4 10.0 5 10.0 6 10.0 7 8.0 8 10.0 9 11.7 10 5.0 11 10.0 12 10.0 13 5.0 14 10.0 15 10.0 16 10.0 All ponds fertilised with one cup of 17 8.5 semi-composted manure. 18 10.0 19 10.0 20 10.0 21 10.0 22 5.0
23 13.0
-22--
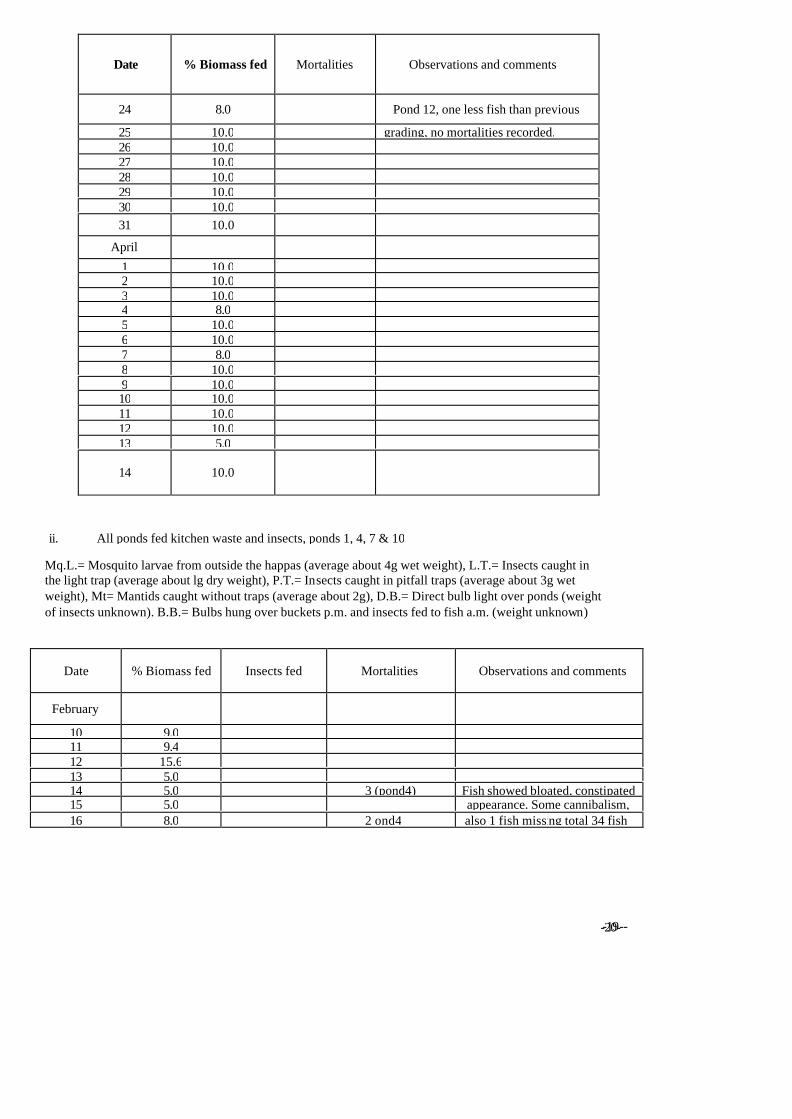
Date % Biomass fed Mortalities Observations and comments
24 8.0 Pond 12, one less fish than previous
25 10.0 grading, no mortalities recorded. 26 10.0 27 10.0 28 10.0 29 10.0 30 10.0 31 10.0
April
1 10.0 2 10.0 3 10.0 4 8.0 5 10.0 6 10.0 7 8.0 8 10.0 9 10.0 10 10.0 11 10.0 12 10.0 13 5.0
14 10.0
ii. All ponds fed kitchen waste and insects, ponds 1, 4, 7 & 10
Mq.L.= Mosquito larvae from outside the happas (average about 4g wet weight), L.T.= Insects caught in the light trap (average about lg dry weight), P.T.= Insects caught in pitfall traps (average about 3g wet weight), Mt= Mantids caught without traps (average about 2g), D.B.= Direct bulb light over ponds (weight of insects unknown). B.B.= Bulbs hung over buckets p.m. and insects fed to fish a.m. (weight unknown)
Date % Biomass fed Insects fed Mortalities Observations and comments
February
10 9.0 11 9.4 12 15.6 13 5.0 14 5.0 3 (pond4) Fish showed bloated, constipated 15 5.0 appearance. Some cannibalism, 16 8.0 2 ond4 also 1 fish missing total 34 fish
-19-- -20-
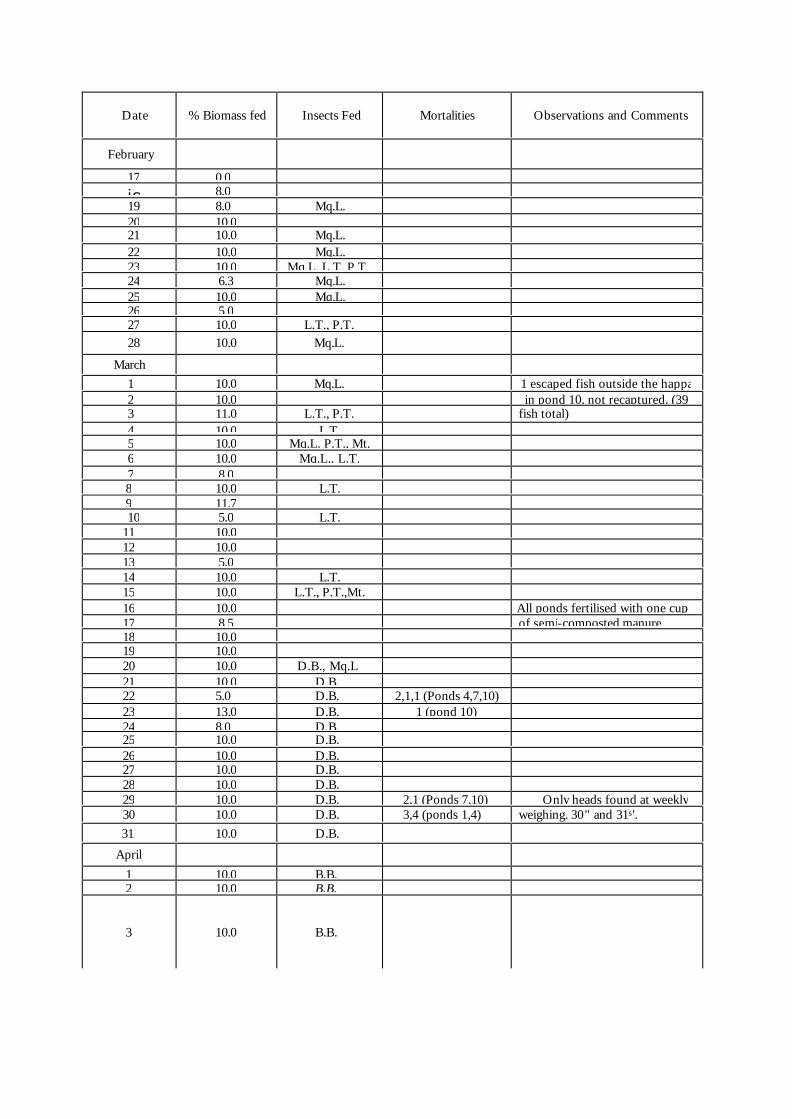
Date % Biomass fed Insects Fed Mortalities Observations and Comments
February
17 0.0 is 8.0 19 8.0 Mq.L. 20 10.0 21 10.0 Mq.L. 22 10.0 Mq.L. 23 10.0 Mq.L.,L.T, P.T. 24 6.3 Mq.L. 25 10.0 Mq.L. 26 5.0 27 10.0 L.T., P.T. 28 10.0 Mq.L.
March 1 10.0 Mq.L. 1 escaped fish outside the happa 2 10.0 in pond 10, not recaptured. (39 3 11.0 L.T., P.T. fish total) 4 10.0 L.T. 5 10.0 Mq.L. P.T., Mt. 6 10.0 Mq.L., L.T. 7 8.0 8 10.0 L.T. 9 11.7 10 5.0 L.T.
11 10.0 12 10.0 13 5.0 14 10.0 L.T. 15 10.0 L.T., P.T.,Mt. 16 10.0 All ponds fertilised with one cup 17 8.5 of semi-composted manure. 18 10.0 19 10.0 20 10.0 D.B., Mq.L 21 10.0 D.B. 22 5.0 D.B. 2,1,1 (Ponds 4,7,10) 23 13.0 D.B. 1 (pond 10) 24 8.0 D.B. 25 10.0 D.B. 26 10.0 D.B. 27 10.0 D.B. 28 10.0 D.B. 29 10.0 D.B. 2,1 (Ponds 7,10) Only heads found at weekly 30 10.0 D.B. 3,4 (ponds 1,4) weighing. 30" and 31s '. 31 10.0 D.B.
April 1 10.0 B.B. 2 10.0 B.B.
3 10.0 B.B.
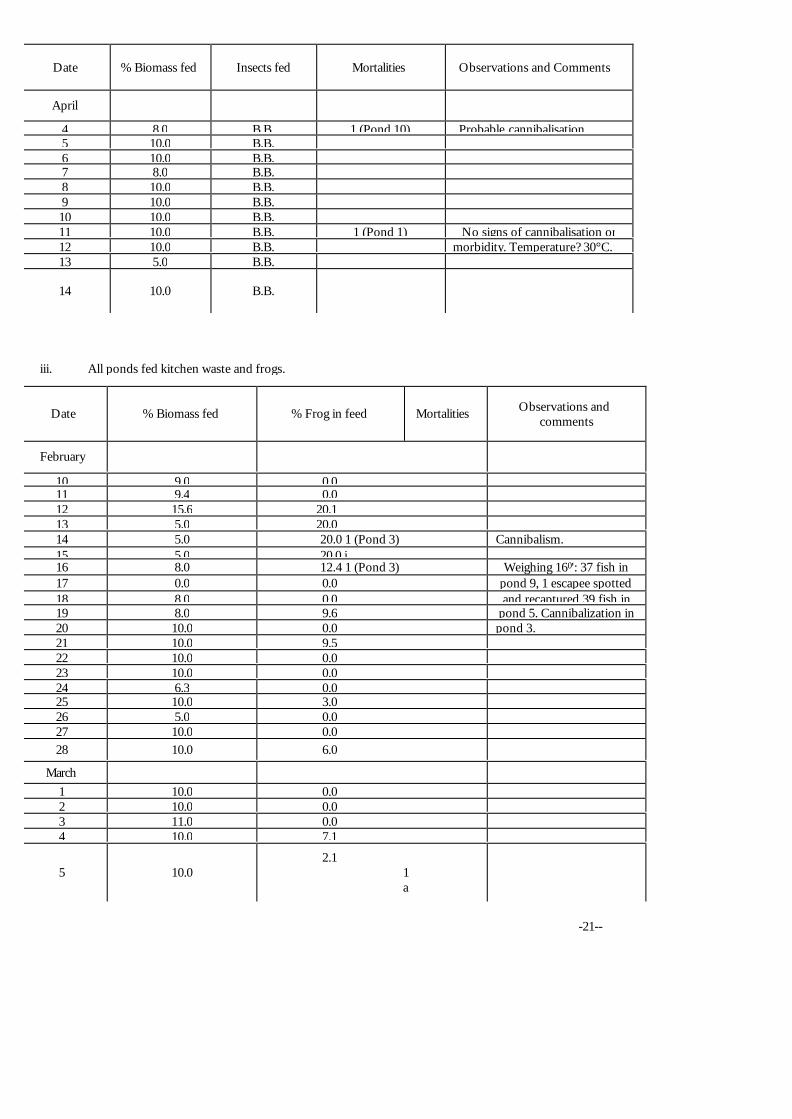
Date % Biomass fed Insects fed Mortalities Observations and Comments
April
4 8.0 B.B. 1 (Pond 10) Probable cannibalisation 5 10.0 B.B. 6 10.0 B.B. 7 8.0 B.B. 8 10.0 B.B. 9 10.0 B.B. 10 10.0 B.B. 11 10.0 B.B. 1 (Pond 1) No signs of cannibalisation or 12 10.0 B.B. morbidity. Temperature? 30°C. 13 5.0 B.B.
14 10.0 B.B.
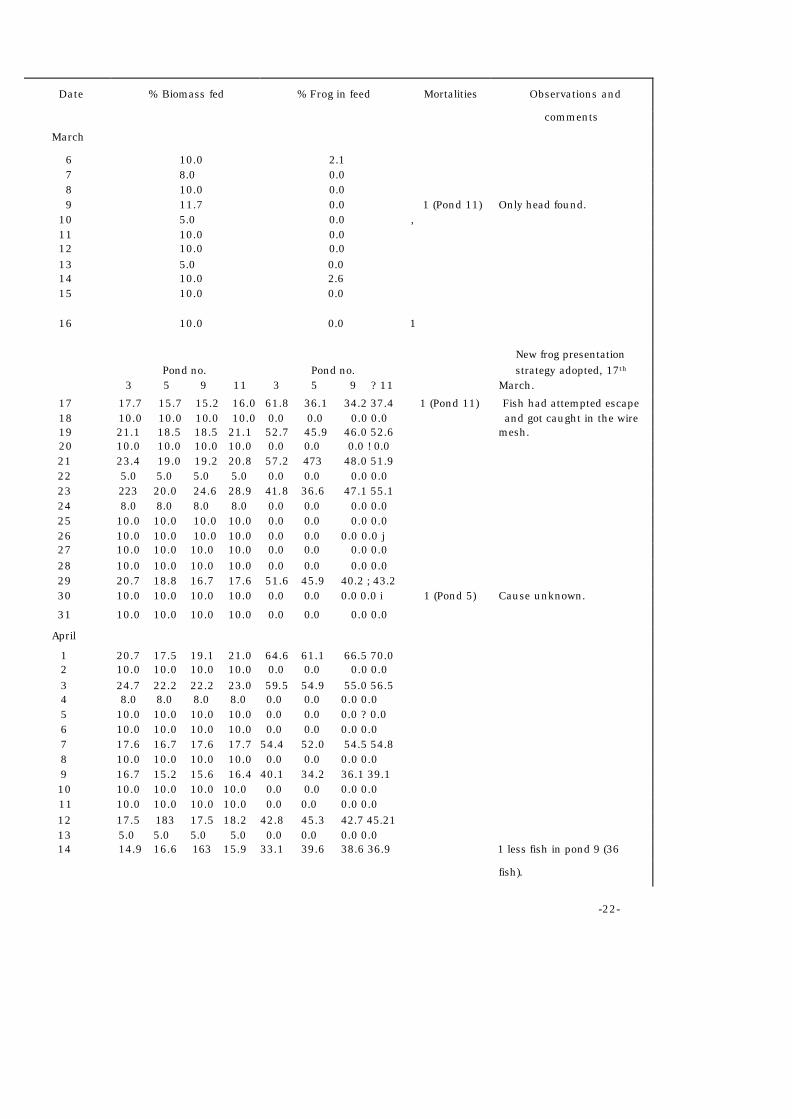
iii. All ponds fed kitchen waste and frogs.
Date % Biomass fed % Frog in feed Mortalities Observations and comments
February
10 9.0 0.0 11 9.4 0.0 12 15.6 20.1 13 5.0 20.0 14 5.0 20.0 1 (Pond 3) Cannibalism. 15 5.0 20.0 j 16 8.0 12.4 1 (Pond 3) Weighing 160': 37 fish in 17 0.0 0.0 pond 9, 1 escapee spotted 18 8.0 0.0 and recaptured 39 fish in 19 8.0 9.6 pond 5. Cannibalization in 20 10.0 0.0 pond 3. 21 10.0 9.5 22 10.0 0.0 23 10.0 0.0 24 6.3 0.0 25 10.0 3.0 26 5.0 0.0 27 10.0 0.0 28 10.0 6.0
March 1 10.0 0.0 2 10.0 0.0 3 11.0 0.0 4 10.0 7.1
5 10.0 2.1
1 a
-21--
Date % Biomass fed % Frog in feed Mortalities Observations and
comments
March
6 10.0 2.1 7 8.0 0.0 8 10.0 0.0 9 11.7 0.0 1 (Pond 11) Only head found.
10 5.0 0.0 , 11 10.0 0.0 12 10.0 0.0 13 5.0 0.0 14 10.0 2.6 15 10.0 0.0
16 10.0 0.0 1
New frog presentation Pond no. Pond no. strategy adopted, 17th 3 5 9 11 3 5 9 ? 11 March.
17 17.7 15.7 15.2 16.0 61.8 36.1 34.2 37.4 1 (Pond 11) Fish had attempted escape 18 10.0 10.0 10.0 10.0 0.0 0.0 0.0 0.0 and got caught in the wire 19 21.1 18.5 18.5 21.1 52.7 45.9 46.0 52.6 mesh. 20 10.0 10.0 10.0 10.0 0.0 0.0 0.0 ! 0.0 21 23.4 19.0 19.2 20.8 57.2 473 48.0 51.9 22 5.0 5.0 5.0 5.0 0.0 0.0 0.0 0.0 23 223 20.0 24.6 28.9 41.8 36.6 47.1 55.1 24 8.0 8.0 8.0 8.0 0.0 0.0 0.0 0.0 25 10.0 10.0 10.0 10.0 0.0 0.0 0.0 0.0 26 10.0 10.0 10.0 10.0 0.0 0.0 0.0 0.0 j 27 10.0 10.0 10.0 10.0 0.0 0.0 0.0 0.0 28 10.0 10.0 10.0 10.0 0.0 0.0 0.0 0.0 29 20.7 18.8 16.7 17.6 51.6 45.9 40.2 ; 43.2 30 10.0 10.0 10.0 10.0 0.0 0.0 0.0 0.0 i 1 (Pond 5) Cause unknown.
31 10.0 10.0 10.0 10.0 0.0 0.0 0.0 0.0
April
1 20.7 17.5 19.1 21.0 64.6 61.1 66.5 70.0 2 10.0 10.0 10.0 10.0 0.0 0.0 0.0 0.0 3 24.7 22.2 22.2 23.0 59.5 54.9 55.0 56.5 4 8.0 8.0 8.0 8.0 0.0 0.0 0.0 0.0 5 10.0 10.0 10.0 10.0 0.0 0.0 0.0 ? 0.0 6 10.0 10.0 10.0 10.0 0.0 0.0 0.0 0.0 7 17.6 16.7 17.6 17.7 54.4 52.0 54.5 54.8 8 10.0 10.0 10.0 10.0 0.0 0.0 0.0 0.0 9 16.7 15.2 15.6 16.4 40.1 34.2 36.1 39.1 10 10.0 10.0 10.0 10.0 0.0 0.0 0.0 0.0 11 10.0 10.0 10.0 10.0 0.0 0.0 0.0 0.0 12 17.5 183 17.5 18.2 42.8 45.3 42.7 45.21 13 5.0 5.0 5.0 5.0 0.0 0.0 0.0 0.0 14 14.9 16.6 163 15.9 33.1 39.6 38.6 36.9 1 less fish in pond 9 (36
fish).
-22-
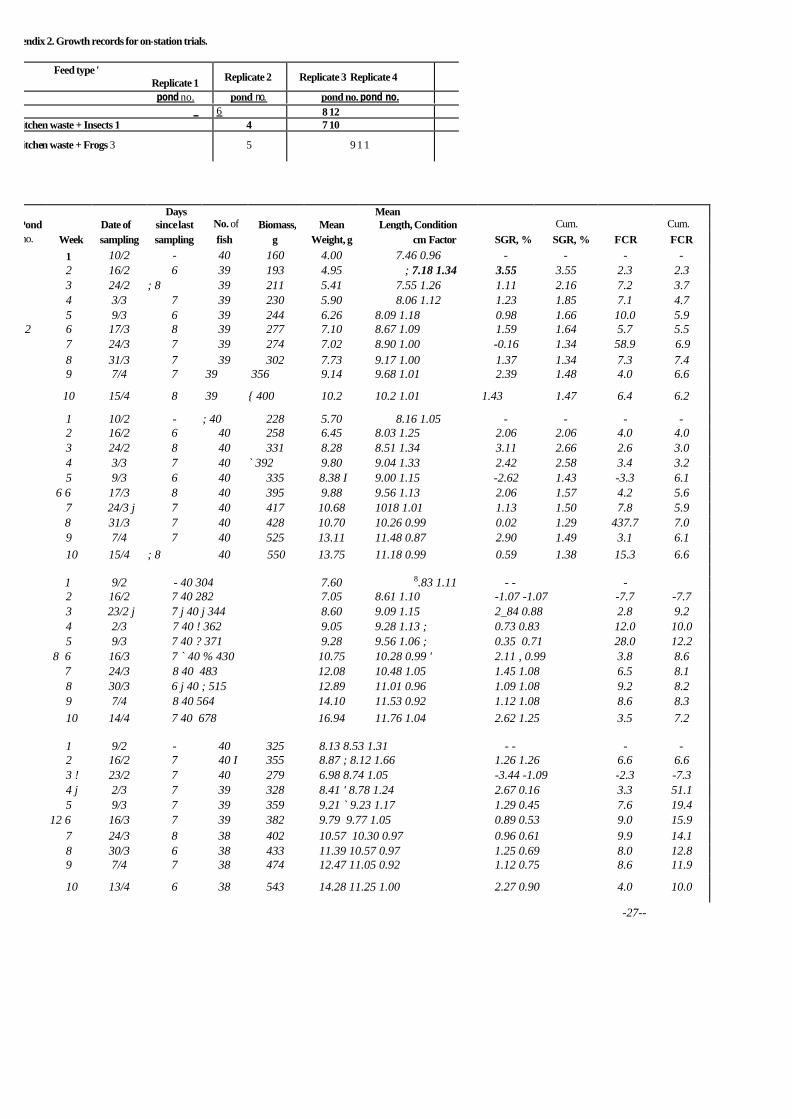
Appendix 2. Growth records for on-station trials.
Feed type ' Replicate 1 Replicate 2 Replicate 3 Replicate 4
pond no. pond no. pond no. pond no.
_ 6 8 12 Kitchen waste + Insects 1 4 7 10
Kitchen waste + Frogs 3 5 9 1 1
Days Mean Pond Date of since last No. of Biomass, Mean Length, Condition Cum. Cum. no. Week sampling sampling fish g Weight, g cm Factor SGR, % SGR, % FCR FCR
1 10/2 - 40 160 4.00 7.46 0.96 - - - - 2 16/2 6 39 193 4.95 ; 7.18 1.34 3.55 3.55 2.3 2.3 3 24/2 ; 8 39 211 5.41 7.55 1.26 1.11 2.16 7.2 3.7 4 3/3 7 39 230 5.90 8.06 1.12 1.23 1.85 7.1 4.7 5 9/3 6 39 244 6.26 8.09 1.18 0.98 1.66 10.0 5.9
2 6 17/3 8 39 277 7.10 8.67 1.09 1.59 1.64 5.7 5.5 7 24/3 7 39 274 7.02 8.90 1.00 -0.16 1.34 58.9 6.9 8 31/3 7 39 302 7.73 9.17 1.00 1.37 1.34 7.3 7.4 9 7/4 7 39 356 9.14 9.68 1.01 2.39 1.48 4.0 6.6
10 15/4 8 39 { 400 10.2 10.2 1.01 1.43 1.47 6.4 6.2
1 10/2 - ; 40 228 5.70 8.16 1.05 - - - - 2 16/2 6 40 258 6.45 8.03 1.25 2.06 2.06 4.0 4.0 3 24/2 8 40 331 8.28 8.51 1.34 3.11 2.66 2.6 3.0 4 3/3 7 40 ` 392 9.80 9.04 1.33 2.42 2.58 3.4 3.2 5 9/3 6 40 335 8.38 I 9.00 1.15 -2.62 1.43 -3.3 6.1
6 6 17/3 8 40 395 9.88 9.56 1.13 2.06 1.57 4.2 5.6 7 24/3 j 7 40 417 10.68 1018 1.01 1.13 1.50 7.8 5.9
8 31/3 7 40 428 10.70 10.26 0.99 0.02 1.29 437.7 7.0 9 7/4 7 40 525 13.11 11.48 0.87 2.90 1.49 3.1 6.1 10 15/4 ; 8 40 550 13.75 11.18 0.99 0.59 1.38 15.3 6.6
1 9/2 - 40 304 7.60 8.83 1.11 - - - 2 16/2 7 40 282 7.05 8.61 1.10 -1.07 -1.07 -7.7 -7.7 3 23/2 j 7 j 40 j 344 8.60 9.09 1.15 2_84 0.88 2.8 9.2 4 2/3 7 40 ! 362 9.05 9.28 1.13 ; 0.73 0.83 12.0 10.0 5 9/3 7 40 ? 371 9.28 9.56 1.06 ; 0.35 0.71 28.0 12.2
8 6 16/3 7 ` 40 % 430 10.75 10.28 0.99 ' 2.11 , 0.99 3.8 8.6 7 24/3 8 40 483 12.08 10.48 1.05 1.45 1.08 6.5 8.1 8 30/3 6 j 40 ; 515 12.89 11.01 0.96 1.09 1.08 9.2 8.2 9 7/4 8 40 564 14.10 11.53 0.92 1.12 1.08 8.6 8.3 10 14/4 7 40 678 16.94 11.76 1.04 2.62 1.25 3.5 7.2
1 9/2 - 40 325 8.13 8.53 1.31 - - - - 2 16/2 7 40 I 355 8.87 ; 8.12 1.66 1.26 1.26 6.6 6.6 3 ! 23/2 7 40 279 6.98 8.74 1.05 -3.44 -1.09 -2.3 -7.3 4 j 2/3 7 39 328 8.41 ' 8.78 1.24 2.67 0.16 3.3 51.1 5 9/3 7 39 359 9.21 ` 9.23 1.17 1.29 0.45 7.6 19.4
12 6 16/3 7 39 382 9.79 9.77 1.05 0.89 0.53 9.0 15.9 7 24/3 8 38 402 10.57 10.30 0.97 0.96 0.61 9.9 14.1 8 30/3 6 38 433 11.39 10.57 0.97 1.25 0.69 8.0 12.8 9 7/4 7 38 474 12.47 11.05 0.92 1.12 0.75 8.6 11.9
10 13/4 6 38 543 14.28 11.25 1.00 2.27 0.90 4.0 10.0
-27--
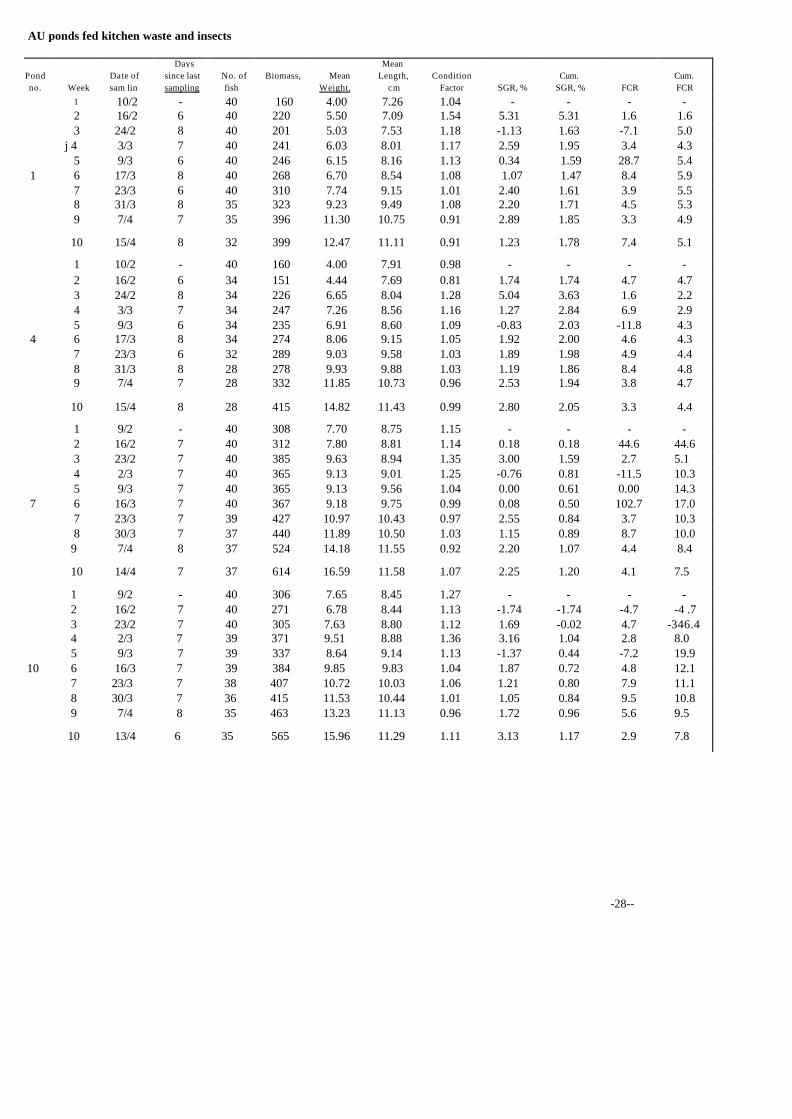
ii. AU ponds fed kitchen waste and insects
Days Mean Pond Date of since last No. of Biomass, Mean Length, Condition Cum. Cum. no. Week sam lin sampling fish Weight, cm Factor SGR, % SGR, % FCR FCR
1 10/2 - 40 160 4.00 7.26 1.04 - - - - 2 16/2 6 40 220 5.50 7.09 1.54 5.31 5.31 1.6 1.6 3 24/2 8 40 201 5.03 7.53 1.18 -1.13 1.63 -7.1 5.0
j 4 3/3 7 40 241 6.03 8.01 1.17 2.59 1.95 3.4 4.3 5 9/3 6 40 246 6.15 8.16 1.13 0.34 1.59 28.7 5.4
1 6 17/3 8 40 268 6.70 8.54 1.08 1.07 1.47 8.4 5.9 7 23/3 6 40 310 7.74 9.15 1.01 2.40 1.61 3.9 5.5 8 31/3 8 35 323 9.23 9.49 1.08 2.20 1.71 4.5 5.3 9 7/4 7 35 396 11.30 10.75 0.91 2.89 1.85 3.3 4.9
10 15/4 8 32 399 12.47 11.11 0.91 1.23 1.78 7.4 5.1
1 10/2 - 40 160 4.00 7.91 0.98 - - - - 2 16/2 6 34 151 4.44 7.69 0.81 1.74 1.74 4.7 4.7 3 24/2 8 34 226 6.65 8.04 1.28 5.04 3.63 1.6 2.2 4 3/3 7 34 247 7.26 8.56 1.16 1.27 2.84 6.9 2.9 5 9/3 6 34 235 6.91 8.60 1.09 -0.83 2.03 -11.8 4.3
4 6 17/3 8 34 274 8.06 9.15 1.05 1.92 2.00 4.6 4.3 7 23/3 6 32 289 9.03 9.58 1.03 1.89 1.98 4.9 4.4 8 31/3 8 28 278 9.93 9.88 1.03 1.19 1.86 8.4 4.8 9 7/4 7 28 332 11.85 10.73 0.96 2.53 1.94 3.8 4.7
10 15/4 8 28 415 14.82 11.43 0.99 2.80 2.05 3.3 4.4
1 9/2 - 40 308 7.70 8.75 1.15 - - - - 2 16/2 7 40 312 7.80 8.81 1.14 0.18 0.18 44.6 44.6 3 23/2 7 40 385 9.63 8.94 1.35 3.00 1.59 2.7 5.1 4 2/3 7 40 365 9.13 9.01 1.25 -0.76 0.81 -11.5 10.3 5 9/3 7 40 365 9.13 9.56 1.04 0.00 0.61 0.00 14.3
7 6 16/3 7 40 367 9.18 9.75 0.99 0.08 0.50 102.7 17.0 7 23/3 7 39 427 10.97 10.43 0.97 2.55 0.84 3.7 10.3 8 30/3 7 37 440 11.89 10.50 1.03 1.15 0.89 8.7 10.0 9 7/4 8 37 524 14.18 11.55 0.92 2.20 1.07 4.4 8.4
10 14/4 7 37 614 16.59 11.58 1.07 2.25 1.20 4.1 7.5
1 9/2 - 40 306 7.65 8.45 1.27 - - - - 2 16/2 7 40 271 6.78 8.44 1.13 -1.74 -1.74 -4.7 -4 .7 3 23/2 7 40 305 7.63 8.80 1.12 1.69 -0.02 4.7 -346.4 4 2/3 7 39 371 9.51 8.88 1.36 3.16 1.04 2.8 8.0 5 9/3 7 39 337 8.64 9.14 1.13 -1.37 0.44 -7.2 19.9
10 6 16/3 7 39 384 9.85 9.83 1.04 1.87 0.72 4.8 12.1 7 23/3 7 38 407 10.72 10.03 1.06 1.21 0.80 7.9 11.1 8 30/3 7 36 415 11.53 10.44 1.01 1.05 0.84 9.5 10.8 9 7/4 8 35 463 13.23 11.13 0.96 1.72 0.96 5.6 9.5
10 13/4 6 35 565 15.96 11.29 1.11 3.13 1.17 2.9 7.8
-28--
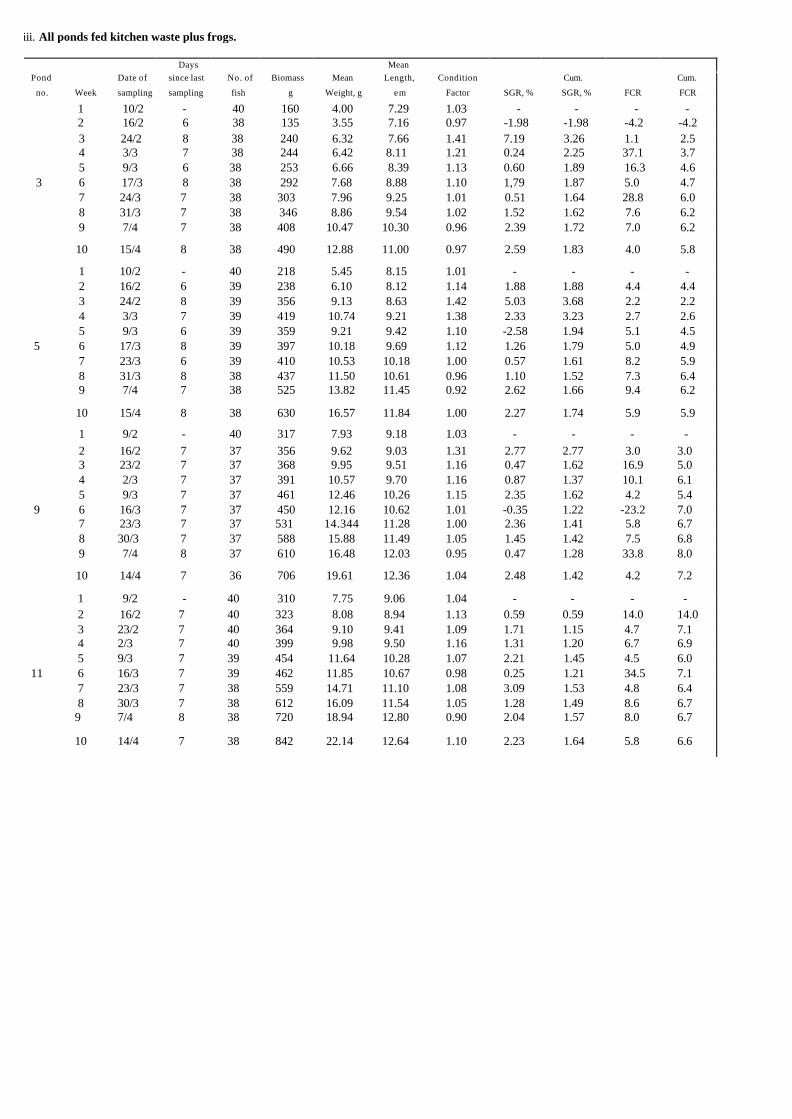
iii. All ponds fed kitchen waste plus frogs.
Days Mean Pond Date of since last No. of Biomass Mean Length, Condition Cum. Cum.
no. Week sampling sampling fish g Weight, g em Factor SGR, % SGR, % FCR FCR
1 10/2 - 40 160 4.00 7.29 1.03 - - - - 2 16/2 6 38 135 3.55 7.16 0.97 -1.98 -1.98 -4.2 -4.2 3 24/2 8 38 240 6.32 7.66 1.41 7.19 3.26 1.1 2.5 4 3/3 7 38 244 6.42 8.11 1.21 0.24 2.25 37.1 3.7 5 9/3 6 38 253 6.66 8.39 1.13 0.60 1.89 16.3 4.6
3 6 17/3 8 38 292 7.68 8.88 1.10 1,79 1.87 5.0 4.7 7 24/3 7 38 303 7.96 9.25 1.01 0.51 1.64 28.8 6.0 8 31/3 7 38 346 8.86 9.54 1.02 1.52 1.62 7.6 6.2 9 7/4 7 38 408 10.47 10.30 0.96 2.39 1.72 7.0 6.2
10 15/4 8 38 490 12.88 11.00 0.97 2.59 1.83 4.0 5.8
1 10/2 - 40 218 5.45 8.15 1.01 - - - - 2 16/2 6 39 238 6.10 8.12 1.14 1.88 1.88 4.4 4.4 3 24/2 8 39 356 9.13 8.63 1.42 5.03 3.68 2.2 2.2 4 3/3 7 39 419 10.74 9.21 1.38 2.33 3.23 2.7 2.6 5 9/3 6 39 359 9.21 9.42 1.10 -2.58 1.94 5.1 4.5
5 6 17/3 8 39 397 10.18 9.69 1.12 1.26 1.79 5.0 4.9 7 23/3 6 39 410 10.53 10.18 1.00 0.57 1.61 8.2 5.9 8 31/3 8 38 437 11.50 10.61 0.96 1.10 1.52 7.3 6.4 9 7/4 7 38 525 13.82 11.45 0.92 2.62 1.66 9.4 6.2
10 15/4 8 38 630 16.57 11.84 1.00 2.27 1.74 5.9 5.9
1 9/2 - 40 317 7.93 9.18 1.03 - - - - 2 16/2 7 37 356 9.62 9.03 1.31 2.77 2.77 3.0 3.0 3 23/2 7 37 368 9.95 9.51 1.16 0.47 1.62 16.9 5.0 4 2/3 7 37 391 10.57 9.70 1.16 0.87 1.37 10.1 6.1 5 9/3 7 37 461 12.46 10.26 1.15 2.35 1.62 4.2 5.4
9 6 16/3 7 37 450 12.16 10.62 1.01 -0.35 1.22 -23.2 7.0 7 23/3 7 37 531 14.344 11.28 1.00 2.36 1.41 5.8 6.7 8 30/3 7 37 588 15.88 11.49 1.05 1.45 1.42 7.5 6.8 9 7/4 8 37 610 16.48 12.03 0.95 0.47 1.28 33.8 8.0
10 14/4 7 36 706 19.61 12.36 1.04 2.48 1.42 4.2 7.2
1 9/2 - 40 310 7.75 9.06 1.04 - - - - 2 16/2 7 40 323 8.08 8.94 1.13 0.59 0.59 14.0 14.0 3 23/2 7 40 364 9.10 9.41 1.09 1.71 1.15 4.7 7.1 4 2/3 7 40 399 9.98 9.50 1.16 1.31 1.20 6.7 6.9 5 9/3 7 39 454 11.64 10.28 1.07 2.21 1.45 4.5 6.0
11 6 16/3 7 39 462 11.85 10.67 0.98 0.25 1.21 34.5 7.1 7 23/3 7 38 559 14.71 11.10 1.08 3.09 1.53 4.8 6.4 8 30/3 7 38 612 16.09 11.54 1.05 1.28 1.49 8.6 6.7 9 7/4 8 38 720 18.94 12.80 0.90 2.04 1.57 8.0 6.7
10 14/4 7 38 842 22.14 12.64 1.10 2.23 1.64 5.8 6.6
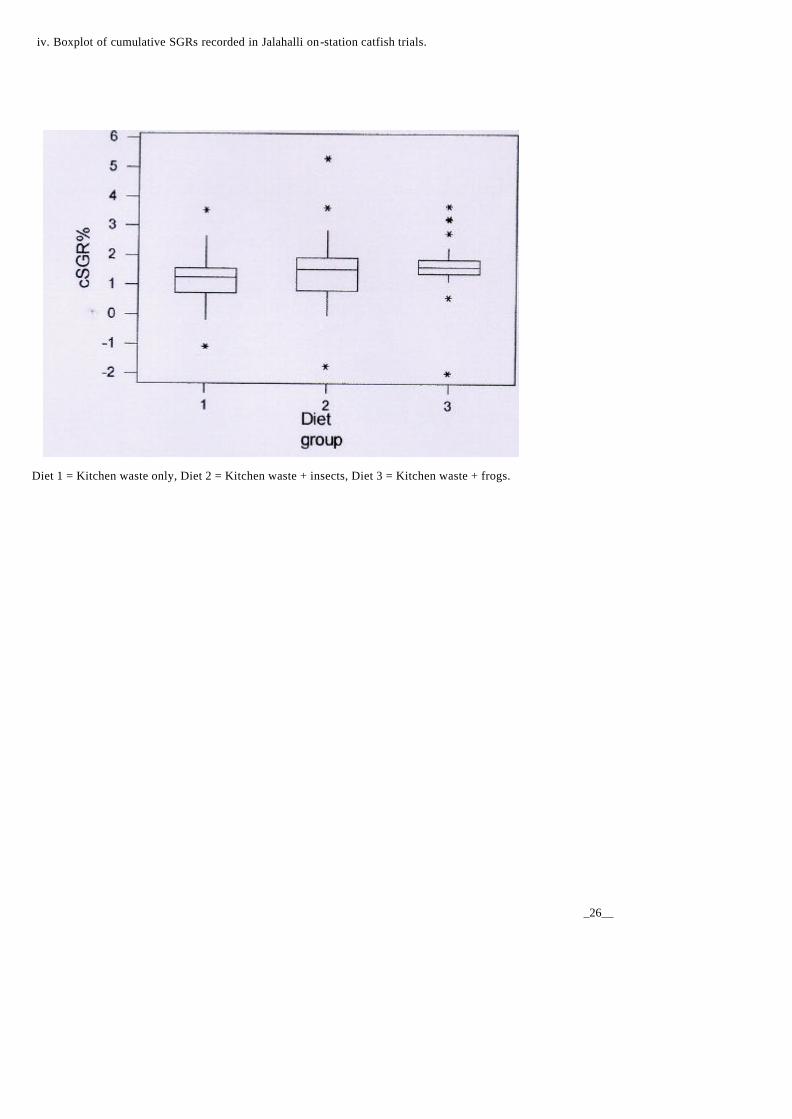
iv. Boxplot of cumulative SGRs recorded in Jalahalli on-station catfish trials.
Diet 1 = Kitchen waste only, Diet 2 = Kitchen waste + insects, Diet 3 = Kitchen waste + frogs.
_26__

Appendix 3. Graphs showing growth performance of on-station catfish trials 9/215/4/01.
i. Cumulative SGR vs. Weight.
-27--

u. Cumulative FCR vs. Mean Body weight (outliers removed)
_2g__

-29--
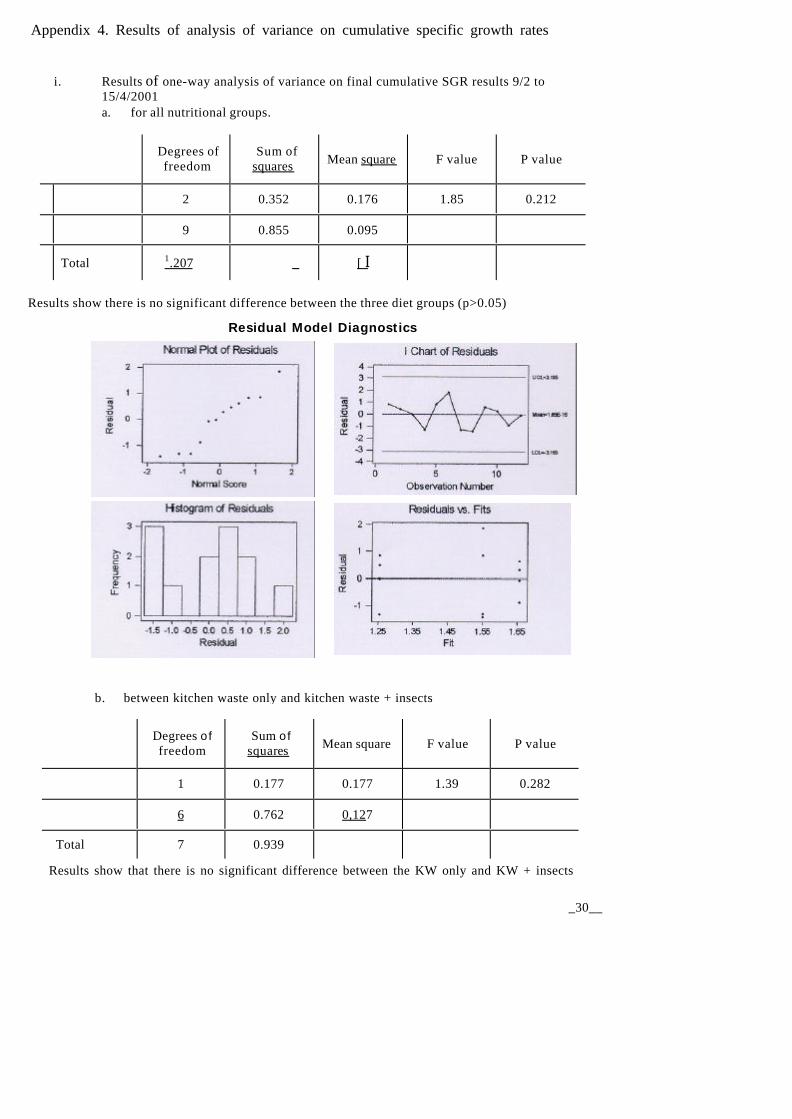
Appendix 4. Results of analysis of variance on cumulative specific growth rates
i. Results of one-way analysis of variance on final cumulative SGR results 9/2 to 15/4/2001 a. for all nutritional groups.
Degrees of freedom
Sum of squares Mean square F value P value
2 0.352 0.176 1.85 0.212
9 0.855 0.095
Total 1.207 _ [ I
Results show there is no significant difference between the three diet groups (p>0.05)
Residual Model Diagnostics
b. between kitchen waste only and kitchen waste + insects
Degrees of freedom
Sum of squares Mean square F value P value
1 0.177 0.177 1.39 0.282
6 0.762 0,127
Total 7 0.939
Results show that there is no significant difference between the KW only and KW + insects
dietary groups (p>0.05). _30__
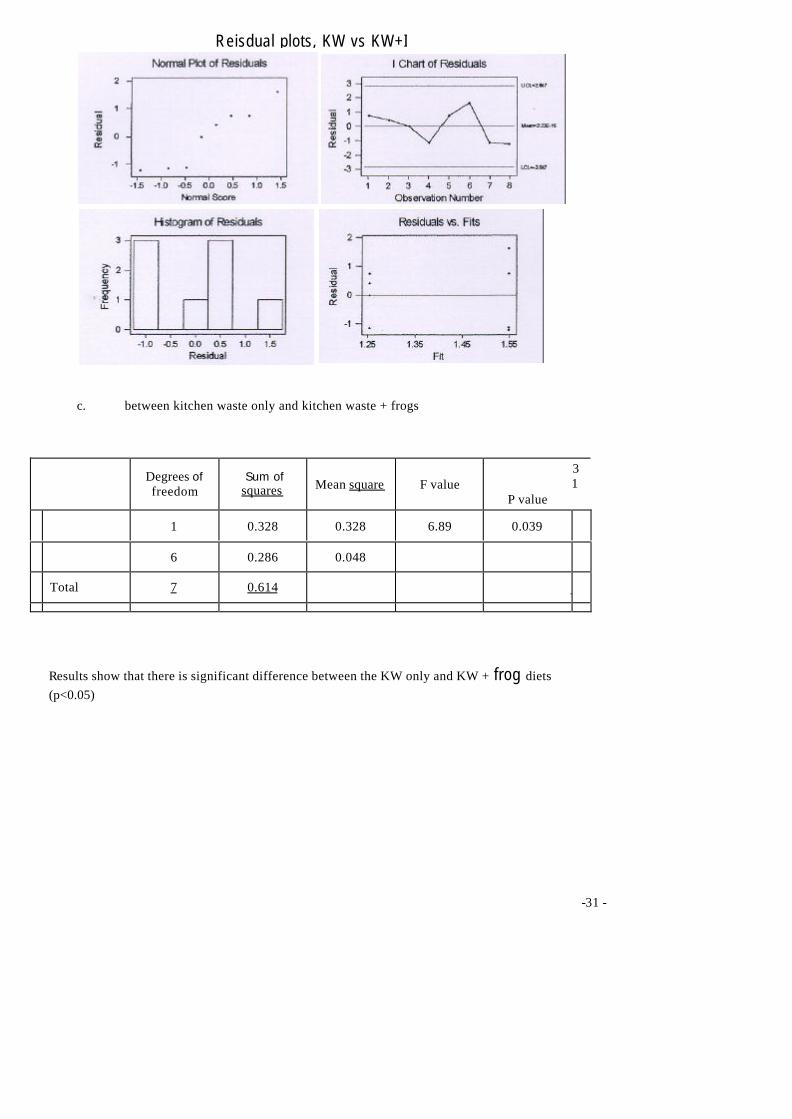
Reisdual plots, KW vs KW+I
Results show that there is significant difference between the KW only and KW + frog diets (p<0.05)
c. between kitchen waste only and kitchen waste + frogs
Degrees of freedom
Sum of squares Mean square F value
3 1
P value
1 0.328 0.328 6.89 0.039
6 0.286 0.048
Total 7 0.614 I
-31 -
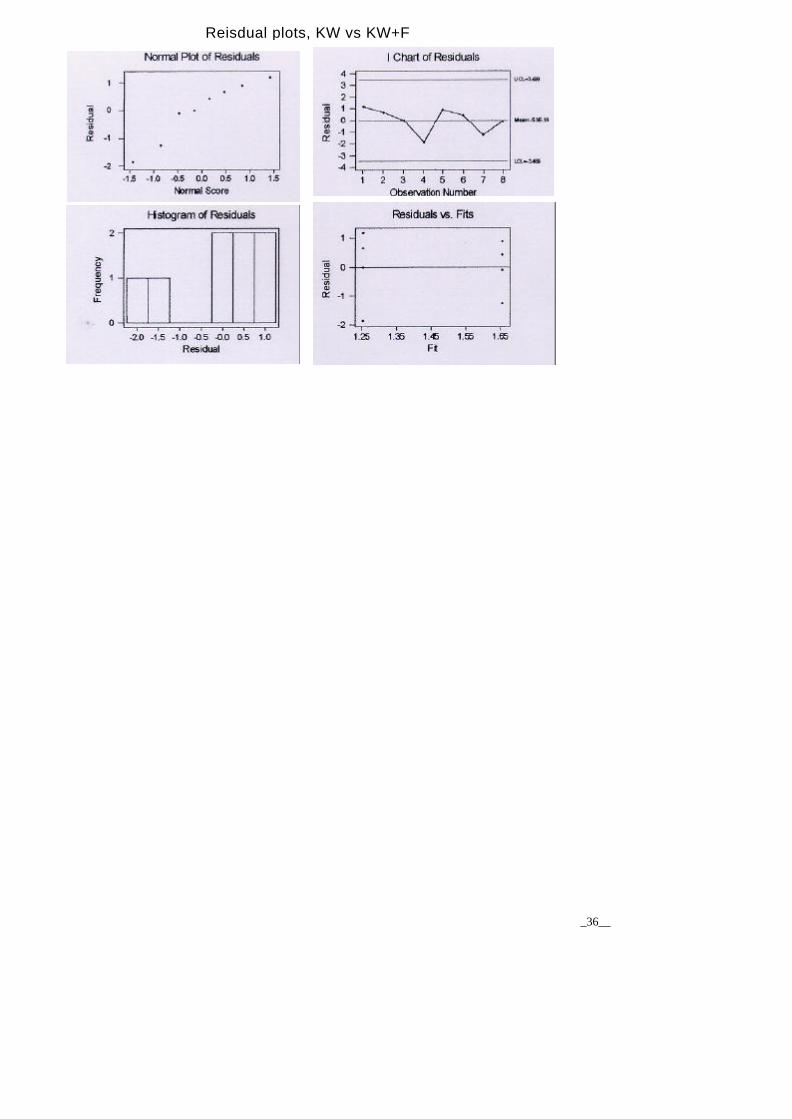
Reisdual plots, KW vs KW+F
_36__
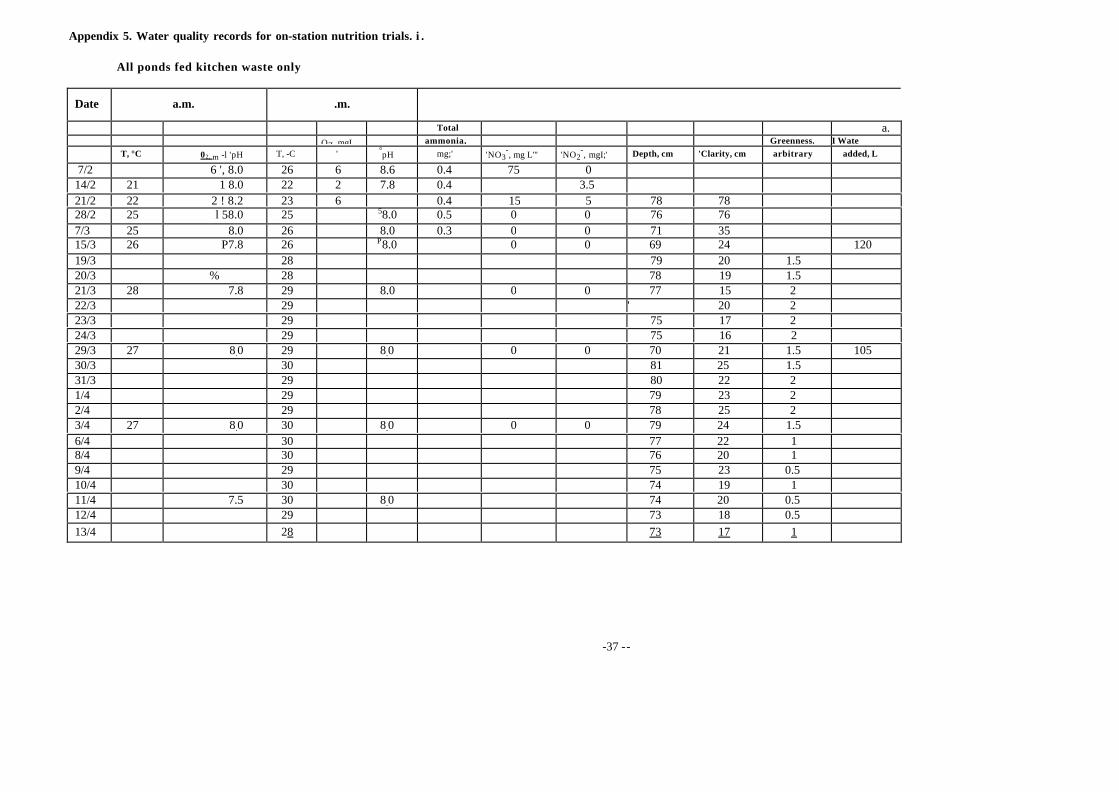
Appendix 5. Water quality records for on-station nutrition trials. i .
All ponds fed kitchen waste only
Date a.m. .m.
Total a. OZ, mgL _ ammonia, Greenness, I Wate T, °C 02, m -l 'pH T, -C ' °pH mg;' 'NO3
-, mg L"' 'NO2-, mgI;' Depth, cm 'Clarity, cm arbitrary added, L
7/2 6 ', 8.0 26 6 8.6 0.4 75 0 14/2 21 1 8.0 22 2 7.8 0.4 3.5 21/2 22 2 ! 8.2 23 6 0.4 15 5 78 78 28/2 25 l 58.0 25 58.0 0.5 0 0 76 76 7/3 25 8.0 26 8.0 0.3 0 0 71 35 15/3 26 P7.8 26 P8.0 0 0 69 24 120 19/3 28 79 20 1.5 20/3 % 28 78 19 1.5 21/3 28 7.8 29 8.0 0 0 77 15 2 22/3 29 ' 20 2 23/3 29 75 17 2 24/3 29 75 16 2 29/3 27 8.0 29 8.0 0 0 70 21 1.5 105 30/3 30 81 25 1.5 31/3 29 80 22 2 1/4 29 79 23 2 2/4 29 78 25 2 3/4 27 8.0 30 8.0 0 0 79 24 1.5 6/4 30 77 22 1 8/4 30 76 20 1 9/4 29 75 23 0.5 10/4 30 74 19 1 11/4 7.5 30 8.0 74 20 0.5 12/4 29 73 18 0.5 13/4 28 73 17 1
-37 --
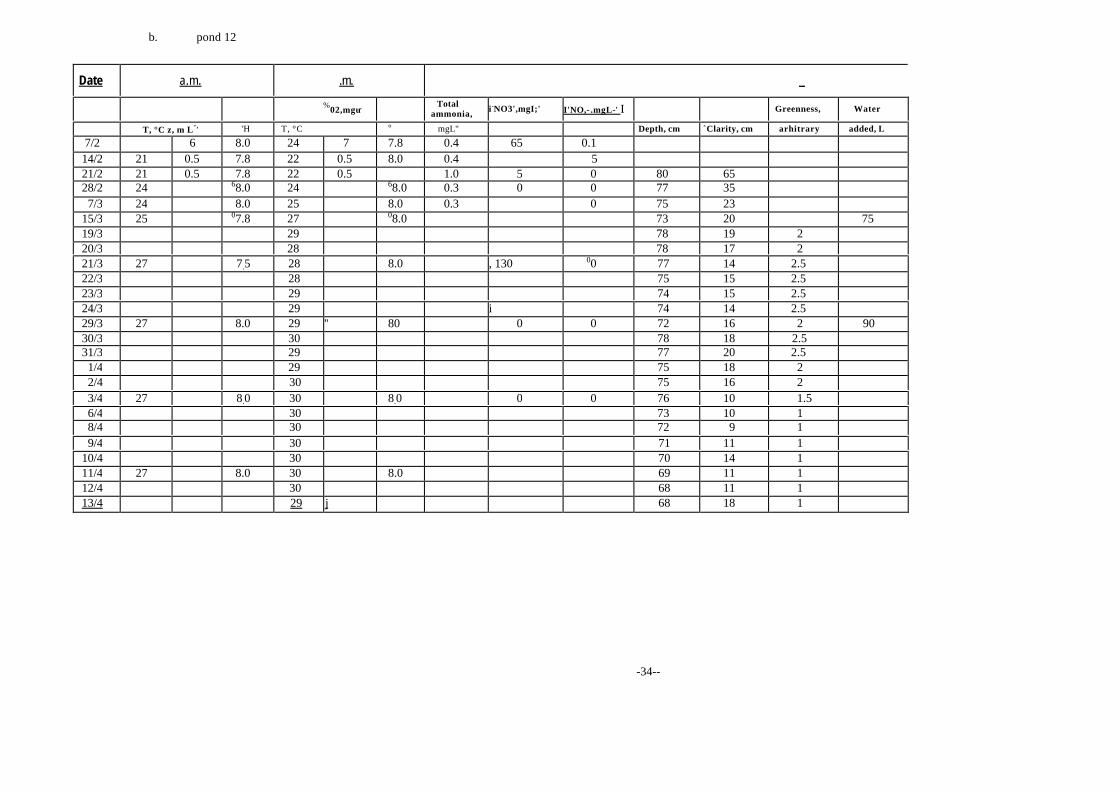
b. pond 12
Date a.m. .m. _
%02,mgu, Total ammonia, i-NO3',mgI;' I'NO,- .mgL-' I Greenness, Water
T, °C z, m L-, 'H T, °C ° H
mgL'' Depth, cm `Clarity, cm arhitrary added, L
7/2 6 8.0 24 7 7.8 0.4 65 0.1 14/2 21 0.5 7.8 22 0.5 8.0 0.4 5 21/2 21 0.5 7.8 22 0.5 1.0 5 0 80 65 28/2 24 68.0 24 68.0 0.3 0 0 77 35 7/3 24 8.0 25 8.0 0.3 0 75 23
15/3 25 07.8 27 08.0 73 20 75 19/3 29 78 19 2 20/3 28 78 17 2 21/3 27 7.5 28 8.0 , 130 00 77 14 2.5 22/3 28 75 15 2.5 23/3 29 74 15 2.5 24/3 29 i 74 14 2.5 29/3 27 8.0 29 '' 80 0 0 72 16 2 90 30/3 30 78 18 2.5 31/3 29 77 20 2.5 1/4 29 75 18 2 2/4 30 75 16 2 3/4 27 8.0 30 8.0 0 0 76 10 1.5 6/4 30 73 10 1 8/4 30 72 9 1 9/4 30 71 11 1
10/4 30 70 14 1 11/4 27 8.0 30 8.0 69 11 1 12/4 30 68 11 1 13/4 29 j 68 18 1
-34--

Date a.m. .m.
Total X02, mgL- ammon ia, Greenness, Water T, °C "' ° T, °C ' H n1gL' °N03 m L"' 'No,-, m L"' Depth, cm `Clad cm arbitrary• added, L
7/2 6 8.0 26 6 8.0 0.4 75 0.1 14/2 21 ' 0.5 8.0 22 1 8.0 0.3 1 5 21/2 22 2 8.0 23 6 0.3 20 5 86 86 28/2 24 68.0 25 57.8 0.5 0 0 84 84 7/3 25 8.0 25 8.0 0.3 0 0 82 80
15/3 26 P8.0 26 P8.0 0 0 80 37 90 19/3 28 89 40 0.5 20/3 28 89 42 0.5 21/3 27 7_8 29 % 8.0 D0 00.02 88 49 0 22/3 29 87 55 0 23/3 29 86 60 1 0 24/3 29 85 61 0 29/3 28 8.0 29 8.0 0 0 81 54 0 105 30/3 29 91 60 0 31/3 29 90 56 0 1/4 29 89 51 0 2/4 29 89 44 0 3/4 27 8.0 29 8.0 0 0 90 31 0 6/4 30 87 27 0 8/4 30 85 28 0.5 9/4 29 85 26 0.5
10/4 29 84 24 0.5 11/4 28 7.5 30 8.0 84 23 1 12/4 29 83 24 1 13/4 29 82 26 1
-339--
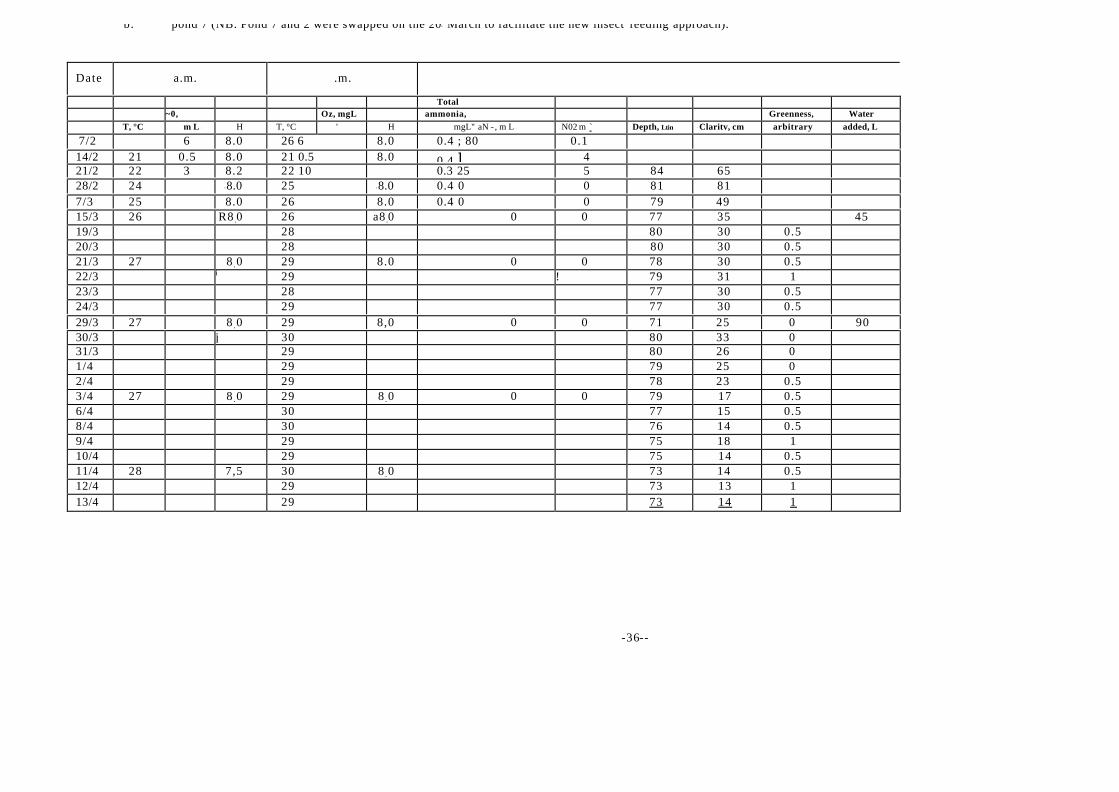
b. pond 7 (NB. Pond 7 and 2 were swapped on the 20th March to facilitate the new insect feeding approach).
Date a.m. .m.
Total ~0, Oz, mgL- ammonia, Greenness, Water T, °C m L - ' H T, °C ' H mgL" aN - , m L - ' - N02 m ̀ Depth, Ltin ° Claritv, cm arbitrary added, L
7/2 6 8.0 26 6 8.0 0.4 ; 80 0.1 14/2 21 0.5 8.0 21 0.5 8.0 0.4 I 4 21/2 22 3 8.2 22 10 0.3 25 5 84 65 28/2 24 6 8.0 25
1
6 8.0 0.4 0 0 81 81 7/3 25 8.0 26 8.0 0.4 0 0 79 49 15/3 26 R8 .0 26 a8 .0 0 0 77 35 45 19/3 28 80 30 0.5 20/3 28 80 30 0.5 21/3 27 8 .0 29 8.0 0 0 78 30 0.5 22/3 i 29 ! 79 31 1 23/3 28 77 30 0.5 24/3 29 77 30 0.5 29/3 27 8 .0 29 8,0 0 0 71 25 0 90 30/3 j 30 80 33 0 31/3 29 80 26 0 1/4 29 79 25 0 2/4 29 78 23 0.5 3/4 27 8 .0 29 8 .0 0 0 79 17 0.5 6/4 30 77 15 0.5 8/4 30 76 14 0.5 9/4 29 75 18 1 10/4 29 75 14 0.5 11/4 28 7,5 30 8 .0 73 14 0.5 12/4 29 73 13 1 13/4 29 73 14 1
-36--
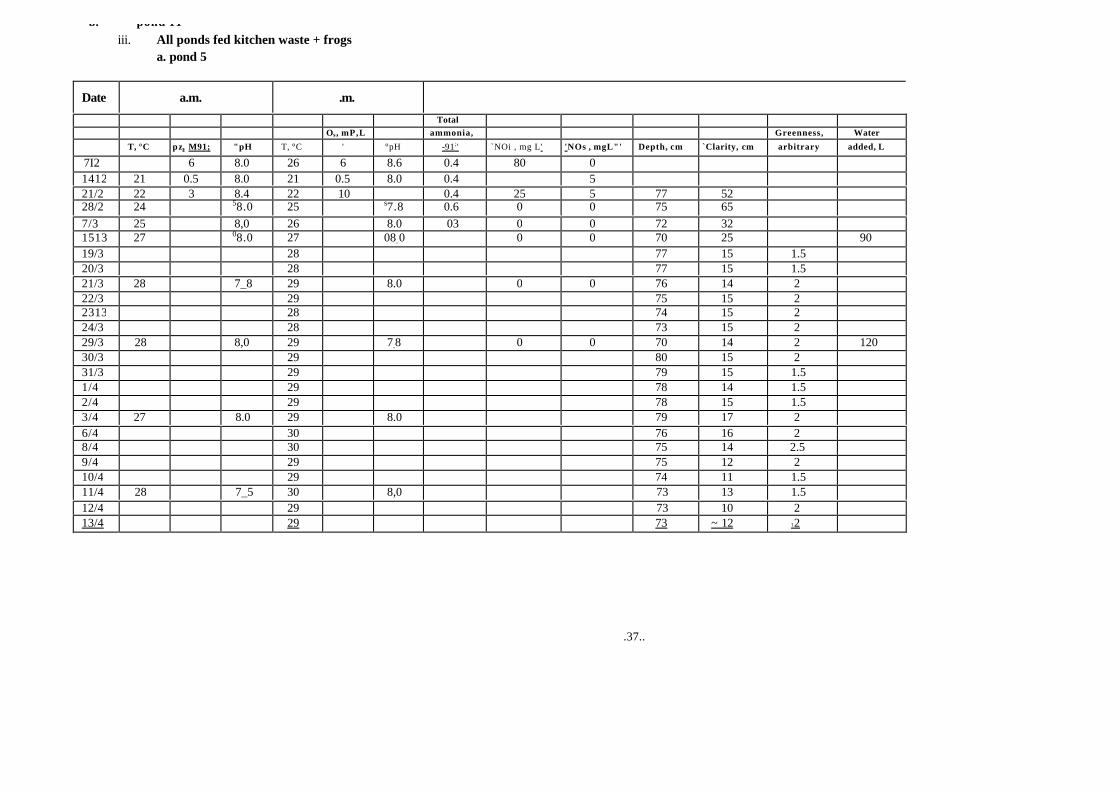
iii. All ponds fed kitchen waste + frogs a. pond 5
Date a.m. .m.
Total Os, mP,L ammonia, Greenness, Water
T, °C pz, M91; "pH T, °C ' °pH -91;' `NOi , mg L' 'NOs , mgL"' Depth, cm `Clarity, cm arbitrary added, L
7I2 6 8.0 26 6 8.6 0.4 80 0 1412 21 0.5 8.0 21 0.5 8.0 0.4 5 21/2 22 3 8.4 22 10 0.4 25 5 77 52 28/2 24 58.0 25 s7.8 0.6 0 0 75 65 7/3 25 8,0 26 8.0 03 0 0 72 32 1513 27 08.0 27 08.0 0 0 70 25 90 19/3 28 77 15 1.5 20/3 28 77 15 1.5 21/3 28 7_8 29 8.0 0 0 76 14 2 22/3 29 75 15 2 2313 28 74 15 2 24/3 28 73 15 2 29/3 28 8,0 29 7.8 0 0 70 14 2 120 30/3 29 80 15 2 31/3 29 79 15 1.5 1/4 29 78 14 1.5 2/4 29 78 15 1.5 3/4 27 8.0 29 8.0 79 17 2 6/4 30 76 16 2 8/4 30 75 14 2.5 9/4 29 75 12 2 10/4 29 74 11 1.5 11/4 28 7_5 30 8,0 73 13 1.5 12/4 29 73 10 2 13/4 29 73 ~ 12 1 2
.37..
b. pond 11
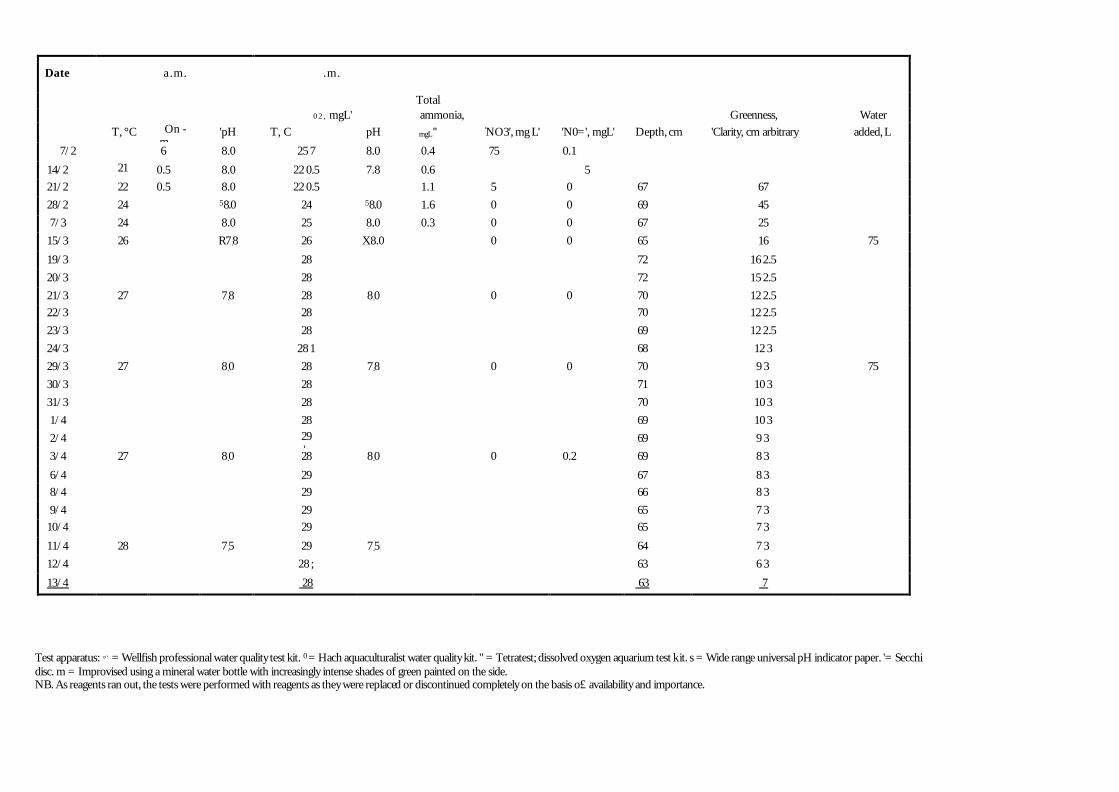
Date a.m. .m.
Total 02, mgL' ammonia, Greenness, Water T, °C On -
m 'pH T, C pH mgL'' 'NO3', mg L' 'N0=', mgL' Depth, cm 'Clarity, cm arbitrary added, L
7/2 6 8.0 25 7 8.0 0.4 75 0.1
14/2 21
0.5 8.0 22 0.5 7.8 0.6 5 21/2 22 0.5 8.0 22 0.5 1.1 5 0 67 67 28/2 24 58.0 24 58.0 1.6 0 0 69 45 7/3 24 8.0 25 8.0 0.3 0 0 67 25 15/3 26 R7.8 26 X8.0 0 0 65 16 75
19/3 28 72 16 2.5 20/3 28 72 15 2.5 21/3 27 7.8 28 8.0 0 0 70 12 2.5 22/3 28 70 12 2.5 23/3 28 69 12 2.5 24/3 28 1 68 12 3 29/3 27 8.0 28 7.8 0 0 70 9 3 75 30/3 28 71 10 3 31/3 28 70 10 3 1/4 28 69 10 3 2/4 29
I, 69 9 3
3/4 27 8.0 28 8.0 0 0.2 69 8 3
6/4 29 67 8 3 8/4 29 66 8 3 9/4 29 65 7 3 10/4 29 65 7 3
11/4 28 7.5 29 7.5 64 7 3 12/4 28 ; 63 6 3
13/4 28 63 7
Test apparatus: °` = Wellfish professional water quality test kit. 0 = Hach aquaculturalist water quality kit. " = Tetratest; dissolved oxygen aquarium test kit. s = Wide range universal pH indicator paper. '= Secchi disc. m = Improvised using a mineral water bottle with increasingly intense shades of green painted on the side. NB. As reagents ran out, the tests were performed with reagents as they were replaced or discontinued completely on the basis o£ availability and importance.
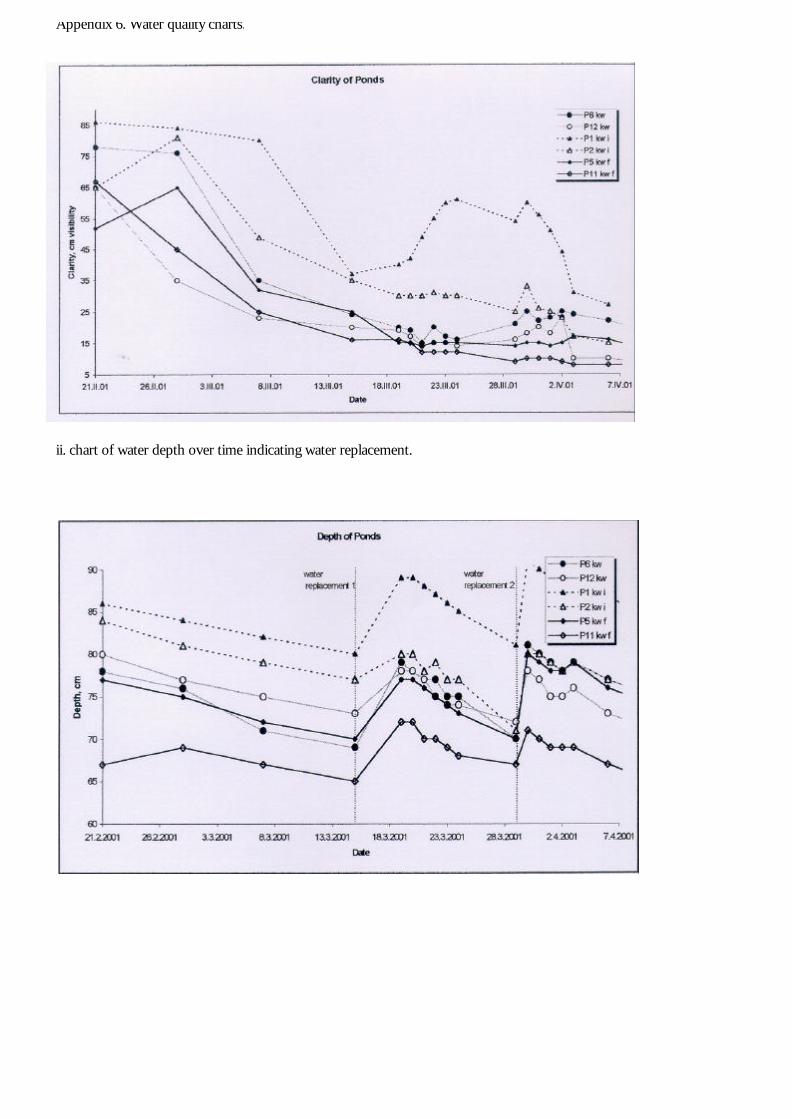
Appendix 6. Water quality charts.
ii. chart of water depth over time indicating water replacement.

iii. Temperature and oxygen production in selected ponds.
-44--
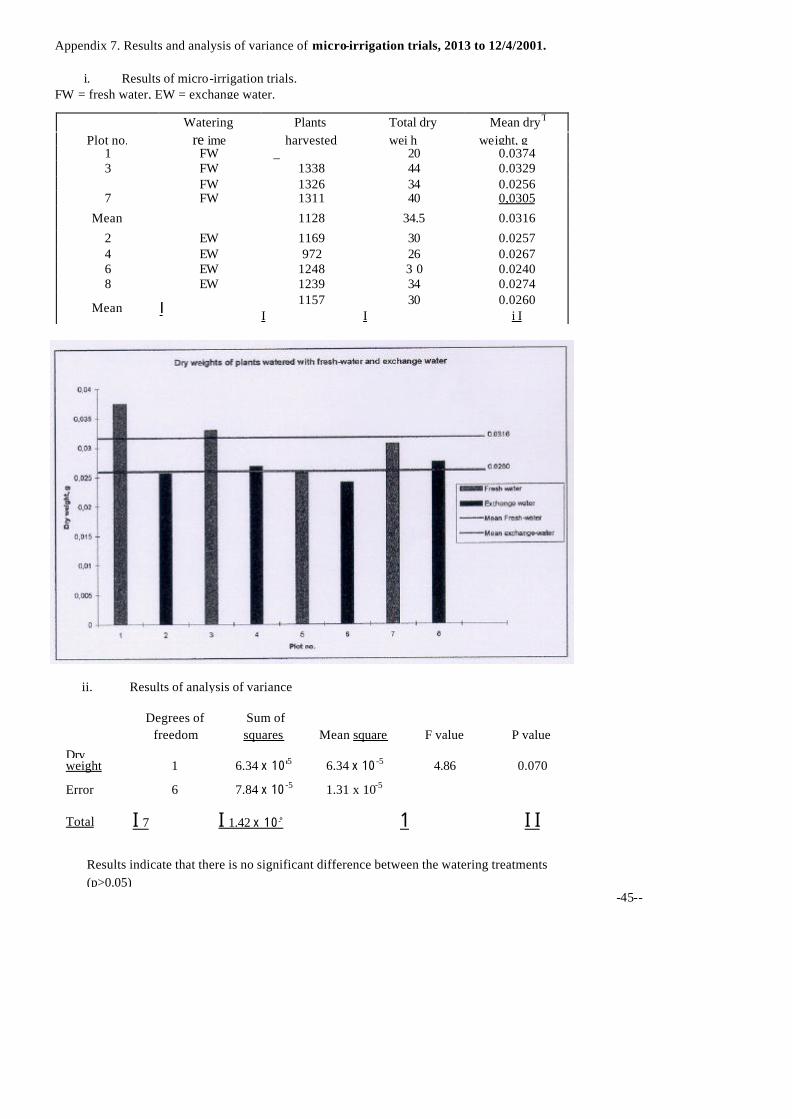
Appendix 7. Results and analysis of variance of micro-irrigation trials, 2013 to 12/4/2001.
i. Results of micro-irrigation trials. FW = fresh water, EW = exchange water.
Watering Plants Total dry Mean dryT Plot no. re ime harvested wei h _weight, g
1 FW _ 20 0.0374 3 FW 1338 44 0.0329
FW 1326 34 0.0256 7 FW 1311 40 0,0305
Mean 1128 34.5 0.0316
2 EW 1169 30 0.0257 4 EW 972 26 0.0267 6 EW 1248 3 0 0.0240 8 EW 1239 34 0.0274
Mean I 1157 I
30 I
0.0260 i I
ii. Results of analysis of variance
Degrees of Sum of freedom squares Mean square F value P value Dry
weight 1 6.34 x 10'5 6.34 x 10 -5 4.86 0.070
Error 6 7.84 x 10 -5 1.31 x 10⁻⁵
Total I 7 I 1.42 x 10 -° 1 I I
Results indicate that there is no significant difference between the watering treatments (p>0.05)
-45--
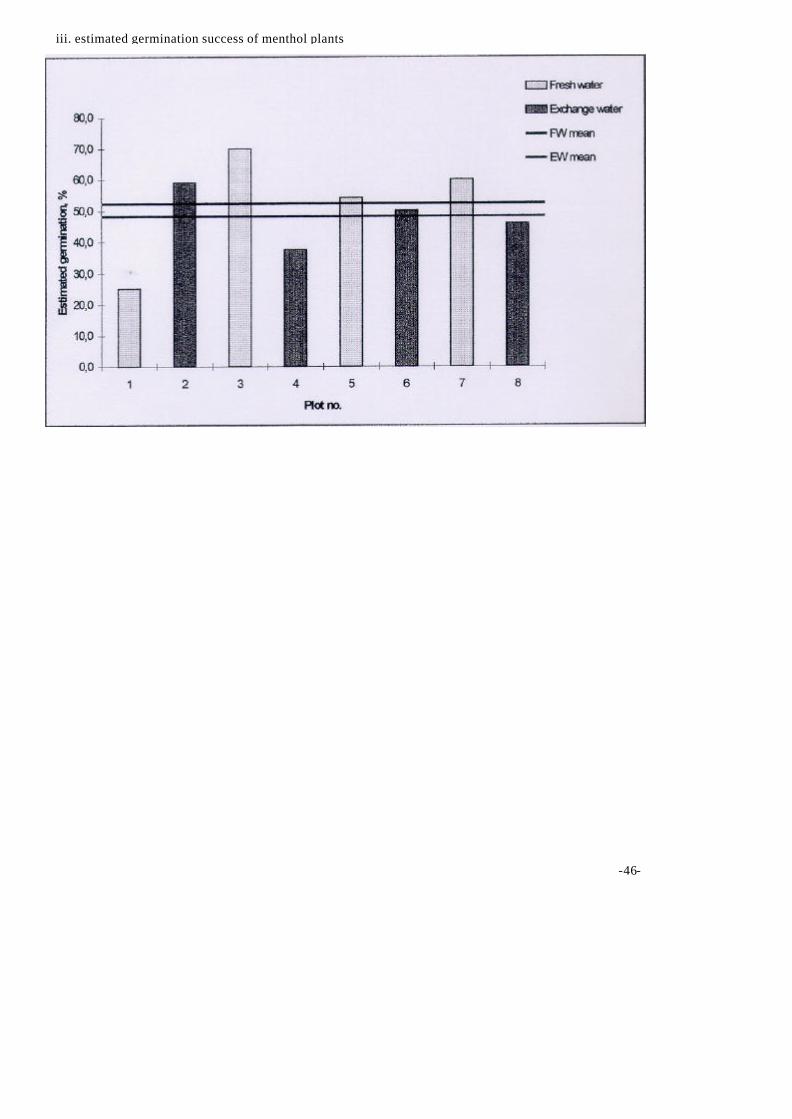
iii. estimated germination success of menthol plants
-46-

Appendix 8. Data recording sheets for on-station nutrition trials. Weekly Weight and Length Monitoring Record Sheets Date:- w = weight, I = length, T = total, $ = bulk, F = no. of fish.
-47--

Nutrition trials feed record sheet
-48--
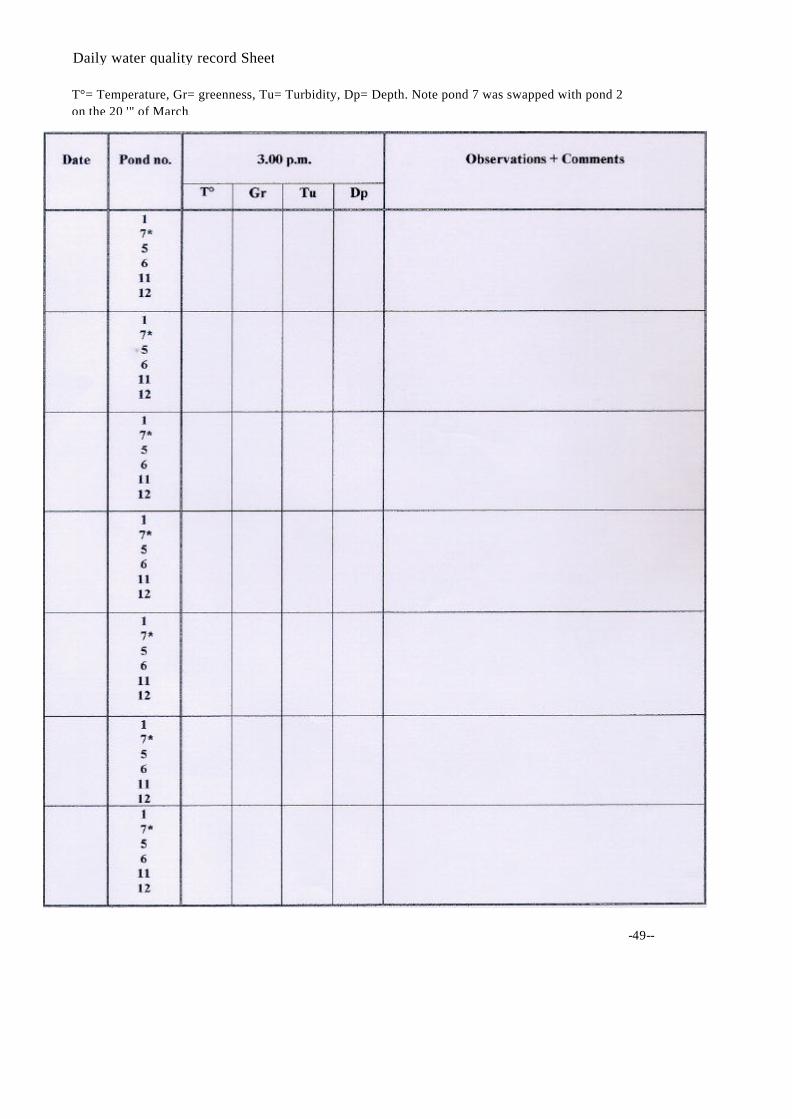
Daily water quality record Sheet
T°= Temperature, Gr= greenness, Tu= Turbidity, Dp= Depth. Note pond 7 was swapped with pond 2 on the 20 '" of March.
-49--
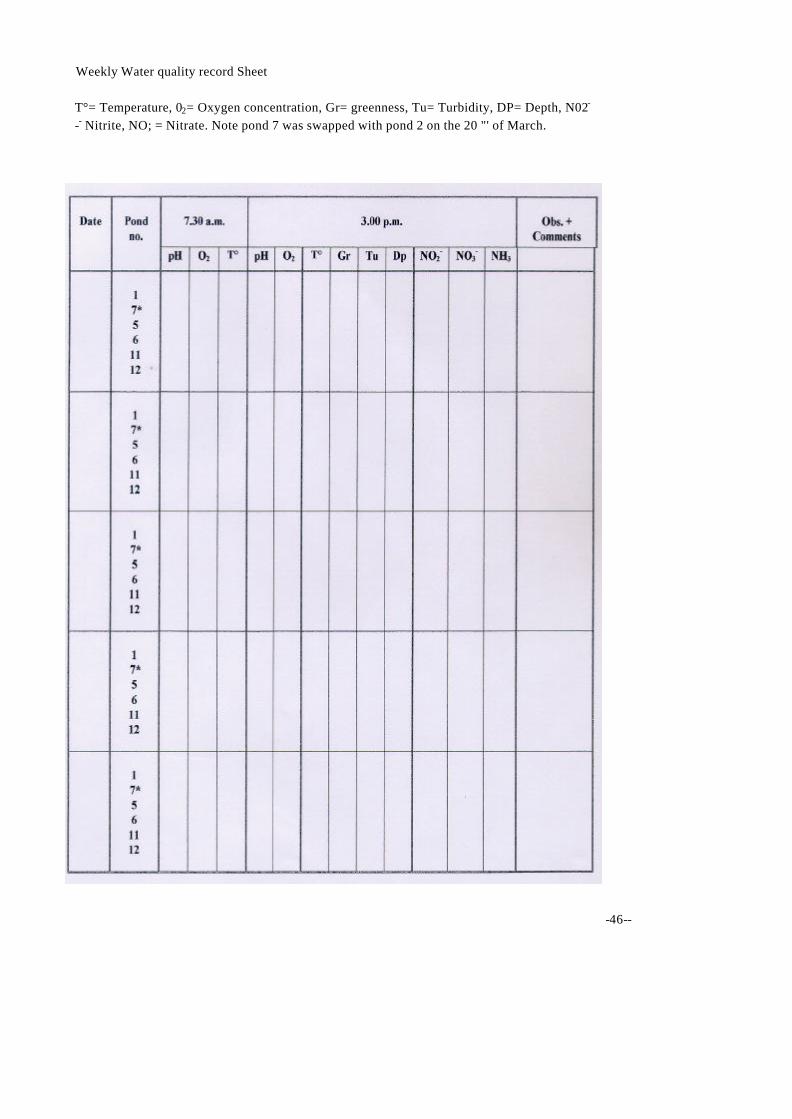
Weekly Water quality record Sheet
T°= Temperature, 02= Oxygen concentration, Gr= greenness, Tu= Turbidity, DP= Depth, N02-
-- Nitrite, NO; = Nitrate. Note pond 7 was swapped with pond 2 on the 20 "' of March.
-46--
Recommended