Putnam Small Cap Growth Fund
FUND SYMBOL CLASS A
PNSAX
Annual report 6 | 30 | 18
Growth funds look for stocks of companies that have the potential to grow over time.
Putnam Small Cap Growth FundAnnual report 6 | 30 | 18
Message from the Trustees 1
Interview with your fund’s portfolio manager 3
Your fund’s performance 8
Your fund’s expenses 10
Terms and definitions 12
Other information for shareholders 13
Important notice regarding Putnam’s privacy policy 14
Trustee approval of management contract 15
Financial statements 20
Federal tax information 41
About the Trustees 42
Officers 44
Consider these risks before investing: Investments in small and/or midsize companies increase the risk of greater price fluctuations. Growth stocks may be more susceptible to earnings disappointments, and the market may not favor growth-style investing. Stock prices may fall or fail to rise over time for a variety of reasons, including general financial market conditions, changing market perceptions, changes in govern-ment intervention in the financial markets, and factors related to a specific issuer or industry. These and other factors may lead to increased volatility and reduced liquidity in the fund’s portfolio holdings. From time to time, the fund may invest a significant portion of its assets in companies in one or more related industries or sectors, which would make the fund more vulnerable to adverse developments affecting those industries or sectors. You can lose money by investing in the fund.
August 13, 2018
Dear Fellow Shareholder:
During the first half of 2018, conditions became more challenging for global financial markets. After an extended period of record advances and low volatility, a downturn early in the year pushed stocks into a brief correction. The market has since rallied, but both stocks and bonds have been more volatile, due in part to uncertainty surrounding trade policy and interest rates. Fortunately, navigating a change in market trends is nothing new to Putnam’s experienced investment professionals, who continue to monitor risks and seek opportunities.
We would like to take this opportunity to extend our thanks to Jameson A. Baxter, who retired from her position as Chair of your Board of Trustees on June 30, 2018. It is hard to express in a few words the extent of Jamie’s commitment to protecting the interests of Putnam shareholders like you. In addition to her professional and directorship experience, Jamie brought intelligence, insight, and compassion to a board she served for decades. Jamie began as a Trustee in 1994, served as Vice Chair for six years, and became Chair in 2011. We are also pleased to announce the appointment of Kenneth R. Leibler as your new Board of Trustees Chair. Ken became a Trustee in 2006, has served as Vice Chair since 2016, and now leads the Board in overseeing your fund and protecting your interests.
Thank you for investing with Putnam.
Respectfully yours,
Robert L. ReynoldsPresident and Chief Executive OfficerPutnam Investments
Kenneth R. LeiblerChair, Board of Trustees
Message from the Trustees
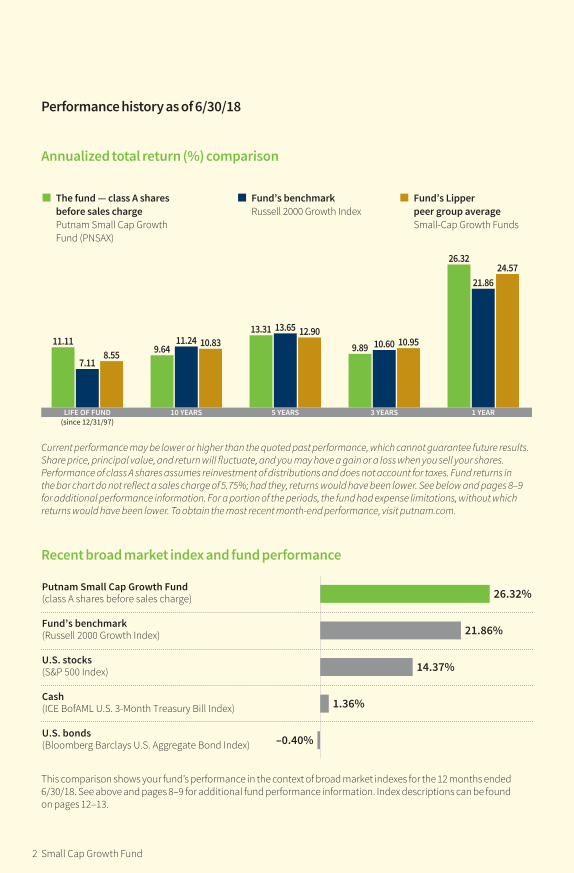
Performance history as of 6/30/18
Annualized total return (%) comparison
LIFE OF FUND(since 12/31/97)
10 YEARS 5 YEARS 3 YEARS 1 YEAR
11.11
7.118.55 9.64
11.24 10.8313.31 13.65 12.90
9.89 10.60 10.95
26.32
21.8624.57
The fund — class A sharesbefore sales chargePutnam Small Cap GrowthFund (PNSAX)
Fund’s benchmarkRussell 2000 Growth Index
Fund’s Lipper peer group averageSmall-Cap Growth Funds
Current performance may be lower or higher than the quoted past performance, which cannot guarantee future results. Share price, principal value, and return will fluctuate, and you may have a gain or a loss when you sell your shares. Performance of class A shares assumes reinvestment of distributions and does not account for taxes. Fund returns in the bar chart do not reflect a sales charge of 5.75%; had they, returns would have been lower. See below and pages 8–9 for additional performance information. For a portion of the periods, the fund had expense limitations, without which returns would have been lower. To obtain the most recent month-end performance, visit putnam.com.
Recent broad market index and fund performance
26.32%
21.86%
14.37%
1.36%
–0.40%
Putnam Small Cap Growth Fund (class A shares before sales charge)
Fund’s benchmark (Russell 2000 Growth Index)
U.S. stocks (S&P 500 Index)
Cash (ICE BofAML U.S. 3-Month Treasury Bill Index)
U.S. bonds (Bloomberg Barclays U.S. Aggregate Bond Index)
This comparison shows your fund’s performance in the context of broad market indexes for the 12 months ended 6/30/18. See above and pages 8–9 for additional fund performance information. Index descriptions can be found on pages 12–13.
2 Small Cap Growth Fund
Interview with your fund’s portfolio manager
William J. Monroe, CFAPortfolio Manager
Bill has an M.B.A. from the University of Chicago Booth School of Business and a B.S. in Finance from Miami University. He joined Putnam in 2012 and has been in the investment industry since 1996.
Bill, how was the environment for stock market investing during the reporting period?Conditions for the U.S. stock market overall were generally positive for most of the 12-month period. On average, growth-oriented stocks, the focus of this fund, outperformed value stocks. From the start of the period in July 2017 through the end of the 2017 calendar year, we saw below-average volatility in the market, and stocks advanced despite a number of political and economic uncertainties that could have disrupted the market’s momentum.
Investor optimism about U.S. tax reform, which was signed into law on December 22, 2017; a solidly improving U.S. economy; and strong corporate earnings contributed to a favorable environment for stocks in the back half of 2017. For the 2017 calendar year, all three major U.S. stock indexes had their best annual returns since 2013. The Dow Jones Industrial Average, the S&P 500 Index, and the Nasdaq Composite Index all posted dozens of record closes throughout 2017.
The strong performance for the stock market continued into January 2018, but soon after, conditions became a bit more challenging. In
Bill Monroe discusses the investing environment and fund performance for the 12-month period ended June 30, 2018, as well as his outlook for small-cap stocks going forward.
Interview with your fund’s portfolio manager
Performance history as of 6/30/18
Annualized total return (%) comparison
LIFE OF FUND(since 12/31/97)
10 YEARS 5 YEARS 3 YEARS 1 YEAR
11.11
7.118.55 9.64
11.24 10.8313.31 13.65 12.90
9.89 10.60 10.95
26.32
21.8624.57
The fund — class A sharesbefore sales chargePutnam Small Cap GrowthFund (PNSAX)
Fund’s benchmarkRussell 2000 Growth Index
Fund’s Lipper peer group averageSmall-Cap Growth Funds
Current performance may be lower or higher than the quoted past performance, which cannot guarantee future results. Share price, principal value, and return will fluctuate, and you may have a gain or a loss when you sell your shares. Performance of class A shares assumes reinvestment of distributions and does not account for taxes. Fund returns in the bar chart do not reflect a sales charge of 5.75%; had they, returns would have been lower. See below and pages 8–9 for additional performance information. For a portion of the periods, the fund had expense limitations, without which returns would have been lower. To obtain the most recent month-end performance, visit putnam.com.
Recent broad market index and fund performance
26.32%
21.86%
14.37%
1.36%
–0.40%
Putnam Small Cap Growth Fund (class A shares before sales charge)
Fund’s benchmark (Russell 2000 Growth Index)
U.S. stocks (S&P 500 Index)
Cash (ICE BofAML U.S. 3-Month Treasury Bill Index)
U.S. bonds (Bloomberg Barclays U.S. Aggregate Bond Index)
This comparison shows your fund’s performance in the context of broad market indexes for the 12 months ended 6/30/18. See above and pages 8–9 for additional fund performance information. Index descriptions can be found on pages 12–13.
Small Cap Growth Fund 3
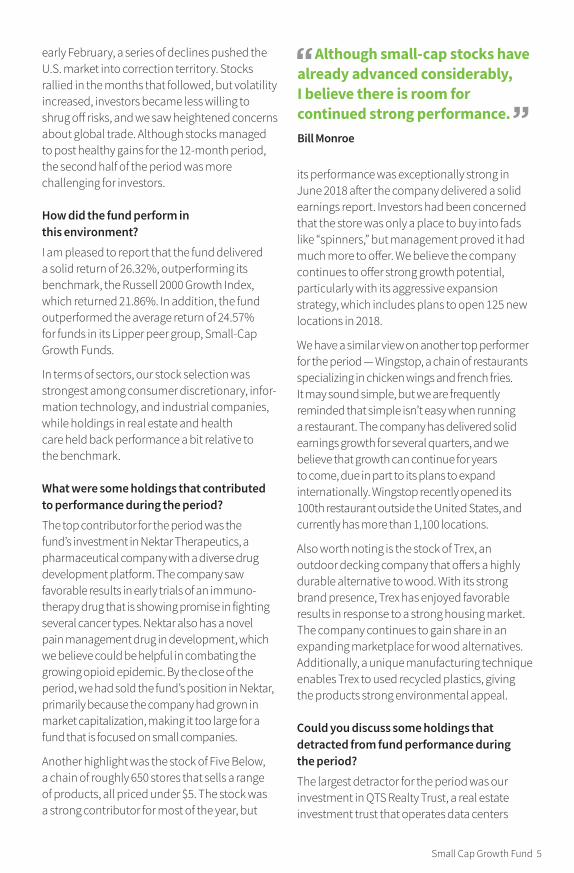
Top 10 holdings
HOLDING (PERCENTAGE OF FUND’S NET ASSETS)
INDUSTRY
OVER/UNDERWEIGHT VS. BENCHMARK
Five Below, Inc. (2.8%) Specialty retail
RealPage, Inc. (2.3%) Software
Wingstop, Inc. (2.3%) Hotels, restaurants, and leisure
SiteOne Landscape Supply, Inc. (2.2%) Trading companies and distributors
Hamilton Lane, Inc. (2.2%) Capital markets
Trex Co., Inc. (2.2%) Building products
Ligand Pharmaceuticals, Inc. (2.1%) BiotechnologyBright Horizons Family Solutions, Inc. (2.1%) Diversified consumer services
Grand Canyon Education, Inc. (2.1%) Diversified consumer services
Merit Medical Systems, Inc. (2.1%) Health-care equipment and supplies 1.9%
2.3%
2.3%
2.2%
1.9%
1.9%
1.7%
2.1%
2.1%
2.1%
This table shows the fund’s top 10 holdings by percentage of the fund’s net assets as of 6/30/18. Short-term investments and derivatives, if any, are excluded. Holdings may vary over time.
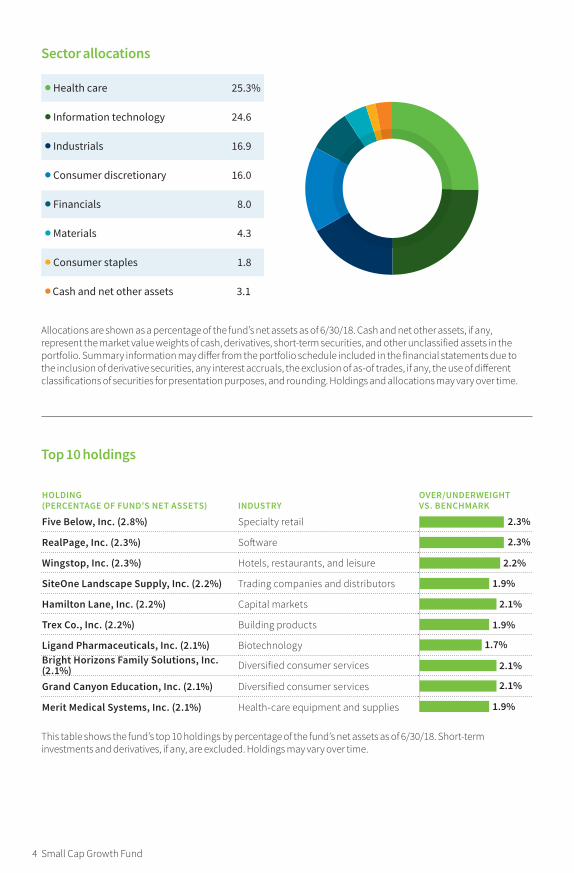
Sector allocations
Health care 25.3%
Information technology 24.6
Industrials 16.9
Consumer discretionary 16.0
Financials 8.0
Materials 4.3
Consumer staples 1.8
Cash and net other assets 3.1
Allocations are shown as a percentage of the fund’s net assets as of 6/30/18. Cash and net other assets, if any, represent the market value weights of cash, derivatives, short-term securities, and other unclassified assets in the portfolio. Summary information may differ from the portfolio schedule included in the financial statements due to the inclusion of derivative securities, any interest accruals, the exclusion of as-of trades, if any, the use of different classifications of securities for presentation purposes, and rounding. Holdings and allocations may vary over time.
4 Small Cap Growth Fund
early February, a series of declines pushed the U.S. market into correction territory. Stocks rallied in the months that followed, but volatility increased, investors became less willing to shrug off risks, and we saw heightened concerns about global trade. Although stocks managed to post healthy gains for the 12-month period, the second half of the period was more challenging for investors.
How did the fund perform in this environment?I am pleased to report that the fund delivered a solid return of 26.32%, outperforming its benchmark, the Russell 2000 Growth Index, which returned 21.86%. In addition, the fund outperformed the average return of 24.57% for funds in its Lipper peer group, Small-Cap Growth Funds.
In terms of sectors, our stock selection was strongest among consumer discretionary, infor-mation technology, and industrial companies, while holdings in real estate and health care held back performance a bit relative to the benchmark.
What were some holdings that contributed to performance during the period?The top contributor for the period was the fund’s investment in Nektar Therapeutics, a pharmaceutical company with a diverse drug development platform. The company saw favorable results in early trials of an immuno-therapy drug that is showing promise in fighting several cancer types. Nektar also has a novel pain management drug in development, which we believe could be helpful in combating the growing opioid epidemic. By the close of the period, we had sold the fund’s position in Nektar, primarily because the company had grown in market capitalization, making it too large for a fund that is focused on small companies.
Another highlight was the stock of Five Below, a chain of roughly 650 stores that sells a range of products, all priced under $5. The stock was a strong contributor for most of the year, but
its performance was exceptionally strong in June 2018 after the company delivered a solid earnings report. Investors had been concerned that the store was only a place to buy into fads like “spinners,” but management proved it had much more to offer. We believe the company continues to offer strong growth potential, particularly with its aggressive expansion strategy, which includes plans to open 125 new locations in 2018.
We have a similar view on another top performer for the period — Wingstop, a chain of restaurants specializing in chicken wings and french fries. It may sound simple, but we are frequently reminded that simple isn’t easy when running a restaurant. The company has delivered solid earnings growth for several quarters, and we believe that growth can continue for years to come, due in part to its plans to expand internationally. Wingstop recently opened its 100th restaurant outside the United States, and currently has more than 1,100 locations.
Also worth noting is the stock of Trex, an outdoor decking company that offers a highly durable alternative to wood. With its strong brand presence, Trex has enjoyed favorable results in response to a strong housing market. The company continues to gain share in an expanding marketplace for wood alternatives. Additionally, a unique manufacturing technique enables Trex to used recycled plastics, giving the products strong environmental appeal.
Could you discuss some holdings that detracted from fund performance during the period?The largest detractor for the period was our investment in QTS Realty Trust, a real estate investment trust that operates data centers
Although small-cap stocks have already advanced considerably, I believe there is room for continued strong performance. Bill Monroe
Small Cap Growth Fund 5
across North America. We were attracted to the broad proliferation of data usage and storage as a driver for data center demand, but during the period, our view of the company’s long-term growth potential became less positive as the company changed its operating strategy. We sold QTS from the portfolio by period-end.
Another disappointment for the period was Clovis Oncology, a biotechnology company specializing in cancer treatments. Clovis offers drugs that may be attractive to other firms that are seeking partnership opportunities. For this reason, many investors believed that Clovis was a likely takeover candidate. The stock’s decline during the period was largely due to investor disappointment that Clovis was not acquired. Although Clovis remained in the portfolio at the close of the period, we are assessing its long-term growth potential.
We continue to have strong conviction in the potential of John Bean Technologies, a company that specializes in food processing machinery. The company has a history of strong growth, a solid global footprint, and a talented management team, in our view. Its stock struggled during the period due in part to a manufacturing issue in one of its facilities.
We believe this is a short-term setback, and the stock remained in the portfolio at period-end.
As the fund begins a new fiscal year, what is your perspective on the small-cap investing environment?It is important to note that broad macro-economic themes generally do not have a significant influence on how I position the fund’s portfolio. My investment approach is based on researching the merits of individual companies, and I work to build a portfolio of stocks that I believe can outperform over various market cycles, based on my knowledge and assessment of the companies.
My outlook is positive for the U.S. stock market overall and although small-cap stocks have already advanced considerably, I believe there is room for continued strong perfor-mance. Small-cap companies are typically more domestically focused than are large-cap companies, so I believe they could see a signif-icant boost to profitability with the new lower corporate tax rates. In addition, small domestic companies tend to be less exposed to issues relating to global trade, which could be helpful in the current environment, in my view.
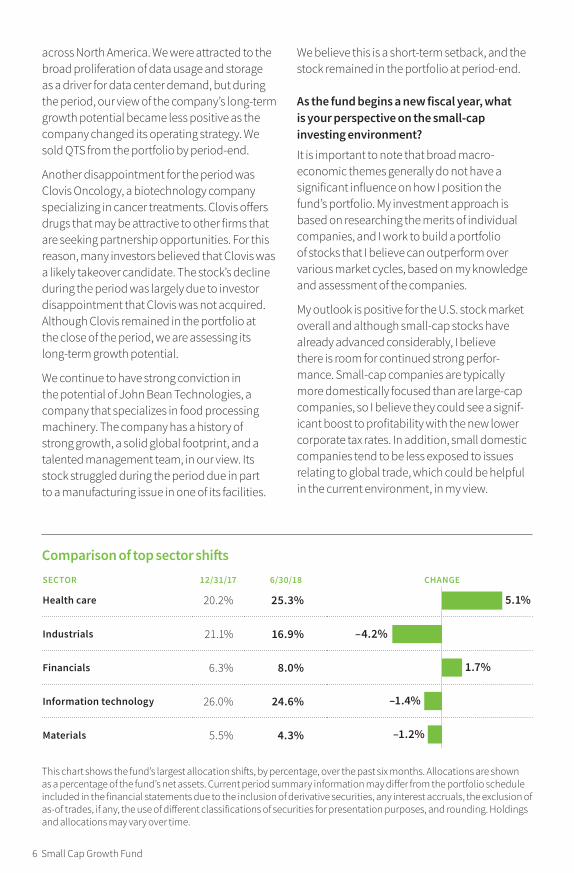
Comparison of top sector shiftsSECTOR 12/31/17 6/30/18 CHANGE
Health care 20.2% 25.3%
Industrials 21.1% 16.9%
Financials 6.3% 8.0%
Information technology 26.0% 24.6%
Materials 5.5% 4.3%
–1.4%
–1.2%
1.7%
–4.2%
5.1%
This chart shows the fund’s largest allocation shifts, by percentage, over the past six months. Allocations are shown as a percentage of the fund’s net assets. Current period summary information may differ from the portfolio schedule included in the financial statements due to the inclusion of derivative securities, any interest accruals, the exclusion of as-of trades, if any, the use of different classifications of securities for presentation purposes, and rounding. Holdings and allocations may vary over time.
6 Small Cap Growth Fund

Thank you, Bill, for your time and insights.
The views expressed in this report are exclusively those of Putnam Management and are subject to change. They are not meant as investment advice.
Please note that the holdings discussed in this report may not have been held by the fund for the entire period. Portfolio composition is subject to review in accordance with the fund’s investment
strategy and may vary in the future. Current and future portfolio holdings are subject to risk.
Statements in the Q&A concerning the fund’s performance or portfolio composition relative to those of the fund’s Lipper peer group may reference information produced by Lipper Inc. or through a third party.
Small Cap Growth Fund 7
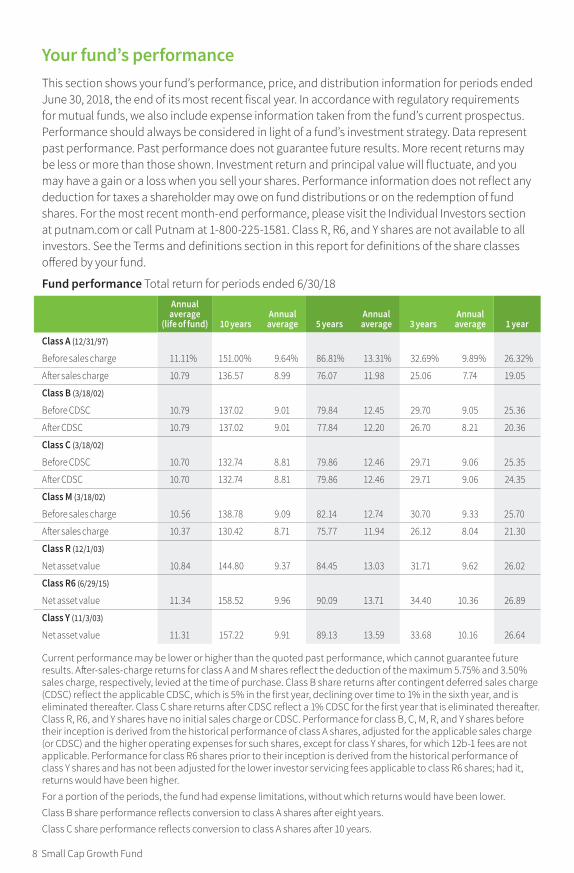
Your fund’s performanceThis section shows your fund’s performance, price, and distribution information for periods ended June 30, 2018, the end of its most recent fiscal year. In accordance with regulatory requirements for mutual funds, we also include expense information taken from the fund’s current prospectus. Performance should always be considered in light of a fund’s investment strategy. Data represent past performance. Past performance does not guarantee future results. More recent returns may be less or more than those shown. Investment return and principal value will fluctuate, and you may have a gain or a loss when you sell your shares. Performance information does not reflect any deduction for taxes a shareholder may owe on fund distributions or on the redemption of fund shares. For the most recent month-end performance, please visit the Individual Investors section at putnam.com or call Putnam at 1-800-225-1581. Class R, R6, and Y shares are not available to all investors. See the Terms and definitions section in this report for definitions of the share classes offered by your fund.
Fund performance Total return for periods ended 6/30/18
Annual average
(life of fund) 10 yearsAnnual average 5 years
Annual average 3 years
Annual average 1 year
Class A (12/31/97)
Before sales charge 11.11% 151.00% 9.64% 86.81% 13.31% 32.69% 9.89% 26.32%
After sales charge 10.79 136.57 8.99 76.07 11.98 25.06 7.74 19.05
Class B (3/18/02)
Before CDSC 10.79 137.02 9.01 79.84 12.45 29.70 9.05 25.36
After CDSC 10.79 137.02 9.01 77.84 12.20 26.70 8.21 20.36
Class C (3/18/02)
Before CDSC 10.70 132.74 8.81 79.86 12.46 29.71 9.06 25.35
After CDSC 10.70 132.74 8.81 79.86 12.46 29.71 9.06 24.35
Class M (3/18/02)
Before sales charge 10.56 138.78 9.09 82.14 12.74 30.70 9.33 25.70
After sales charge 10.37 130.42 8.71 75.77 11.94 26.12 8.04 21.30
Class R (12/1/03)
Net asset value 10.84 144.80 9.37 84.45 13.03 31.71 9.62 26.02
Class R6 (6/29/15)
Net asset value 11.34 158.52 9.96 90.09 13.71 34.40 10.36 26.89
Class Y (11/3/03)
Net asset value 11.31 157.22 9.91 89.13 13.59 33.68 10.16 26.64
Current performance may be lower or higher than the quoted past performance, which cannot guarantee future results. After-sales-charge returns for class A and M shares reflect the deduction of the maximum 5.75% and 3.50% sales charge, respectively, levied at the time of purchase. Class B share returns after contingent deferred sales charge (CDSC) reflect the applicable CDSC, which is 5% in the first year, declining over time to 1% in the sixth year, and is eliminated thereafter. Class C share returns after CDSC reflect a 1% CDSC for the first year that is eliminated thereafter. Class R, R6, and Y shares have no initial sales charge or CDSC. Performance for class B, C, M, R, and Y shares before their inception is derived from the historical performance of class A shares, adjusted for the applicable sales charge (or CDSC) and the higher operating expenses for such shares, except for class Y shares, for which 12b-1 fees are not applicable. Performance for class R6 shares prior to their inception is derived from the historical performance of class Y shares and has not been adjusted for the lower investor servicing fees applicable to class R6 shares; had it, returns would have been higher.
For a portion of the periods, the fund had expense limitations, without which returns would have been lower. Class B share performance reflects conversion to class A shares after eight years. Class C share performance reflects conversion to class A shares after 10 years.
8 Small Cap Growth Fund
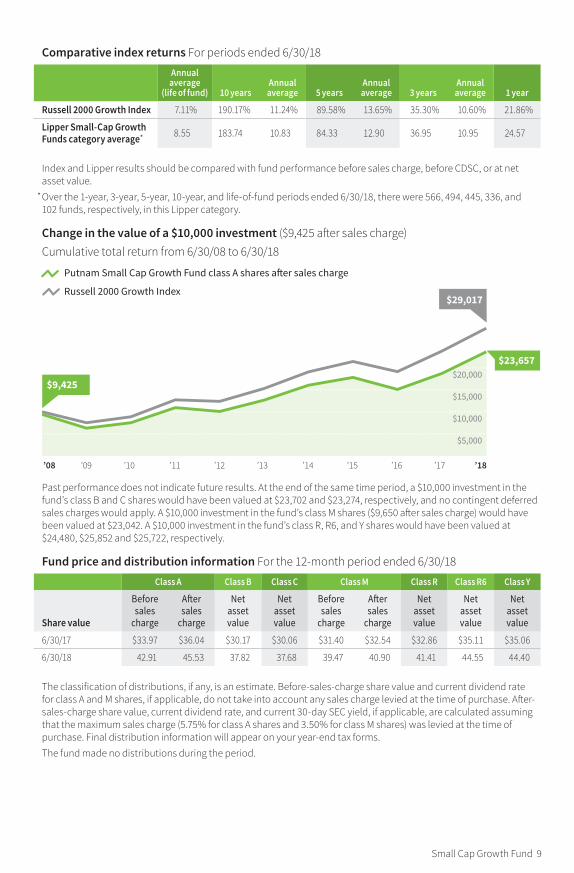
Comparative index returns For periods ended 6/30/18
Annual average
(life of fund) 10 yearsAnnual average 5 years
Annual average 3 years
Annual average 1 year
Russell 2000 Growth Index 7.11% 190.17% 11.24% 89.58% 13.65% 35.30% 10.60% 21.86%
Lipper Small-Cap Growth Funds category average* 8.55 183.74 10.83 84.33 12.90 36.95 10.95 24.57
Index and Lipper results should be compared with fund performance before sales charge, before CDSC, or at net asset value.
* Over the 1-year, 3-year, 5-year, 10-year, and life-of-fund periods ended 6/30/18, there were 566, 494, 445, 336, and 102 funds, respectively, in this Lipper category.
Change in the value of a $10,000 investment ($9,425 after sales charge)Cumulative total return from 6/30/08 to 6/30/18
Past performance does not indicate future results. At the end of the same time period, a $10,000 investment in the fund’s class B and C shares would have been valued at $23,702 and $23,274, respectively, and no contingent deferred sales charges would apply. A $10,000 investment in the fund’s class M shares ($9,650 after sales charge) would have been valued at $23,042. A $10,000 investment in the fund’s class R, R6, and Y shares would have been valued at $24,480, $25,852 and $25,722, respectively.
Fund price and distribution information For the 12-month period ended 6/30/18
Class A Class B Class C Class M Class R Class R 6 Class Y
Share value
Before sales
charge
After sales
charge
Net asset value
Net asset value
Before sales
charge
After sales
charge
Net asset value
Net asset value
Net asset value
6/30/17 $33.97 $36.04 $30.17 $30.06 $31.40 $32.54 $32.86 $35.11 $35.06
6/30/18 42.91 45.53 37.82 37.68 39.47 40.90 41.41 44.55 44.40
The classification of distributions, if any, is an estimate. Before-sales-charge share value and current dividend rate for class A and M shares, if applicable, do not take into account any sales charge levied at the time of purchase. After-sales-charge share value, current dividend rate, and current 30-day SEC yield, if applicable, are calculated assuming that the maximum sales charge (5.75% for class A shares and 3.50% for class M shares) was levied at the time of purchase. Final distribution information will appear on your year-end tax forms.
The fund made no distributions during the period.
$5,000
$10,000
$15,000
$20,000$23,657
’08 ’09 ’10 ’11 ’12 ’13 ’14 ’15 ’16 ’17 ’18
Putnam Small Cap Growth Fund class A shares a�er sales charge
Russell 2000 Growth Index
$9,425
$29,017
Small Cap Growth Fund 9
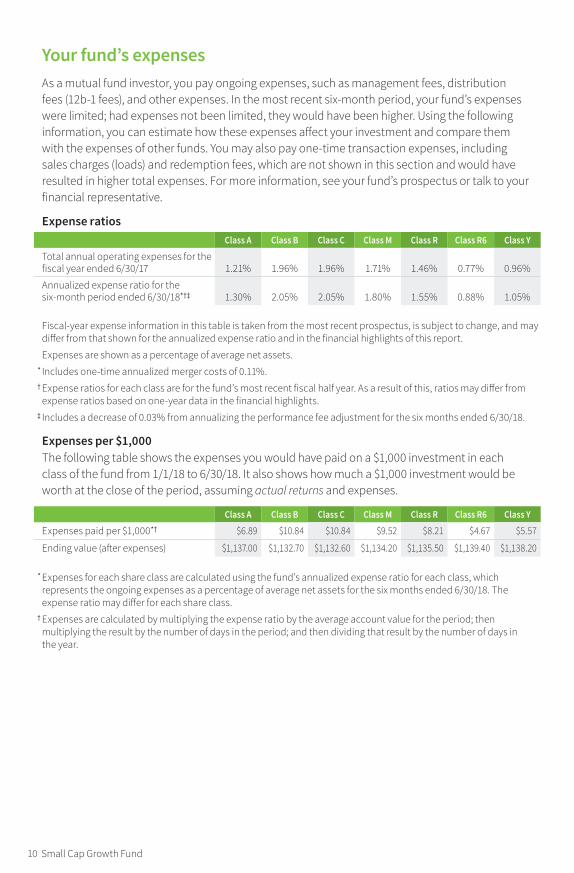
Your fund’s expensesAs a mutual fund investor, you pay ongoing expenses, such as management fees, distribution fees (12b-1 fees), and other expenses. In the most recent six-month period, your fund’s expenses were limited; had expenses not been limited, they would have been higher. Using the following information, you can estimate how these expenses affect your investment and compare them with the expenses of other funds. You may also pay one-time transaction expenses, including sales charges (loads) and redemption fees, which are not shown in this section and would have resulted in higher total expenses. For more information, see your fund’s prospectus or talk to your financial representative.
Expense ratiosClass A Class B Class C Class M Class R Class R6 Class Y
Total annual operating expenses for the fiscal year ended 6/30/17 1.21% 1.96% 1.96% 1.71% 1.46% 0.77% 0.96%
Annualized expense ratio for the six-month period ended 6/30/18*†‡ 1.30% 2.05% 2.05% 1.80% 1.55% 0.88% 1.05%
Fiscal-year expense information in this table is taken from the most recent prospectus, is subject to change, and may differ from that shown for the annualized expense ratio and in the financial highlights of this report.
Expenses are shown as a percentage of average net assets. * Includes one-time annualized merger costs of 0.11%. † Expense ratios for each class are for the fund’s most recent fiscal half year. As a result of this, ratios may differ from
expense ratios based on one-year data in the financial highlights. ‡ Includes a decrease of 0.03% from annualizing the performance fee adjustment for the six months ended 6/30/18.
Expenses per $1,000The following table shows the expenses you would have paid on a $1,000 investment in each class of the fund from 1/1/18 to 6/30/18. It also shows how much a $1,000 investment would be worth at the close of the period, assuming actual returns and expenses.
Class A Class B Class C Class M Class R Class R6 Class Y
Expenses paid per $1,000*† $6.89 $10.84 $10.84 $9.52 $8.21 $4.67 $5.57
Ending value (after expenses) $1,137.00 $1,132.70 $1,132.60 $1,134.20 $1,135.50 $1,139.40 $1,138.20
* Expenses for each share class are calculated using the fund’s annualized expense ratio for each class, which represents the ongoing expenses as a percentage of average net assets for the six months ended 6/30/18. The expense ratio may differ for each share class.
† Expenses are calculated by multiplying the expense ratio by the average account value for the period; then multiplying the result by the number of days in the period; and then dividing that result by the number of days in the year.
10 Small Cap Growth Fund
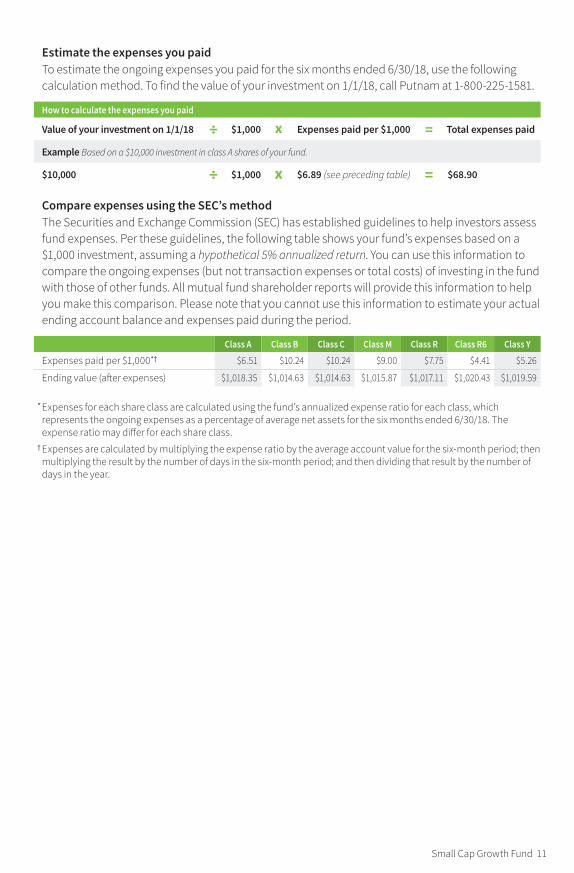
Estimate the expenses you paidTo estimate the ongoing expenses you paid for the six months ended 6/30/18, use the following calculation method. To find the value of your investment on 1/1/18, call Putnam at 1-800-225-1581.
How to calculate the expenses you paid
Value of your investment on 1/1/18 ÷ $1,000 x Expenses paid per $1,000 = Total expenses paid
Example Based on a $10,000 investment in class A shares of your fund.
$10,000 ÷ $1,000 x $6.89 (see preceding table) = $68.90
Compare expenses using the SEC’s methodThe Securities and Exchange Commission (SEC) has established guidelines to help investors assess fund expenses. Per these guidelines, the following table shows your fund’s expenses based on a $1,000 investment, assuming a hypothetical 5% annualized return. You can use this information to compare the ongoing expenses (but not transaction expenses or total costs) of investing in the fund with those of other funds. All mutual fund shareholder reports will provide this information to help you make this comparison. Please note that you cannot use this information to estimate your actual ending account balance and expenses paid during the period.
Class A Class B Class C Class M Class R Class R6 Class Y
Expenses paid per $1,000*† $6.51 $10.24 $10.24 $9.00 $7.75 $4.41 $5.26
Ending value (after expenses) $1,018.35 $1,014.63 $1,014.63 $1,015.87 $1,017.11 $1,020.43 $1,019.59
* Expenses for each share class are calculated using the fund’s annualized expense ratio for each class, which represents the ongoing expenses as a percentage of average net assets for the six months ended 6/30/18. The expense ratio may differ for each share class.
† Expenses are calculated by multiplying the expense ratio by the average account value for the six-month period; then multiplying the result by the number of days in the six-month period; and then dividing that result by the number of days in the year.
Small Cap Growth Fund 11
Terms and definitions
Important termsTotal return shows how the value of the fund’s shares changed over time, assuming you held the shares through the entire period and reinvested all distributions in the fund.
Before sales charge, or net asset value, is the price, or value, of one share of a mutual fund, without a sales charge. Before-sales-charge figures fluctuate with market conditions, and are calculated by dividing the net assets of each class of shares by the number of outstanding shares in the class.
After sales charge is the price of a mutual fund share plus the maximum sales charge levied at the time of purchase. After-sales-charge perfor-mance figures shown here assume the 5.75% maximum sales charge for class A shares and 3.50% for class M shares.
Contingent deferred sales charge (CDSC) is generally a charge applied at the time of the redemption of class B or C shares and assumes redemption at the end of the period. Your fund’s class B CDSC declines over time from a 5% maximum during the first year to 1% during the sixth year. After the sixth year, the CDSC no longer applies. The CDSC for class C shares is 1% for one year after purchase.
Share classesClass A shares are generally subject to an initial sales charge and no CDSC (except on certain redemptions of shares bought without an initial sales charge).
Class B shares are closed to new investments and are only available by exchange from another Putnam fund or through dividend and/or capital gains reinvestment. They are not subject to an initial sales charge and may be subject to a CDSC.
Class C shares are not subject to an initial sales charge and are subject to a CDSC only if the shares are redeemed during the first year.
Class M shares have a lower initial sales charge and a higher 12b-1 fee than class A shares and no CDSC.
Class R shares are not subject to an initial sales charge or CDSC and are only available to employer-sponsored retirement plans.
Class R6 shares are not subject to an initial sales charge or CDSC and carry no 12b-1 fee. They are generally only available to employer-sponsored retirement plans, corporate and institutional clients, and clients in other approved programs.
Class Y shares are not subject to an initial sales charge or CDSC and carry no 12b-1 fee. They are generally only available to corporate and institutional clients and clients in other approved programs.
Comparative indexesBloomberg Barclays U.S. Aggregate Bond Index is an unmanaged index of U.S. investment-grade fixed-income securities.
ICE BofAML (Intercontinental Exchange Bank of America Merrill Lynch) U.S. 3-Month Treasury Bill Index is an unmanaged index that seeks to measure the performance of U.S. Treasury bills available in the marketplace.
Russell 2000 Growth Index is an unmanaged index of those companies in the small-cap Russell 2000 Index chosen for their growth orientation.
S&P 500 Index is an unmanaged index of common stock performance.ICE Data Indices, LLC (“ICE BofAML”), used with permis-sion. ICE BofAML permits use of the ICE BofAML indices and related data on an “as is” basis; makes no warran-ties regarding same; does not guarantee the suitability, quality, accuracy, timeliness, and/or completeness of the ICE BofAML indices or any data included in, related to, or derived therefrom; assumes no liability in connec-tion with the use of the foregoing; and does not sponsor, endorse, or recommend Putnam Investments, or any of its products or services.
12 Small Cap Growth Fund
Indexes assume reinvestment of all distributions and do not account for fees. Securities and performance of a fund and an index will differ. You cannot invest directly in an index.
Frank Russell Company is the source and owner of the trademarks, service marks, and copyrights related to the Russell Indexes. Russell® is a trademark of Frank Russell Company.
Lipper is a third-party industry-ranking entity that ranks mutual funds. Its rankings do not
reflect sales charges. Lipper rankings are based on total return at net asset value relative to other funds that have similar current invest-ment styles or objectives as determined by Lipper. Lipper may change a fund’s category assignment at its discretion. Lipper category averages reflect performance trends for funds within a category.
Other information for shareholders
Proxy votingPutnam is committed to managing our mutual funds in the best interests of our shareholders. The Putnam funds’ proxy voting guidelines and procedures, as well as information regarding how your fund voted proxies relating to portfolio securities during the 12-month period ended June 30, 2018, are available in the Individual Investors section of putnam.com and on the Securities and Exchange Commis-sion (SEC) website, www.sec.gov. If you have questions about finding forms on the SEC’s website, you may call the SEC at 1-800-SEC-0330. You may also obtain the Putnam funds’ proxy voting guidelines and procedures at no charge by calling Putnam’s Shareholder Services at 1-800-225-1581.
Fund portfolio holdingsThe fund will file a complete schedule of its portfolio holdings with the SEC for the first and
third quarters of each fiscal year on Form N-Q. Shareholders may obtain the fund’s Form N-Q on the SEC’s website at www.sec.gov. In addition, the fund’s Form N-Q may be reviewed and copied at the SEC’s Public Reference Room in Washington, D.C. You may call the SEC at 1-800-SEC-0330 for information about the SEC’s website or the operation of the Public Reference Room.
Trustee and employee fund ownershipPutnam employees and members of the Board of Trustees place their faith, confidence, and, most importantly, investment dollars in Putnam mutual funds. As of June 30, 2018, Putnam employees had approximately $514,000,000 and the Trustees had approxi-mately $80,000,000 invested in Putnam mutual funds. These amounts include investments by the Trustees’ and employees’ immediate family members as well as investments through retirement and deferred compensation plans.
Small Cap Growth Fund 13
Important notice regarding Putnam’s privacy policy
In order to conduct business with our shareholders, we must obtain certain personal information such as account holders’ names, addresses, Social Security numbers, and dates of birth. Using this information, we are able to maintain accurate records of accounts and transactions.
It is our policy to protect the confidentiality of our shareholder information, whether or not a shareholder currently owns shares of our funds. In particular, it is our policy not to sell information about you or your accounts to outside marketing firms. We have safeguards in place designed to prevent unauthorized access
to our computer systems and procedures to protect personal information from unauthorized use.
Under certain circumstances, we must share account information with outside vendors who provide services to us, such as mailings and proxy solicitations. In these cases, the service providers enter into confidentiality agreements with us, and we provide only the information necessary to process transactions and perform other services related to your account. Finally, it is our policy to share account information with your financial representative, if you’ve listed one on your Putnam account.
14 Small Cap Growth Fund
Trustee approval of management contract
Trustee approval of management contract
General conclusionsThe Board of Trustees of The Putnam Funds oversees the management of each fund and, as required by law, determines annually whether to approve the continuance of your fund’s management contract with Putnam Investment Management, LLC (“Putnam Management”) and the sub-management contract with respect to your fund between Putnam Management and its affiliate, Putnam Investments Limited (“PIL”). The Board, with the assistance of its Contract Commit-tee, requests and evaluates all information it deems reasonably necessary under the circum-stances in connection with its annual contract review. The Contract Committee consists solely of Trustees who are not “interested persons” (as this term is defined in the Investment Company Act of 1940, as amended (the “1940 Act”)) of The Putnam Funds (“Independent Trustees”).
At the outset of the review process, members of the Board’s independent staff and independent legal counsel discussed with representatives of Putnam Management the annual contract review materials furnished to the Contract Committee during the course of the previous year’s review, identifying possible changes in these materi-als that might be necessary or desirable for the coming year. Following these discussions and in consultation with the Contract Committee, the Independent Trustees’ independent legal counsel requested that Putnam Management and its affiliates furnish specified information, together with any additional information that Putnam Management considered relevant, to the Contract Committee. Over the course of several months ending in June 2018, the Contract Committee met on a number of occasions with representatives of Putnam Management, and separately in executive session, to consider the information that Putnam Management provided. Throughout this process, the Contract Committee was assisted by the members of the Board’s independent staff and by independent legal counsel for The Putnam Funds and the Independent Trustees.
In May 2018, the Contract Committee met in executive session to discuss and consider its recommendations with respect to the contin-uance of the contracts. At the Trustees’ June 2018 meeting, the Contract Committee met in executive session with the other Independent Trustees to review a summary of the key financial,
performance and other data that the Contract Committee considered in the course of its review. The Contract Committee then presented its written report, which summarized the key factors that the Committee had considered and set forth its recommendations. The Contract Committee recommended, and the Independent Trustees approved, the continuance of your fund’s manage-ment and sub-management contracts, effective July 1, 2018. (Because PIL is an affiliate of Putnam Management and Putnam Management remains fully responsible for all services provided by PIL, the Trustees have not attempted to evaluate PIL as a separate entity, and all subsequent refer-ences to Putnam Management below should be deemed to include reference to PIL as necessary or appropriate in the context.)
The Independent Trustees’ approval was based on the following conclusions:
• That the fee schedule in effect for your fund repre-sented reasonable compensation in light of the nature and quality of the services being provided to the fund, the fees paid by competitive funds, the costs incurred by Putnam Management in providing services to the fund, and the appli-cation of certain reductions and waivers noted below; and
• That the fee schedule in effect for your fund represented an appropriate sharing between fund shareholders and Putnam Management of such economies of scale as may exist in the management of the fund at current asset levels.
These conclusions were based on a comprehen-sive consideration of all information provided to the Trustees and were not the result of any single factor. Some of the factors that figured particu-larly in the Trustees’ deliberations and how the Trustees considered these factors are described below, although individual Trustees may have evaluated the information presented differently, giving different weights to various factors. It is also important to recognize that the management arrangements for your fund and the other Putnam funds are the result of many years of review and discussion between the Independent Trustees and Putnam Management, that some aspects of the arrangements may receive greater scrutiny in some years than others, and that the Trust-ees’ conclusions may be based, in part, on their consideration of fee arrangements in previous
Small Cap Growth Fund 15
years. For example, with some minor exceptions, the funds’ current fee arrangements under the management contracts were first implemented at the beginning of 2010 following extensive review by the Contract Committee and discussions with representatives of Putnam Management, as well as approval by shareholders.
Management fee schedules and total expensesThe Trustees reviewed the management fee schedules in effect for all Putnam funds, includ-ing fee levels and breakpoints. The Trustees also reviewed the total expenses of each Putnam fund, recognizing that in most cases management fees represented the major, but not the sole, deter-minant of total costs to fund shareholders. (In a few instances, funds have implemented so-called “all-in” management fees covering substantially all routine fund operating costs.)
In reviewing fees and expenses, the Trustees generally focus their attention on material changes in circumstances — for example, changes in assets under management, changes in a fund’s investment strategy, changes in Putnam Management’s operating costs or profitability, or changes in competitive practices in the mutual fund industry — that suggest that consideration of fee changes might be warranted. The Trustees concluded that the circumstances did not indicate that changes to the management fee structure for your fund would be appropriate at this time.
Under its management contract, your fund has the benefit of breakpoints in its management fee schedule that provide shareholders with econo-mies of scale in the form of reduced fee rates as assets under management in the Putnam family of funds increase. The Trustees concluded that the fee schedule in effect for your fund represented an appropriate sharing of econo-mies of scale between fund shareholders and Putnam Management.
In addition, your fund’s management contract provides that its management fees will be adjusted up or down depending upon whether your fund’s performance is better or worse than the performance of an appropriate index of securi-ties prices specified in the management contract. In the course of reviewing investment perfor-mance, the Trustees examined the operation of your fund’s performance fees and concluded that these fees were operating effectively to align
further Putnam Management’s economic interests with those of the fund’s shareholders.
As in the past, the Trustees also focused on the competitiveness of each fund’s total expense ratio. In order to support the effort to have fund expenses meet competitive standards, the Trust-ees and Putnam Management have implemented certain expense limitations that were in effect during your fund’s fiscal year ending in 2017. These expense limitations were: (i) a contractual expense limitation applicable to all open-end funds of 25 basis points on investor servicing fees and expenses and (ii) a contractual expense limitation applicable to specified open-end funds, including your fund, of 20 basis points on so-called “other expenses” (i.e., all expenses exclusive of manage-ment fees, distribution fees, investor servicing fees, investment-related expenses, interest, taxes, brokerage commissions, acquired fund fees and expenses and extraordinary expenses). These expense limitations attempt to maintain competitive expense levels for the funds. Most funds had sufficiently low expenses that these expense limitations were not operative. However, in the case of your fund, the first of the expense limitations applied during its fiscal year ending in 2017. Putnam Management has agreed to maintain these expense limitations until at least October 30, 2018. Putnam Management’s support for these expense limitation arrangements was an import-ant factor in the Trustees’ decision to approve the continuance of your fund’s management and sub-management contracts.
The Trustees reviewed comparative fee and expense information for a custom group of competitive funds selected by Broadridge Financial Solutions, Inc. (“Broadridge”). This comparative information included your fund’s percentile ranking for effective management fees and total expenses (excluding any applicable 12b-1 fee), which provides a general indication of your fund’s relative standing. In the custom peer group, your fund ranked in the first quintile in effective management fees (determined for your fund and the other funds in the custom peer group based on fund asset size and the applicable contractual management fee schedule) and in the first quintile in total expenses (excluding any appli-cable 12b-1 fees) as of December 31, 2017. The first quintile represents the least expensive funds and the fifth quintile the most expensive funds. The fee and expense data reported by Broadridge as of December 31, 2017 reflected the most recent fiscal
16 Small Cap Growth Fund
year-end data available in Broadridge’s database at that time.
In connection with their review of fund manage-ment fees and total expenses, the Trustees also reviewed the costs of the services provided and the profits realized by Putnam Management and its affiliates from their contractual relationships with the funds. This information included trends in revenues, expenses and profitability of Putnam Management and its affiliates relating to the investment management, investor servicing and distribution services provided to the funds. In this regard, the Trustees also reviewed an analysis of Putnam Management’s revenues, expenses and profitability, allocated on a fund-by-fund basis, with respect to the funds’ management, distribu-tion, and investor servicing contracts. For each fund, the analysis presented information about revenues, expenses and profitability for each of the agreements separately and for the agree-ments taken together on a combined basis. The Trustees concluded that, at current asset levels, the fee schedules in place represented reasonable compensation for the services being provided and represented an appropriate sharing between fund shareholders and Putnam Management of such economies of scale as may exist in the management of the Putnam funds at that time.
The information examined by the Trustees in connection with their annual contract review for the Putnam funds included information regard-ing fees charged by Putnam Management and its affiliates to institutional clients, including defined benefit pension and profit-sharing plans and sub-advised mutual funds. This information included, in cases where an institutional product’s investment strategy corresponds with a fund’s strategy, comparisons of those fees with fees charged to the Putnam funds, as well as an assess-ment of the differences in the services provided to these different types of clients as compared to the services provided to the Putnam funds. The Trustees observed that the differences in fee rates between these clients and the Putnam funds are by no means uniform when examined by individual asset sectors, suggesting that differ-ences in the pricing of investment management services to these types of clients may reflect, among other things, historical competitive forces operating in separate markets. The Trust-ees considered the fact that in many cases fee rates across different asset classes are higher on average for mutual funds than for institutional clients, as well as the differences between the
services that Putnam Management provides to the Putnam funds and those that it provides to its other clients. The Trustees did not rely on these comparisons to any significant extent in conclud-ing that the management fees paid by your fund are reasonable.
Investment performanceThe quality of the investment process provided by Putnam Management represented a major factor in the Trustees’ evaluation of the quality of services provided by Putnam Management under your fund’s management contract. The Trustees were assisted in their review of the Putnam funds’ investment process and performance by the work of the investment oversight committees of the Trustees and the full Board of Trustees, which meet on a regular basis with the funds’ portfolio teams and with the Chief Investment Officers and other senior members of Putnam Management’s Investment Division throughout the year. The Trustees concluded that Putnam Management generally provides a high-quality investment process — based on the experience and skills of the individuals assigned to the management of fund portfolios, the resources made available to them, and in general Putnam Manage-ment’s ability to attract and retain high-quality personnel — but also recognized that this does not guarantee favorable investment results for every fund in every time period.
The Trustees considered that 2017 was a strong year for the performance of the Putnam funds, with generally favorable results for most asset classes, including U.S. equity, international and global equity, taxable and tax exempt fixed income, and global asset allocation Funds. In this regard, the Trustees considered that, for the one-year period ended December 31, 2017, the Putnam open-end Funds’ performance, on an asset-weighted basis, ranked in the 32nd percentile of their Lipper peers (excluding those Putnam funds that are evaluated based on their total returns and/or comparisons of those returns versus selected investment benchmarks or targeted annual returns). The Trustees observed that this strong performance has continued a positive trend that began in mid-year 2016 across most Putnam funds. They noted that the longer-term performance of the Putnam funds continued to be strong, exemplified by the fact that the Putnam funds were ranked by the Barron’s/Lipper Fund Families survey as the 7th-best performing mutual fund complex out
Small Cap Growth Fund 17
of 55 complexes for the five-year period ended December 31, 2017 and the 9th-best performing mutual fund complex out of 50 complexes for the ten-year period ended 2017. In addition, the survey ranked the Putnam funds 7th out of 59 mutual fund complexes for the one-year period ended 2017; the Putnam funds have ranked 1st or 2nd in the survey for the one-year period three times since 2009 (most recently in 2013). They also noted, however, the disappointing investment performance of some funds for periods ended December 31, 2017 and considered information provided by Putnam Management regarding the factors contributing to the underperformance and actions being taken to improve the performance of these particular funds. The Trustees indicated their intention to continue to monitor closely the performance of those funds, including the effec-tiveness of any efforts Putnam Management has undertaken to address underperformance and whether additional actions to address areas of underperformance are warranted.
For purposes of the Trustees’ evaluation of the Putnam Funds’ investment performance, the Trustees generally focus on a competitive indus-try ranking of each fund’s total net return over a one-year, three-year and five-year period. For a number of Putnam funds with relatively unique investment mandates for which Putnam Manage-ment informed the Trustees that meaningful competitive performance rankings are not consid-ered to be available, the Trustees evaluated performance based on their total gross and net returns and, in most cases, comparisons of those returns with the returns of selected investment benchmarks. In the case of your fund, the Trustees considered that its class A share cumulative total return performance at net asset value was in the following quartiles of its Lipper Inc. (“Lipper”) peer group (Lipper Small-Cap Growth Funds) for the one-year, three-year and five-year periods ended December 31, 2017 (the first quartile representing the best-performing funds and the fourth quartile the worst-performing funds):
One-year period 3rdThree-year period 3rdFive-year period 3rd
Over the one-year, three-year and five-year periods ended December 31, 2017, there were 558, 502 and 457 funds, respectively, in your fund’s Lipper peer group. (When considering performance information, shareholders should be
mindful that past performance is not a guarantee of future results.)
The Trustees considered Putnam Management’s continued efforts to support fund performance through initiatives including structuring compen-sation for portfolio managers and research analysts to enhance accountability for fund performance, emphasizing accountability in the portfolio management process, and affirming its commitment to a fundamental-driven approach to investing. The Trustees noted further that Putnam Management continued to strengthen its fundamental research capabilities by adding new investment personnel.
Brokerage and soft-dollar allocations; investor servicingThe Trustees considered various potential benefits that Putnam Management may receive in connection with the services it provides under the management contract with your fund. These include benefits related to brokerage allocation and the use of soft dollars, whereby a portion of the commissions paid by a fund for brokerage may be used to acquire research services that are expected to be useful to Putnam Management in managing the assets of the fund and of other clients. Subject to policies established by the Trustees, soft dollars generated by these means are used predominantly to acquire brokerage and research services (including third-party research and market data) that enhance Putnam Manage-ment’s investment capabilities and supplement Putnam Management’s internal research efforts. However, the Trustees noted that a portion of available soft dollars continues to be used to pay fund expenses. The Trustees indicated their continued intent to monitor regulatory and indus-try developments in this area with the assistance of their Brokerage Committee. The Trustees also indicated their continued intent to monitor the allocation of the Putnam funds’ brokerage in order to ensure that the principle of seeking best price and execution remains paramount in the portfolio trading process.
Putnam Management may also receive benefits from payments that the funds make to Putnam Management’s affiliates for investor or distribution services. In conjunction with the annual review of your fund’s management and sub-management contracts, the Trustees reviewed your fund’s inves-tor servicing agreement with Putnam Investor Services, Inc. (“PSERV”) and its distributor’s contracts and distribution plans with Putnam
18 Small Cap Growth Fund
Retail Management Limited Partnership (“PRM”), both of which are affiliates of Putnam Manage-ment. The Trustees concluded that the fees payable by the funds to PSERV and PRM, as appli-cable, for such services are fair and reasonable in relation to the nature and quality of such services, the fees paid by competitive funds, and the costs
incurred by PSERV and PRM, as applicable, in providing such services. Furthermore, the Trust-ees were of the view that the services provided were required for the operation of the funds, and that they were of a quality at least equal to those provided by other providers.
Small Cap Growth Fund 19
Financial statements
20 Small Cap Growth Fund
Financial statements
These sections of the report, as well as the accompanying Notes, preceded by the Report of Independent Registered Public Accounting Firm, constitute the fund’s financial statements.
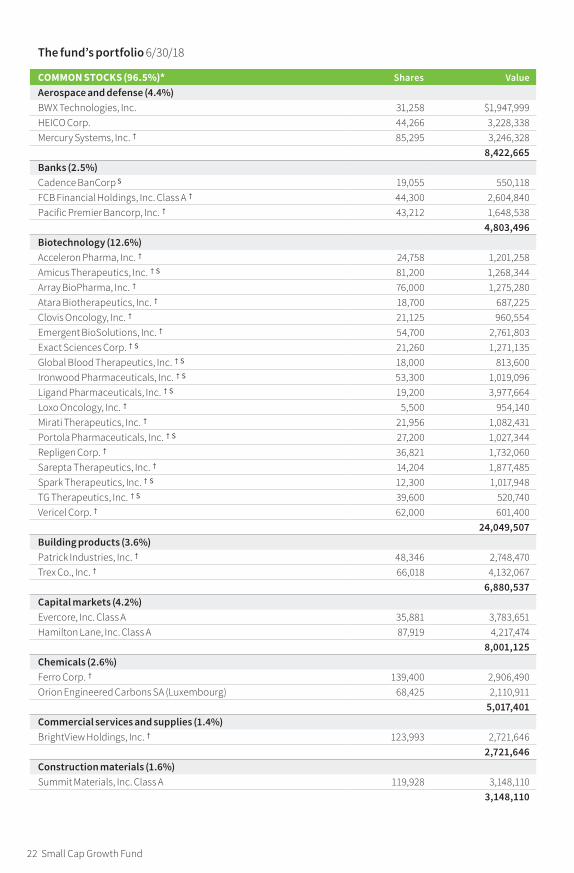
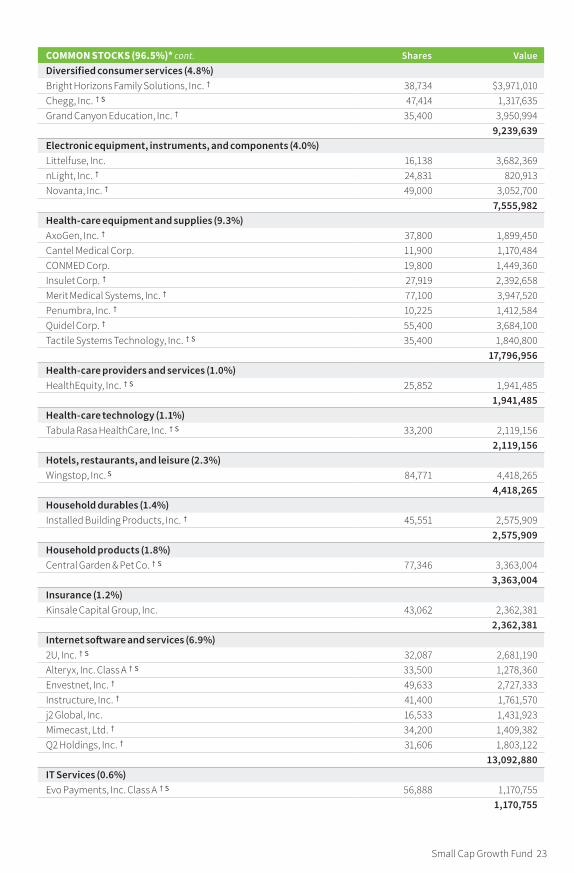
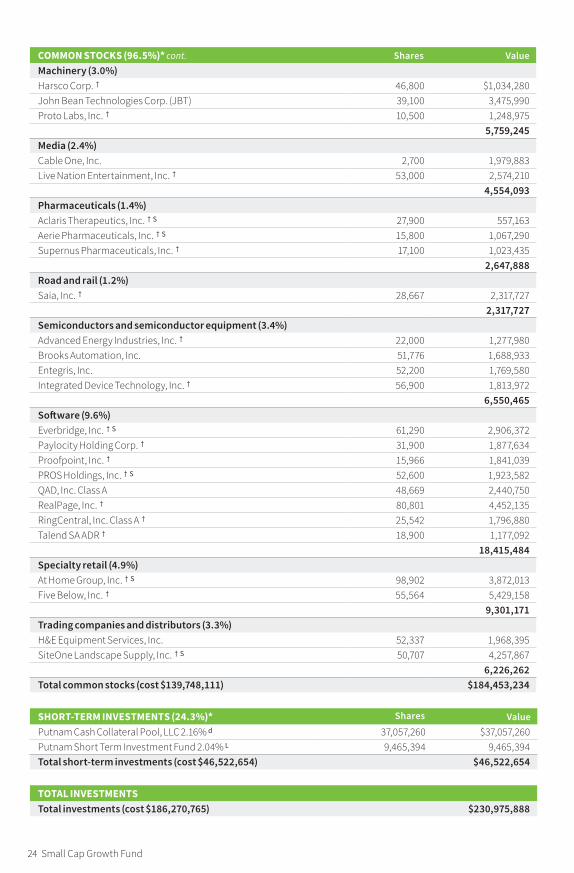
The fund’s portfolio lists all the fund’s invest-ments and their values as of the last day of the reporting period. Holdings are organized by asset type and industry sector, country, or state to show areas of concentration and diversification.
Statement of assets and liabilities shows how the fund’s net assets and share price are determined. All investment and non-investment assets are added together. Any unpaid expenses and other liabilities are subtracted from this total. The result is divided by the number of shares to determine the net asset value per share, which is calculated separately for each class of shares. (For funds with preferred shares, the amount subtracted from total assets includes the liquidation preference of preferred shares.)
Statement of operations shows the fund’s net investment gain or loss. This is done by first adding up all the fund’s earnings — from dividends and interest income — and subtracting its operating expenses to determine net investment income (or
loss). Then, any net gain or loss the fund realized on the sales of its holdings — as well as any unreal-ized gains or losses over the period — is added to or subtracted from the net investment result to determine the fund’s net gain or loss for the fiscal year.
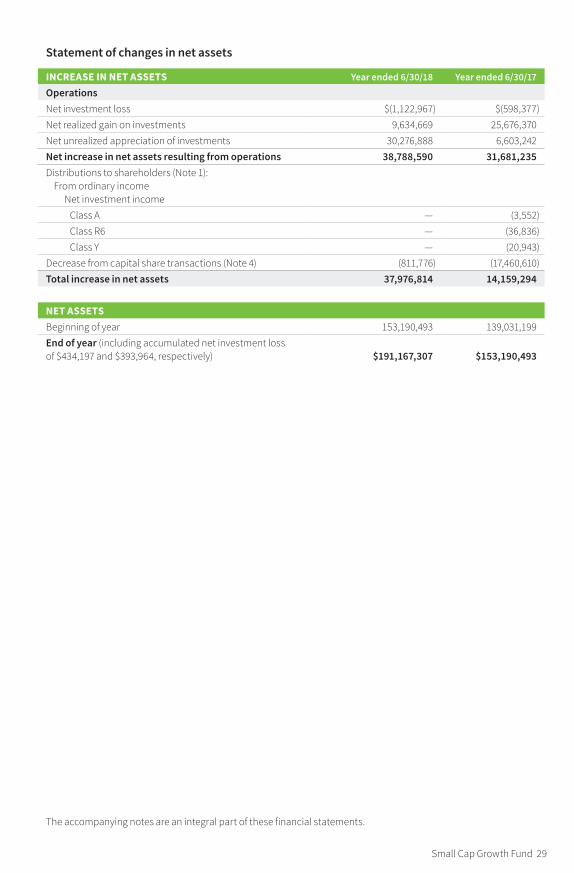
Statement of changes in net assets shows how the fund’s net assets were affected by the fund’s net investment gain or loss, by distributions to shareholders, and by changes in the number of the fund’s shares. It lists distributions and their sources (net investment income or realized capital gains) over the current reporting period and the most recent fiscal year-end. The distributions listed here may not match the sources listed in the Statement of operations because the distributions are deter-mined on a tax basis and may be paid in a different period from the one in which they were earned.
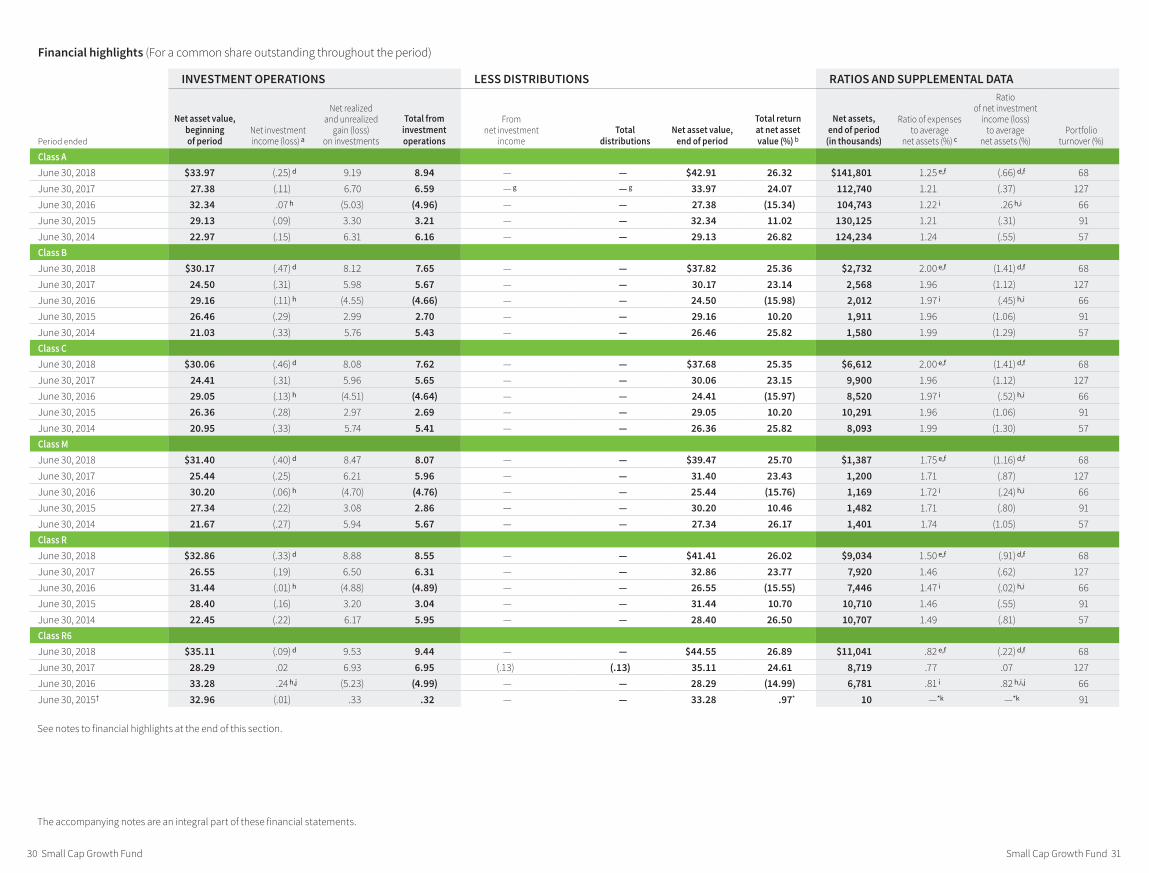
Financial highlights provide an overview of the fund’s investment results, per-share distributions, expense ratios, net investment income ratios, and portfolio turnover in one summary table, reflecting the five most recent reporting periods. In a semiannual report, the highlights table also includes the current reporting period.
Report of Independent Registered Public Accounting Firm
To the Trustees of Putnam Funds Trust and Shareholders of Putnam Small Cap Growth Fund
Opinion on the Financial Statements
We have audited the accompanying statement of assets and liabilities, including the fund’s portfolio, of Putnam Small Cap Growth Fund (one of the funds constituting Putnam Funds Trust, referred to hereafter as the “Fund”) as of June 30, 2018, the related statement of operations for the year ended June 30, 2018, the statement of changes in net assets for each of the two years in the period ended June 30, 2018, including the related notes, and the financial highlights for each of the periods indicated therein (collectively referred to as the “financial statements”). In our opinion, the financial statements present fairly, in all material respects, the financial position of the Fund as of June 30, 2018, the results of its operations for the year then ended, the changes in its net assets for each of the two years in the period ended June 30, 2018 and the financial highlights for each of the periods indicated therein in conformity with accounting principles generally accepted in the United States of America.
Basis for Opinion
These financial statements are the responsibility of the Fund’s management. Our responsibility is to express an opinion on the Fund’s financial statements based on our audits. We are a public accounting firm registered with the Public Company Accounting Oversight Board (United States) (“PCAOB”) and are required to be independent with respect to the Fund in accordance with the U.S. federal securities laws and the applicable rules and regulations of the Securities and Exchange Commission and the PCAOB.
We conducted our audits of these financial statements in accordance with the standards of the PCAOB. Those standards require that we plan and perform the audit to obtain reasonable assurance about whether the financial statements are free of material misstatement, whether due to error or fraud.
Our audits included performing procedures to assess the risks of material misstatement of the financial statements, whether due to error or fraud, and performing procedures that respond to those risks. Such procedures included examining, on a test basis, evidence regarding the amounts and disclosures in the financial statements. Our audits also included evaluating the accounting principles used and significant estimates made by management, as well as evaluating the overall presentation of the financial statements. Our procedures included confirmation of securities owned as of June 30, 2018 by correspondence with the custodian, transfer agent and brokers; when replies were not received from brokers, we performed other auditing procedures. We believe that our audits provide a reasonable basis for our opinion.
PricewaterhouseCoopers LLP Boston, Massachusetts August 13, 2018
We have served as the auditor of one or more investment companies in the Putnam Investments family of mutual funds since at least 1957. We have not determined the specific year we began serving as auditor.
Small Cap Growth Fund 21
22 Small Cap Growth Fund
COMMON STOCKS (96.5%)* Shares ValueAerospace and defense (4.4%)BWX Technologies, Inc. 31,258 $1,947,999HEICO Corp. 44,266 3,228,338Mercury Systems, Inc. † 85,295 3,246,328
8,422,665Banks (2.5%)Cadence BanCorp S 19,055 550,118FCB Financial Holdings, Inc. Class A † 44,300 2,604,840Pacific Premier Bancorp, Inc. † 43,212 1,648,538
4,803,496Biotechnology (12.6%)Acceleron Pharma, Inc. † 24,758 1,201,258Amicus Therapeutics, Inc. † S 81,200 1,268,344Array BioPharma, Inc. † 76,000 1,275,280Atara Biotherapeutics, Inc. † 18,700 687,225Clovis Oncology, Inc. † 21,125 960,554Emergent BioSolutions, Inc. † 54,700 2,761,803Exact Sciences Corp. † S 21,260 1,271,135Global Blood Therapeutics, Inc. † S 18,000 813,600Ironwood Pharmaceuticals, Inc. † S 53,300 1,019,096Ligand Pharmaceuticals, Inc. † S 19,200 3,977,664Loxo Oncology, Inc. † 5,500 954,140Mirati Therapeutics, Inc. † 21,956 1,082,431Portola Pharmaceuticals, Inc. † S 27,200 1,027,344Repligen Corp. † 36,821 1,732,060Sarepta Therapeutics, Inc. † 14,204 1,877,485Spark Therapeutics, Inc. † S 12,300 1,017,948TG Therapeutics, Inc. † S 39,600 520,740Vericel Corp. † 62,000 601,400
24,049,507Building products (3.6%)Patrick Industries, Inc. † 48,346 2,748,470Trex Co., Inc. † 66,018 4,132,067
6,880,537Capital markets (4.2%)Evercore, Inc. Class A 35,881 3,783,651Hamilton Lane, Inc. Class A 87,919 4,217,474
8,001,125Chemicals (2.6%)Ferro Corp. † 139,400 2,906,490Orion Engineered Carbons SA (Luxembourg) 68,425 2,110,911
5,017,401Commercial services and supplies (1.4%)BrightView Holdings, Inc. † 123,993 2,721,646
2,721,646Construction materials (1.6%)Summit Materials, Inc. Class A 119,928 3,148,110
3,148,110
The fund’s portfolio 6/30/18
Small Cap Growth Fund 23
COMMON STOCKS (96.5%)* cont. Shares ValueDiversified consumer services (4.8%)Bright Horizons Family Solutions, Inc. † 38,734 $3,971,010Chegg, Inc. † S 47,414 1,317,635Grand Canyon Education, Inc. † 35,400 3,950,994
9,239,639Electronic equipment, instruments, and components (4.0%)Littelfuse, Inc. 16,138 3,682,369nLight, Inc. † 24,831 820,913Novanta, Inc. † 49,000 3,052,700
7,555,982Health-care equipment and supplies (9.3%)AxoGen, Inc. † 37,800 1,899,450Cantel Medical Corp. 11,900 1,170,484CONMED Corp. 19,800 1,449,360Insulet Corp. † 27,919 2,392,658Merit Medical Systems, Inc. † 77,100 3,947,520Penumbra, Inc. † 10,225 1,412,584Quidel Corp. † 55,400 3,684,100Tactile Systems Technology, Inc. † S 35,400 1,840,800
17,796,956Health-care providers and services (1.0%)HealthEquity, Inc. † S 25,852 1,941,485
1,941,485Health-care technology (1.1%)Tabula Rasa HealthCare, Inc. † S 33,200 2,119,156
2,119,156Hotels, restaurants, and leisure (2.3%)Wingstop, Inc. S 84,771 4,418,265
4,418,265Household durables (1.4%)Installed Building Products, Inc. † 45,551 2,575,909
2,575,909Household products (1.8%)Central Garden & Pet Co. † S 77,346 3,363,004
3,363,004Insurance (1.2%)Kinsale Capital Group, Inc. 43,062 2,362,381
2,362,381Internet software and services (6.9%)2U, Inc. † S 32,087 2,681,190Alteryx, Inc. Class A † S 33,500 1,278,360Envestnet, Inc. † 49,633 2,727,333Instructure, Inc. † 41,400 1,761,570j2 Global, Inc. 16,533 1,431,923Mimecast, Ltd. † 34,200 1,409,382Q2 Holdings, Inc. † 31,606 1,803,122
13,092,880IT Services (0.6%)Evo Payments, Inc. Class A † S 56,888 1,170,755
1,170,755
24 Small Cap Growth Fund
COMMON STOCKS (96.5%)* cont. Shares ValueMachinery (3.0%)Harsco Corp. † 46,800 $1,034,280John Bean Technologies Corp. (JBT) 39,100 3,475,990Proto Labs, Inc. † 10,500 1,248,975
5,759,245Media (2.4%)Cable One, Inc. 2,700 1,979,883Live Nation Entertainment, Inc. † 53,000 2,574,210
4,554,093Pharmaceuticals (1.4%)Aclaris Therapeutics, Inc. † S 27,900 557,163Aerie Pharmaceuticals, Inc. † S 15,800 1,067,290Supernus Pharmaceuticals, Inc. † 17,100 1,023,435
2,647,888Road and rail (1.2%)Saia, Inc. † 28,667 2,317,727
2,317,727Semiconductors and semiconductor equipment (3.4%)Advanced Energy Industries, Inc. † 22,000 1,277,980Brooks Automation, Inc. 51,776 1,688,933Entegris, Inc. 52,200 1,769,580Integrated Device Technology, Inc. † 56,900 1,813,972
6,550,465Software (9.6%)Everbridge, Inc. † S 61,290 2,906,372Paylocity Holding Corp. † 31,900 1,877,634Proofpoint, Inc. † 15,966 1,841,039PROS Holdings, Inc. † S 52,600 1,923,582QAD, Inc. Class A 48,669 2,440,750RealPage, Inc. † 80,801 4,452,135RingCentral, Inc. Class A † 25,542 1,796,880Talend SA ADR † 18,900 1,177,092
18,415,484Specialty retail (4.9%)At Home Group, Inc. † S 98,902 3,872,013Five Below, Inc. † 55,564 5,429,158
9,301,171Trading companies and distributors (3.3%)H&E Equipment Services, Inc. 52,337 1,968,395SiteOne Landscape Supply, Inc. † S 50,707 4,257,867
6,226,262Total common stocks (cost $139,748,111) $184,453,234
SHORT-TERM INVESTMENTS (24.3%)* Shares ValuePutnam Cash Collateral Pool, LLC 2.16% d 37,057,260 $37,057,260Putnam Short Term Investment Fund 2.04% L 9,465,394 9,465,394Total short-term investments (cost $46,522,654) $46,522,654
TOTAL INVESTMENTSTotal investments (cost $186,270,765) $230,975,888
Small Cap Growth Fund 25
The accompanying notes are an integral part of these financial statements.
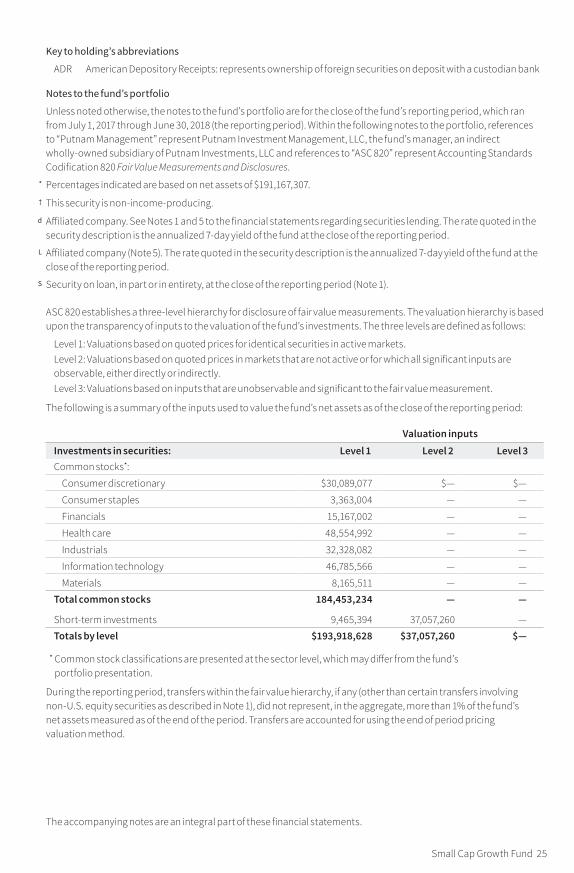
Key to holding’s abbreviations
ADR American Depository Receipts: represents ownership of foreign securities on deposit with a custodian bank
Notes to the fund’s portfolio
Unless noted otherwise, the notes to the fund’s portfolio are for the close of the fund’s reporting period, which ran from July 1, 2017 through June 30, 2018 (the reporting period). Within the following notes to the portfolio, references to “Putnam Management” represent Putnam Investment Management, LLC, the fund’s manager, an indirect wholly-owned subsidiary of Putnam Investments, LLC and references to “ASC 820” represent Accounting Standards Codification 820 Fair Value Measurements and Disclosures.
* Percentages indicated are based on net assets of $191,167,307.
† This security is non-income-producing.
d Affiliated company. See Notes 1 and 5 to the financial statements regarding securities lending. The rate quoted in the security description is the annualized 7-day yield of the fund at the close of the reporting period.
L Affiliated company (Note 5). The rate quoted in the security description is the annualized 7-day yield of the fund at the close of the reporting period.
S Security on loan, in part or in entirety, at the close of the reporting period (Note 1).
ASC 820 establishes a three-level hierarchy for disclosure of fair value measurements. The valuation hierarchy is based upon the transparency of inputs to the valuation of the fund’s investments. The three levels are defined as follows:
Level 1: Valuations based on quoted prices for identical securities in active markets.Level 2: Valuations based on quoted prices in markets that are not active or for which all significant inputs are observable, either directly or indirectly.Level 3: Valuations based on inputs that are unobservable and significant to the fair value measurement.
The following is a summary of the inputs used to value the fund’s net assets as of the close of the reporting period:
Valuation inputsInvestments in securities: Level 1 Level 2 Level 3Common stocks*:
Consumer discretionary $30,089,077 $— $—
Consumer staples 3,363,004 — —
Financials 15,167,002 — —
Health care 48,554,992 — —
Industrials 32,328,082 — —
Information technology 46,785,566 — —
Materials 8,165,511 — — Total common stocks 184,453,234 — —
Short-term investments 9,465,394 37,057,260 — Totals by level $193,918,628 $37,057,260 $—
* Common stock classifications are presented at the sector level, which may differ from the fund’s portfolio presentation.
During the reporting period, transfers within the fair value hierarchy, if any (other than certain transfers involving non-U.S. equity securities as described in Note 1 ), did not represent, in the aggregate, more than 1% of the fund’s net assets measured as of the end of the period. Transfers are accounted for using the end of period pricing valuation method.
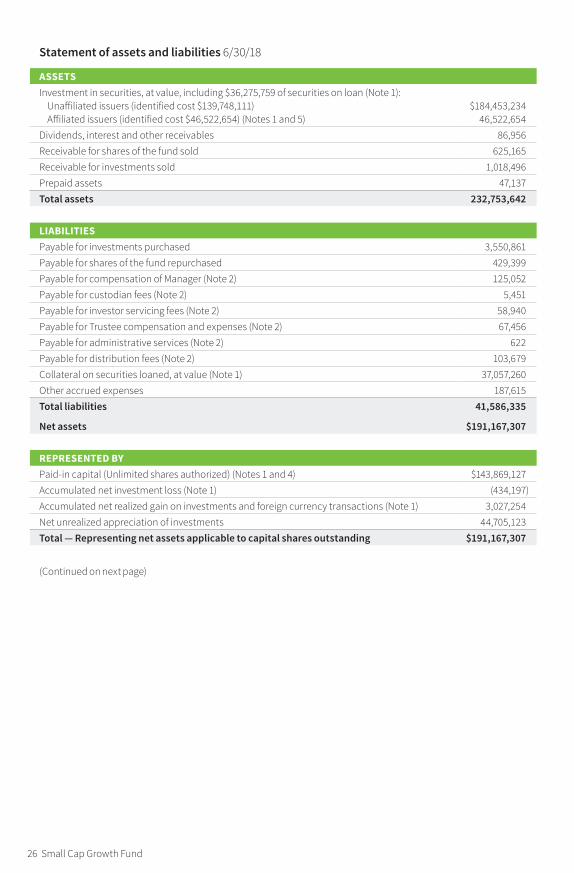
Statement of assets and liabilities 6/30/18
ASSETSInvestment in securities, at value, including $36,275,759 of securities on loan (Note 1):
Unaffiliated issuers (identified cost $139,748,111) $184,453,234 Affiliated issuers (identified cost $46,522,654) (Notes 1 and 5) 46,522,654
Dividends, interest and other receivables 86,956 Receivable for shares of the fund sold 625,165 Receivable for investments sold 1,018,496 Prepaid assets 47,137 Total assets 232,753,642
LIABILITIESPayable for investments purchased 3,550,861 Payable for shares of the fund repurchased 429,399 Payable for compensation of Manager (Note 2) 125,052 Payable for custodian fees (Note 2) 5,451 Payable for investor servicing fees (Note 2) 58,940 Payable for Trustee compensation and expenses (Note 2) 67,456 Payable for administrative services (Note 2) 622 Payable for distribution fees (Note 2) 103,679 Collateral on securities loaned, at value (Note 1) 37,057,260 Other accrued expenses 187,615 Total liabilities 41,586,335
Net assets $191,167,307
REPRESENTED BYPaid-in capital (Unlimited shares authorized) (Notes 1 and 4) $143,869,127 Accumulated net investment loss (Note 1) (434,197) Accumulated net realized gain on investments and foreign currency transactions (Note 1) 3,027,254 Net unrealized appreciation of investments 44,705,123 Total — Representing net assets applicable to capital shares outstanding $191,167,307
(Continued on next page)
26 Small Cap Growth Fund
The accompanying notes are an integral part of these financial statements.
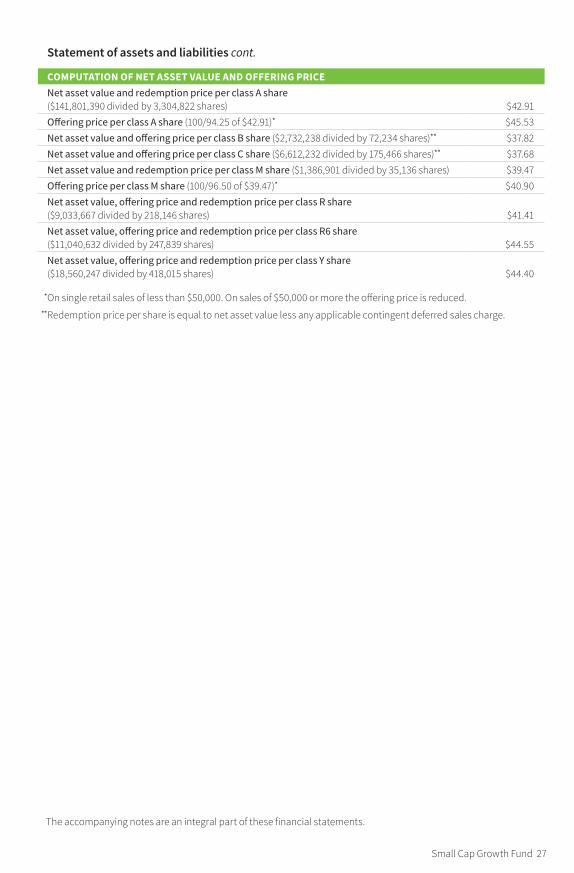
Statement of assets and liabilities cont.
COMPUTATION OF NET ASSET VALUE AND OFFERING PRICENet asset value and redemption price per class A share ($141,801,390 divided by 3,304,822 shares) $42.91 Offering price per class A share (100/94.25 of $42.91)* $45.53 Net asset value and offering price per class B share ($2,732,238 divided by 72,234 shares)** $37.82 Net asset value and offering price per class C share ($6,612,232 divided by 175,466 shares)** $37.68 Net asset value and redemption price per class M share ($1,386,901 divided by 35,136 shares) $39.47 Offering price per class M share (100/96.50 of $39.47)* $40.90 Net asset value, offering price and redemption price per class R share ($9,033,667 divided by 218,146 shares) $41.41 Net asset value, offering price and redemption price per class R6 share ($11,040,632 divided by 247,839 shares) $44.55 Net asset value, offering price and redemption price per class Y share ($18,560,247 divided by 418,015 shares) $44.40
*On single retail sales of less than $50,000. On sales of $50,000 or more the offering price is reduced.**Redemption price per share is equal to net asset value less any applicable contingent deferred sales charge.
Small Cap Growth Fund 27
The accompanying notes are an integral part of these financial statements.
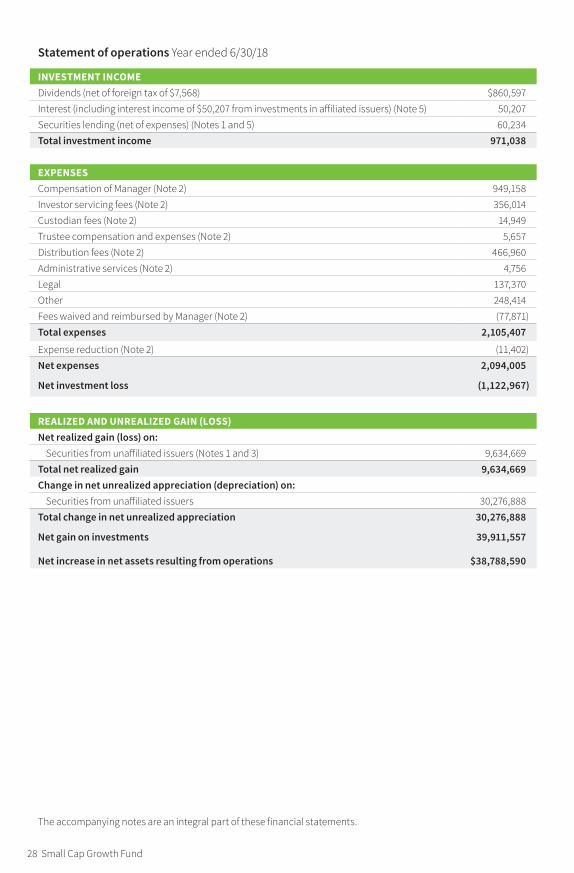
Statement of operations Year ended 6/30/18
INVESTMENT INCOMEDividends (net of foreign tax of $7,568) $860,597 Interest (including interest income of $50,207 from investments in affiliated issuers) (Note 5) 50,207 Securities lending (net of expenses) (Notes 1 and 5) 60,234 Total investment income 971,038
EXPENSESCompensation of Manager (Note 2) 949,158 Investor servicing fees (Note 2) 356,014 Custodian fees (Note 2) 14,949 Trustee compensation and expenses (Note 2) 5,657 Distribution fees (Note 2) 466,960 Administrative services (Note 2) 4,756 Legal 137,370 Other 248,414 Fees waived and reimbursed by Manager (Note 2) (77,871)Total expenses 2,105,407
Expense reduction (Note 2) (11,402)Net expenses 2,094,005
Net investment loss (1,122,967)
REALIZED AND UNREALIZED GAIN (LOSS)Net realized gain (loss) on:
Securities from unaffiliated issuers (Notes 1 and 3) 9,634,669 Total net realized gain 9,634,669 Change in net unrealized appreciation (depreciation) on:
Securities from unaffiliated issuers 30,276,888 Total change in net unrealized appreciation 30,276,888
Net gain on investments 39,911,557
Net increase in net assets resulting from operations $38,788,590
28 Small Cap Growth Fund
The accompanying notes are an integral part of these financial statements.
Statement of changes in net assets
INCREASE IN NET ASSETS Year ended 6/30/18 Year ended 6/30/17OperationsNet investment loss $(1,122,967) $(598,377)Net realized gain on investments 9,634,669 25,676,370 Net unrealized appreciation of investments 30,276,888 6,603,242 Net increase in net assets resulting from operations 38,788,590 31,681,235 Distributions to shareholders (Note 1):
From ordinary incomeNet investment income
Class A — (3,552)Class R6 — (36,836)Class Y — (20,943)
Decrease from capital share transactions (Note 4) (811,776) (17,460,610)Total increase in net assets 37,976,814 14,159,294
NET ASSETSBeginning of year 153,190,493 139,031,199End of year (including accumulated net investment loss of $434,197 and $393,964, respectively) $191,167,307 $153,190,493
Small Cap Growth Fund 29
Small Cap Growth Fund 31 30 Small Cap Growth Fund
The accompanying notes are an integral part of these financial statements.
See notes to financial highlights at the end of this section.
Financial highlights (For a common share outstanding throughout the period)
INVESTMENT OPERATIONS LESS DISTRIBUTIONS RATIOS AND SUPPLEMENTAL DATA
Period ended
Net asset value, beginning of period
Net investment income (loss ) a
Net realized and unrealized
gain (loss) on investments
Total from investment operations
From net investment
income Total
dis tri bu tions Net asset value,
end of period
Total return at net asset value (% ) b
Net assets, end of period
(in thousands )
Ratio of expenses to average
net assets (% ) c
Ratio of net investment
income (loss) to average
net assets (% )Portfolio
turnover (% )
Class A June 30, 2018 $33.97 (.25 ) d 9.19 8.94 — — $42.91 26.32 $141,801 1.25 e,f (.66 ) d,f 68 June 30, 2017 27.38 (.11 ) 6.70 6.59 — g — g 33.97 24.07 112,740 1.21 (.37 ) 127 June 30, 2016 32.34 .07 h (5.03 ) (4.96 ) — — 27.38 (15.34 ) 104,743 1.22 i .26 h,i 66 June 30, 2015 29.13 (.09 ) 3.30 3.21 — — 32.34 11.02 130,125 1.21 (.31 ) 91 June 30, 2014 22.97 (.15 ) 6.31 6.16 — — 29.13 26.82 124,234 1.24 (.55 ) 57 Class B June 30, 2018 $30.17 (.47 ) d 8.12 7.65 — — $37.82 25.36 $2,732 2.00 e,f (1.41 ) d,f 68 June 30, 2017 24.50 (.31 ) 5.98 5.67 — — 30.17 23.14 2,568 1.96 (1.12 ) 127 June 30, 2016 29.16 (.11 ) h (4.55 ) (4.66 ) — — 24.50 (15.98 ) 2,012 1.97 i (.45 ) h,i 66 June 30, 2015 26.46 (.29 ) 2.99 2.70 — — 29.16 10.20 1,911 1.96 (1.06 ) 91 June 30, 2014 21.03 (.33 ) 5.76 5.43 — — 26.46 25.82 1,580 1.99 (1.29 ) 57 Class C June 30, 2018 $30.06 (.46 ) d 8.08 7.62 — — $37.68 25.35 $6,612 2.00 e,f (1.41 ) d,f 68 June 30, 2017 24.41 (.31 ) 5.96 5.65 — — 30.06 23.15 9,900 1.96 (1.12 ) 127 June 30, 2016 29.05 (.13 ) h (4.51 ) (4.64 ) — — 24.41 (15.97 ) 8,520 1.97 i (.52 ) h,i 66 June 30, 2015 26.36 (.28 ) 2.97 2.69 — — 29.05 10.20 10,291 1.96 (1.06 ) 91 June 30, 2014 20.95 (.33 ) 5.74 5.41 — — 26.36 25.82 8,093 1.99 (1.30 ) 57 Class M June 30, 2018 $31.40 (.40 ) d 8.47 8.07 — — $39.47 25.70 $1,387 1.75 e,f (1.16 ) d,f 68 June 30, 2017 25.44 (.25 ) 6.21 5.96 — — 31.40 23.43 1,200 1.71 (.87 ) 127 June 30, 2016 30.20 (.06 ) h (4.70 ) (4.76 ) — — 25.44 (15.76 ) 1,169 1.72 i (.24 ) h,i 66 June 30, 2015 27.34 (.22 ) 3.08 2.86 — — 30.20 10.46 1,482 1.71 (.80 ) 91 June 30, 2014 21.67 (.27 ) 5.94 5.67 — — 27.34 26.17 1,401 1.74 (1.05 ) 57 Class R June 30, 2018 $32.86 (.33 ) d 8.88 8.55 — — $41.41 26.02 $9,034 1.50 e,f (.91 ) d,f 68 June 30, 2017 26.55 (.19 ) 6.50 6.31 — — 32.86 23.77 7,920 1.46 (.62 ) 127 June 30, 2016 31.44 (.01 ) h (4.88 ) (4.89 ) — — 26.55 (15.55 ) 7,446 1.47 i (.02 ) h,i 66 June 30, 2015 28.40 (.16 ) 3.20 3.04 — — 31.44 10.70 10,710 1.46 (.55 ) 91 June 30, 2014 22.45 (.22 ) 6.17 5.95 — — 28.40 26.50 10,707 1.49 (.81 ) 57 Class R6 June 30, 2018 $35.11 (.09 ) d 9.53 9.44 — — $44.55 26.89 $11,041 .82 e,f (.22 ) d,f 68 June 30, 2017 28.29 .02 6.93 6.95 (.13 ) (.13 ) 35.11 24.61 8,719 .77 .07 127 June 30, 2016 33.28 .24 h,j (5.23 ) (4.99 ) — — 28.29 (14.99 ) 6,781 .81 i .82 h,i,j 66 June 30, 2015 † 32.96 (.01 ) .33 .32 — — 33.28 .97 * 10 — * k — * k 91
Small Cap Growth Fund 33 32 Small Cap Growth Fund
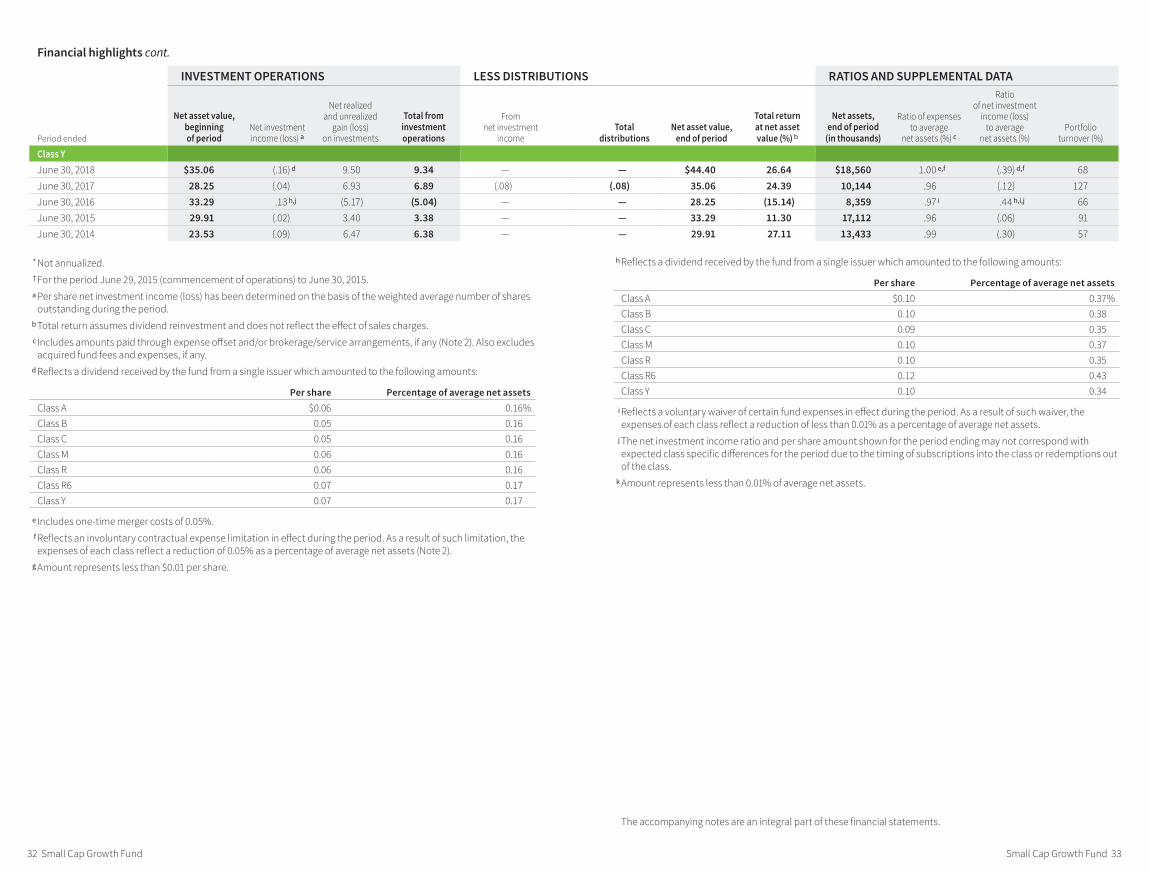
Financial highlights cont.
The accompanying notes are an integral part of these financial statements.
* Not annualized.
† For the period June 29, 2015 (commencement of operations) to June 30, 2015. a Per share net investment income (loss) has been determined on the basis of the weighted average number of shares
outstanding during the period. b Total return assumes dividend reinvestment and does not reflect the effect of sales charges. c Includes amounts paid through expense offset and/or brokerage/service arrangements, if any (Note 2). Also excludes
acquired fund fees and expenses, if any. d Reflects a dividend received by the fund from a single issuer which amounted to the following amounts:
Per share Percentage of average net assetsClass A $0.06 0.16%Class B 0.05 0.16Class C 0.05 0.16Class M 0.06 0.16Class R 0.06 0.16Class R6 0.07 0.17Class Y 0.07 0.17
e Includes one-time merger costs of 0.05%. f Reflects an involuntary contractual expense limitation in effect during the period. As a result of such limitation, the
expenses of each class reflect a reduction of 0.05% as a percentage of average net assets (Note 2). g Amount represents less than $0.01 per share.
h Reflects a dividend received by the fund from a single issuer which amounted to the following amounts:
Per share Percentage of average net assetsClass A $0.10 0.37%Class B 0.10 0.38Class C 0.09 0.35Class M 0.10 0.37Class R 0.10 0.35Class R6 0.12 0.43Class Y 0.10 0.34
i Reflects a voluntary waiver of certain fund expenses in effect during the period. As a result of such waiver, the expenses of each class reflect a reduction of less than 0.01% as a percentage of average net assets.
j The net investment income ratio and per share amount shown for the period ending may not correspond with expected class specific differences for the period due to the timing of subscriptions into the class or redemptions out of the class.
k Amount represents less than 0.01% of average net assets.
INVESTMENT OPERATIONS LESS DISTRIBUTIONS RATIOS AND SUPPLEMENTAL DATA
Period ended
Net asset value, beginning of period
Net investment income (loss ) a
Net realized and unrealized
gain (loss) on investments
Total from investment operations
From net investment
income Total
dis tri bu tions Net asset value,
end of period
Total return at net asset value (% ) b
Net assets, end of period
(in thousands )
Ratio of expenses to average
net assets (% ) c
Ratio of net investment
income (loss) to average
net assets (% )Portfolio
turnover (% )
Class Y June 30, 2018 $35.06 (.16 ) d 9.50 9.34 — — $44.40 26.64 $18,560 1.00 e,f (.39 ) d,f 68 June 30, 2017 28.25 (.04 ) 6.93 6.89 (.08 ) (.08 ) 35.06 24.39 10,144 .96 (.12 ) 127 June 30, 2016 33.29 .13 h,j (5.17 ) (5.04 ) — — 28.25 (15.14 ) 8,359 .97 i .44 h,i,j 66 June 30, 2015 29.91 (.02 ) 3.40 3.38 — — 33.29 11.30 17,112 .96 (.06 ) 91 June 30, 2014 23.53 (.09 ) 6.47 6.38 — — 29.91 27.11 13,433 .99 (.30 ) 57
34 Small Cap Growth Fund
Notes to financial statements 6/30/18
Within the following Notes to financial statements, references to “State Street” represent State Street Bank and Trust Company, references to “the SEC” represent the Securities and Exchange Commission, references to “Putnam Management” represent Putnam Investment Management, LLC, the fund’s manager, an indirect wholly-owned subsidiary of Putnam Investments, LLC and references to “OTC”, if any, represent over-the-counter. Unless otherwise noted, the “reporting period” represents the period from July 1, 2017 through June 30, 2018.
Putnam Small Cap Growth Fund (the fund) is a diversified series of Putnam Funds Trust (the Trust), a Massa-chusetts business trust registered under the Investment Company Act of 1940, as amended, as an open-end management investment company. The goal of the fund is to seek capital appreciation. The fund invests mainly in common stocks of small U.S. companies, with a focus on growth stocks. Growth stocks are issued by companies whose earnings are expected to grow faster than those of similar firms, and whose business growth and other characteristics may lead to an increase in stock price. Under normal circumstances, Putnam Management invests at least 80% of the fund’s net assets in companies of a size similar to those in the Russell 2000 Growth Index. This policy may be changed only after 60 days’ notice to shareholders. As of August 31, 2017, the index was composed of companies having market capitalizations of between approximately $43.67 million and $10.21 billion. Putnam Management may consider, among other factors, a company’s valuation, financial strength, growth potential, competitive position in its industry, projected future earnings, cash flows and dividends when deciding whether to buy or sell investments.
The fund offers class A, class B, class C, class M, class R, class R6 and class Y shares. The fund registered class T shares in February 2017, however, as of the date of this report, class T shares had not commenced operations and are not available for purchase. Purchases of class B shares are closed to new and existing investors except by exchange from class B shares of another Putnam fund or through dividend and/or capital gains reinvest-ment. Class A and class M shares are sold with a maximum front-end sales charge of 5.75% and 3.50%, respec-tively. Class A shares generally are not subject to a contingent deferred sales charge, and class M, class R, class R6 and class Y shares are not subject to a contingent deferred sales charge. Class B shares, which convert to class A shares after approximately eight years, are not subject to a front-end sales charge and are subject to a contingent deferred sales charge if those shares are redeemed within six years of purchase. Class C shares are subject to a one-year 1.00% contingent deferred sales charge and generally convert to class A shares after approximately ten years. Prior to April 1, 2018, class C shares did not convert to class A shares. Class R shares, which are not available to all investors, are sold at net asset value. The expenses for class A, class B, class C, class M and class R shares may differ based on the distribution fee of each class, which is identified in Note 2. Class R6 and class Y shares, which are sold at net asset value, are generally subject to the same expenses as class A, class B, class C, class M and class R shares, but do not bear a distribution fee, and in the case of class R6 shares, bear a lower investor servicing fee, which is identified in Note 2. Class R6 and class Y shares are not available to all investors.
In the normal course of business, the fund enters into contracts that may include agreements to indemnify another party under given circumstances. The fund’s maximum exposure under these arrangements is unknown as this would involve future claims that may be, but have not yet been, made against the fund. However, the fund’s management team expects the risk of material loss to be remote.
The fund has entered into contractual arrangements with an investment adviser, administrator, distributor, share-holder servicing agent and custodian, who each provide services to the fund. Unless expressly stated otherwise, shareholders are not parties to, or intended beneficiaries of these contractual arrangements, and these contrac-tual arrangements are not intended to create any shareholder right to enforce them against the service providers or to seek any remedy under them against the service providers, either directly or on behalf of the fund.
Under the fund’s Agreement and Declaration of Trust, any claims asserted against or on behalf of the Putnam Funds, including claims against Trustees and Officers, must be brought in state and federal courts located within the Commonwealth of Massachusetts.
Note 1: Significant accounting policiesThe following is a summary of significant accounting policies consistently followed by the fund in the preparation of its financial statements. The preparation of financial statements is in conformity with accounting principles generally accepted in the United States of America and requires management to make estimates and assump-tions that affect the reported amounts of assets and liabilities in the financial statements and the reported amounts of increases and decreases in net assets from operations. Actual results could differ from those esti-mates. Subsequent events after the Statement of assets and liabilities date through the date that the financial statements were issued have been evaluated in the preparation of the financial statements.
Small Cap Growth Fund 35
Investment income, realized and unrealized gains and losses and expenses of the fund are borne pro-rata based on the relative net assets of each class to the total net assets of the fund, except that each class bears expenses unique to that class (including the distribution fees applicable to such classes). Each class votes as a class only with respect to its own distribution plan or other matters on which a class vote is required by law or determined by the Trustees. If the fund were liquidated, shares of each class would receive their pro-rata share of the net assets of the fund. In addition, the Trustees declare separate dividends on each class of shares.
Security valuation Portfolio securities and other investments are valued using policies and procedures adopted by the Board of Trustees. The Trustees have formed a Pricing Committee to oversee the implementation of these procedures and have delegated responsibility for valuing the fund’s assets in accordance with these procedures to Putnam Management. Putnam Management has established an internal Valuation Committee that is respon-sible for making fair value determinations, evaluating the effectiveness of the pricing policies of the fund and reporting to the Pricing Committee.
Investments for which market quotations are readily available are valued at the last reported sales price on their principal exchange, or official closing price for certain markets, and are classified as Level 1 securities under Accounting Standards Codification 820 Fair Value Measurements and Disclosures (ASC 820). If no sales are reported, as in the case of some securities that are traded OTC, a security is valued at its last reported bid price and is generally categorized as a Level 2 security.
Investments in open-end investment companies (excluding exchange-traded funds), if any, which can be classi-fied as Level 1 or Level 2 securities, are valued based on their net asset value. The net asset value of such invest-ment companies equals the total value of their assets less their liabilities and divided by the number of their outstanding shares.
Many securities markets and exchanges outside the U.S. close prior to the scheduled close of the New York Stock Exchange and therefore the closing prices for securities in such markets or on such exchanges may not fully reflect events that occur after such close but before the scheduled close of the New York Stock Exchange. Accord-ingly, on certain days, the fund will fair value certain foreign equity securities taking into account multiple factors including movements in the U.S. securities markets, currency valuations and comparisons to the valuation of American Depository Receipts, exchange-traded funds and futures contracts. The foreign equity securities, which would generally be classified as Level 1 securities, will be transferred to Level 2 of the fair value hierarchy when they are valued at fair value. The number of days on which fair value prices will be used will depend on market activity and it is possible that fair value prices will be used by the fund to a significant extent. Securities quoted in foreign currencies, if any, are translated into U.S. dollars at the current exchange rate. Short-term securities with remaining maturities of 60 days or less are valued using an independent pricing service approved by the Trustees, and are classified as Level 2 securities.
To the extent a pricing service or dealer is unable to value a security or provides a valuation that Putnam Manage-ment does not believe accurately reflects the security’s fair value, the security will be valued at fair value by Putnam Management in accordance with policies and procedures approved by the Trustees. Certain invest-ments, including certain restricted and illiquid securities and derivatives, are also valued at fair value following procedures approved by the Trustees. These valuations consider such factors as significant market or specific security events such as interest rate or credit quality changes, various relationships with other securities, discount rates, U.S. Treasury, U.S. swap and credit yields, index levels, convexity exposures, recovery rates, sales and other multiples and resale restrictions. These securities are classified as Level 2 or as Level 3 depending on the priority of the significant inputs.
To assess the continuing appropriateness of fair valuations, the Valuation Committee reviews and affirms the reasonableness of such valuations on a regular basis after considering all relevant information that is reasonably available. Such valuations and procedures are reviewed periodically by the Trustees. The fair value of securities is generally determined as the amount that the fund could reasonably expect to realize from an orderly disposi-tion of such securities over a reasonable period of time. By its nature, a fair value price is a good faith estimate of the value of a security in a current sale and does not reflect an actual market price, which may be different by a material amount.
Security transactions and related investment income Security transactions are recorded on the trade date (the date the order to buy or sell is executed). Gains or losses on securities sold are determined on the identified cost basis.
36 Small Cap Growth Fund
Interest income, net of any applicable withholding taxes, is recorded on the accrual basis. Dividend income, net of any applicable withholding taxes, is recognized on the ex-dividend date except that certain dividends from foreign securities, if any, are recognized as soon as the fund is informed of the ex-dividend date. Non-cash divi-dends, if any, are recorded at the fair value of the securities received. Dividends representing a return of capital or capital gains, if any, are reflected as a reduction of cost and/or as a realized gain.
Securities lending The fund may lend securities, through its agent, to qualified borrowers in order to earn addi-tional income. The loans are collateralized by cash in an amount at least equal to the fair value of the securities loaned. The fair value of securities loaned is determined daily and any additional required collateral is allocated to the fund on the next business day. The remaining maturities of the securities lending transactions are consid-ered overnight and continuous. The risk of borrower default will be borne by the fund’s agent; the fund will bear the risk of loss with respect to the investment of the cash collateral. Income from securities lending, net of expenses, is included in investment income on the Statement of operations. Cash collateral is invested in Putnam Cash Collateral Pool, LLC, a limited liability company managed by an affiliate of Putnam Management. Invest-ments in Putnam Cash Collateral Pool, LLC are valued at its closing net asset value each business day. There are no management fees charged to Putnam Cash Collateral Pool, LLC. At the close of the reporting period, the fund received cash collateral of $37,057,260 and the value of securities loaned amounted to $36,275,759.
Interfund lending The fund, along with other Putnam funds, may participate in an interfund lending program pursuant to an exemptive order issued by the SEC. This program allows the fund to borrow from or lend to other Putnam funds that permit such transactions. Interfund lending transactions are subject to each fund’s investment policies and borrowing and lending limits. Interest earned or paid on the interfund lending trans-action will be based on the average of certain current market rates. During the reporting period, the fund did not utilize the program.
Lines of credit The fund participates, along with other Putnam funds, in a $317.5 million unsecured committed line of credit and a $235.5 million unsecured uncommitted line of credit, both provided by State Street. Borrow-ings may be made for temporary or emergency purposes, including the funding of shareholder redemption requests and trade settlements. Interest is charged to the fund based on the fund’s borrowing at a rate equal to 1.25% plus the higher of (1) the Federal Funds rate and (2) the overnight LIBOR for the committed line of credit and the Federal Funds rate plus 1.30% for the uncommitted line of credit. A closing fee equal to 0.04% of the committed line of credit plus a $25,000 flat fee and 0.04% of the uncommitted line of credit has been paid by the participating funds. In addition, a commitment fee of 0.21% per annum on any unutilized portion of the committed line of credit is allocated to the participating funds based on their relative net assets and paid quarterly. During the reporting period, the fund had no borrowings against these arrangements.
Federal taxes It is the policy of the fund to distribute all of its taxable income within the prescribed time period and otherwise comply with the provisions of the Internal Revenue Code of 1986, as amended (the Code), appli-cable to regulated investment companies. It is also the intention of the fund to distribute an amount sufficient to avoid imposition of any excise tax under Section 4982 of the Code.
The fund is subject to the provisions of Accounting Standards Codification 740 Income Taxes (ASC 740). ASC 740 sets forth a minimum threshold for financial statement recognition of the benefit of a tax position taken or expected to be taken in a tax return. The fund did not have a liability to record for any unrecognized tax benefits in the accompanying financial statements. No provision has been made for federal taxes on income, capital gains or unrealized appreciation on securities held nor for excise tax on income and capital gains. Each of the fund’s federal tax returns for the prior three fiscal years remains subject to examination by the Internal Revenue Service.
Pursuant to federal income tax regulations applicable to regulated investment companies, the fund has elected to defer $434,197 to its fiscal year ending June 30, 2019 of late year ordinary losses ((i) ordinary losses recognized between January 1, 2018 and June 30, 2018 and (ii) specified ordinary and currency losses recognized between November 1, 2017 and June 30, 2018).
Distributions to shareholders Distributions to shareholders from net investment income are recorded by the fund on the ex-dividend date. Distributions from capital gains, if any, are recorded on the ex-dividend date and paid at least annually. The amount and character of income and gains to be distributed are determined in accor-dance with income tax regulations, which may differ from generally accepted accounting principles. These differ-ences include temporary and/or permanent differences from losses on wash sale transactions, from late year loss deferrals, from net operating loss and from non-deductible merger expenses. Reclassifications are made to the fund’s capital accounts to reflect income and gains available for distribution (or available capital loss carryovers) under income tax regulations. At the close of the reporting period, the fund reclassified $1,082,734 to decrease
Small Cap Growth Fund 37
accumulated net investment loss, $1,131,290 to decrease paid-in capital and $48,556 to increase accumulated net realized gain.
Tax cost of investments includes adjustments to net unrealized appreciation (depreciation) which may not neces-sarily be final tax cost basis adjustments, but closely approximate the tax basis unrealized gains and losses that may be realized and distributed to shareholders. The tax basis components of distributable earnings and the federal tax cost as of the close of the reporting period were as follows:
Unrealized appreciation $47,794,896
Unrealized depreciation (3,116,663 )
Net unrealized appreciation 44,678,233
Undistributed long-term gain 3,054,144
Late year ordinary loss deferral (434,197)
Cost for federal income tax purposes $186,297,655
Expenses of the Trust Expenses directly charged or attributable to any fund will be paid from the assets of that fund. Generally, expenses of the Trust will be allocated among and charged to the assets of each fund on a basis that the Trustees deem fair and equitable, which may be based on the relative assets of each fund or the nature of the services performed and relative applicability to each fund.
Note 2: Management fee, administrative services and other transactionsThe fund pays Putnam Management a management fee (base fee) (based on the fund’s average net assets and computed and paid monthly) at annual rates that may vary based on the average of the aggregate net assets of all open-end mutual funds sponsored by Putnam Management (excluding net assets of funds that are invested in, or that are invested in by, other Putnam funds to the extent necessary to avoid “double counting” of those assets). Such annual rates may vary as follows:
0.780 % of the first $5 billion,
0.730 % of the next $5 billion,
0.680 % of the next $10 billion,
0.630 % of the next $10 billion,
0.580 % of the next $50 billion,
0.560 % of the next $50 billion,
0.550 % of the next $100 billion and
0.545 % of any excess thereafter.
In addition, the monthly management fee consists of the monthly base fee plus or minus a performance adjust-ment for the month. The performance adjustment is determined based on performance over the thirty-six month period then ended. Each month, the performance adjustment is calculated by multiplying the performance adjustment rate and the fund’s average net assets over the performance period and dividing the result by twelve. The resulting dollar amount is added to, or subtracted from the base fee for that month. The performance adjust-ment rate is equal to 0.03 multiplied by the difference between the fund’s annualized performance (measured by the fund’s class A shares) and the annualized performance of the Russell 2000 Growth Index each measured over the performance period. The maximum annualized performance adjustment rate is +/– 0.18%. The monthly base fee is determined based on the fund’s average net assets for the month, while the performance adjustment is determined based on the fund’s average net assets over the performance period of up to thirty-six months. This means it is possible that, if the fund underperforms significantly over the performance period, and the fund’s assets have declined significantly over that period, the negative performance adjustment may exceed the base fee. In this event, Putnam Management would make a payment to the fund.
Because the performance adjustment is based on the fund’s performance relative to its applicable benchmark index, and not its absolute performance, the performance adjustment could increase Putnam Management’s fee even if the fund’s shares lose value during the performance period provided that the fund outperformed its benchmark index, and could decrease Putnam Management’s fee even if the fund’s shares increase in value during the performance period provided that the fund underperformed its benchmark index.
For the reporting period, the base fee represented an effective rate (excluding the impact from any expense waivers in effect) of 0.623% of the fund’s average net assets before a decrease of $82,042 (0.050% of the fund’s average net assets) based on performance.
Putnam Management has contractually agreed, through October 30, 2019, to waive fees and/or reimburse the fund’s expenses to the extent necessary to limit the cumulative expenses of the fund, exclusive of brokerage, interest, taxes,
38 Small Cap Growth Fund
investment-related expenses, extraordinary expenses, acquired fund fees and expenses and payments under the fund’s investor servicing contract, investment management contract and distribution plans, on a fiscal year-to-date basis to an annual rate of 0.20% of the fund’s average net assets over such fiscal year-to-date period. During the reporting period, the fund’s expenses were reduced by $77,871 as a result of this limit.
Putnam Investments Limited (PIL), an affiliate of Putnam Management, is authorized by the Trustees to manage a separate portion of the assets of the fund as determined by Putnam Management from time to time. PIL did not manage any portion of the assets of the fund during the reporting period. If Putnam Management were to engage the services of PIL, Putnam Management would pay a quarterly sub-management fee to PIL for its services at an annual rate of 0.35% of the average net assets of the portion of the fund managed by PIL.
The fund reimburses Putnam Management an allocated amount for the compensation and related expenses of certain officers of the fund and their staff who provide administrative services to the fund. The aggregate amount of all such reimbursements is determined annually by the Trustees.
Custodial functions for the fund’s assets are provided by State Street. Custody fees are based on the fund’s asset level, the number of its security holdings and transaction volumes.
Putnam Investor Services, Inc., an affiliate of Putnam Management, provides investor servicing agent functions to the fund. Putnam Investor Services, Inc. received fees for investor servicing for class A, class B, class C, class M, class R and class Y shares that included (1) a per account fee for each direct and underlying non-defined contribu-tion account (retail account) of the fund; (2) a specified rate of the fund’s assets attributable to defined contribu-tion plan accounts; and (3) a specified rate based on the average net assets in retail accounts. Putnam Investor Services, Inc. has agreed that the aggregate investor servicing fees for each fund’s retail and defined contribution accounts for these share classes will not exceed an annual rate of 0.25% of the fund’s average assets attributable to such accounts.
Class R6 shares paid a monthly fee based on the average net assets of class R6 shares at an annual rate of 0.05%.
During the reporting period, the expenses for each class of shares related to investor servicing fees were as follows:
Class A $274,514
Class B 5,891
Class C 19,542
Class M 2,878
Class R 18,344
Class R6 4,842
Class Y 30,003
Total $356,014
The fund has entered into expense offset arrangements with Putnam Investor Services, Inc. and State Street whereby Putnam Investor Services, Inc.’s and State Street’s fees are reduced by credits allowed on cash balances. The fund also reduced expenses through brokerage/service arrangements. For the reporting period, the fund’s expenses were reduced by $487 under the expense offset arrangements and by $10,915 under the brokerage/service arrangements.
Each Independent Trustee of the fund receives an annual Trustee fee, of which $128, as a quarterly retainer, has been allocated to the fund, and an additional fee for each Trustees meeting attended. Trustees also are reimbursed for expenses they incur relating to their services as Trustees.
The fund has adopted a Trustee Fee Deferral Plan (the Deferral Plan) which allows the Trustees to defer the receipt of all or a portion of Trustees fees payable on or after July 1, 1995. The deferred fees remain invested in certain Putnam funds until distribution in accordance with the Deferral Plan.
The fund has adopted an unfunded noncontributory defined benefit pension plan (the Pension Plan) covering all Trustees of the fund who have served as a Trustee for at least five years and were first elected prior to 2004. Benefits under the Pension Plan are equal to 50% of the Trustee’s average annual attendance and retainer fees for the three years ended December 31, 2005. The retirement benefit is payable during a Trustee’s lifetime, beginning the year following retirement, for the number of years of service through December 31, 2006. Pension expense for the fund is included in Trustee compensation and expenses in the Statement of operations. Accrued pension liability is included in Payable for Trustee compensation and expenses in the Statement of assets and liabilities. The Trustees have terminated the Pension Plan with respect to any Trustee first elected after 2003.
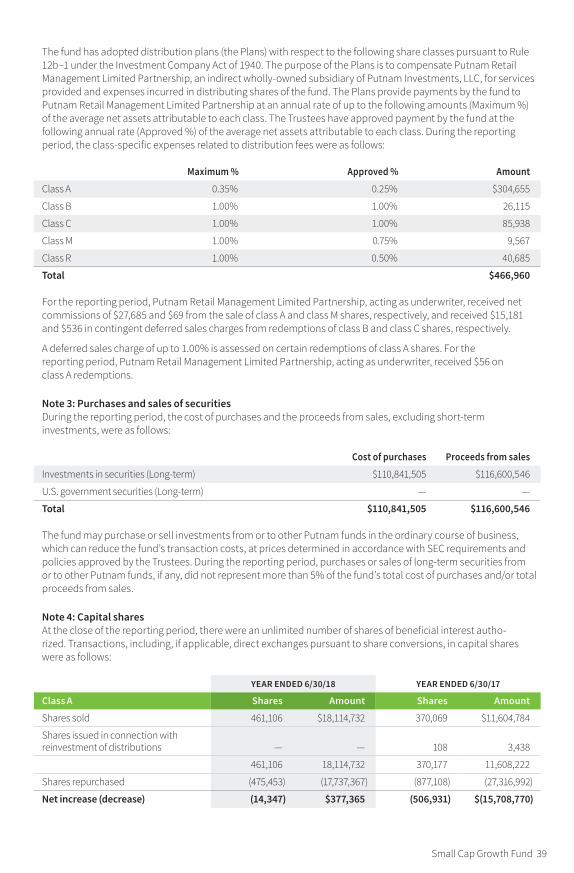
Small Cap Growth Fund 39
The fund has adopted distribution plans (the Plans) with respect to the following share classes pursuant to Rule 12b–1 under the Investment Company Act of 1940. The purpose of the Plans is to compensate Putnam Retail Management Limited Partnership, an indirect wholly-owned subsidiary of Putnam Investments, LLC, for services provided and expenses incurred in distributing shares of the fund. The Plans provide payments by the fund to Putnam Retail Management Limited Partnership at an annual rate of up to the following amounts (Maximum %) of the average net assets attributable to each class. The Trustees have approved payment by the fund at the following annual rate (Approved %) of the average net assets attributable to each class. During the reporting period, the class-specific expenses related to distribution fees were as follows:
Maximum % Approved % Amount
Class A 0.35 % 0.25 % $304,655
Class B 1.00 % 1.00 % 26,115
Class C 1.00 % 1.00 % 85,938
Class M 1.00 % 0.75 % 9,567
Class R 1.00 % 0.50 % 40,685
Total $466,960
For the reporting period, Putnam Retail Management Limited Partnership, acting as underwriter, received net commissions of $27,685 and $69 from the sale of class A and class M shares, respectively, and received $15,181 and $536 in contingent deferred sales charges from redemptions of class B and class C shares, respectively.
A deferred sales charge of up to 1.00% is assessed on certain redemptions of class A shares. For the reporting period, Putnam Retail Management Limited Partnership, acting as underwriter, received $56 on class A redemptions.
Note 3: Purchases and sales of securitiesDuring the reporting period, the cost of purchases and the proceeds from sales, excluding short-term investments, were as follows:
Cost of purchases Proceeds from sales
Investments in securities (Long-term ) $110,841,505 $116,600,546
U.S. government securities (Long-term ) — —
Total $110,841,505 $116,600,546
The fund may purchase or sell investments from or to other Putnam funds in the ordinary course of business, which can reduce the fund’s transaction costs, at prices determined in accordance with SEC requirements and policies approved by the Trustees. During the reporting period, purchases or sales of long-term securities from or to other Putnam funds, if any, did not represent more than 5% of the fund’s total cost of purchases and/or total proceeds from sales.
Note 4: Capital sharesAt the close of the reporting period, there were an unlimited number of shares of beneficial interest autho-rized. Transactions, including, if applicable, direct exchanges pursuant to share conversions, in capital shares were as follows:
YEAR ENDED 6/30/18 YEAR ENDED 6/30/17
Class A Shares Amount Shares Amount
Shares sold 461,106 $18,114,732 370,069 $11,604,784
Shares issued in connection with reinvestment of distributions — — 108 3,438
461,106 18,114,732 370,177 11,608,222
Shares repurchased (475,453 ) (17,737,367 ) (877,108 ) (27,316,992 )
Net increase (decrease ) (14,347 ) $377,365 (506,931 ) $(15,708,770 )
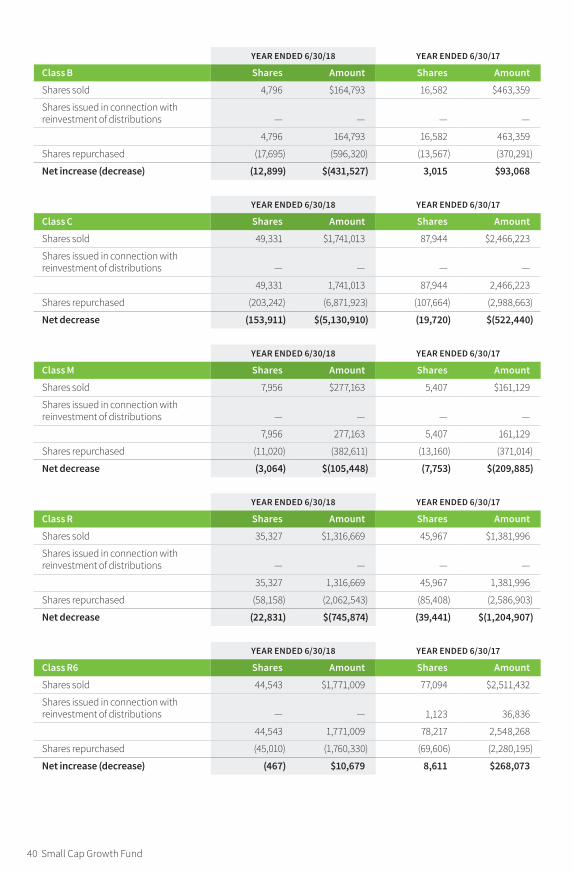
40 Small Cap Growth Fund
YEAR ENDED 6/30/18 YEAR ENDED 6/30/17
Class B Shares Amount Shares Amount
Shares sold 4,796 $164,793 16,582 $463,359
Shares issued in connection with reinvestment of distributions — — — —
4,796 164,793 16,582 463,359
Shares repurchased (17,695 ) (596,320 ) (13,567 ) (370,291 )
Net increase (decrease ) (12,899 ) $(431,527 ) 3,015 $93,068
YEAR ENDED 6/30/18 YEAR ENDED 6/30/17
Class C Shares Amount Shares Amount
Shares sold 49,331 $1,741,013 87,944 $2,466,223
Shares issued in connection with reinvestment of distributions — — — —
49,331 1,741,013 87,944 2,466,223
Shares repurchased (203,242 ) (6,871,923 ) (107,664 ) (2,988,663 )
Net decrease (153,911 ) $(5,130,910 ) (19,720 ) $(522,440 )
YEAR ENDED 6/30/18 YEAR ENDED 6/30/17
Class M Shares Amount Shares Amount
Shares sold 7,956 $277,163 5,407 $161,129
Shares issued in connection with reinvestment of distributions — — — —
7,956 277,163 5,407 161,129
Shares repurchased (11,020 ) (382,611 ) (13,160 ) (371,014 )
Net decrease (3,064 ) $(105,448 ) (7,753 ) $(209,885 )
YEAR ENDED 6/30/18 YEAR ENDED 6/30/17
Class R Shares Amount Shares Amount
Shares sold 35,327 $1,316,669 45,967 $1,381,996
Shares issued in connection with reinvestment of distributions — — — —
35,327 1,316,669 45,967 1,381,996
Shares repurchased (58,158 ) (2,062,543 ) (85,408 ) (2,586,903 )
Net decrease (22,831 ) $(745,874 ) (39,441 ) $(1,204,907 )
YEAR ENDED 6/30/18 YEAR ENDED 6/30/17
Class R6 Shares Amount Shares Amount
Shares sold 44,543 $1,771,009 77,094 $2,511,432
Shares issued in connection with reinvestment of distributions — — 1,123 36,836
44,543 1,771,009 78,217 2,548,268
Shares repurchased (45,010 ) (1,760,330 ) (69,606 ) (2,280,195 )
Net increase (decrease) (467 ) $10,679 8,611 $268,073
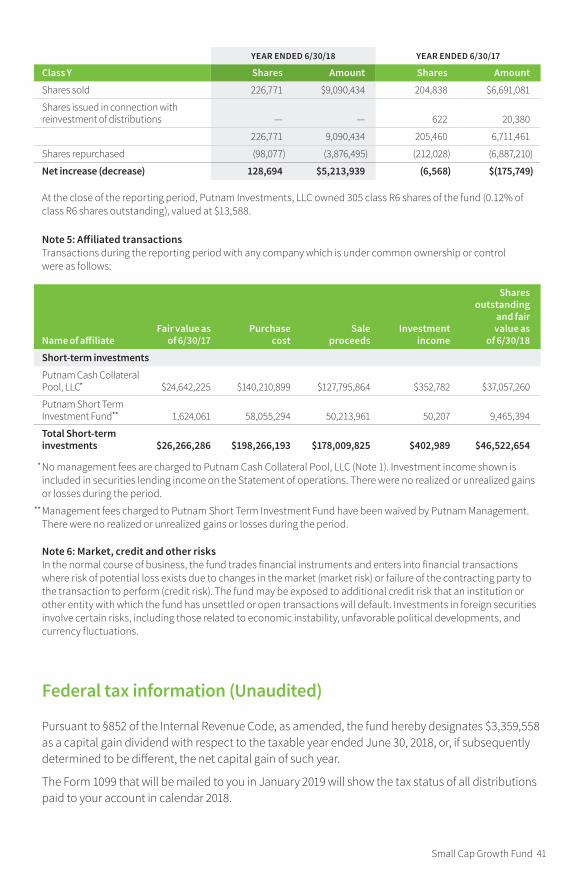
Small Cap Growth Fund 41
YEAR ENDED 6/30/18 YEAR ENDED 6/30/17
Class Y Shares Amount Shares Amount
Shares sold 226,771 $9,090,434 204,838 $6,691,081
Shares issued in connection with reinvestment of distributions — — 622 20,380
226,771 9,090,434 205,460 6,711,461
Shares repurchased (98,077 ) (3,876,495 ) (212,028 ) (6,887,210 )
Net increase (decrease ) 128,694 $5,213,939 (6,568 ) $(175,749 )
At the close of the reporting period, Putnam Investments, LLC owned 305 class R6 shares of the fund (0.12% of class R6 shares outstanding), valued at $13,588.
Note 5: Affiliated transactionsTransactions during the reporting period with any company which is under common ownership or control were as follows:
Name of affiliateFair value as
of 6/30/17Purchase
costSale
proceedsInvestment
income
Shares outstanding
and fair value as
of 6/30/18
Short-term investments
Putnam Cash Collateral Pool, LLC * $24,642,225 $140,210,899 $127,795,864 $352,782 $37,057,260
Putnam Short Term Investment Fund * * 1,624,061 58,055,294 50,213,961 50,207 9,465,394
Total Short-term investments $26,266,286 $198,266,193 $178,009,825 $402,989 $46,522,654
* No management fees are charged to Putnam Cash Collateral Pool, LLC (Note 1). Investment income shown is included in securities lending income on the Statement of operations. There were no realized or unrealized gains or losses during the period.
** Management fees charged to Putnam Short Term Investment Fund have been waived by Putnam Management. There were no realized or unrealized gains or losses during the period.
Note 6: Market, credit and other risksIn the normal course of business, the fund trades financial instruments and enters into financial transactions where risk of potential loss exists due to changes in the market (market risk) or failure of the contracting party to the transaction to perform (credit risk). The fund may be exposed to additional credit risk that an institution or other entity with which the fund has unsettled or open transactions will default. Investments in foreign securities involve certain risks, including those related to economic instability, unfavorable political developments, and currency fluctuations.
Federal tax information (Unaudited)
Pursuant to §852 of the Internal Revenue Code, as amended, the fund hereby designates $3,359,558 as a capital gain dividend with respect to the taxable year ended June 30, 2018, or, if subsequently determined to be different, the net capital gain of such year.
The Form 1099 that will be mailed to you in January 2019 will show the tax status of all distributions paid to your account in calendar 2018.

About the TrusteesINDEPENDENT TRUSTEES
Liaquat Ahamed Born 1952, Trustee since 2012Principal occupations during past five years: Pulitzer Prize-winning author of Lords of Finance: The Bankers Who Broke
the World, whose articles on economics have appeared in such publications as the New York Times, Foreign Affairs, and the Financial Times. Director of Aspen Insurance Co., a New York Stock Exchange company, and Chair of the Aspen Board’s Investment Committee. Trustee of the Brookings Institution.
Other directorships: The Rohatyn Group, an emerging-market fund complex that manages money for institutions
Ravi AkhouryBorn 1947, Trustee since 2009Principal occupations during past five years: Trustee of American India Foundation and of the Rubin Museum.
From 1992 to 2007, was Chairman and CEO of MacKay Shields, a multi-product investment management firm.
Other directorships: RAGE Frameworks, Inc., a private software company; English Helper, Inc., a private software company
Barbara M. Baumann Born 1955, Trustee since 2010Principal occupations during past five years: President and Owner of Cross Creek Energy Corporation, a strategic
consultant to domestic energy firms and direct investor in energy projects. Current Board member of The Denver Foundation. Former Chair and current Board member of Girls Incorporated of Metro Denver. Member of the Finance Committee, the Children’s Hospital of Colorado.
Other directorships: Buckeye Partners, L.P., a publicly traded master limited partnership focused on pipeline transport, storage, and distribution of petroleum products; Devon Energy Corporation, a leading independent natural gas and oil exploration and production company
Katinka DomotorffyBorn 1975, Trustee since 2012Principal occupations during past five years: Voting member of the Investment Committees of the Anne Ray Charitable
Trust and Margaret A. Cargill Foundation, part of the Margaret A. Cargill Philanthropies. Until 2011, Partner, Chief Investment Officer, and Global Head of Quantitative Investment Strategies at Goldman Sachs Asset Management.
Other directorships: Reach Out and Read of Greater New York, an organization dedicated to promoting childhood literacy; Great Lakes Science Center; College Now Greater Cleveland
Catharine Bond HillBorn 1954, Trustee since 2017Principal occupations during past five years: Managing Director of Ithaka S+R, a not-for-profit service that helps
the academic community navigate economic and technological change. From 2006 to 2016, served as the 10th President of Vassar College. Prior to 2006, was Provost of Williams College.
Other directorships: Director of Yale-NUS College; Alumni Fellow to the Yale Corporation
Dr. Paul L. JoskowBorn 1947, Trustee since 1997Principal occupations during past five years: Elizabeth and James Killian Professor of Economics, Emeritus at the
Massachusetts Institute of Technology (MIT). Until 2017, President of the Alfred P. Sloan Foundation, a philanthropic institution focused primarily on research and education issues related to science, technology, and economic performance. Prior to 2007, served as the Director of the Center for Energy and Environmental Policy Research at MIT. Prior to 1998, served as Head of the Department of Economics at MIT.
Other directorships: Yale University; Exelon Corporation, an energy company focused on power services; Boston Symphony Orchestra; Prior to April 2013, served as Director of TransCanada Corporation and TransCanada Pipelines Ltd., energy companies focused on natural gas transmission, oil pipelines and power services
42 Small Cap Growth Fund

Kenneth R. LeiblerBorn 1949, Trustee since 2006 Vice Chair from 2016 to 2018, and Chair since 2018Principal occupations during past
five years: Founder and former Chairman of Boston Options Exchange, an electronic marketplace for the trading of derivative securities. Vice Chair Emeritus of the Board of Trustees of Beth Israel Deaconess Hospital in Boston, Massachusetts, and former Director of Beth Israel Deaconess Care Organization. Until November 2010, Director of Ruder Finn Group, a global communications and advertising firm.
Other directorships: Eversource Corporation, which operates New England’s largest energy delivery system
Robert E. PattersonBorn 1945, Trustee since 1984Principal occupations during past five years: Co-Chairman of Cabot Properties, Inc., a private equity firm
investing in commercial real estate, and Chairman or Co-Chairman of the Investment Committees for various Cabot Funds. Past Chairman and Trustee of the Joslin Diabetes Center.
George Putnam, IIIBorn 1951, Trustee since 1984Principal occupations during past five years: Chairman of New Generation Research, Inc., a publisher of financial
advisory and other research services. Founder and President of New Generation Advisors, LLC, a registered investment advisor to private funds. Director of The Boston Family Office, LLC, a registered investment advisor.
Manoj P. SinghBorn 1952, Trustee since 2017Principal occupations during past five years: Until 2015, Chief Operating Officer and Global Managing Director at
Deloitte Touche Tohmatsu, Ltd., a global professional services organization. Served on the Deloitte U.S. Board of Directors and the boards of Deloitte member firms in China, Mexico, and Southeast Asia.
Other directorships: Director of Abt Associates, a global research firm focused on health, social and environmental policy, and international development. Trustee of Carnegie Mellon University. Trustee of Rubin Museum of Art. Director of Pratham USA, an organization dedicated to children’s education in India. Member of the Advisory Board of Altimetrik, a business transformation and technology solutions firm. Director of DXC Technology, a global IT services and consulting company
INTERESTED TRUSTEE
Robert L. Reynolds*
Born 1952, Trustee since 2008 and President of the Putnam Funds since 2009
Principal occupations during past five years: President and Chief Executive
Officer of Putnam Investments since 2008 and, since 2014, President and Chief Executive Officer of Great-West Financial, a financial services company that provides retirement savings plans, life insurance, and annuity and executive benefits products, and of Great-West Lifeco U.S. Inc., a holding company that owns Putnam Investments and Great-West Financial. Prior to joining Putnam Investments, served as Vice Chairman and Chief Operating Officer of Fidelity Investments from 2000 to 2007.
* Mr. Reynolds is an “interested person” (as defined in the Investment Company Act of 1940) of the fund and Putnam Investments. He is President and Chief Executive Officer of Putnam Investments, as well as the President of your fund and each of the other Putnam funds.
The address of each Trustee is One Post Office Square, Boston, MA 02109.
As of June 30, 2018, there were 102 Putnam funds. All Trustees serve as Trustees of all Putnam funds.
Each Trustee serves for an indefinite term, until his or her resignation, retirement at age 75, removal, or death.
Small Cap Growth Fund 43
The principal occupations of the officers for the past five years have been with the employers as shown above, although in some cases they have held different positions with such employers. The address of each officer is One Post Office Square, Boston, MA 02109.
OfficersIn addition to Robert L. Reynolds, the other officers of the fund are shown below:
Jonathan S. Horwitz (Born 1955)Executive Vice President, Principal Executive Officer, and Compliance LiaisonSince 2004
Robert T. Burns (Born 1961)Vice President and Chief Legal OfficerSince 2011General Counsel, Putnam Investments, Putnam Management, and Putnam Retail Management
James F. Clark (Born 1974)Vice President and Chief Compliance OfficerSince 2016Chief Compliance Officer, Putnam Investmentsand Putnam Management
Michael J. Higgins (Born 1976)Vice President, Treasurer, and ClerkSince 2010
Janet C. Smith (Born 1965)Vice President, Principal Financial Officer, Principal Accounting Officer, and Assistant TreasurerSince 2007Head of Fund Administration Services, Putnam Investments and Putnam Management
Susan G. Malloy (Born 1957)Vice President and Assistant TreasurerSince 2007Head of Accounting, Middle Office, & Control Services, Putnam Investments and Putnam Management
Mark C. Trenchard (Born 1962)Vice President and BSA Compliance OfficerSince 2002Director of Operational Compliance, Putnam Investments and Putnam Retail Management
Nancy E. Florek (Born 1957)Vice President, Director of Proxy Voting and Corporate Governance, Assistant Clerk, and Assistant TreasurerSince 2000
Denere P. Poulack (Born 1968)Assistant Vice President, Assistant Clerk, and Assistant TreasurerSince 2004
44 Small Cap Growth Fund
Fund informationFounded over 80 years ago, Putnam Investments was built around the concept that a balance between risk and reward is the hallmark of a well-rounded financial program. We manage over 100 funds across income, value, blend, growth, asset allocation, absolute return, and global sector categories.
Investment ManagerPutnam Investment Management, LLC One Post Office Square Boston, MA 02109
Investment Sub-AdvisorPutnam Investments Limited 16 St James’s Street London, England SW1A 1ER
Marketing ServicesPutnam Retail Management One Post Office Square Boston, MA 02109
CustodianState Street Bank and Trust Company
Legal CounselRopes & Gray LLP
Independent Registered Public Accounting FirmPricewaterhouseCoopers LLP
TrusteesKenneth R. Leibler, Chair Liaquat Ahamed Ravi Akhoury Barbara M. Baumann Katinka Domotorffy Catharine Bond Hill Paul L. Joskow Robert E. Patterson George Putnam, III Robert L. Reynolds Manoj P. Singh
OfficersRobert L. Reynolds President
Jonathan S. Horwitz Executive Vice President, Principal Executive Officer, and Compliance Liaison
Robert T. Burns Vice President and Chief Legal Officer
James F. Clark Vice President and Chief Compliance Officer
Michael J. Higgins Vice President, Treasurer, and Clerk
Janet C. Smith Vice President, Principal Financial Officer, Principal Accounting Officer, and Assistant Treasurer
Susan G. Malloy Vice President and Assistant Treasurer
Mark C. Trenchard Vice President and BSA Compliance Officer
Nancy E. Florek Vice President, Director of Proxy Voting and Corporate Governance, Assistant Clerk, and Assistant Treasurer
Denere P. Poulack Assistant Vice President, Assistant Clerk, and Assistant Treasurer
This report is for the information of shareholders of Putnam Small Cap Growth Fund. It may also be used as sales literature when preceded or accompanied by the current prospectus, the most recent copy of Putnam’s Quarterly Performance Summary, and Putnam’s Quarterly Ranking Summary. For more recent performance, please visit putnam.com. Investors should carefully consider the investment objectives, risks, charges, and expenses of a fund, which are described in its prospectus. For this and other information or to request a prospectus or summary prospectus, call 1-800-225-1581 toll free. Please read the prospectus carefully before investing. The fund’s Statement of Additional Information contains additional information about the fund’s Trustees and is available without charge upon request by calling 1-800-225-1581.
AN07
6 31
1974
8/
18
Elec
tron
ic se
rvic
e re
ques
ted
Go p
aper
less
: Log
on
to p
utna
m.c
om o
r sca
n th
is c
ode
to u
pdat
e yo
ur m
ailin
g op
tions
.
One
Pos
t Offi
ce S
quar
e
Bost
on, M
A 02
109
1-80
0-22
5-15
81pu
tnam
.com
PRSR
T ST
D
U.S
. PO
STAG
E PA
ID
BRO
CKTO
N, M
A
PERM
IT N
O. 6
00
Recommended