Small Area Prediction under Alternative Model Specifications
By
Wayne A. Fuller and Andreea L. Erciulescu
Department of Statistics, Iowa State University
Small Area Estimation 2014
Poznan, Poland, September, 2014
2
Outline
I. Motivating example
II. Models: auxiliary information
III. Bootstrap for prediction MSE
IV. Simulation

Conservation Effects Assessment Project (CEAP): Natural Resources Conservation Service
Impacts of conservation practices
Sample of fields
Subsample: National Resources Inventory(NRI)
Hydrologic Units
3
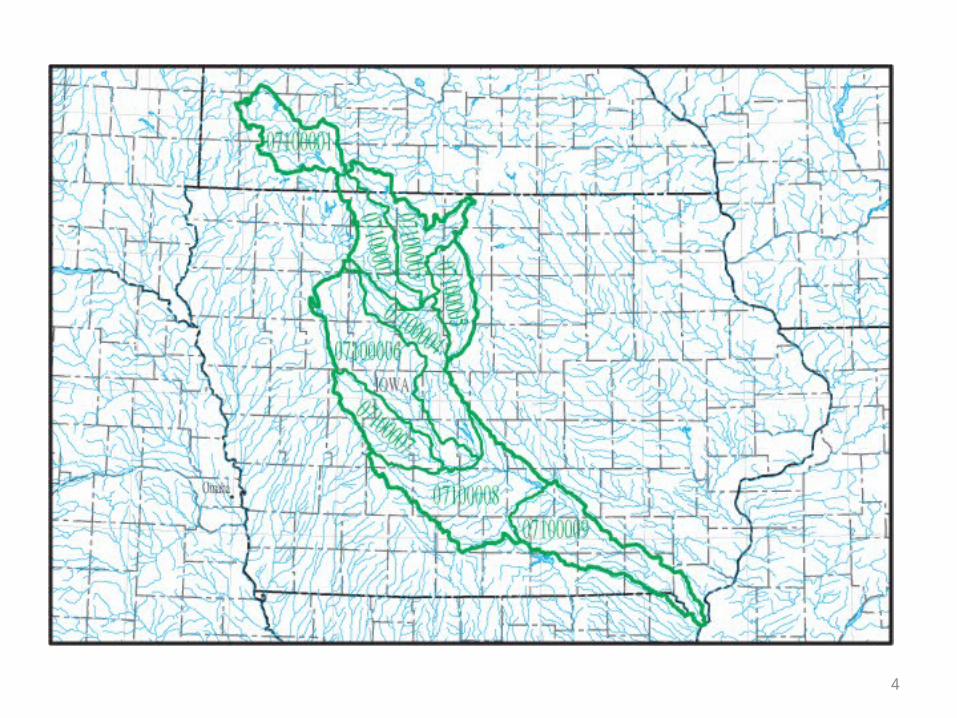
4

Unit Level Model
5
n informatioAuxiliary
discrete and Continuous
0)},(|{
effect area
),0(~,),,(
,,2,1;,,2,1),(2
ij
iijij
i
biijiijij
iijij
y
beE
b
Nbebgy
njmixy
x
βx

Auxiliary Data
6
(NRI) practices Cover, :~(known) data Soils :
2
1
x
x
μ
μ

Parameters
7
})ˆ{()ˆ(
}ˆ),,(|{ˆ
)( of parameters
),,,(
}),,(|{~
)(),,(
2
22
iiii
iiii
xii
ieb
iiii
xii
x
i
EMSE
E
xF
E
xdFbg
ψxy
φ
φβψ
ψxy
βx

Parametric Bootstrap
8
*,
1
11
**
2*,
*,
*,
*,
*,
,1
,1
22
1
ˆ :one Level
)ˆ(
samplefor predicted ˆ
samplefor true
seed random
),ˆ( :generatorData
)ˆ,ˆ,ˆ,ˆ(ˆ :sample Original
ki
B
kii
kikiki
ki
ki
k
k
eb
B
k
k
r
rDG
ψ
φβψ

9
Double Bootstrap Estimation
**,,
11
12
11
***
**,
*,,
*,
**,
*,
**,,
1
12,
*
,,2*
2
,11
21
2
2ˆ
2ˆ
ˆ
sample one-levelfor estimate is ˆ
),ˆ( samples two-level generateeach,For
),ˆ( samples one-level Generate
tki
B
t
B
kii
kikikikiki
kitki
B
tki
k
tkk
k
BB
iasB
BiasB
k
rDGB
rDGB
ψ
ψ
ψ

10
Fast Double Bootstrap
*****,
****,
**1,,
1
11
***
*,
**1,,
2ˆ
:)(ˆ
each for one Generate
bias of est.an is
(2007)Kinnon Mac andDavidson
1
iiCi
iikiki
B
k
kk
kiki
BiasB

11
Telescoping Double Bootstrap
)2()1(
)()1(ˆ
),( uses sample twoLevel
),ˆ( uses sample one Level
**,
*,
1
1
11
**,
*1,
*,
1
1
11
**,
1,1*
,1
1
1
kiki
B
k
kikiki
B
kTi
kk
k
B
B
rDG
rDG
ψ
ψ

12
CEAP Simulation Model
)(),(
,, all of ind. ),0(~
),(~
),( Binomial~
)exp(1
)exp(),g(x
observed ),(,),(
2
2
10
10ij
xdFbxg
jtixNIb
NIx
bxgy
bx
bxb
xyebxgy
xii
x
i
tjbi
xiij
iijij
iij
iiji
ijijijiijij

13
Alternative Specifications for x
Some external information
Area means known
Estimated random means
No external information
Area means fixed
Area means random

14
Simulation Parameters
)36.0,16.0,25.0(),,(
)0.1,8.0,0.0(),,(
)exp(1
)exp(),(
),(}|{ bernoulli
each 12)40,10,2( areas; 36
222
10
10
10
b
x
ijixij
iij
iijiij
iijijijij
i
x
bx
bxbxg
bxgxyEy
n

15
Estimation and Prediction
}ˆ),~,,(|{ˆ
),,( and ),(for REML 222
ψxy
β
xiiiii
xb
E

16
KnownMSE tionMSE/PredicPrediction xiμ
Size
2 1.76 1.43 1.16
10 1.20 1.12 1.05
40 1.09 1.04 1.02
xi
xi
~ No
Fixed
xi
xi
~ No
Random
xi
xi
~
Random

17
)1,100(),( Samples, 400 21 BBMC
(%), MSE Prediction ofEstimator Bootstrap
2 Rel Bias -14.6 -9.4 -9.4
Rel Sd 38.9 45.1 44.7
10 Rel Bias -13.2 -6.8 -6.8
Rel Sd 30.7 36.5 35.9
40 Rel Bias -7.5 -1.9 -1.9
Rel Sd 20.1 23.3 25.1
***** ˆˆˆ Size CT xixi ~ Observed , Random

Equal Efficiency Bootstrap Samples
Random , Observed
18
Bootstrap Level One TotalTelescoping (100, 1) 100 200Classic (100, 1) 150 300Classic (44, 50) 44
2244

Summary
Fast double bootstrap improves bootstrap efficiency
Double bootstrap reduces bias (about 50%)
Double bootstrap increases variance (15 to 30 %)
Random x model has potential to reduce MSE
19

Future Work
Confidence Intervals
Triple Bootstrap
Regression with Bootstrap
Nonparametric Bootstrap
Predictions for CEAP
20

Thank You
21
Recommended