RESEARCH ARTICLE
Small-Animal Single-Photon Emission Computed
Tomographic Imaging of the Brain Serotoninergic Systems
in Wild-Type and Mdr1a Knockout Rats
Noe Dumas, Marcelle Moulin-Sallanon, Nathalie Ginovart, Benjamin B. Tournier, Peggy Suzanne, Thomas Cailly,Frederic Fabis, Sylvain Rault, Yves Charnay, and Philippe Millet
Abstract
The pharmacokinetic properties of radiotracers are crucial for successful in vivo single-photon emission computed tomographic
(SPECT) imaging. Our goal was to determine if MDR1A-deficient animals could allow better SPECT imaging outcomes than wild-type
(WT) animals for a selection of serotoninergic radioligands. Thus, we compared the performances of 123I-p-MPPI, 123I-R91150, 123I-
SB207710, and 123I-ADAM radioligands, for imaging of their respective targets (5-hydroxytryptamine [5-HT]1A, 5-HT2A, 5-HT4, and
serotonin transporter [SERT]), in WT and Mdr1a knockout (KO) rats. With 123I-SB207710, virtually no SPECT signal was recorded in
the brain of WT or KO animals. For 123I-p-MPPI, low nondisplaceable binding potentials (BPND, mean 6 SD) were observed in WT (0.49
6 0.25) and KO (0.89 6 0.52) animals. For 123I-ADAM, modest imaging contrast was observed in WT (1.27 6 0.02) and KO (1.31 6 0.09)
animals. For 123I-R91150, the BPND were significantly higher in Mdr1a KO (3.98 6 0.65) animals compared to WT animals (1.22 6 0.26).
The pharmacokinetics of 123I-SB207710 and 123I-p-MPPI do not make them ideal tracers for preclinical SPECT neuroimaging. 123I-
ADAM showed adequate brain uptake regardless of Mdr1a expression and appeared suitable for preclinical SPECT neuroimaging in
both animal strains. The use of Mdr1a KO animals significantly improved the brain penetration of 123I-R91150, making this animal
strain an interesting option when considering SPECT neuroimaging of 5-HT2A receptors in rat.
I N THE PAST DECADE, intense research efforts have
been dedicated to the development of imaging systems
that meet the requirements of small-animal imaging in
terms of spatial resolution and detection sensitivity. These
efforts have led to the invention of multipinhole collimation
and advanced image reconstruction algorithms, enabling
the recording of submillimeter resolution single-photon
emission computed tomographic (SPECT) images in rats
and mice (see Nuyts and colleagues1 for a review on
multipinhole SPECT).
In the field of neuropsychiatry, conventional SPECT
has been used in humans to perform quantitative
measurement of brain neuroreceptor availability in vivo,
making this technique valuable for the study of neuro-
psychiatric disorders such as depression,2 schizophrenia,3
and feeding disorders.4 However, despite this demon-
strated potential in humans, the use of SPECT in
combination with animal models of neuropsychiatric
diseases has barely been investigated. The rarity of efficient
SPECT tracers for neuroreceptors is partly explaining this
situation, and this paucity in tracers is in turn partly due to
the stringency of the requirements on tracer pharmacoki-
netics for successful SPECT imaging.
The MDR1A transporters (also called P-glycoprotein or
Pgp) are members of the ABC transporter superfamily5 and
are known to influence the kinetics of many pharmaceu-
ticals,6 notably by preventing them from crossing the blood-
brain barrier, making them a potentially interesting target
for the modulation of the pharmacokinetics of SPECT
From the Clinical Neurophysiology and Neuroimaging Unit, Division of
Neuropsychiatry, Department of Psychiatry, University Hospitals of
Geneva, Switzerland; INSERM, Unit 1039, J. Fourier University, La
Tronche, France; Department of Psychiatry, University of Geneva,
Switzerland; Normandie Universite, France; Universite de Caen Basse-
Normandie, CERMN (EA 4258 - FR CNRS 3038 INC3M - SF 4206
ICORE) UFR des Sciences Pharmaceutiques, Bd Becquerel, F-14032
Caen, France; Morphology Unit, Division of Neuropsychiatry, Division of
Neuropsychiatry, Department of Psychiatry, University Hospitals of
Geneva, Switzerland.
Address reprint requests to: Philippe Millet, PhD, Service de Neuropsychiatrie
Unite de Neurophysiologie Clinique et Neuro-imagerie, Hopitaux
Universitaires de Geneve, Belle-Idee Chemin du Petit-Bel-Air, 2 Chene-
Bourg 1225, Geneva, Switzerland; e-mail: [email protected].
DOI 10.2310/7290.2013.00072
# 2014 Decker Publishing
Molecular Imaging, Vol 13, 2014. 1

tracers. A variety of pharmacologic inhibitors have been
developed to achieve the blockade of MDR1A transporters7;
however, in preclinical research, the use of knockout (KO)
animals is also an interesting option because it offers the
advantage of being a stable modification of the system,
which is more convenient than a transient blockade of
transporters by competitive inhibitors, when willing to
study the pharmacokinetics of tracers.
Existing neuroreceptor SPECT tracers of the serotonin-
ergic systems allow imaging in small animals with varying
degrees of success (see Paterson and colleagues for a
review8). Our efforts have been focused on the tracers
described hereafter. 123I-p-MPPI has shown some poten-
tial as a 5-hydroxytryptamine1A receptor (5-HT1AR)
tracer in in vitro and ex vivo studies in rodents9 as well
as in vivo in monkeys.10 The 5-HT1AR has, for example,
been shown to participate in the regulation of feeding
behavior11 or in depression.12 123I-R91150 is a selective 5-
HT2AR ligand and has been successfully used for SPECT
in the clinic.13 The 5-HT2AR is notably thought to play a
role in schizophrenia.14 123I-SB207710 has shown some
potential as a 5-HT4R tracer in vitro and ex vivo in
rodents as well as in vivo in nonhuman primates.15 The 5-
HT4R has been involved, for example, in cognitive
functions such as learning and memory.16 123I-ADAM is
a selective serotonin transporter (SERT) ligand17 and has
been successfully used in human SPECT studies.2 The
SERT is most notably known for its involvement in
depression.18
The main goal of this study was to compare the
performances of this selection of serotoninergic radio-
tracers in both wild-type (WT) and Mdr1a KO rats, to
determine if the use of this genetically modified animal
strain, with a more permissive blood-brain barrier, could
result in improved SPECT imaging outcomes for certain
tracers. Preliminary evaluations by ex vivo autoradiogra-
phy were performed to obtain reference images for the in
vivo SPECT images. The SPECT data obtained in WT
and KO animals were compared by means of binding
potentials. Additionally, modelization of the pharmacoki-
netics of 123I-R91150 using the Simplified Reference Tissue
Model (SRTM)19 was performed to provide insight into
the effects of MDR1A on this tracer’s kinetics.
Material and Methods
We followed the guidelines proposed by Stout and
colleagues20 to provide a detailed description of the
methods used in this work.
Animals
Male Sprague Dawley Mdr1a KO rats (SD-Abcba1tm1sage)21
and WT controls of the same background weighing 300 to
350 g were obtained from Sigma Advance Genetic
Engineering Labs (St. Louis, MO). Animals were housed
in groups, with a 12 hours light/12 hours dark cycle, with
water and food ad libitum. All animal experiments were
approved by the Swiss Cantonal Veterinary Office. The size
of the cohorts for the SPECT experiments can be seen in
Table 1. The ex vivo autoradiographic experiments were
performed on one subject per tracer. During SPECT scans,
the body temperature and respiration rate were monitored.
The body temperature was maintained at 37 6 1uC with a
thermostatically controlled heating blanket.
Chemicals
123I radioiodide was purchased from GE Healthcare
(Eindhoven, the Netherlands). SB207710 trimethyltin pre-
cursor and p-MPPI tributyltin precursor were obtained from
Eras Labo (Grenoble, France). ADAM tributyltin precursor
was obtained from Syntheval (Caen, France). R91150
precursor was synthesized by introducing 1-[3-(4-fluorophe-
noxy)propyl]-4-methylpiperidin-4-amine (0.40 g, 15 mmol),22
dichloromethane (8 mL), 4-amino-2-methoxybenzoic acid
(0.40 g, 18 mmol), 1-hydroxybenzotriazole (0.24 g, 15 mmol),
and 3-(ethyliminomethyleneamino)-N,N-dimethylpropan-1-
amine hydrochloride (0.34 g, 15 mmol) in a round-bottomed
flask. The mixture was cooled to 0uC, and triethylamine
(0.76 mL, 54 mmol) was added dropwise. The mixture was
Table 1. BPND at Equilibrium in Wild-Type and Knockout
Animals*
WT BPND Mdr1a KO BPND
Mean 6 SD n Mean 6 SD n
p
Value
123I-p-MPPI 0.493 6 0.253 4 0.887 6 0.524 4 .224123I-R91150 1.221 6 0.261 4 3.981 6 0.648 4 , .002123I-SB207710 0.087 6 0.032 3 0.111 6 0.055 2 .568123I-ADAM 1.271 6 0.018 4 1.311 6 0.085 4 .393
BPND 5 nondisplaceable binding potential; KO 5 knockout; WT 5 wild
type.
*Determined as the ratio of mean activity in a tracer-relevant, receptor-rich
region over the mean activity in the tracer-poor cerebellum region, minus 1.
The target-rich regions, tracer and target wise, were 123I-p-MPPI/5-HT1AR,
hippocampus; 123I-R91150/5-HT2AR, orbitofrontal cortex; 123I-SB207710/
5-HT4R, olfactory tubercles; 123I-ADAM/SERT, midbrain; p value from an
unpaired t-test.
2 Dumas et al
allowed to reach room temperature, stirred overnight, washed
with water (3 3 20 mL), washed with brine (3 3 20 mL), dried
over MgSO4, and evaporated. The crude was then purified by
column chromatography using AcOEt/MeOH/NEt3 (99/1/1)
as the eluant to afford 4-amino-N-{1-[3-(4-fluorophenoxy)
propyl]piperidin-4-yl}-2-methoxybenzamide22 (R91150 pre-
cursor) with 40% yield and to conform to analytical standards.
All other chemicals were purchased from Sigma-Aldrich
(Buchs, Switzerland), with the highest purity available, and
were used without any further purification.
Radiotracer Preparation
All radiotracers were obtained by incubation of the
specified reaction mixtures (see below) for 20 minutes at
room temperature. Purification was conducted directly
from the reaction mixture on a high-performance liquid
chromatography (HPLC) system (Knauer GmbH, Berlin,
Germany) with a reversed-phase column (Bondclone C18
10 mm 300 3 7.8 mm, Phenomenex, Schlieren,
Switzerland) and eluted with the specified mobile phase
(see below) at a flow rate of 3 mL/min. Fractions
containing the radiolabeled compound of interest were
collected and concentrated using a rotary evaporator, and
the final product was diluted in saline prior to animal
administration. During the HPLC run, ultraviolet absor-
bance and radioactivity were monitored, allowing for the
measurement of specific activity thanks to calibration
curves established with the cold reference compound.
Specific activities of preparations were always above 20%
of 123I carrier-free specific activity (ie, above 1,760 MBq/nmol).
Radiochemical purities, assessed by HPLC, were above 98%.
123I-p-MPPI
Fifty micrograms of p-MPPI precursor in 50 mL ethanol was
mixed with 50 mL of HCl 1 M, 15 mL of carrier-free 123I
sodium iodide (10 mCi) in 0.05 M NaOH, and 50 mL of 3%
H2O2. Purification was achieved by HPLC with a 10-minute
gradient of 30 to 60% acetonitrile (ACN) in water with
7 mM H3PO4. Radiotracer retention time was 8.8 minutes.
123I-R91150
Three hundred micrograms of R91150 precursor in 3 mL
ethanol was mixed with 3 mL of glacial acetic acid, 15 mL of
carrier-free 123I sodium iodide (10 mCi) in 0.05 M NaOH,
and 3 mL of 30% H2O2. 123I-R91150 was isolated by an
isocratic HPLC run (ACN/water 50/50, 10 mM acetic acid
buffer pH 5). The radiotracer retention time was 11.0
minutes.
123I-SB207710
Fifty micrograms of trimethyl stannyl precursor in 50 mL
ethanol was mixed with 50 mL of 1 M HCl, 15 mL of
carrier-free 123I sodium iodide (10 mCi) in 0.05 M NaOH,
and 50 mL of 3% H2O2. 123I-SB207710 was isolated by
isocratic HPLC (ACN/water 30/70, 7 mM H3PO4). The
retention time of 123I-SB207710 was 9.3 minutes.
123I-ADAM
Fifty micrograms of ADAM precursor in 5 mL ethanol was
mixed with 5 mL of 1 M HCl, 15 mL of carrier-free 123I
sodium iodide (10 mCi) in 0.05 M NaOH, and 5 mL of
30% H2O2. 123I-ADAM was isolated by an isocratic HPLC
run (ACN/water 60/40, 10 mM acetic acid buffer pH 5).
The retention time was 12 minutes.
Dynamic SPECT Imaging
While maintained under isoflurane anesthesia (1.8–2.5%)
with pure oxygen and installed in a U-SPECT-II imaging
system (MILabs, Utrecht, the Netherlands), the animals
received a bolus injection in the tail vein with 55 MBq of123I-labeled radiotracer in 0.6 mL saline. The imaging
system was fitted with a general purpose rat and mouse
collimator (GP-RM, 75 pinholes of 1.5 mm diameter). The
scan volume was kept to the minimum around the skull,
and image frames of a length of 1 minute were acquired.
Additionally, a phantom consisting of a 2 mL plastic tube
containing a known activity concentration was scanned
under the same conditions for the purpose of activity
calibration. SPECT tomograms were reconstructed with a
pixel ordered subsets expectation maximization algo-
rithm23 (P-OSEM, 0.4 mm voxels, 4 iterations, 6 subsets)
using MILabs proprietary software and finally smoothed
with a gaussian filter of 0.8 mm full width half maximum.
SPECT data were corrected for radioactive decay; no
correction of attenuation and scatter was applied.
Data Coregistration and Analysis
SPECT data were analyzed with PMOD software (PMOD
Technologies, Zurich, Switzerland). SPECT data were
manually coregistered to a region of interest (ROI)
template for the rat brain (atlas provided in PMOD: ‘‘Px
Rat (W. Schiffer)’’24) (Figure 1). The mean activity in each
Mdr1a KO Rats for 5-HT Receptor SPECT 3

ROI was calculated for each frame to obtain time-activity
curves. Left and right ROI of paired structures were
considered as a whole, and the subregions of hippocampus
and cerebellum were pooled: hereafter, hippocampus ROI
refers to the combination of the template’s anterior and
posterior hippocampus ROI and cerebellum ROI refers to
the combination of the gray and white matter cerebellum
ROI. As a means of evaluating the imaging ability of tracers
and to compare their performance in WT and KO animals,
an estimate of the nondisplaceable binding potential
(BPND)25 was obtained by calculating the value of the
specific uptake ratio (SUR) during pseudoequilibrium. SUR
is the ratio between the mean activity in a tracer-relevant
receptor-rich region and in the tracer-poor cerebellum
region, minus 1. The pseudoequilibrium interval was
defined as the period during which SUR values remained
stable, as described by Catafau and colleagues.26 The target-
rich regions, tracer and target wise, were 123I-p-MPPI/5-
HT1AR, hippocampus; 123I-R91150/5-HT2AR, orbitofrontal
cortex; 123I-SB207710/5-HT4R, olfactory tubercles; and 123I-
ADAM/SERT, midbrain.
123I-R91150 Pharmacokinetics Analysis
In the case of 123I-R91150, pharmacokinetic parameters
were calculated from time-activity curves using the
SRTM19 in PMOD software, with cerebellum as a re-
ference region. The SRTM relies on three parameters: R1
is the relative delivery to ROI compartments versus
reference region (R1 5 K1/K19), k2 is the efflux constant
from brain to plasma, and BPND SRTM is the non-
displaceable binding potential derived from the SRTM
(BPND SRTM 5 k3/k4).
Ex Vivo Autoradiography
WT rats were anesthetized with isoflurane, injected in the
tail vein with < 10 MBq of radiotracer and sacrificed
by decapitation after 30 minutes for 123I-SB207710 and123I-p-MPPI and after 60 minutes for 123I-R91150 and
123I-ADAM. The choice of the time points was based on
preliminary experiments conducted at 30 and 60 minutes
postinjection. The brains were quickly removed and frozen
in precooled isopentane at 220uC. Twenty micrometer
thick coronal sections were collected with a cryomicro-
tome (Leica) at 220uC. The sections were mounted on
glass slides, air-dried at room temperature, and exposed to
phosphor imaging plates overnight (Fuji Photo Film Co.,
Tokyo, Japan). Finally, the plates were scanned with a Fuji
Bio-Imaging Analyzer BAS 1800II scanner (Fuji Photo
Film Co.), at 50 mm resolution, to obtain the ex vivo
autoradiograms. Image quantification was performed
using ImageJ software (National Institutes of Health,
Bethesda, MD) to obtain ex vivo SURs, which were
calculated as the ratio between a target region and the
tracer-poor cerebellum region, minus 1.
Results
When evaluated by ex vivo autoradiography in WT rats
(Figure 2D), 123I-p-MPPI showed marked uptake (ex
vivo SUR at 30 minutes postinjection) in hippocampus
(0.43) and septum (0.37) and more modest uptake in
amygdala (0.29), cortex (0.14), and hypothalamus (0.17).
Meanwhile, cerebellum was showing a low level of tracer
uptake. When evaluated in vivo, the time-averaged SPECT
images obtained with 123I-p-MPPI showed a slightly
superior imaging contrast in Mdr1a KO animals (Figure
2C) in comparison with WT animals (Figure 2B), as
evidenced by the BPND calculated in hippocampus versus
cerebellum (see Table 1), which was very small in WT
animals (0.49 6 0.25, mean 6 SD) and was higher but not
significantly different in KO animals (0.89 6 0.52, mean 6
SD, p 5 .224). The regional time-activity curves (Figure
2E) showed that the tracer brain uptake was approximately
doubled in KO rats; however, the clearance from the brain
remained fast in KO, and, as a result, activity levels in the
5-HT1AR-rich hippocampus region reached the levels
observed in the 5-HT1AR-poor cerebellum region within
an hour.
Figure 1. Sectional views of Schifferand colleagues’ rat brain region ofinterest atlas24 with a reference MRItemplate.
4 Dumas et al

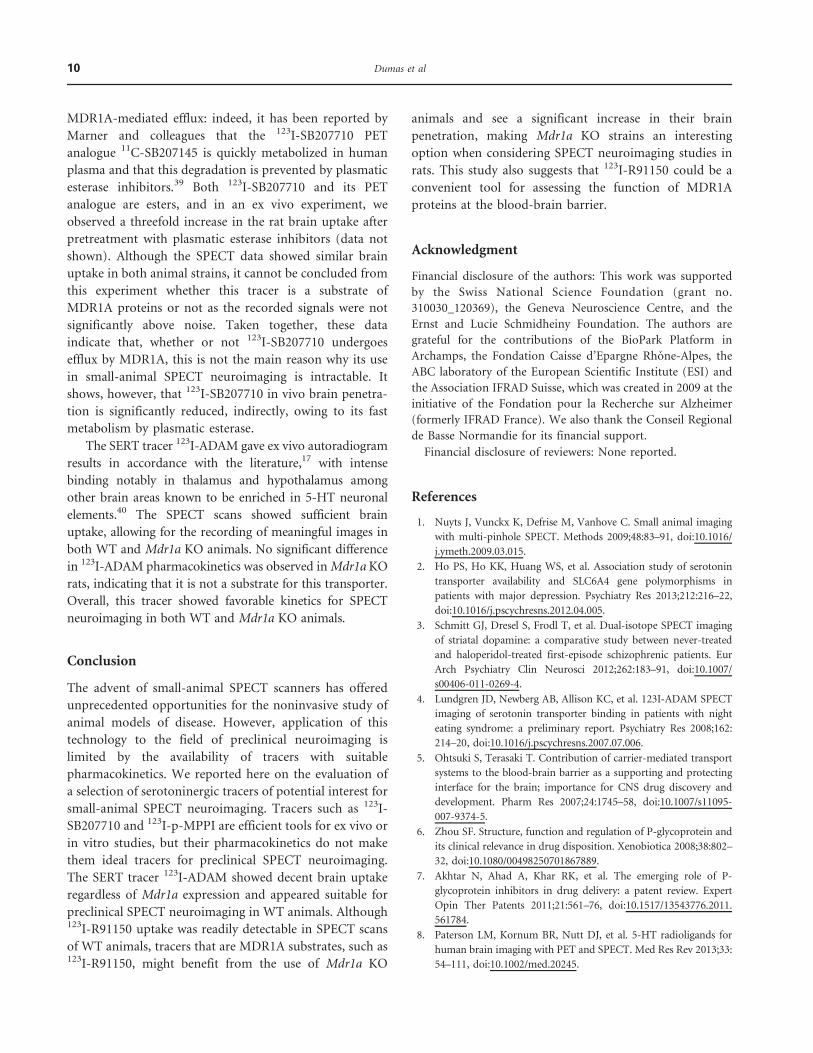
When evaluated by ex vivo autoradiography in WT rats
(Figure 3D), 123I-R91150 showed highest uptake (ex vivo
SUR at time 60 minutes postinjection) in frontal regions
such as orbitofrontal cortex (0.70) and more moderate
uptake in the rest of the cortex (0.52), midbrain (0.44),
and hypothalamus (0.36). Meanwhile, cerebellum was
showing a very low level of tracer uptake. When evaluated
by in vivo imaging in WT rats, SPECT images showed low
uptake of 123I-R91150 in brain and relatively higher uptake
in the pituitary gland and harderian glands (Figure 3B). In
KO animals, however, SPECT images showed a marked
uptake in frontal regions and the rest of the cortex and
relatively lower uptake in cerebellum (Figure 3C). The
time-activity curves showed marked differences in tracer
kinetics between KO and WT animals, with an approxi-
mately threefold increase in tracer uptake in the orbito-
frontal cortex region of KO rats (Figure 3E). The BPND
calculated for 123I-R91150 in the orbitofrontal cortex
region versus cerebellum (see Table 1) was modest in WT
animals (1.22 6 0.26, mean 6 SD) and was significantly
higher in Mdr1a KO animals (3.98 6 0.65, mean 6 SD,
p , .002) animals. The effect of MDR1A proteins on 123I-
R91150 kinetics was also apparent in the variation of
SRTM parameters derived for the orbitofrontal cortex
region with cerebellum as reference, as Table 2 also shows
an increase in BPND SRTM by a factor of around 3 in KO
compared to WT animals. However, no significant
variations were observed between the two animal strains
in brain efflux rates (k2) or target versus reference delivery
rates (R1). Fitting other ROIs using SRTM also revealed
markedly higher BPND SRTM in other frontal regions of
KO rats, such as medial prefrontal cortex and frontal
cortex (Figure 4). However, the BPND SRTM observed in
the hypothalamus and entorhinal cortex regions was higher
in WT rats compared to KO animals. Overall, the in vivo123I-R91150 SPECT data from KO rats (see Figure 3C)
visually correlated well with ex vivo autoradiograms (see
Figure 3D), whereas SPECT images in WT rats were
dwarfed by activity accumulation in the harderian glands
and in the pituitary gland (see Figure 3B).
Figure 2. 123I-p-MPPI brain distribution study. Anatomic atlas templates adapted from the Paxinos and Watson atlas41 (A), time-averaged imagesof representative SPECT scans between 15 and 35 minutes after tracer injection in wild-type (WT) (B) and Mdr1a knockout (KO) rats (C), ex vivoautoradiograms obtained 30 minutes after tracer injection in WT rats (D), and regional time-activity curves measured by SPECT after tracerinjection (E). Color scales are relative and relevant to individual experiments. Acb 5 accumbens nucleus; Am 5 amgydala; BS 5 brainstem;Cb 5 cerebellum; Cx 5 cortex; HG 5 harderian gland; Hip 5 hippocampus; Hyp 5 hypothalamus; MB 5 midbrain; OFC 5 orbitofrontal cortex;Pit 5 pituitary gland; Spt 5 septum; Thal 5 thalamus.
Mdr1a KO Rats for 5-HT Receptor SPECT 5

When evaluated by ex vivo autoradiography in WT
rats (Figure 5D), 123I-SB207710 accumulated markedly
(ex vivo SUR at time 30 minutes postinjection) in the
olfactory tubercles (1.48) and globus pallidus (1.13) and
to a lesser extent in the hypothalamus (0.75), accumbens
nucleus (1.14), caudate putamen (0.78), and hippocam-
pus (0.58). Meanwhile, cerebellum showed a very low
level of tracer uptake. After injection of 123I-SB207710,
virtually no specific SPECT signal was detected in vivo
in the brain of either WT (Figure 5B) or Mdr1a KO
animals (Figure 5C). In Table 1, the BPND calculated
from mean activity in the olfactory tubercle region versus
cerebellum was negligible in WT animals (0.09 6 0.03,
mean 6 SD) and not significantly different from that
observed in Mdr1a KO animals (0.11 6 0.06, mean 6 SD,
p 5 .568). Moreover, the time-activity curves of any
ROI were practically indistinguishable from each other
(Figure 5E).
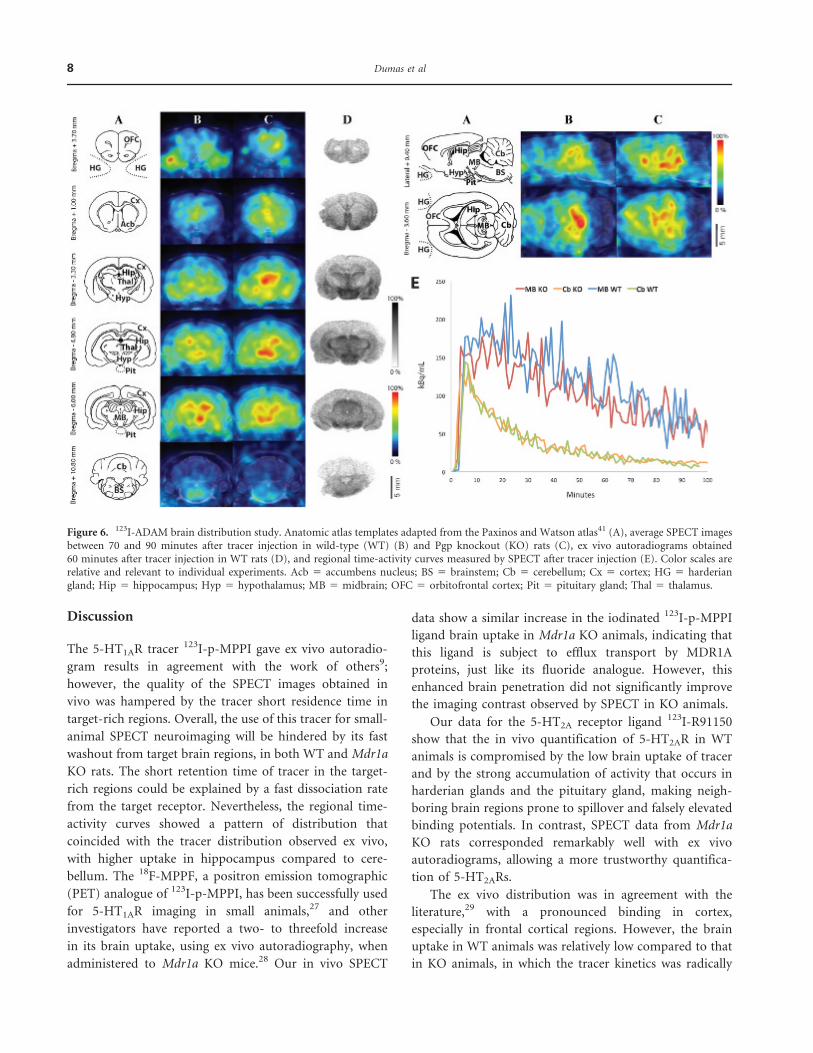
When evaluated by ex vivo autoradiography in WT
rats (Figure 6D), 123I-ADAM showed marked uptake
(ex vivo SUR at 60 minutes postinjection) in hypothala-
mus (0.88) and midbrain (0.93) and a slightly dimmer
uptake in numerous other regions, including olfactory
tubercles (0.76), septum (0.78), thalamus (0.72), hippo-
campus (0.52), globus pallidus (0.81), and pons (0.71).
Meanwhile, cerebellum was showing a very low level of
tracer uptake. When evaluated by in vivo imaging, time-
averaged 123I-ADAM SPECT images showed significant
Figure 3. 123I-R91150 brain distribution study. Anatomic atlas templates adapted from the Paxinos and Watson atlas41 (A), average SPECT imagesbetween 100 and 120 minutes after tracer injection in wild-type (WT) (B) and Mdr1a knockout (KO) rats (C), ex vivo autoradiograms obtained 60minutes after tracer injection in WT rats (D), and regional time-activity curves measured by SPECT after tracer injection (E). Color scales arerelative and relevant to individual experiments. Acb 5 accumbens nucleus; Am 5 amgydala; BS 5 brainstem; Cb 5 cerebellum; Cx 5 cortex;HG 5 harderian glands; Hip 5 hippocampus; Hyp 5 hypothalamus; MB 5 midbrain; OFC 5 orbitofrontal cortex; Pit 5 pituitary gland;Spt 5 septum; Thal 5 thalamus.
Table 2. 123I-R91150 SRTM Parameters Obtained in
Orbitofrontal Cortex with Cerebellum as a Reference Region
WT (n 4) Mdr1a KO (n 5 4)
Mean 6 SD Mean 6 SD p Value
R1 0.487 6 0.033 0.525 6 0.064 .332
k2 (min–1) 0.046 6 0.003 0.042 6 0.003 .108
BPND SRTM 0.959 6 0.039 2.656 6 0.234 , .001
BPND 5 nondisplaceable binding potential; KO 5 knockout; SRTM 5
Simplified Reference Tissue Model; WT 5 wild type.
p Value from an unpaired t-test.
6 Dumas et al

brain uptake with similar levels in both WT (Figure 6B)
and KO animals (Figure 6C) and exhibited preferential
uptakes in hypothalamus and midbrain and lower uptake
in cerebellum, which is in accordance with the ex vivo
autoradiograms (see Figure 6D). The BPND calculated
from mean activity in the midbrain ROI versus cerebellum
(see Table 1) was moderate in WT animals (1.27 6 0.02,
mean 6 SD) and not significantly different from that
observed in Mdr1a KO animals (1.31 6 0.09, mean 6 SD,
p 5 .393). The regional time-activity curves (Figure 6E)
showed no clear difference in the kinetics of 123I-ADAM
between the two animal strains.
Figure 5. 123I-SB207710 brain distribution study. Anatomic atlas templates adapted from the Paxinos and Watson atlas41 (A), average SPECTimages between 30 and 60 minutes after tracer injection in wild-type (WT) (B) and Mdr1a knockout (KO) (C) rats, ex vivo autoradiogramsobtained 30 minutes after tracer injection in WT rats (D), and regional time-activity curves measured by SPECT after tracer injection (E). Colorscales are relative and relevant to individual experiments. Acb 5 accumbens nucleus; BS 5 brainstem; Cb 5 cerebellum; CPu 5 caudate putamen;Cx 5 cortex; GP 5 globus pallidus; HG 5 harderian gland; Hip 5 hippocampus; Hyp 5 hypothalamus; MB 5 midbrain; OFC 5 orbitofrontalcortex; Pit 5 pituitary gland; Thal 5 thalamus; Tu 5 olfactory tubercles.
Figure 4. 123I-R91150 nondisplace-able BP (mean 6 SD) observed byfitting the Simplified Reference TissueModel (SRTM) to time-activity curvesextracted from WT (n 5 4) and KO (n5 4) regions of interest adapted fromSchiffer and colleagues’ ROI tem-plate.24 Acb 5 accumbens nucleus;BPND 5 nondisplaceable bindingpotential; CgC 5 cingulate cortex;CPu 5 caudate putamen; EC 5
entorhinal cortex; FC 5 frontal cor-tex; Hip 5 hippocampus; Hyp 5
hypothalamus; MC 5 motor cortex;MPFC 5 medial prefrontal cortex;OFC 5 orbitofrontal cortex; SC 5
somatosensory cortex; Spt 5 septum;Thal 5 thalamus; Tu 5 olfactorytubercles.
Mdr1a KO Rats for 5-HT Receptor SPECT 7
Discussion
The 5-HT1AR tracer 123I-p-MPPI gave ex vivo autoradio-
gram results in agreement with the work of others9;
however, the quality of the SPECT images obtained in
vivo was hampered by the tracer short residence time in
target-rich regions. Overall, the use of this tracer for small-
animal SPECT neuroimaging will be hindered by its fast
washout from target brain regions, in both WT and Mdr1a
KO rats. The short retention time of tracer in the target-
rich regions could be explained by a fast dissociation rate
from the target receptor. Nevertheless, the regional time-
activity curves showed a pattern of distribution that
coincided with the tracer distribution observed ex vivo,
with higher uptake in hippocampus compared to cere-
bellum. The 18F-MPPF, a positron emission tomographic
(PET) analogue of 123I-p-MPPI, has been successfully used
for 5-HT1AR imaging in small animals,27 and other
investigators have reported a two- to threefold increase
in its brain uptake, using ex vivo autoradiography, when
administered to Mdr1a KO mice.28 Our in vivo SPECT
data show a similar increase in the iodinated 123I-p-MPPI
ligand brain uptake in Mdr1a KO animals, indicating that
this ligand is subject to efflux transport by MDR1A
proteins, just like its fluoride analogue. However, this
enhanced brain penetration did not significantly improve
the imaging contrast observed by SPECT in KO animals.
Our data for the 5-HT2A receptor ligand 123I-R91150
show that the in vivo quantification of 5-HT2AR in WT
animals is compromised by the low brain uptake of tracer
and by the strong accumulation of activity that occurs in
harderian glands and the pituitary gland, making neigh-
boring brain regions prone to spillover and falsely elevated
binding potentials. In contrast, SPECT data from Mdr1a
KO rats corresponded remarkably well with ex vivo
autoradiograms, allowing a more trustworthy quantifica-
tion of 5-HT2ARs.
The ex vivo distribution was in agreement with the
literature,29 with a pronounced binding in cortex,
especially in frontal cortical regions. However, the brain
uptake in WT animals was relatively low compared to that
in KO animals, in which the tracer kinetics was radically
Figure 6. 123I-ADAM brain distribution study. Anatomic atlas templates adapted from the Paxinos and Watson atlas41 (A), average SPECT imagesbetween 70 and 90 minutes after tracer injection in wild-type (WT) (B) and Pgp knockout (KO) rats (C), ex vivo autoradiograms obtained60 minutes after tracer injection in WT rats (D), and regional time-activity curves measured by SPECT after tracer injection (E). Color scales arerelative and relevant to individual experiments. Acb 5 accumbens nucleus; BS 5 brainstem; Cb 5 cerebellum; Cx 5 cortex; HG 5 harderiangland; Hip 5 hippocampus; Hyp 5 hypothalamus; MB 5 midbrain; OFC 5 orbitofrontal cortex; Pit 5 pituitary gland; Thal 5 thalamus.
8 Dumas et al

modified with an approximately threefold increase in brain
uptake. As a result, the correlation between the tracer
distributions observed by SPECT versus ex vivo auto-
radiography was higher in KO animals compared to WT
animals (determination coefficient R2 5 .9 in KO versus
R2 5 .2 in WT animals).
However, the comparison of pharmacokinetic para-
meters derived for 123I-R91150 using SRTM in both WT
and Mdr1a KO rats surprisingly showed no significant
variation in the tracer efflux rate from brain tissue (k2):
indeed, given the function of the MDR1A proteins,
consisting in transporting substrates outside from brain
tissue, a decrease in k2 value in KO animals could have
been expected. Other studies have suggested that MDR1A
proteins have the ability to extrude substrates directly from
the plasma membrane,30 thus effectively interfering
simultaneously with both tissue uptake rate (K1) and
tissue efflux rate (k2). Moreover, the time scale on which
the efflux transport occurs at the molecular level is much
more rapid than the time resolution of the SPECT
acquisition,31 making it impossible to completely distin-
guish between a decrease in k2 and an increase in K1, due,
for instance, to MDR1A inhibition or loss of function.
Thus, it is plausible that MDR1A absence predominantly
induces an increase in K1 and would explain why no
significant alteration in k2 is detected when comparing KO
and WT animals. However, the SRTM only allows access
to the ratio of delivery rates in target ROI over reference
region (R1). In our case, we observed no change in the
value of R1, indicating that delivery rates in both target
and reference regions were affected in a proportional way
by MDR1A. This observation is in agreement with the
work of Seegers and colleagues,32 which showed that
MDR1A is expressed at comparable levels in frontal cortex
and cerebellum. Nevertheless, the time-activity curves
clearly showed higher tracer uptake in both cerebellum
and orbitofrontal cortex of KO animals, thus strongly
suggesting an increased delivery rate in the KO condition.
Further pharmacokinetic modeling experiments with
blood sampling will be needed to precisely quantify the
impact of MDR1A protein expression on tissue brain
delivery (K1). Finally, the BPND SRTM values were higher
in most ROI of Mdr1a KO compared to WT animals,
except in ROI adjacent to the harderian glands or the
pituitary gland. Indeed, in the case of WT animals, these
extracerebral organs took up a significant amount of
activity; thus, activity spillover from these glands could
explain why superior BPND SRTM were recorded in the
entorhinal cortex or hypothalamus of WT animals.
Nevertheless, these regions set apart, our data clearly show
that 123I-R91150 brain uptake is delivery limited: regional
uptake depends mostly on the crossing of the blood-brain
barrier (K1).
One other spectacular effect of the absence of MDR1A
proteins is the disappearance of signal from the harderian
glands in KO animal 123I-R91150 SPECT scans. These
glands, however, are indeed anatomically present in the
KO strain; thus, our results suggest that MDR1A proteins
are expressed in the harderian glands, where they are
responsible for a nonspecific accumulation of the tracer
and/or its radiometabolites. The presence of MDR1A
proteins in the harderian glands would not be surprising as
the Mdr1a gene is known for its widespread expression,33
and it has been reported that at least one other transporter
of the same ABC superfamily is expressed in the harderian
glands,34 where it plays a role in the excretion of
protoporphyrin metabolites.
The very clear difference in the distribution pattern of123I-R91150 between Mdr1a KO and WT animals also
suggests that this tracer might be an interesting tool to
quantify the activity of MDR1A transporters in vivo.
Indeed, 123I-R91150 has already been successfully used in
humans in a number of studies,8 and it has been reported
to undergo only little metabolization in humans26; more-
over, we reported here a significant threefold increase in
brain signal in Mdr1a KO animals, and others even
reported a fivefold increase in brain uptake with the use of
50 mg/kg cyclosporine as an MDR1A proteins inhibitor.35
According to the criteria defined by Kannan and
colleagues,30 these properties suggest that 123I-R91150
would be a suitable SPECT tracer to quantify efflux
proteins function in vivo in humans. Nowadays, the
assessment of efflux protein function is attracting growing
attention as a means to predict the response to certain
pharmacologic treatments, notably anticancer therapies,
and to study the influence of blood-brain barrier integrity
on brain physiology.36 Thus, the assessment of MDR1A
transporters function could one day be useful for clinical
practice. Currently, such studies are usually performed
with PET tracers, most frequently using [11C]-verapamil,37
but in the future, the use of a SPECT imaging alternative
might be more convenient as SPECT is a more widespread,
cheaper, and slightly less cumbersome technique than PET.
The 5-HT4R tracer 123I-SB207710 gave ex vivo auto-
radiograms in agreement with the results found in the
literature,38 showing a marked labeling of 5-HT4R-rich
regions; however, this tracer did not yield enough cerebral
signal in either WT or Mdr1a KO rats to be useful for in
vivo SPECT scans. Other evidence suggests that this
tracer brain uptake is limited by different causes than
Mdr1a KO Rats for 5-HT Receptor SPECT 9
MDR1A-mediated efflux: indeed, it has been reported by
Marner and colleagues that the 123I-SB207710 PET
analogue 11C-SB207145 is quickly metabolized in human
plasma and that this degradation is prevented by plasmatic
esterase inhibitors.39 Both 123I-SB207710 and its PET
analogue are esters, and in an ex vivo experiment, we
observed a threefold increase in the rat brain uptake after
pretreatment with plasmatic esterase inhibitors (data not
shown). Although the SPECT data showed similar brain
uptake in both animal strains, it cannot be concluded from
this experiment whether this tracer is a substrate of
MDR1A proteins or not as the recorded signals were not
significantly above noise. Taken together, these data
indicate that, whether or not 123I-SB207710 undergoes
efflux by MDR1A, this is not the main reason why its use
in small-animal SPECT neuroimaging is intractable. It
shows, however, that 123I-SB207710 in vivo brain penetra-
tion is significantly reduced, indirectly, owing to its fast
metabolism by plasmatic esterase.
The SERT tracer 123I-ADAM gave ex vivo autoradiogram
results in accordance with the literature,17 with intense
binding notably in thalamus and hypothalamus among
other brain areas known to be enriched in 5-HT neuronal
elements.40 The SPECT scans showed sufficient brain
uptake, allowing for the recording of meaningful images in
both WT and Mdr1a KO animals. No significant difference
in 123I-ADAM pharmacokinetics was observed in Mdr1a KO
rats, indicating that it is not a substrate for this transporter.
Overall, this tracer showed favorable kinetics for SPECT
neuroimaging in both WT and Mdr1a KO animals.
Conclusion
The advent of small-animal SPECT scanners has offered
unprecedented opportunities for the noninvasive study of
animal models of disease. However, application of this
technology to the field of preclinical neuroimaging is
limited by the availability of tracers with suitable
pharmacokinetics. We reported here on the evaluation of
a selection of serotoninergic tracers of potential interest for
small-animal SPECT neuroimaging. Tracers such as 123I-
SB207710 and 123I-p-MPPI are efficient tools for ex vivo or
in vitro studies, but their pharmacokinetics do not make
them ideal tracers for preclinical SPECT neuroimaging.
The SERT tracer 123I-ADAM showed decent brain uptake
regardless of Mdr1a expression and appeared suitable for
preclinical SPECT neuroimaging in WT animals. Although123I-R91150 uptake was readily detectable in SPECT scans
of WT animals, tracers that are MDR1A substrates, such as123I-R91150, might benefit from the use of Mdr1a KO
animals and see a significant increase in their brain
penetration, making Mdr1a KO strains an interesting
option when considering SPECT neuroimaging studies in
rats. This study also suggests that 123I-R91150 could be a
convenient tool for assessing the function of MDR1A
proteins at the blood-brain barrier.
Acknowledgment
Financial disclosure of the authors: This work was supported
by the Swiss National Science Foundation (grant no.
310030_120369), the Geneva Neuroscience Centre, and the
Ernst and Lucie Schmidheiny Foundation. The authors are
grateful for the contributions of the BioPark Platform in
Archamps, the Fondation Caisse d’Epargne Rhone-Alpes, the
ABC laboratory of the European Scientific Institute (ESI) and
the Association IFRAD Suisse, which was created in 2009 at the
initiative of the Fondation pour la Recherche sur Alzheimer
(formerly IFRAD France). We also thank the Conseil Regional
de Basse Normandie for its financial support.
Financial disclosure of reviewers: None reported.
References
1. Nuyts J, Vunckx K, Defrise M, Vanhove C. Small animal imaging
with multi-pinhole SPECT. Methods 2009;48:83–91, doi:10.1016/
j.ymeth.2009.03.015.
2. Ho PS, Ho KK, Huang WS, et al. Association study of serotonin
transporter availability and SLC6A4 gene polymorphisms in
patients with major depression. Psychiatry Res 2013;212:216–22,
doi:10.1016/j.pscychresns.2012.04.005.
3. Schmitt GJ, Dresel S, Frodl T, et al. Dual-isotope SPECT imaging
of striatal dopamine: a comparative study between never-treated
and haloperidol-treated first-episode schizophrenic patients. Eur
Arch Psychiatry Clin Neurosci 2012;262:183–91, doi:10.1007/
s00406-011-0269-4.
4. Lundgren JD, Newberg AB, Allison KC, et al. 123I-ADAM SPECT
imaging of serotonin transporter binding in patients with night
eating syndrome: a preliminary report. Psychiatry Res 2008;162:
214–20, doi:10.1016/j.pscychresns.2007.07.006.
5. Ohtsuki S, Terasaki T. Contribution of carrier-mediated transport
systems to the blood-brain barrier as a supporting and protecting
interface for the brain; importance for CNS drug discovery and
development. Pharm Res 2007;24:1745–58, doi:10.1007/s11095-
007-9374-5.
6. Zhou SF. Structure, function and regulation of P-glycoprotein and
its clinical relevance in drug disposition. Xenobiotica 2008;38:802–
32, doi:10.1080/00498250701867889.
7. Akhtar N, Ahad A, Khar RK, et al. The emerging role of P-
glycoprotein inhibitors in drug delivery: a patent review. Expert
Opin Ther Patents 2011;21:561–76, doi:10.1517/13543776.2011.
561784.
8. Paterson LM, Kornum BR, Nutt DJ, et al. 5-HT radioligands for
human brain imaging with PET and SPECT. Med Res Rev 2013;33:
54–111, doi:10.1002/med.20245.
10 Dumas et al
9. Kung MP, Frederick D, Mu M, et al. 4-(29-Methoxy-phenyl)-1-
[29-(n-299-pyridinyl)-p-iodobenzamido]-ethyl-piperazine ([125I]
p-MPPI) as a new selective radioligand of serotonin-1A sites
in rat brain: in vitro binding and autoradiographic studies.
J Pharmacol Exp Ther 1995;272:429–37.
10. Kung HF, Frederick D, Kim HJ, et al. In vivo SPECT imaging of 5-
HT1A receptors with [123I]p-MPPI in nonhuman primates.
Synapse 1996;24:273–81, doi:10.1002/(SICI)1098-2396(199611)24:3
,273::AID-SYN10.3.0.CO;2-Y.
11. Dill MJ, Shaw J, Cramer J, Sindelar DK. 5-HT1A receptor
antagonists reduce food intake and body weight by reducing total
meals with no conditioned taste aversion. Pharmacol Biochem
Behav 2013;112C:1–8.
12. Theodore WH, Hasler G, Giovacchini G, et al. Reduced
hippocampal 5HT1A PET receptor binding and depression in
temporal lobe epilepsy. Epilepsia 2007;48:1526–30, doi:10.1111/
j.1528-1167.2007.01089.x.
13. Busatto GF, Pilowsky LS, Costa DC, et al. Initial evaluation of
123I-5-I-R91150, a selective 5-HT2A ligand for single-photon
emission tomography, in healthy human subjects. Eur J Nucl Med
1997;24:119–24, doi:10.1007/BF02439542.
14. Erritzoe D, Rasmussen H, Kristiansen KT, et al. Cortical and
subcortical 5-HT2A receptor binding in neuroleptic-naive first-
episode schizophrenic patients. Neuropsychopharmacology 2008;
33:2435–41, doi:10.1038/sj.npp.1301656.
15. Pike VW, Halldin C, Nobuhara K, et al. Radioiodinated SB 207710
as a radioligand in vivo: imaging of brain 5-HT4 receptors with
SPET. Eur J Nucl Med Mol Imaging 2003;30:1520–8, doi:10.1007/
s00259-003-1307-x.
16. Haahr ME, Fisher P, Holst K, et al. The 5-HT4 receptor levels in
hippocampus correlates inversely with memory test performance
in humans. Hum Brain Mapp 2013;34:3066–74, doi:10.1002/
hbm.22123.
17. Choi SR, Hou C, Oya S, et al. Selective in vitro and in vivo binding
of [(125)I]ADAM to serotonin transporters in rat brain. Synapse
2000;38:403–12, doi:10.1002/1098-2396(20001215)38:4,403::AID-
SYN5.3.0.CO;2-Z.
18. Haenisch B, Bonisch H. Depression and antidepressants: insights
from knockout of dopamine, serotonin or noradrenaline re-uptake
transporters. Pharmacol Ther 2011;129:352–68, doi:10.1016/
j.pharmthera.2010.12.002.
19. Lammertsma AA, Hume SP. Simplified Reference Tissue Model
for PET receptor studies. Neuroimage 1996;4:153–8, doi:10.1006/
nimg.1996.0066.
20. Stout D, Berr SS, Leblanc A, et al. Guidance for methods
descriptions used in preclinical imaging papers. Mol Imaging 2013;
12:1–15.
21. Zamek-Gliszczynski MJ, Bedwell DW, Bao JQ, Higgins JW.
Characterization of SAGE Mdr1a (P-gp), Bcrp, and Mrp2
knockout rats using loperamide, paclitaxel, sulfasalazine, and
carboxydichlorofluorescein pharmacokinetics. Drug Metab Dispos
2012;40:1825–33, doi:10.1124/dmd.112.046508.
22. Ute M, Johannes E, Heinz HC. Synthesis, labelling and first
evaluation of [18F]R91150 as a serotonin 5-HT2A receptor
antagonist for PET. J Labelled Comp Radiopharm 2009;52:13–22,
doi:10.1002/jlcr.1565.
23. Branderhorst W, Vastenhouw B, Beekman FJ. Pixel-based subsets
for rapid multi-pinhole SPECT reconstruction. Phys Med Biol
2010;55:2023–34, doi:10.1088/0031-9155/55/7/015.
24. Schiffer WK, Mirrione MM, Biegon A, et al. Serial microPET
measures of the metabolic reaction to a microdialysis probe
implant. J Neurosci Methods 2006;155:272–84, doi:10.1016/
j.jneumeth.2006.01.027.
25. Innis RB, Cunningham VJ, Delforge J, et al. Consensus
nomenclature for in vivo imaging of reversibly binding radi-
oligands. J Cereb Blood Flow Metab 2007;27:1533–9, doi:10.1038/
sj.jcbfm.9600493.
26. Catafau AM, Danus M, Bullich S, et al. Characterization of the
SPECT 5-HT2A receptor ligand 123I-R91150 in healthy volun-
teers: part 1—pseudoequilibrium interval and quantification
methods. J Nucl Med 2006;47:919–28.
27. Moulin-Sallanon M, Charnay Y, Ginovart N, et al. Acute and
chronic effects of citalopram on 5-HT1A receptor-labeling by
[18F]MPPF and -coupling to receptors-G proteins. Synapse 2009;
63:106–16, doi:10.1002/syn.20588.
28. Passchier J, van Waarde A, Doze P, et al. Influence of P-
glycoprotein on brain uptake of [18F]MPPF in rats. Eur J
Pharmacol 2000;407:273–80, doi:10.1016/S0014-2999(00)00752-4.
29. Lopez-Gimenez JF, Mengod G, Palacios JM, Vilaro MT. Selective
visualization of rat brain 5-HT2A receptors by autoradiography
with [3H]MDL 100,907. Naunyn Schmiedebergs Arch Pharmacol
1997;356:446–54, doi:10.1007/PL00005075.
30. Kannan P, John C, Zoghbi SS, et al. Imaging the function of P-
glycoprotein with radiotracers: pharmacokinetics and in vivo
applications. Clin Pharmacol Ther 2009;86:368–77, doi:10.1038/
clpt.2009.138.
31. Muzi M, Mankoff DA, Link JM, et al. Imaging of cyclosporine
inhibition of P-glycoprotein activity using 11C-verapamil in the
brain: studies of healthy humans. J Nucl Med 2009;50:1267–75,
doi:10.2967/jnumed.108.059162.
32. Seegers U, Potschka H, Loscher W. Expression of the multidrug
transporter P-glycoprotein in brain capillary endothelial cells and
brain parenchyma of amygdala-kindled rats. Epilepsia 2002;43:
675–84, doi:10.1046/j.1528-1157.2002.33101.x.
33. Kamiie J, Ohtsuki S, Iwase R, et al. Quantitative atlas of membrane
transporter proteins: development and application of a highly
sensitive simultaneous LC/MS/MS method combined with novel
in-silico peptide selection criteria. Pharm Res 2008;25:1469–83,
doi:10.1007/s11095-008-9532-4.
34. Jonker JW, Musters S, Vlaming ML, et al. Breast cancer resistance
protein (Bcrp1/Abcg2) is expressed in the harderian gland
and mediates transport of conjugated protoporphyrin IX. Am J
Physiol Cell Physiol 2007;292:C2204–12, doi:10.1152/ajpcell.
00359.2006.
35. Blanckaert P, Burvenich I, Staelens S, et al. Effect of cyclosporin A
administration on the biodistribution and multipinhole muSPECT
imaging of [123I]R91150 in rodent brain. Eur J Nucl Med Mol
Imaging 2009;36:446–53, doi:10.1007/s00259-008-0968-x.
36. Mairinger S, Erker T, Muller M, Langer O. PET and SPECT
radiotracers to assess function and expression of ABC transporters
in vivo. Curr Drug Metab 2011;12:774–92, doi:10.2174/
138920011798356980.
37. De Bruyne S, Wyffels L, Boos TL, et al. In vivo evaluation
of [123I]-4-(2-(bis(4-fluorophenyl)methoxy)ethyl)-1-(4-iodoben-
zyl)piperidine, an iodinated SPECT tracer for imaging the
P-gp transporter. Nucl Med Biol 2010;37:469–77, doi:10.1016/j.
nucmedbio.2009.10.006.
Mdr1a KO Rats for 5-HT Receptor SPECT 11

38. Vilaro MT, Cortes R, Mengod G. Serotonin 5-HT4 receptors and
their mRNAs in rat and guinea pig brain: distribution and effects
of neurotoxic lesions. J Comp Neurol 2005;484:418–39,
doi:10.1002/cne.20447.
39. Marner L, Gillings N, Comley RA, et al. Kinetic modeling of
11C-SB207145 binding to 5-HT4 receptors in the human brain
in vivo. J Nucl Med 2009;50:900–8, doi:10.2967/jnumed.108.
058552.
40. Charnay Y, Leger L. Brain serotonergic circuitries. Dialogues Clin
Neurosci 2010;12:471–87.
41. Paxinos G, Watson G. The rat brain in stereotaxic coordinates. 5th
ed. London: Elsevier Academic; 2004.
12 Dumas et al
Recommended