R E S E A R CH AR T I C L E
Sleep in a comparative context Investigatinghow human sleep differs from sleep in other primates
Charles L Nunn12 | David R Samson13
1Department of Evolutionary Anthropology
Duke University Durham North Carolina
2Duke Global Health Institute Duke
University Durham North Carolina
3Department of Anthropology University of
Toronto Mississauga Ontario Canada
Correspondence
Charles L Nunn Department of
Evolutionary Anthropology Duke
University Box 90383 Durham NC
27708-0383 USA
Email clnunndukeedu
Funding information
National Science Foundation GrantAward
Number BCS-1355902
Abstract
Objectives Primates vary in their sleep durations and remarkably humans sleep the least per 24-
hr period of the 30 primates that have been studied Using phylogenetic methods that quantita-
tively situate human phenotypes within a broader primate comparative context we investigated
the evolution of human sleep architecture focusing on total sleep duration rapid eye movement
(REM) sleep duration non-rapid eye movement (NREM) sleep duration and proportion of sleep in
REM
Materials and Methods We used two different Bayesian methods phylogenetic prediction based
on phylogenetic generalized least squares and a multistate Onrstein-Uhlenbeck (OU) evolutionary
model of random drift and stabilizing selection
Results Phylogenetic prediction confirmed that humans sleep less than predicted for a primate of
our body mass predation risk brain size foraging needs sexual selection and diet These analyses
further revealed that humans pack an unexpectedly higher proportion of REM sleep within a
shorter overall sleep duration and do so by reducing NREM sleep (rather than increasing REM)
The OU model generally confirmed these findings with shifts along the human lineage inferred for
TST NREM and proportion of REM but not for REM
Discussion We propose that the risks and opportunity costs of sleep are responsible for shorter
sleep durations in humans with risks arising from terrestrial sleep involving threats from predators
and conspecifics and opportunity costs because time spent sleeping could be used for learning
creating material objects and socializing
K E YWORD S
cognition human evolution phylogenetic comparative methods phylogeny sleep architecture
1 | INTRODUCTION
All mammals studied thus far sleep but species vary markedly in the
duration of sleep that they exhibit in a typical 24-hr period (McNamara
Capellini Harris Nunn Barton amp Preston 2008) Elephants for exam-
ple sleep on average 2 hr per day in the wild (Gravett et al 2017)
while some bats sleep nearly 20 hr per day (Zepelin and Rechtschaffen
1974) Ecological factors are likely to play a role in explaining this varia-
tion (Capellini Barton McNamara Preston amp Nunn 2008a Lesku
Roth Ii Amlaner amp Lima 2006 Siegel 2004) For example sleep might
have negative effects on survival by exposing individuals to a greater
risk of predation Across mammals increased risk of predation at the
sleep site is associated with shorter sleep durations (Allison amp Cicchetti
1976 Capellini et al 2008a Lesku et al 2006) Similarly sleep dura-
tions are shorter in species that have high metabolic rates for their
body size consistent with foraging constraints that limit time available
for sleep (Capellini Barton McNamara Preston amp Nunn 2008b) A
wide array of functional benefits of sleep have been proposed includ-
ing memory consolidation energy conservation and maintaining effec-
tive immune function (Lesku et al 2006 Meddis 1983 Preston
Capellini McNamara Barton amp Nunn 2009 Stickgold 2005 Zepelin
Siegel amp Tobler 2005)
Broad comparative studies reveal general patterns that are essen-
tial for testing adaptive hypotheses (Harvey amp Pagel 1991 NunndaggerManuscript for Special Issue from ldquoPrimate Sleep Symposiumrdquo at IPS 2016
Am J Phys Anthropol 20181ndash12 wileyonlinelibrarycomjournalajpa VC 2018Wiley Periodicals Inc | 1
Received 6 July 2017 | Revised 17 January 2018 | Accepted 18 January 2018
DOI 101002ajpa23427
2011) Sleep scientists have appreciated the importance of interspecific
comparisons for understanding sleep with a long-standing set of stud-
ies investigating many of the proposed costs and benefits of sleep (Alli-
son amp Cicchetti 1976 Campbell amp Tobler 1984 Elgar Pagel amp
Harvey 1988 Herculano-Houzel 2015 McNamara Barton amp Nunn
2010) Two research groups (Capellini et al 2008a Lesku et al 2006)
have independently investigated the phylogenetic ecological and life
history drivers of ldquosleep architecturerdquo which is defined as the quantita-
tive structure and patterning of sleep and includes measures such as
total sleep time (TST) durations of rapid eye movement (REM) and
non-REM sleep (hereafter NREM) the cycling of NREM and REM
(cycle length) and the distribution of sleep (ie monophasic with one
sleep bout or polyphasic with multiple sleep bouts) throughout the
24-hr period In addition to the comparative analyses of predation risk
discussed above these research groups have found that the propor-
tion of REM sleep covaries positively with brain size (Lesku et al
2006) counts of circulating immune cells covary positively with sleep
durations (Preston et al 2009) and increasing metabolic rate (relative
to body mass) covaries with shorter sleep durations (Capellini et al
2008b) Within primates nocturnality was found to be associated with
longer sleep durations (Nunn McNamara Capellini Preston amp Barton
2010)
Comparative research helps to identify the general predictors of
some phenotypic characteristicsmdashsuch as sleep brain size or life his-
torymdashand thus plays a key role in testing adaptive hypotheses (Harvey
amp Pagel 1991 Nunn 2011) However biologists are also often inter-
ested in species that depart strongly in phenotype from other close rel-
atives examples include seemingly bizarre animals such as the
binturong (Arctictis binturong a large-bodied frugivorous and arboreal
carnivore of Asia) the kakapo (Strigops habroptilus a herbivorous
ground-dwelling parrot of New Zealand that is active at night) or the
aye-aye (Daubentonia madagascarensis an insectivorous lemur that
appears to fill the niche of woodpeckers which are absent in Madagas-
car) Perhaps no single lineage has received as much scientific investiga-
tion into ldquouniquenessrdquo as the lineage separating humans from other
primates Humans have been described as a ldquospectacular evolutionary
anomalyrdquo (Hill Barton amp Hurtado 2009 Vitousek 1997) and one
approach to investigating the ways in which humans are unique is
through comparative analyses of phenotypic variation (Nunn 2011)
Comparative methods make it possible to rigorously investigate
evolution along a single branch on phylogeny (McPeek 1995 Nunn amp
Zhu 2014 Revell 2008) including the human lineage (Jaeggi et al
2017 Nunn 2011 Organ Nunn Machanda amp Wrangham 2011
Vining amp Nunn 2016) Some of these methods for example integrate
interspecific variation and phylogeny to predict human phenotypes
and then test whether observed human phenotypes depart from
this expectation (Nunn amp Zhu 2014) This type of analysis involves
phylogeny-based prediction followed by an ldquooutlier testrdquo to determine
whether human phenotypes differ from what is predicted based on
evolutionary variation across species While this general approach has
long been used for example by detecting whether humans depart from
allometric relationships (eg Harcourt Harvey Larson S G amp Short
1981 Martin amp Harvey 1985) newer versions of the method
incorporate phylogeny into both the estimation of allometric relation-
ships and the prediction of the human phenotype by using phyloge-
netic generalized least squares (PGLS Martins amp Hansen 1997
Symonds amp Blomberg 2014) Other new methods enable the investiga-
tion of adaptive regimes on a phylogeny (Uyeda amp Harmon 2014) with
changes in these regimes consistent with major shifts including on ter-
minal branches of the tree (eg Vining amp Nunn 2016) This type of
analysis fits an Ornstein-Uhlenbeck (OU) model of evolution which
incorporates both stabilizing selection and drift (Butler amp King 2004
Hansen 1997)
Previously we conducted an outlier analysis of sleep evolution
along the human lineage (Samson amp Nunn 2015) Using the phylo-
genetic prediction method (Nunn amp Zhu 2014) our analyses used
variation in body mass interbirth interval activity period endocranial
volume (ECV) and phylogeny to predict the duration of human sleep
We found that humans sleep substantially less than predicted based on
these characteristics in primates suggesting that additional unmodeled
factors are involved in the evolution of human sleep such as predation
risk at the sleep site or foraging needs (Capellini et al 2008a Lesku
et al 2006) Additional analyses using the same general approach fur-
ther revealed that humans exhibit a higher proportion of REM sleep
From these analyses we proposed that human sleep has been shaped
by risks and opportunity costs with risks involving increased predator
and conspecific threats from sleeping on the ground and opportunity
costs of sleep involving time lost for building and maintaining social
bonds and fewer opportunities for individual or social learning (Samson
amp Nunn 2015)
Here we significantly extend the initial analyses of Samson and
Nunn (2015) in the following ways First we investigate a broader set
of predictor variables and additional primate species (Samson Bray amp
Nunn in press) as this may disentangle the factors that led to changes
in sleep duration along the human lineage and thus enable us to better
predict human sleep duration based on ecological factors that are
shared with other primates (rather than being unique to humans) For
example if greater predation risk in terrestrial settings is the primary
driver of shorter human sleep then incorporating this ecological vari-
able into the statistical model should lead to better prediction of human
sleep Second we investigate the evolution of REM and NREM sleep
durations as it was unclear if the increased percentage of REM sleep in
humans that was found previously (Samson amp Nunn 2015) is due to
increased REM duration decreased NREM duration or some combina-
tion thereof We therefore use the expanded data to predict sleep
characteristics involving TST proportion of TST in REM and the dura-
tions of NREM and REM Third we implement better assessment of
the predictive models by applying PGLS phylogenetic prediction to all
species in the dataset If most primates are identified as exceptional
based on these analyses this would indicate that the model itself is not
very robust and would significantly devalue our efforts to make infer-
ences in humans Finally by additionally using the OU model to inves-
tigate the evolution of sleep we provide better understanding of
evolutionary changes throughout primate evolution including on the
human lineage
2 | NUNN AND SAMSON
2 | MATERIALS AND METHODS
21 | Data on sleep ecology behavior
and morphology
As measures of sleep we compiled data on TST NREM REM and pro-
portion of REM for primates Data primarily come from the Phylogeny
of Sleep database (httpswwwbueduphylogeny McNamara et al
2008) which has been used in previous comparative research (Capellini
et al 2008a Capellini Nunn McNamara Preston amp Barton 2008c
Nunn et al 2010) We used species level means of sleep quotas from
only adult aged nonhuman primates and used the ldquohigh-qualityrdquo subset
of data in Capellini et al (2008a) To these data we added staging of
sleep in the orangutan (Pongo pygmaeus) based on videography (Sam-
son amp Shumaker 2013) and data on TST in six species of lemurs based
on actigraphy (Samson et al in press this issue) For analyses of sleep
stagesmdashthat is REM and NREMmdashwe did not use estimates based on
actigraphy We do include estimates of REM and NREM for the orang-
utan in our main analyses but repeated those analyses after omitting
this species given that sleep stage data for the orangutan were not
obtained using EEG We further note that all sleep data come from
captive primates which might influence sleep duration due to lack of
predation and food stress or increased social stress however the con-
sistency of human sleep across different environments (see below)
coupled with good evidence for phylogenetic signal in sleep pheno-
types across species (Capellini et al 2008a) suggests that species typi-
cal sleep durations can be obtained from captive data which is also
currently the only way to obtain data on REM and NREM sleep The
data on sleep phenotypes is provided in Table 1 with the complete
dataset including ecological and phenotypic variables available in the
Online Supporting Information Materials
In terms of variables investigated in the PGLS we include dietary
variables (folivory and number of dietary components) body mass and
day journey length to assess whether animals with greater foraging
needs sleep less (eg a folivorous larger-bodied or omnivorous primate
may need more foraging time and body mass covaries with life history
traits that may influence sleep Capellini et al 2008a) occupation of an
open or terrestrial habitat as a measure of increased predation risk
that is expected to reduce sleep durations group size as a variable that
increases or decreases sleep through its reduction in predation risk
(increasing sleep) andor through night time disruption from conspe-
cifics (reducing sleep Capellini et al 2008a) activity period based on
previous findings that nocturnal species sleep less (Nunn et al 2010)
ECV as a proxy for neurological needs for sleep (Capellini et al 2008a
Lesku et al 2006) and sexual size dimorphism (SSD) as a variable that
captures competition for mates with increasing competition expected
to reduce sleep times (eg Lesku et al 2012) While some hypotheses
have considered the importance of developmental mode in sleep archi-
tecture (especially REM see Capellini et al 2008a) we do not have
appropriate data on juvenile sleep and brain growth for testing these
hypotheses We provide more details on the data in what follows
Data on ECV were taken mainly from Isler et al (2008) We used
the same value for both species of ruffed lemurs (Varecia) and also for
brown lemurs (Eulemur macaco) and black lemurs (E flavifrons) as these
pairs of sister species are closely related and were not subdivided in
Isler et al (2008) For sifakas (Propithecus coquereli) we used an average
from all Propithecus spp available in Isler et al (2008) ECV for Homo
sapiens comes from Robson and Wood (2008) For most species we
obtained mean male and female body mass estimates from Smith and
Jungers (1997) For Eulemur macacao E flavifrons Guinea baboons
(Papio papio) fork-marked lemurs (Phaner spp) and Varecia spp values
were taken from primary sources listed in Rowe and Meyers (2011)
due to missing data or taxonomic uncertainty in Smith and Jungers
(1997) To quantify sexual size dimorphism we followed the two-step
TABLE 1 Data on sleep phenotypes used in the analyses
Species TST REM duration NREM duration
Aotus trivirgatus 1697 182 1515
Callithrix jacchus 95 161 79
Chlorocebus aethiops 977 065 9044
Erythrocebus patas 109 086 999
Eulemur coronatus 896
Eulemur flavifrons 884
Eulemur macaco 965 084 881
Eulemur mongoz 119 072 1116
Homo sapiens 7 156 541
Lemur catta 1105
Macaca arctoides 9 138 765
Macaca fascicularis 1046 171 874
Macaca mulatta 1023 205 819
Macaca nemestrina 988 099 889
Macaca radiata 91 105 806
Macaca sylvanus 1174 107 1068
Microcebus murinus 1536 099 1437
Pan troglodytes 967 145 822
Papio anubis 984 139 845
Papio hamadryas 983 127 861
Papio papio 1007 106 901
Perodicticus potto 11
Phaner furcifer 115
Pongo pygmaeus 911 111 8
Propithecus coquereli 1063
Saguinus oedipus 1318
Saimiri sciureus 972 177 78
Theropithecus gelada 1091
Varecia rubra 981
Varecia variegata 109
Note Blank cells indicate that no data were available
NUNN AND SAMSON | 3
ratio recommended by Smith (1999) This index is symmetrical around
1 with values lt1 if females are the larger sex and gt1 if males are the
larger sex In species with larger males this index is calculated as the
ratio of male and female mass and as 2 ndash (female massmale mass)
when females are the larger sex
Group size data were taken from several sources as follows
First we consulted a database that was independently compiled by
Alexander Harcourt from the published literature (personal communica-
tion 2015 hereafter ldquoHarcourt databaserdquo) Group size for Pan troglo-
dytes was obtained from Nunn and van Schaik (2002) while group size
for humans was from Marlowe (2010) Inferring group size for these
two species presents challenges due to their hierarchical societies
here we use data at the level of the local group (ldquocamprdquo) for warm-
climate foragers from Marlowe (2010) and at the community level for
chimpanzees For bushbabies (Galago) Propithecus Varecia vervets
(Chlorocebus) and Eulemur we obtained mean group sizes from primary
references given in Rowe and Myers (2011) We acknowledge that
group size exhibits striking variation in primates (Patterson Sandel
Miller amp Mitani 2014) Given that the methods used here do not incor-
porate intraspecific variation and that intraspecific variation was not
found to impact statistical findings in a previous study of group size
and brain size (Sandel et al 2016) we do not investigate intraspecific
variation in this context
For diet we used the Harcourt database If leaves were recognized
as a substantial and important component of a speciesrsquo diet this
database codes ldquofolivoryrdquo as 1 (otherwise folivory is set to zero) Other
dietary categories in this database included frugivory insectivory carni-
vory seeds gums and flowers We obtained a dietary breadth metric
that summed these dietary categories Median values for genera were
obtained from the Harcourt database for Papio Propithecus and Vare-
cia We assigned a score of 4 to Homo sapiens to represent leaves
fruits meat and seedsnuts For day journey length we obtained data
from the Harcourt database Due to lack of data day journey lengths
for Aotus spp Galago senegalensis Macaca arctoides M radiata M syl-
vanus Papio spp and Saimiri sciureus were taken from Nunn amp van
Schaik (2002) For Microcebus and Phaner we consulted Rowe and
Myers (2011) and obtained primary sources for Microcebus berthae and
Phaner pallescens which were congeneric with the species in our data-
set We also obtained day journey length for Eulemur Perodicticus and
Varecia genera from primary references in Rowe and Myers (2011) We
obtained data on habitat coding species into whether they are terres-
trial and whether they live in an ldquoopenrdquo habitat using the Harcourt
database and Nunn and van Schaik (2002)
We coded activity period with two variables One variable ldquonoc-
turnalityrdquo codes species into whether they are primarily nocturnal or
diurnal all cathemeral lemurs were coded as diurnal in this case
Another variable ldquocathemeralityrdquo indicated whether species were cath-
emeral (Tattersall 1987) For this we used recent findings presented in
Bray Samson amp Nunn (2017) with Varecia spp Eulemur spp and ring-
tailed lemurs (Lemur catta) coded as cathemeral We included cathe-
merality as a separate variable because of the possibility that circadian
flexibility in these species might affect sleep architecture for example
by leading to shorter TST
Our methods also require that we quantify sleep architecture for
humans For TST we used a value of 7 hr based on a variety of
sources from Western and non-Western populations as follows In
non-Western populations our previous research on both Malagasy
agriculturalists and Hadza foragers suggests that 7 hr is conservative
with these studies estimating human sleep at 65 and 625 hr respec-
tively (Samson Crittenden Mabulla Mabulla amp Nunn 2017b Samson
Manus Krystal Fakir Yu amp Nunn 2017c) This also corresponds to
findings from a recent study of three subsistence societies without
electricity that also included the Hadza (Yetish et al 2015) Similarly a
study of a Haitian nonelectric population revealed a TST duration of
7 hr (Knutson 2014) and a meta-analysis of Western populations
revealed an average TST of 7 hr (Ohayon Carskadon Guilleminault amp
Vitiello 2004) We report on the sensitivity of the outlier tests to using
7 hr for TST in humans For NREM and REM values were also taken
from the meta-analysis of Ohayon et al (2004) To account for the dif-
ferences in sleep stages by age in Ohayon et al (2004) we derived the
human mean by averaging a cross-section of sleep architecture values
from seven postreproductive ldquoadultrdquo ages Specifically from the ages of
15ndash45 years we averaged the values from 5-year intervals by meas-
uring the proportion of each sleep stage from the graphical output pro-
vided in the meta-analysis
22 | Phylogenetic comparative methods
In all phylogeny-based analyses we used 200 dated primate phyloge-
nies from 10kTrees version 3 (Arnold Matthews amp Nunn 2010) which
provides a posterior distribution of trees from a Bayesian phylogenetic
analysis A consensus tree is provided in the electronic Supporting
Information (Figure S1)
We used two methods to investigate sleep architecture along the
human lineage in a comparative context The first methodmdashphylogene-
tic predictionmdashwas based on PGLS with the following statistical model
Sleep Phenotype5ECV1Female Body Mass1SSD1 Folivory 1
Dietary Categories1Open Habitat1Terrestrial1Day Journey
Length1Group Size1Nocturnal1Cathemeral with all quantitative
metrics except for proportion REM log10 transformed We used a
Bayesian framework for model fitting implemented in BayesModelS
(Nunn amp Zhu 2014) in the statistical software R (R Development Core
Team 2014) BayesModelS uses Markov Chain Monte Carlo (MCMC)
to generate a posterior probability distribution of regression coeffi-
cients along with Bayesian model selection procedure to assess the
probability that a coefficient should be included in the model When a
coefficient is included often and is more consistently positive or nega-
tive (rather than centered on zero) this indicates greater support for a
predictor variable in the model
We also estimated k and j which scale the phylogeny to better
meet the underlying assumptions of phenotypic change under a
Brownian motion model of evolution (Nunn 2011) The parameter k
(Freckleton Harvey amp Pagel 2002) multiplies the internal branches by
a value ranging from 0 to 1 with 0 equivalent to a star phylogeny
(Felsenstein 1985) and thus indicative of no phylogenetic signal The
parameter j raises branches to the value j (Pagel 1999) Fitting of this
4 | NUNN AND SAMSON
model has been used to assess whether a ldquospeciationalrdquo model of evo-
lutionary change occurs that is with evolutionary change occurring at
diversification points on the tree of extant taxa (Garland et al 1993
Nunn 2011 Pagel 1999) Here we use the k and j parameters to
improve the fit of the model rather than for investigating tempo and
mode of evolutionary change
In our MCMC analyses we ran analyses with a burnin of 100 itera-
tions and sampled the MCMC chain every 50 iterations (thin rate) pro-
ducing a posterior probability distribution of 1000 samples for
estimating regression coefficients the probability of including coeffi-
cients in the statistical model (model selection) k versus j and esti-
mates of k or j To ensure adequate burnin and thin rate (ie sampling
from a stable distribution of likelihoods with low correlation across
neighboring samples) we checked that a plot of likelihoods had stabi-
lized and showed low autocorrelation
We assessed support for coefficients as (1) the proportion of
MCMC samples that included its coefficient in the model (vs assuming
it is zero) with support between 10 and 30 as ldquoweakrdquo between 30
and 50 indicative of ldquosupportrdquo and 50 or more as ldquostrong supportrdquo
and when the coefficient was included in the model (2) the proportion
of regression coefficients from the MCMC sample that were positive
or negative based on predictions identified above with weak support
indicated by 85 to just under 90 of MCMC samples in the predicted
direction while 90 to just under 95 indicated ldquosupportrdquo and gt95
indicated ldquostrong supportrdquo These criteria are intended only to help
operationalize results and ultimately readers should interpret the prob-
abilities of support we provide and make their own assessments Note
that if a coefficient is included in the posterior distribution 30 of the
time this means that it is used when predicting sleep architecture in
30 of the posterior samples hence it can have a meaningful impact
on the predicted distribution even at low support levels To make infer-
ences about whether the coefficient is positive or negative we present
estimates for model coefficients from the MCMC sample in which it
was estimated (rather than excluded from the model and thus set
to zero)
We considered humans to depart from other primates if less than
5 of the posterior distribution is smaller than or larger than the value
in humans which is equivalent to using a 90 credible interval (ie 5
on each tail of the posterior distribution) but as with support levels for
coefficients from the model just noted we provide actual probabilities
so that readers can make their own assessments To assess the per-
formance of model prediction in humans we repeated the process for
all primates in the analysis that is by dropping that species out fitting
the model predicting the sleep phenotype in that species and then
comparing the observed value to that posterior probability distribution
of predictions We identify other primates that lie outside the 90
credible interval
Our second approach was based on modeling adaptive regimes
across a phylogeny for each of the groups in our study using an OU
model We especially focused on the lineage leading to humans and
tested whether a shift in the selection regime was inferred on this
branch Under the OU model species evolve through various selection
regimes that map to branches on the phylogeny The goal is to
characterize the regimes across the tree and to assess whether a shift
in selection regime occurred on the branch connecting Homo to the
other primates As evidence for ldquosupportrdquo for a change in adaptive
regime on a branch we required that two conditions be met at least
20 of the MCMC chain had to infer a change along that branch and
80 or more of those changes had to be in a consistent direction We
identify branches that meet these support criteria graphically while
also providing more detailed statistics for shifts along the human
lineage
To implement this approach we used the R package bayou (Uyeda
amp Harmon 2014) which is a Bayesian implementation of OU model fit-
ting We ran two chains and ensured convergence by graphical inspec-
tion of the output calculation of Gelmanrsquos R for key parameters of the
model and by comparing the magnitude of shifts across branches in
the two runs aiming for strong correlations in branch shift probabilities
across runs The first 10 of samples were dropped from each chain as
burnin and the chains were combined for all further analyses and
plotting
3 | RESULTS
31 | Total sleep time
Humans were predicted to sleep 955 hr which is 36 gt7 hr of TST
used as the human value in this analysis Indeed only 18 of the pos-
terior predicted distribution of TST was below the observed sleep time
for humans indicating that humans are a phylogenetic outlier in terms
of TST with less sleep observed in humans than predicted based on
variation across primates (Figure 1) Humans would remain an outlier
even if average human TST was 750 hr based on the support levels
we used for determining outlier status
Of the predictor variables we investigated only nocturnality
was consistently entered into the PGLS model across MCMC chains
(67 of samples ldquostrong supportrdquo see Table 2) Among these samples
FIGURE 1 Predicted human TST and the distribution of TSTacross primates The top panel provides the posterior probabilitydistribution of predicted TST with the red line indicating theobserved value for humans The bottom panel provides a histogramof sleep durations across primate species These analyses revealthat human sleep is much shorter than predicted for a primate ofour phenotypic characteristics and phylogenetic placement (toppanel) and is the shortest of all primates (bottom panel)
NUNN AND SAMSON | 5
993 of the coefficients for ldquonocturnalityrdquo were positive (again
ldquostrong supportrdquo) Dietary variables were commonly positive (gt90)
but rarely entered in the model (lt10) The phylogenetic scaling
parameters k and j were approximately equally favored (563 proba-
bility of k) with evidence of weak phylogenetic signal in model resid-
uals (mean k5020) When predicting sleep for all primates only two
(of 30) other species were identified as outliers Callithrix jacchus was
identified as a negative outlier (ie sleeping less than predicted like
Homo) while Aotus trivirgatus was identified as a positive outlier (ie
sleeping more than predicted)
In OU modeling in bayou we found evidence for a negative shift
in the adaptive regime along the branch leading to Homo along with
four other shifts in selective regime on other branches on the phylog-
eny (Figure 2) The lineage to Homo was inferred as having a shift on
292 of the iterations of the MCMC chain with the clear majority of
these (983) constituting negative shifts toward lower TST
32 | Proportion of REM
Humans were predicted to spend 138 of their TST in REM The
observed value was 223 and fell in the upper tail of the posterior
probability distribution of predictions with only 31 of the distribu-
tion larger than what was observed (Figure 3) Thus humans are a posi-
tive outlier in the proportion of time spent in REM sleep and would
remain so even if only 213 of TST was spent in REM sleep based on
our support criteria Thus outlier status for proportion of REM is
supported in this analysis but not as strong as for TST We re-ran anal-
yses that removed Pongo from the dataset given that the sleep archi-
tecture for this species was not obtained using EEG (see Materials and
Methods) This reanalysis produced largely similar results with only
45 of the distribution larger than observed
As shown in Table 3 being a folivore or consuming more dietary
categories tended to depress the proportion of REM sleep (ie a nega-
tive coefficient received ldquostrongrdquo support for both variables with
978 of ldquofolivoryrdquo coefficients being negative and 994 of ldquonumber
TABLE 2 Predictors of TST in primates (PGLS analysis)
Variable Coefficient SE Support Positive
Intercept 1019 0002 NA 100
ECV 20063 001 10 265
Body Mass 20019 0001 NA 259
SSD 0001 0007 4 489
Folivore 0032 0003 5 94
Diet categories 0027 0002 9 936
Open habitat 20013 0006 2 50
Terrestriality 001 0005 4 651
Day journey length 2001 0006 4 368
Group size 0018 0003 4 784
Nocturnal 0117 0002 67 993
Cathemeral 20022 001 6 304
N5 30 species results are presented for the model that excludedhumans Shading indicates variables that had at least weak predictivecapacity based on the combination of the two criteria given in theMethods for support levels with darker shading indicating greatersupport
FIGURE 2 Phylogenetic modeling of TST using an Ornstein Uhlenbeck model We map onto primate phylogeny inferred transitions in theadaptive regime based on support criteria provided in the text The figure also shows deviations of the inferred adaptive regime from theroot of the tree with redder colors indicating increases in TST and bluer colors indicating decreases in TST colors
6 | NUNN AND SAMSON
of diet categoriesrdquo coefficients being negative) No other variables
were influential in this analysis (Table 3) All models favored the j
model with a mean j estimate of 038 Among the 20 species for
which data were available no other primate hit the threshold of being
an outlier althoughMacaca mulatta approached the 90 credible inter-
val as having a higher than predicted percentage of REM sleep
Our bayou analysis of proportion of REM revealed a similar pat-
tern with the lineage leading to Homo being one of four branches
meeting our support criteria (Supporting Information Figure S2) Sup-
port for a shift in adaptive regime along the human lineage was 255
and was substantially more often positive than negative (951 of the
time positive) The mean magnitude of the positive shift was 10 times
larger than the mean magnitude of the 49 of the shifts inferred as
negative Similar results were obtained in bayou when Pongo was
removed from the analysis
The inferred increase in the proportion of REM along the human
lineage raises the question of whether this arises from a lower total
duration of NREM a higher total duration of REM or some combina-
tion thereof The next analyses aim to disentangle those possible
patterns
33 | Duration of NREM
In phylogenetic prediction of NREM sleep duration we found evidence
that humans are negative outliers with only 08 of the posterior dis-
tribution being less than observed (Figure 4) The model predicted that
humans would exhibit 842 hr of NREM whereas the observed value
was only 541 hr Based on our outlier criteria humans would remain
an outlier even if on average they spent 645 or fewer hours in
NREM Similar results were obtained when analyzing the data without
Pongo with only 11 of the distribution being less than observed
The analyses also identified a larger set of predictors for NREM
sleep (Table 4) including greater NREM in species that are not strictly
diurnal and in species that consume resources from more dietary types
For branch length scaling parameters j was again favored over k
(97) with a mean j of 043 When predicting NREM for the 20 pri-
mates with NREM data we found two additional species that were
identified as outliers Eulemur mongoz exhibited more NREM than pre-
dicted while Callithrix jacchus exhibited less NREM than expected
In OU modeling in bayou we found strong support for a shift
along the human lineage (460 Supporting Information Figure S3)
with a clear majority of inferred changes involving a reduction in
NREM (987) Several other shifts occurred including a stronglyTABLE 3 Predictors of percentage of REM sleep in primates (PGLSanalysis)
Variable Coefficient SE Support Positive
Intercept 012 0002 NA 977
ECV 0003 0012 11 495
Body mass 0006 0001 NA 585
SSD 2003 0004 7 235
Folivore 20036 0001 23 22
Diet categories 20023 0001 16 06
Open habitat 0002 0005 2 70
Terrestriality 20004 0006 2 50
Day journey length 0014 0005 4 684
Group size 002 0004 2 84
Nocturnal 20037 0004 9 174
Cathemeral 20048 0008 8 24
N5 20 species results are presented for the model that excludedhumans Shading indicates variables that had at least weak predictivecapacity based on the combination of the two criteria given in theMethods for support levels
FIGURE 3 Predicted percentage of REM in humans and itsdistribution across primates The top panel provides the posteriorprobability distribution of predicted percentage of REM with thered line indicating the observed value for humans The bottompanel provides a histogram of percentage of REM across primatespecies These analyses reveal that humans have a higher thanpredicted REM percentage for a primate of our phenotypiccharacteristics and phylogenetic placement (top panel) and is thehighest percent among all primates (bottom panel)
FIGURE 4 Predicted NREM in humans and its distribution acrossprimates The top panel provides the posterior probabilitydistribution of NREM with the red line indicating the observedvalue for humans The bottom panel provides a histogram ofpercentage of REM across primate species These analyses revealthat humans have a lower than predicted NREM duration for aprimate of our phenotypic characteristics and phylogeneticplacement (top panel)
NUNN AND SAMSON | 7
supported increase in NREM along the lineage leading to genus Aotus
Similar results were obtained in analyses the removed Pongo from the
dataset
34 | Duration of REM
Human REM duration of 156 hr was only moderately larger than the
mean of the posterior distribution of predictions (129 hr) from PGLS
analyses (Figure 5) Indeed 306 of the posterior distribution was
larger than the observed value suggesting that human REM duration is
not notably different from expectations based on phenotypic variation
in other primates Results were similar in analyses that omitted Pongo
with 36 of the posterior distribution being larger than the observed
value
Several phenotypic and ecological variables predicted REM dura-
tion but only weakly these included negative effects of SSD folivory
and cathemeral activity pattern (Table 5) For branch length-scaling
parameters j was again highly favored over k (992) with a mean j
of 0347 Looking across the other 20 species with sufficient data for
these analyses we found no phylogenetic outliers although Chloroce-
bus aethiops nearly met conditions for being a negative outlier and
Macaca mulatta was nearly a positive outlier
In bayou analyses we found a shift involving a reduction in
REM on the branch leading to Homo and Pan but not on the human
lineage itself (Supporting Information Figure S4) On that internal ape
lineage the probability of the shift occurring was 23 with 82 being
positive shifts Five other shifts in the adaptive regime were inferred
elsewhere on the tree some with greater support than found in the
apes Similar results were found when removing Pongo from the bayou
analysis
4 | DISCUSSION
The analyses presented here represent the most in-depth comparative
analysis of sleep in primates to date with a special focus on the termi-
nal branch leading to humans Based on comparative patterns in prima-
tes and phylogeny we found strong evidence that human TST is much
shorter than predicted confirming an initial analysis of this possibility in
Samson and Nunn (2015) with an expanded dataset and improved
methodology Specifically our updated phylogenetic prediction analy-
ses revealed that humans are outliers and would remain so by our cri-
teria even if we assigned humans a TST of 75 hr which exceeds values
FIGURE 5 Predicted REM in humans and the distribution of REMdurations across primates The top panel provides the posteriorprobability distribution of REM with the red line indicating theobserved value for humans The bottom panel provides a histogramof REM across primate species These analyses do not supporthumans as having an unusually high total REM duration (top panel)
TABLE 5 Predictors of REM sleep in primates (PGLS analysis)
Variable Coefficient SE Support Positive
Intercept 0182 001 NA 767
ECV 20195 0022 29 298
Body mass 0077 0006 NA 692
SSD 20135 0008 20 122
Folivore 20089 0005 16 71
Diet categories 20043 0004 8 105
Open habitat 20008 0012 8 468
Terrestriality 20098 0009 12 144
Day journey length 0069 0011 11 704
Group size 0047 0009 9 696
Nocturnal 0091 0011 15 788
Cathemeral 20252 0011 31 93
N520 species results are presented for the model that excludedhumans Shading indicates variables that had at least weak predictivecapacity based on the combination of the two criteria given in theMethods for support levels
TABLE 4 Predictors of NREM sleep in primates (PGLS analysis)
Variable Coefficient SE Support Positive
Intercept 0957 0004 NA 100
ECV 20162 0009 25 123
Body mass 005 0002 NA 79
SSD 20016 0007 6 351
Folivore 0022 0008 2 682
Diet categories 0035 0001 37 995
Open habitat 0 0006 3 519
Terrestriality 0007 0006 4 543
Day journey length 001 0007 4 703
Group size 0017 0006 3 692
Nocturnal 0242 0002 99 100
Cathemeral 0093 0005 19 889
N5 20 species results are presented for the model that excludedhumans Shading indicates variables that had at least weak predictivecapacity based on the combination of the two criteria given in theMethods for support levels
8 | NUNN AND SAMSON
from recent studies of traditional populations (reviewed in the Meth-
ods) In addition a more sophisticated model of evolutionary change
which explicitly models both stabilizing selection and drift (the OU
model) infers a shift in the selective regime for TST along the human
lineage Looking at a subset of primates for which we had data on REM
and NREM we also found that humans reached outlier status for the
percentage of time spent in REM also confirming findings presented in
Nunn and Samson (2015) While this finding clearly met our criteria for
support the analyses were not as strong as those for TST with only
31 of the distribution being larger than the observed value Evolu-
tionary analysis using an OU model also revealed support for a shift in
the percentage of REM along the human lineage
A shift toward a higher proportion of REM could arise from a shift
toward more REM a shift toward less NREM or a combination of
these two shifts Our analyses of REM and NREM durations revealed
that NREM is the major driver of the reduction in TST in humans With
a reduction in predicted NREM of 3 hr this negative change could
more than compensate for the reduction of 255 hrs of TST from pre-
dictions Humans may also have experienced a mild increase in REM
sleep which is hinted at in our modeling (an increase of 03 hr but not
reaching our a priori support levels) and may be harder to detect given
that REM is a small proportion of TST Such an effect on increased
REM might be detectable in future models that have access to larger
sample sizes but it seems clear from our analyses that the increase in
the proportion of REM is mainly due to a substantial reduction in
NREM rather than an increase in REM It is intriguing to think that
even with such a large decrease in TST humans may have expanded
REM research on human subjects suggests that REM is critical for
memory consolidation (Stickgold 2005) emotional regulation (Nishida
Pearsall Buckner amp Walker 2009 Simon et al 2015) threat rehearsal
(Revonsuo 2000) and potentially also insight (Wagner et al 2004)
Future research could investigate the specific stages of NREM that
shifted over evolutionary time Based on recent evidence that variabili-
ty in human chronotype may have increased group level vigilance dur-
ing nighttime periods by way of sentinel-like behavior (Samson
Crittenden Mabulla Mabulla amp Nunn 2017a) we predict that the
lightest stages of NREM sleep (stage 1 and 2 where arousal threshold
is low) proportionally decreased relative to deep NREM slow wave
sleep (stage 3 where arousal threshold is high)
Our PGLS model fitting also offers a chance to understand how
ecology morphology and behavior influence sleep architecture in pri-
mates For TST our analyses confirmed earlier findings (based on dif-
ferent methods and less data) that nocturnality covaries strongly with
longer sleep durations in primates (Nunn et al 2010) Using coefficients
from our model we estimate that nocturnality increases TST by 131
hr per 24 hr which is a substantial effect Several factors could account
for this effect as nocturnal and diurnal primates exhibit many striking
differences in ecology morphology and sociality However we think
the most plausible explanation is that nocturnal species may prefer to
forage in maximal darkness to reduce predation risk hence they may
benefit from becoming active only after full darkness has been reached
This would effectively give them more time for sleep and they appear
to be taking that evolutionary route based on our analyses In addition
nocturnal species often live in smaller groups (or solitarily) and often
have concealed sleep sites that may reduce predation during both day
and night thus relaxing predation risk at the sleep site and favoring
more sleep (Capellini et al 2008a Lesku et al 2006) We did not find
an effect of cathemerality in analyses of TST
We also investigated the predictors of REM NREM and the pro-
portion of REM sleep These analyses revealed that the number of die-
tary categories covaries positively with more NREM (Table 4) and this
appears to cut into the proportion of REM sleep (Table 3) rather than
simply lengthening TST (Table 2 ie this variable was impactful on
TST) Nocturnality was positively associated with both NREM and REM
durations suggesting that both contribute to increased TST in noc-
turnal lineages while cathemeral species had substantially less REM
sleep This association between cathemerality and less REM may occur
because REM (and particularly phasic REM) is associated with the
greatest arousal threshold of any sleep state Thus animals in this sleep
stage are maximally disconnected from their external environment and
are therefore exceptionally vulnerable particularly in unpredictable
environments which characterizes the ecology of Madagascar where
cathemerality is most commonly found (Donati amp Borgognini-Tarli
2006 Wright 1999) We also found evidence for SSD and folivory
having a negative association with REM Thus our analyses revealed
some new effects on sleep architecture that had not been documented
in previous work on primate sleep (Nunn et al 2010) although many
of these effects were weak
Our analyses support general conclusions from our previous
smaller analysis that revealed the intriguing pattern that humans sleep
substantially less than predicted for a primate with our phylogenetic
position ecology and phenotypic characteristics (Samson amp Nunn
2015) In that previous study we proposed that both risks and oppor-
tunity costs produce the shorter sleep durations found in humans
Some risks may arise from a more terrestrial lifestyle including sleeping
on the ground This lifestyle would have exposed early humans to
greater predation risk and potentially to greater threats from hostile
conspecifics who would have been able to locomote more effectively
on the ground at night (as compared with primates moving arboreally
at night in the trees) Importantly our proxies for predation risk involv-
ing terrestriality and living in an ldquoopenrdquo habitat were not predictive of
TST (Table 2) suggesting that additional factors are important for
humans or that early humans experienced a higher level of risk from
terrestrial sleep that is not captured by these proxies and would result
in lower predicted sleep time if these factors could be effectively incor-
porated into the statistical models
Opportunity costs of sleep may be more important for understand-
ing human sleep Some of these opportunity costs also relate directly
to unique aspects of human evolution in this case involving the impor-
tance of learningmdashboth individually and sociallymdashand the importance of
technology and material culture for reproductive success As we all
know from our own lives sleep reduces the opportunities for produc-
tive activities which importantly include learning new skills and apply-
ing them to generate objects new knowledge or teaching our allies
spouses and children We propose that the importance of these activ-
ities in human evolution has contributed to the shortening of human
NUNN AND SAMSON | 9
sleep that we document perhaps more so than risks from sleeping on
the ground Further support for this hypothesis comes from the find-
ings that humans have largely achieved shorter sleep through less
NREM with some hints that REM has increased modestly despite the
huge decrease in TST As REM is known to be involved in memory con-
solidation (Peigneux Laureys Delbeuck amp Maquet 2001 Stickgold
2005 Stickgold James amp Hobson 2000) and rehearsal of stressful sit-
uations or problems (Revonsuo 2000 Valli amp Revonsuo 2009) these
findings further suggest that our material culture has played a major
role in shaping human sleep
Our findings may be limited by the use of captive animals for
obtaining measures of sleep where potential ecological drivers of sleep
are more controlled including food availability and predation At pres-
ent however it is only possible to obtain estimates of sleep stages in
captivity using either EEG or visual methods Regarding these meth-
odological differences in estimating sleep architecture we demon-
strated that our main conclusions were insensitive to including sleep
stages from the orangutan in our analyses which were obtained with
videography rather than EEG (Samson amp Shumaker 2013) We also
acknowledge that individuals vary in their sleep durations and that dif-
ferent primate populations exhibit variation in group size diet and
other socioecological variables At present we lack data to assess these
sources of variation although recent research suggests that the effects
of intraspecific variation may be minor (Sandel et al 2016)
In conclusion our analyses provide new insights into the evolution
of primate sleep including in humans We find that human sleep archi-
tecture differs greatly from predictions of what would be found in a
typical primate based on our phenotypic phylogenetic and ecological
characteristics and how these characteristics influence sleep in other
primates These results have importance for human evolution and for
understanding human health (McNamara amp Auerbach 2010 Nunn
Samson amp Krystal 2016 Worthman 2008) For example short human
sleep could account for why humans appear to be uniquely susceptible
to Alzheimerrsquos disease (Nesse Finch amp Nunn 2017) Future research
could investigate the hypotheses for drivers of short sleep by studying
sleep in different human populations including in relation to risks
activities at night demands on time budgets and cultural transmission
and evolution
ACKNOWLEDGMENTS
The authors thank the organizers for inviting us to contribute to this
special issue Ian Miller for comments edits and statistical advice
two anonymous reviewers and the Associate Editor for comments
and Isabella Capellini and Alexander Harcourt for assistance with
data They acknowledge the National Science Foundation for fund-
ing (BCS-1355902)
ORCID
Charles L Nunn httporcidorg0000-0001-9330-2873
David R Samson httporcidorg0000-0003-3318-7652
REFERENCES
Allison T amp Cicchetti D V (1976) Sleep in Mammals - Ecological and
Constitutional Correlates Science 194 732ndash734
Arnold C Matthews L J amp Nunn C L (2010) The 10kTrees website
A new online resource for primate phylogeny Evolutionary Anthropol-
ogy 19 114ndash118
Bray J Samson D R amp Nunn C L (2017) Activity patterns in seven
captive lemur species Evidence of cathemerality in Varecia and
Lemur catta American Journal of Primatology 79(6) e22648
Butler M A amp King A A (2004) Phylogenetic comparative analysis A
modeling approach for adaptive evolution The American Naturalist
164 683ndash695
Campbell S S amp Tobler I (1984) Animal sleep A review of sleep dura-
tion across phylogeny Neuroscience amp Biobehavioral Reviews 8 269ndash300
Capellini I Barton R A McNamara P Preston B amp Nunn C L
(2008a) Ecology and evolution of mammalian sleep Evolution 62
1764ndash1776
Capellini I Barton R A McNamara P Preston B T amp Nunn C L
(2008b) Phylogenetic analysis of the ecology and evolution of mam-
malian sleep Evolution 62 1764ndash1775
Capellini I Nunn C L McNamara P Preston B T amp Barton R A
(2008c) Energetic constraints not predation influence the evolution
of sleep patterning in mammals Functional Ecology 22 847ndash853
Donati G amp Borgognini-Tarli S M (2006) From darkness to daylight Cath-
emeral activity in primates Journal of Anthropological Sciences 84 7ndash32
Elgar M A Pagel M D amp Harvey P H (1988) Sleep in Mammals Ani-
mal Behaviour 36 1407ndash1419
Felsenstein J (1985) Phylogenies and the comparative method The
American Naturalist 125 1ndash15
Freckleton R P Harvey P H amp Pagel M (2002) Phylogenetic analysis
and comparative data A test and review of evidence The American
Naturalist 160 712ndash726
Garland T Dickerman A W Janis C M amp Jones J A (1993) Phylo-
genetic analysis of covariance by computer simulation Systematic
Biology 42 265ndash292
Gravett N Bhagwandin A Sutcliffe R Landen K Chase M J Lyamin
O I Manger P R (2017) Inactivitysleep in two wild free-roaming
African elephant matriarchs ndash Does large body size make elephants the
shortest mammalian sleepers PLoS One 12 e0171903
Hansen T F (1997) Stabilizing selection and the comparative analysis
of adaptation Evolution 51 1341ndash1351
Harcourt A H Harvey P H Larson S G amp Short R V (1981) Testis
weight body weight and breeding system in primates Nature 293
55ndash57
Harvey P H amp Pagel M D (1991) The comparative method in evolu-
tionary biology (pp 239) Oxford Oxford University Press
Herculano-Houzel S (2015) Decreasing sleep requirement with increasing
numbers of neurons as a driver for bigger brains and bodies in mamma-
lian evolution Proceedings Biological Sciences 282 20151853
Hill K Barton M amp Hurtado A M (2009) The emergence of human
uniqueness Characters underlying behavioral modernity Evolutionary
Anthropology Issues News and Reviews 18 187ndash200
Isler K Christopher Kirk E Miller J Albrecht G A Gelvin B R amp
Martin R D (2008) Endocranial volumes of primate species Scaling
analyses using a comprehensive and reliable data set Journal of
Human Evolution 55 967ndash978
Jaeggi A V Kramer K L Hames R Kiely E J Gomes C Kaplan H
amp Gurven M (2017) Human grooming in comparative perspective
10 | NUNN AND SAMSON
People in six small-scale societies groom less but socialize just as
much as expected for a typical primate American Journal of Physical
Anthropology 162 810ndash816
Knutson K L (2014) Sleep duration quality and timing and their asso-
ciations with age in a community without electricity in Haiti Ameri-
can Journal of Human Biology 26 80ndash86
Lesku J A Rattenborg N C Valcu M Vyssotski A L Kuhn S
Kuemmeth F Kempenaers B (2012) Adaptive Sleep Loss in
Polygynous Pectoral Sandpipers Science 337 1654ndash8
Lesku J A Roth Ii T C Amlaner C J amp Lima S L (2006) A phyloge-
netic analysis of sleep architecture in mammals the intergration of
anatomy physiology and ecology The American Naturalist 168
1ndash13
Marlowe F (2010) The Hadza Hunter-gatherers of Tanzania Berkeley
University of California Press
Martin R amp Harvey P H (1985) Brain size allometry ontogeny and
phylogeny In WL Jungers (Ed) Size and scaling in primate biology
(pp 147ndash173) New York Plenum
Martins E P amp Hansen T F (1997) Phylogenies and the comparative
method A general approach to incorporating phylogenetic informa-
tion into the analysis of interspecific data The American Naturalist
149 646ndash667
McNamara P amp Auerbach S (2010) Evolutionary medicine of sleep
disorders Toward a science of sleep duration In P McNamara RA
Barton and CL Nunn (Eds) Evolution of Sleep (pp 107ndash122)Cambridge UK Cambridge University Press
McNamara P Barton R amp Nunn C (2010) Evolution of sleep Phyloge-
netic and functional perspectives Cambridge Cambridge University
Press
McNamara P Capellini I Harris E Nunn C L Barton R A amp Pres-
ton B (2008) The phylogeny of sleep database A new resource for
sleep scientists The Open Sleep Journal 1 11ndash14
McPeek M A (1995) Testing hypotheses about evolutionary change on
single branches of a phylogeny using evolutionary contrasts The
American Naturalist 145 686ndash703
Meddis R (1983) The evolution of sleep In A Mayes (Ed) Sleep Mech-
anisms and Functions (pp 57ndash106) London Van Nostrand Reinhold
Nesse R M Finch C E amp Nunn C L (2017) Does selection for short
sleep duration explain human vulnerability to Alzheimerrsquos disease
Evolution Medicine and Public Health 2017 39ndash46
Nishida M Pearsall J Buckner R L amp Walker M P (2009) REM
sleep prefrontal theta and the consolidation of human emotional
memory Cerebral Cortex 19 1158ndash1166
Nunn C amp Zhu L (2014) Phylogenetic Prediction to Identify ldquoEvolu-tionary Singularitiesrdquo In LZ Garamszegi (Ed) Modern Phylogenetic
Comparative Methods and Their Application in Evolutionary Biology (pp
481ndash514) Berlin Heidelberg Springer
Nunn C L (2011) The Comparative Approach in Evolutionary Anthropol-
ogy and Biology Chicago amp London University of Chicago Press
Nunn C L McNamara P Capellini I Preston B T amp Barton R A (2010)
Primate sleep in phylogenetic perspective In P McNamara R A
Barton C L Nunn (Eds) Evolution of Sleep Phylogenetic and Functional
Perspectives (pp 123ndash145) New York Cambridge University Press
Nunn C L Samson D R amp Krystal A D (2016) Shining Evolutionary
Light on Human Sleep and Sleep Disorders Evolution Medicine and
Public Health 2016 227ndash243
Nunn C L amp van Schaik C P (2002) Reconstructing the behavioral
ecology of extinct primates In J M Plavcan R F Kay W L
Jungers and C P V Schaik (Eds) Reconstructing behavior in the fossil
record (pp 159ndash216) New York Kluwer AcademicPlenum
Ohayon M M Carskadon M A Guilleminault C amp Vitiello M V
(2004) Meta-analysis of quantitative sleep parameters from child-
hood to old age in healthy individuals Developing normative sleep
values across the human lifespan Sleep 27 1255ndash1274
Organ C L Nunn C L Machanda Z amp Wrangham R W (2011) Phy-
logenetic Rate Shifts in Feeding Time During the Evolution of Homo
Proceedings of the National Academy of Sciences USA 108 14555ndash14559
Pagel M (1999) Inferring the historical patterns of biological evolution
Nature 401 877ndash884
Patterson S K Sandel A A Miller J A amp Mitani J C (2014) Data
quality and the comparative method The case of primate group size
International Journal of Primatology 35 990ndash1003
Peigneux P Laureys S Delbeuck X amp Maquet P (2001) Sleeping
brain learning brain The role of sleep for memory systems Neurore-
port 12 A111ndashA124
Preston B T Capellini I McNamara P Barton R A amp Nunn C L
(2009) Parasite resistance and the adaptive significance of sleep
BMC Evolutionary Biology 9 7
R Development Core Team (2014) R A language and environment for
statistical computing Vienna Austria R Foundation for Statistical
Computing
Revell L J (2008) On the analysis of evolutionary change along single
branches in a phylogeny The American Naturalist 172 140ndash147
Revonsuo A (2000) The reinterpretation of dreams An evolutionary
hypothesis of the function of dreaming Behavioral and Brain Sciences
23 877ndash901
Robson S L amp Wood B (2008) Hominin life history reconstruction
and evolution Journal of Anatomy 212 394ndash425
Rowe N amp Myers M (2011) All the worldrsquos primates Charlestown RI
Primate Conservation Inc Available at www alltheworldsprimates org
Accessed on 10 October 10 2011
Samson D R Bray J amp Nunn C L The cost of deep sleep environ-
mental influences on sleep regulation are greater for diurnal lemurs
American Journal of Physical Anthropology in press
Samson D R Crittenden A N Mabulla I Mabulla A I amp Nunn C L
(2017a) Chronotype variation drives nighttime sentinel-like behav-
iour in hunter-gatherers Proceedings Biological Sciences 284 pii
20170967
Samson D R Crittenden A N Mabulla I A Mabulla A Z amp Nunn
C L (2017b) Hadza sleep biology Evidence for flexible sleep-wake
patterns in hunter-gatherers American Journal of Physical Anthropol-
ogy 162 573ndash582
Samson D R Manus M B Krystal A D Fakir E Yu J J amp Nunn C
L (2017c) Segmented sleep in a nonelectric small-scale agricultural
society in Madagascar American Journal of Human Biology e22979
Samson D R amp Nunn C L (2015) Sleep intensity and the evolution of
human cognition Evolutionary Anthropology 24 225ndash237
Samson D R amp Shumaker R W (2013) Documenting orang-utan sleep
architecture Sleeping platform complexity increases sleep quality in
captive Pongo Behaviour 150 845ndash861
Sandel A A Miller J A Mitani J C Nunn C L Patterson S K amp
Garamszegi L Z (2016) Assessing sources of error in comparative
analyses of primate behavior Intraspecific variation in group size and
the social brain hypothesis Journal of Human Evolution 94 126ndash133
Siegel J M (2004) Sleep Phylogeny Clues to the Evolution and Func-
tion of Sleep In P-H Luppi (Ed) Sleep Circuits and Functions Boca
Rranton (pp 163ndash176) Florida CRC Press
Simon E B Oren N Sharon H Kirschner A Goldway N Okon-
Singer H Hendler T (2015) Losing neutrality The neural basis
NUNN AND SAMSON | 11
of impaired emotional control without sleep Journal of Neuroscience
35 13194ndash13205
Smith R J (1999) Statistics of sexual size dimorphism Journal of Human
Evolution 36 423ndash458
Smith R J amp Jungers W L (1997) Body mass in comparative primatol-
ogy Journal of Human Evolution 32 523ndash559
Stickgold R (2005) Sleep-dependent memory consolidation Nature
437 1272ndash1278
Stickgold R James L amp Hobson J A (2000) Visual discrimination learn-
ing requires sleep after training Nature Neuroscience 3 1237ndash1238
Symonds M R amp Blomberg S P (2014) A primer on phylogenetic gen-
eralised least squares Modern phylogenetic comparative methods and
their application in evolutionary biology (pp 105ndash130) Berlin Heidel-
berg Springer
Tattersall I (1987) Cathemeral activity in primates A definition Folia
Primatologica 49 200ndash202
Uyeda J C amp Harmon L J (2014) A novel Bayesian method for infer-
ring and interpreting the dynamics of adaptive landscapes from phy-
logenetic comparative data Systematic Biology 63 902ndash918
Valli K amp Revonsuo A (2009) The threat simulation theory in light of
recent empirical evidence A review American Journal of Psychology
122 17ndash38
Vining A Q amp Nunn C L (2016) Evolutionary change in physiological
phenotypes along the human lineage Evolution Medicine and Public
Health 2016 312ndash324
Vitousek P (1997) Human Domination of Earth Ecosystems (Vol 277
Pg 494 1997) Science 278 21ndash21
Wagner U Gais S Haider H Verleger R amp Born J (2004) Sleep
inspires insight Nature 427 352ndash355
Worthman C M (2008) After dark The evolutionary ecology of human
sleep Evolutionary Medicine and Health 291ndash313
Wright P C (1999) Lemur traits and Madagascar ecology Coping with
an island environment American Journal of Physical Anthropology
Suppl 29 31ndash72
Yetish G Kaplan H Gurven M Wood B Pontzer H Manger P R
Siegel J M (2015) Natural sleep and its seasonal variations in
three pre-industrial societies Current Biology 25 2862ndash2868
Zepelin H amp Rechtschaffen A (1974) Mammalian sleep longevity and
energy metabolism Brain Behavior and Evolution 10 425ndash470
Zepelin H Siegel J M amp Tobler I (2005) Mammalian sleep 4th ed
In M H Kryger T Roth amp W C Dement (Eds) Principles and Prac-
tice of Sleep Medicine (pp 91ndash100) Philadelphia Saunders
SUPPORTING INFORMATION
Additional Supporting Information may be found online in the sup-
porting information tab for this article
How to cite this article Nunn CL Samson DR Sleep in a com-
parative context Investigating how human sleep differs from
sleep in other primates Am J Phys Anthropol 2018001ndash12
httpsdoiorg101002ajpa23427
12 | NUNN AND SAMSON
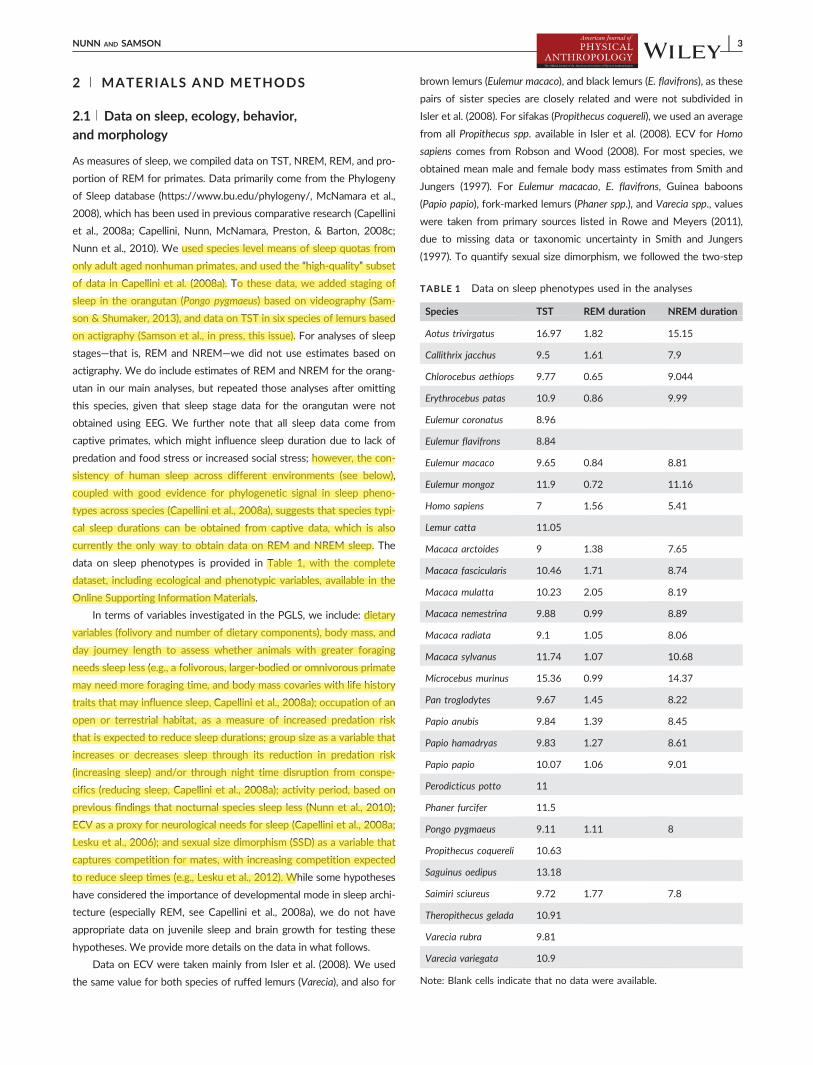
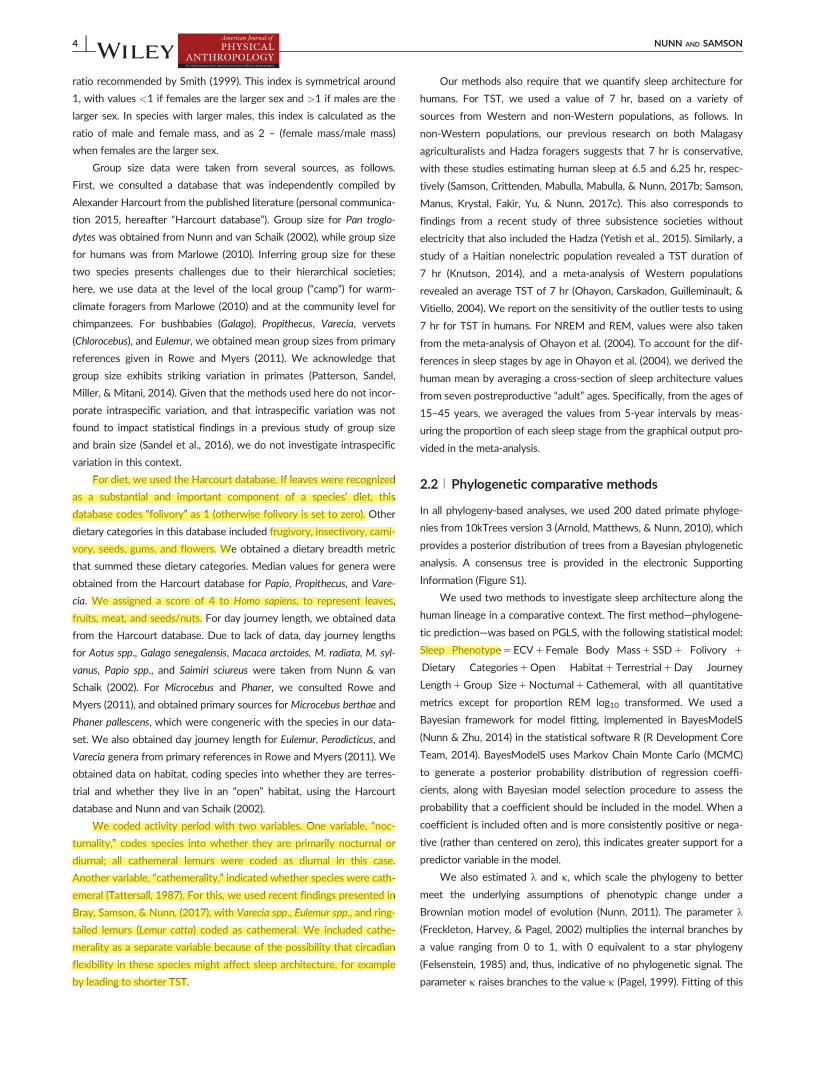
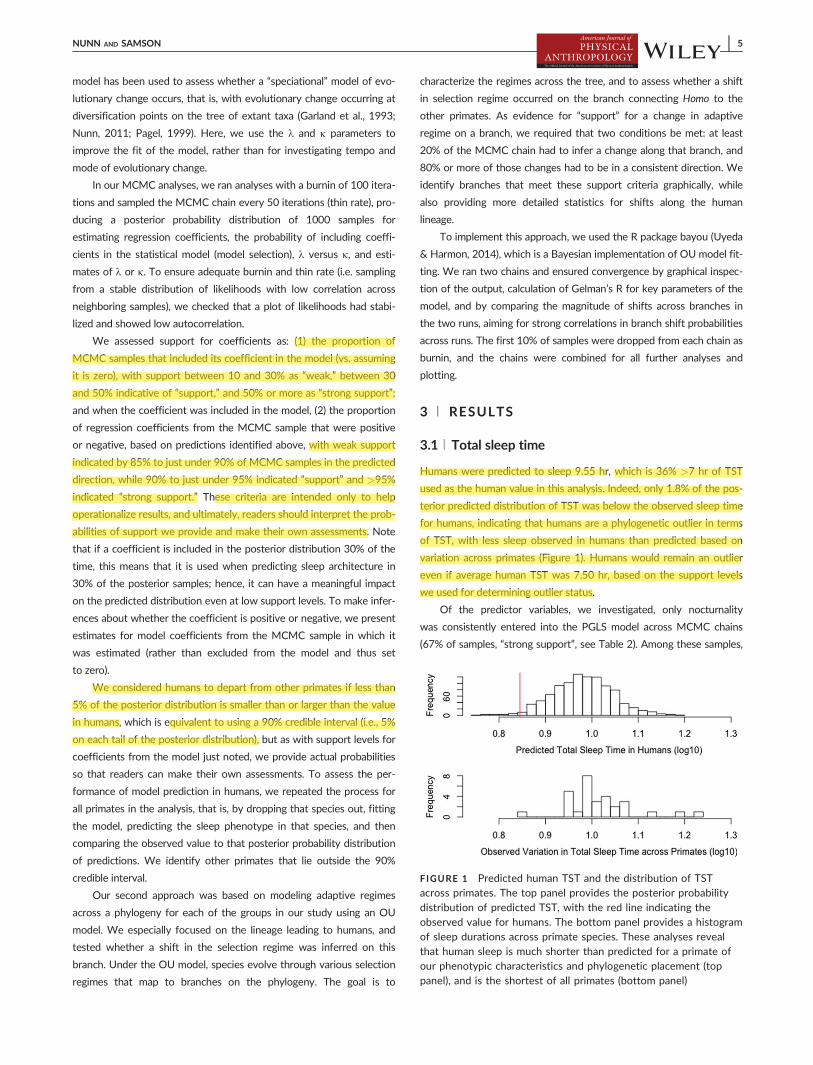
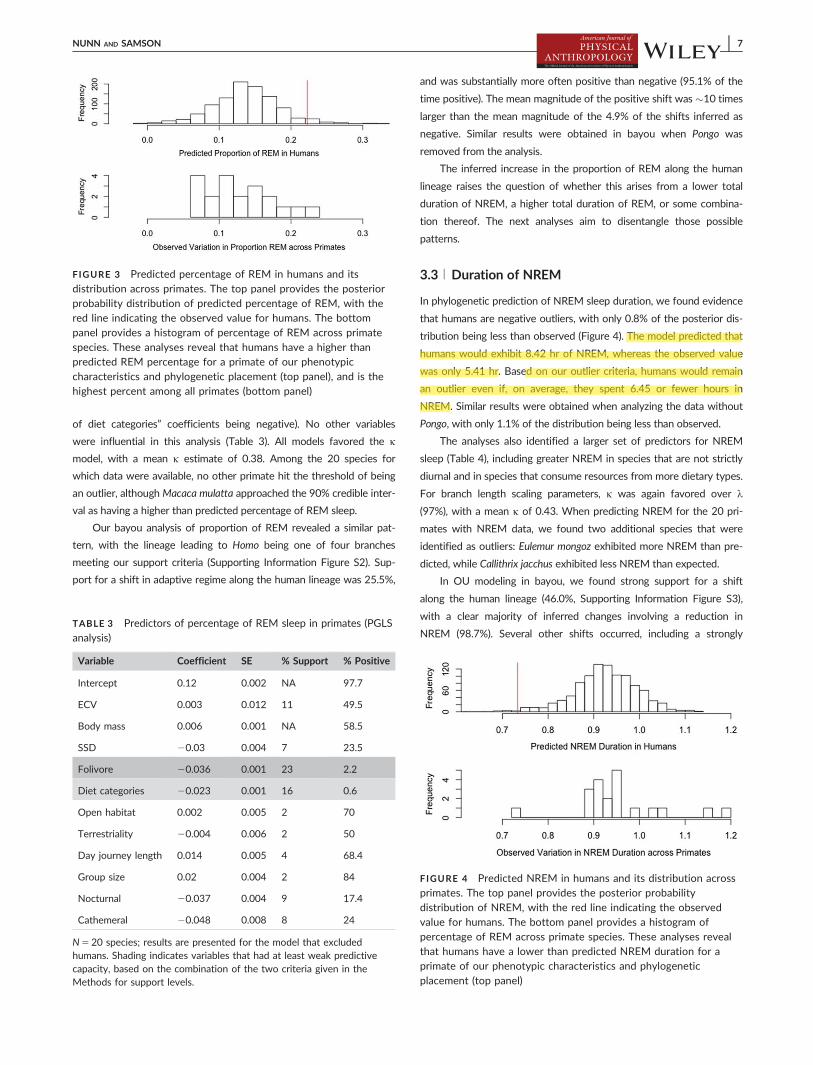
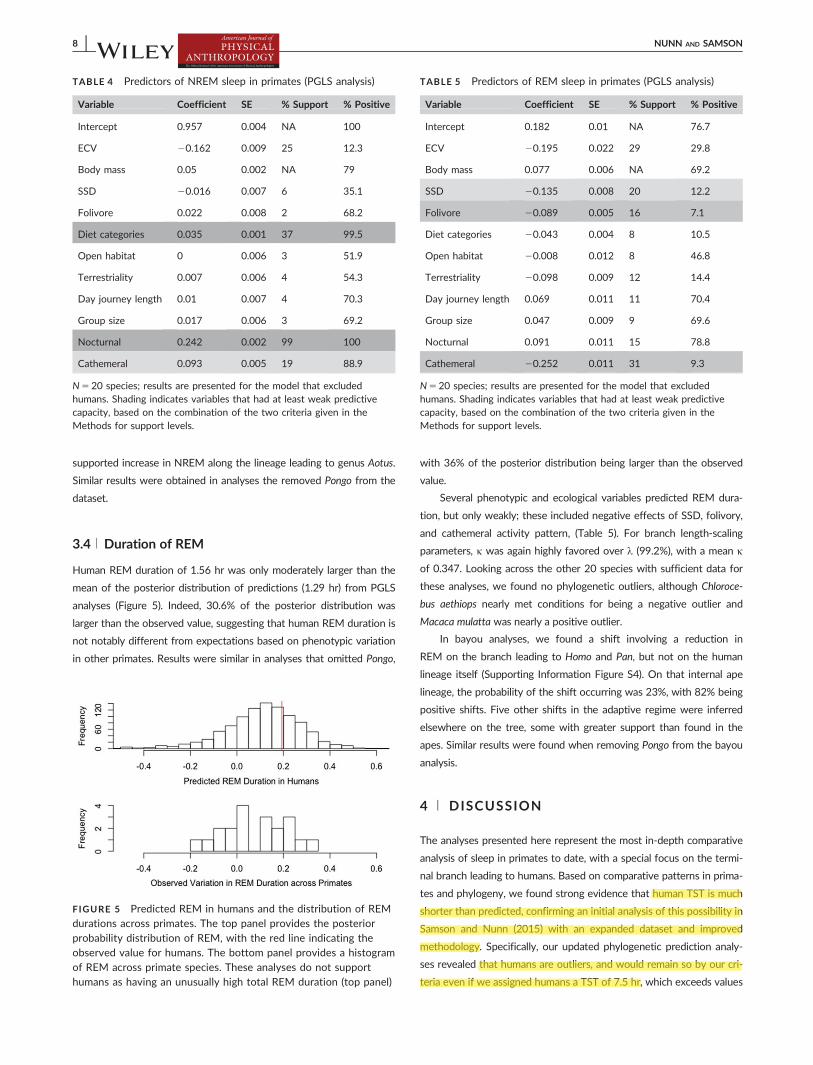
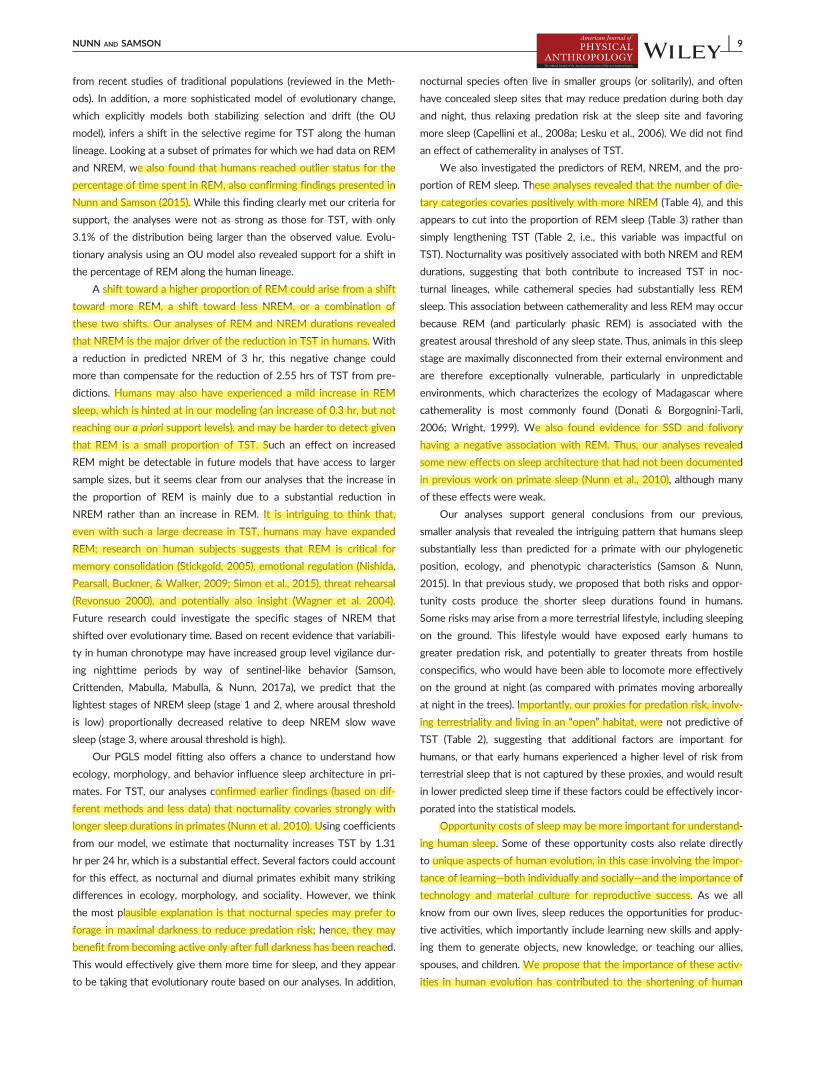
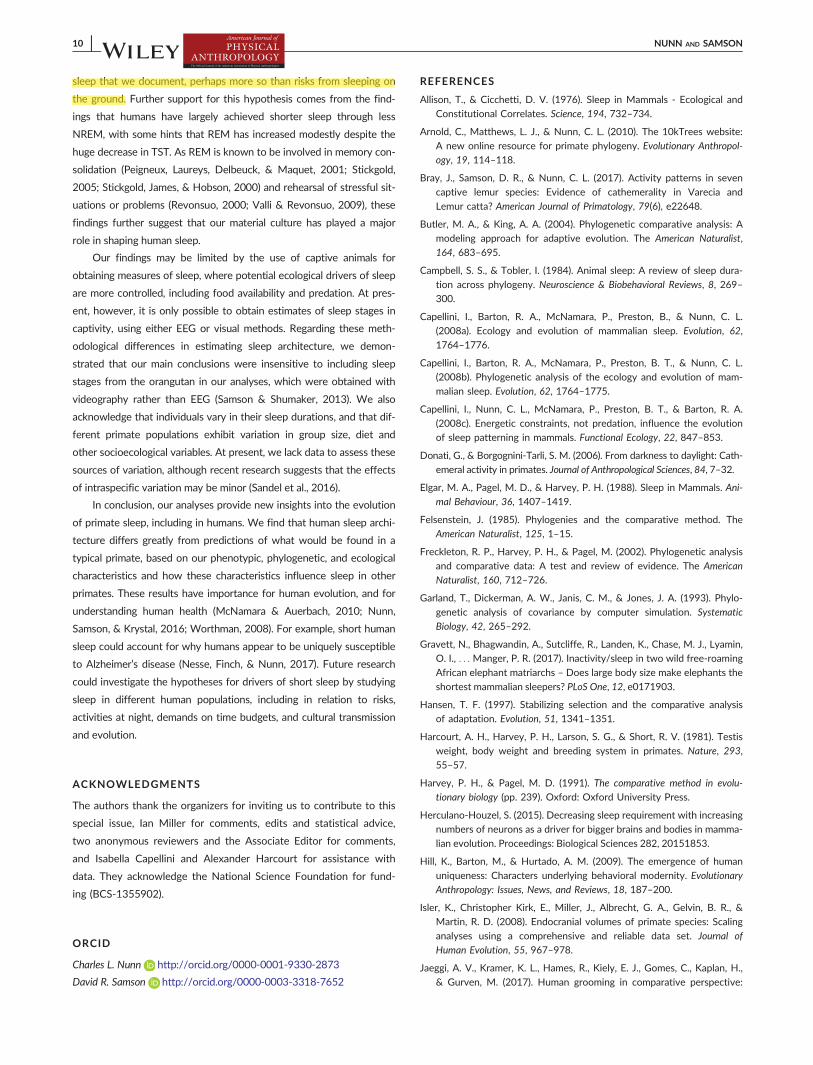
Recommended